dividend announcements, market expectation and corporate ... erik theissen... · dividend...
TRANSCRIPT
Dividend Announcements, Market Expectation and
Corporate Governance
Christian Andres André Betzer
Inga van den Bongard Christian Haesner
Erik Theissen
University of Bonn
Department of Economics – BWL1 Adenauerallee 24-42
53113 Bonn Germany
Tel. +49 228 739205 Fax +49 228 735924 [email protected]
Preliminary version, please do not cite and/or distribute without the authors’ consent
March 2009

Dividend Announcements, Market Expectation and
Corporate Governance
ABSTRACT
This paper examines wealth effects of dividend announcements in Germany, a country with a
corporate governance system different from the US and the UK. Our study improves on
earlier research by using a more advanced econometric technique, I/B/E/S forecasts as proxy
for market expectations and specific hypotheses in the context of the particular Continental
European institutional setting. Our results indicate that abnormal returns are significantly
related to the information content of dividend announcements, with higher announcement
returns in cases in which prior market expectations were less optimistic. In addition,
ownership characteristics and conflicts between controlling and minority shareholders are
shown to have a significant influence on announcement returns.
JEL Classification: G35, G34
Keywords: Dividend Announcements, Market Efficiency, Ownership Structure,
Agency Theory
1
1 Introduction
A large body of empirical research has documented that in imperfect capital markets (with
information asymmetries) the announcement of dividend changes affects shareholder value.1
However, empirical studies have reported mixed results with regard to the question why we
observe a positive correlation between unexpected dividend changes and shareholder value.2
Studies in Anglo-Saxon countries like the US and the UK mainly focus on the cash flow
signaling and the free cash flow hypothesis in order to explain this relationship. The former
hypothesis claims that dividend changes convey new information about a firm’s future
profitability. The latter expects changes in a firm’s stock price due to the governance function
of dividends. The theoretical background of these hypotheses is based on the corporate
governance framework in Anglo-Saxon countries where share ownership is dispersed (e.g.
Faccio and Lang 2002, La Porta et al. 1999) and minority shareholder protection effective
(e.g. La Porta et al. 2000). Franks and Mayer (1995, 2001) describe this as an “outsider
system”.
Our study investigates dividend announcements in Germany, a country whose institutional
setting and capital market environment is substantially different from the US and the UK. As
documented by da Silva et al. (2004), empirical research3 has far neglected the particular role
of dividend signaling in countries other than the US and the UK. In Continental European
countries, such as Germany, we observe a corporate governance system which is
characterized by concentrated share ownership (e.g. Franks and Mayer 2001, Becht and
Boehmer 2001, Faccio and Lang 2002 and Mayer 2008) and weak minority shareholder
protection (e.g. La Porta et al. 2000). Franks and Mayer (1995, 2001) describe this as an
“insider system”. Within such an institutional framework we expect, on the one hand, 1 See, for example, the surveys on payout policy by Allen and Michaely (2003) and Frankfurter et al. (2003). 2 See, for example, Ofer and Siegel (1987), Lang and Litzenberger (1989), Yoon and Starks (1995) and Amihud and Li (2006). 3 Among few exceptions are Gugler and Yurtoglu (2003) for the German market and Gurgul et al. (2003) for the Austrian market.
2
conflicts of interest between owners and managers in widely held firms but additionally, on
the other hand, conflicts of interest between large blockholders and minority shareholders in
firms with concentrated ownership. Against this background Gugler and Yurtoglu (2003)
provide an alternative hypothesis why dividend changes have a signaling function in
Continental European capital markets. Their rent extraction hypothesis argues that large
blockholders often have the discretion and the incentives to extract private benefits of control
as the blockholder bears only a fraction of the costs of these payments (i.e. foregone dividend
payments in proportion of his cash flow rights) but receives the full benefits. Because
dividends are paid out on a pro-rata basis an increase in dividends may signals that the
blockholder abstains from extracting private benefits. Accordingly, dividends can mitigate the
agency problem between large blockholders and minority shareholders. As a consequence, the
announcement of dividend increases (decreases) should have a positive (negative) effect on
stock prices in firms in which the large-small shareholder conflict is severe. One contribution
of this paper to the existent literature is that we discriminate between the cash flow signaling,
the free cash flow and the rent extraction hypothesis (in the explanation of) when explaining
stock price movements after dividend announcements in Germany.
Empirical studies investigating the announcement effect of dividend changes either employ
(in the overwhelming majority of cases) a naive expectation model4, (in some cases) a
conditional expectation model5 or (in few cases) analyst forecasts6 as a proxy for expected
dividends. If we assume markets to be semi-strong efficient in the Fama sense (1970, 1991),
stock price reactions should only occur if we observe dividend changes that deviate from their
expected change. Hence, our study accounts for market expectations of dividend changes by
employing analysts’ forecasts of the Institutional Broker’s Estimate System (I/B/E/S)
4 See, for example, Ahorny and Swary (1980), Bernheim and Wantz (1995), Yoon and Starks (1995), Amihud and Murgia (1997), Gerke et al. (1997), Gugler et al. (2003) and Gurgul et al. (2003). 5 See, for example, Watts (1973), Amihud and Li (2006). 6 See, for example, Woolridge (1983) and Fuller (2003).
3
Summary File.7 Support for the use of I/B/E/S forecasts as proxy for market expectation in
our analysis comes from Womack’s (1996) and Brown et al.’s (2008) studies. Womack
(1996) finds empirical evidence that the information provided by analysts contains valuable
information for market participants. In addition, Brown et al. (2008) document that I/B/E/S
dividend forecasts are an accurate proxy for market expectations in Germany as the dividend
forecast error (calculated as the absolute difference between the actual dividend figure and the
corresponding forecast) is relatively low.8 For this reason, the main contribution of our study
is the use of I/B/E/S forecasts as proxy for the market’s expected dividend.
Furthermore, our paper improves on earlier research investigating the determinants of
abnormal returns after the announcement of unexpected dividend changes by using a more
advanced econometric technique. Previous studies in this context did not account for the
cross-sectional and the time series dimension of the panel data set. We employ random effects
estimation methods and hence account for unobserved firm heterogeneity.
Our results indicate that abnormal returns are significantly related to the information content
of dividend announcements, with higher announcement returns in cases in which prior market
expectations were less optimistic. In addition, ownership characteristics and conflicts between
controlling and minority shareholders are shown to have a significant influence on
announcement returns.
The remainder of the paper is organized as follows. The next section develops the hypotheses
which are relevant in the context of the announcement of dividend changes. Section 3
describes our sample selection procedure and contains a description of our sample. Section 4
7 To the best of our knowledge, Ofer and Siegel (1987) and Lang and Litzenberger (1989) are the only empirical studies which employ I/B/E/S forecasts in the context of unexpected dividend announcements. However, they do not use the I/B/E/S dividend forecasts as proxy for market expectations. They investigate changes in analysts’ earnings forecasts following the announcement of unexpected dividend changes. 8 Among 39 countries included in their analysis, Germany ranks among the ten countries with the lowest dividend forecast error.

4
presents the event study results and a univariate analysis. Section 5 provides the results of our
multivariate panel regressions. Section 6 concludes.
2 Literature review and hypotheses
There is a wide consensus in the literature that dividends can function as signaling and/or
monitoring mechanism.9 In this section, we review the extant literature on the wealth effects
of dividend announcements and derive testable hypotheses in the context of the particular
Continental European/German corporate governance regime.
Market Expectation Hypothesis
Against the background of Fama’s (1970, 1991) efficient market hypothesis dividend change
announcements should only have an impact on stock prices if they are unanticipated by
capital market participants. Nevertheless, the majority of empirical studies use the naive
expectation model as proxy for market expectation which makes the simplifying assumption
that the expected dividend equals the previous dividend paid out.10 Therefore, these studies
expect a dividend change of zero. The root of this simplifying assumption can be found in the
so called reluctance-to-change-dividends hypothesis which was first developed by Lintner
(1956) and was corroborated later by Fama and Babiak (1968). Both seminal papers provide
evidence that firms maintain dividend payouts at previous levels and are hence reluctant to
increase and even more reluctant to reduce dividends. Other empirical studies, such as Watts
(1973), employ a conditional expectation model as proxy for market expectation of dividend
changes. More precisely, these studies estimate the Lintner (1956) or Fama and Babiak’s
(1968) model and use the estimated error terms as proxy for market expectation.
9 See, for example, the excellent survey on dividend policy and corporate governance by da Silva et al. (2004). 10 See, for example, Ahorny and Swary (1980), Bernheim and Wantz (1995), Yoon and Starks (1995), Amihud and Murgia (1997), Gerke et al. (1997). Gugler et al. (2003) employ the naive model in their main analysis but they deal with the issue of (“neglecting”) market expectation by restricting their sample to “…those firms that experienced an earnings drop in the year of the dividend increase announcement relative to the year before the announcement…” (see Gugler et al. 2003, p. 746) as robustness check.

5
To the best of our knowledge, there exist only two studies that incorporate the market’s
expectation of dividend changes by employing analysts’ dividend forecasts. Woolridge (1983)
and Fuller (2003) both investigate stock price reactions to dividend announcements in the US
market and use the Value Line dividend prediction as proxy for expected dividends. Support
for the use of analysts’ forecasts comes from Amihud and Li (2006). They emphasize in their
study on the evolution of the information content of dividend announcements in the US that
“…analyst reports, media coverage (specialized television and radio channels), and the recent
increased use of the Internet…” (see Amihud and Li 2006, p. 638) have increased the
availability of public information. As a consequence, market participants are increasingly
aware of public information with regard to their investments. Moreover, in Germany, the time
horizon for the market to process public information into security prices is relatively long as
dividends are usually paid on an annual basis. Thus, while the use of the previous dividend
payout as proxy for the market’s expectation of current dividend may have been appropriate
in past studies on the dividend surprise effects in Anglo-Saxon countries, it does not account
for the increased availability of public information and the concrete institutional framework in
Germany. We therefore argue in favor of using analyst’s forecasts as proxy for market
expectations in empirical studies on dividend announcements and formulate the following
hypothesis:
H1: We expect a positive (negative) stock price reaction only if the information conveyed by
the dividend change signals good (bad) news for the market participants. Stock price
movements should be unaffected by dividend increases (decreases) if they are not
accompanied by good (bad) news.
As an example, we would expect a positive stock price reaction in cases where companies did
not change their dividend payout but the market would have expected a cut in the dividend
payout. The expected dividend is the I/B/E/S average consensus estimate of all analysts
6
following the respective company in the month preceding the dividend announcement.
Following Campbell et al. (1997), we classify all dividend announcements into three
categories: Announcements which are 5% higher (lower) than the expected dividend are
classified as good (bad) news. If the announced dividend change lies in between the 10%
range around a zero-dividend change the announcement is classified as no news.
Cash Flow Signaling hypothesis
Miller and Modigliani (MM, 1961) were the first scholars who explained the positive
correlation between dividend change announcements and stock price reactions in their
seminal paper by “the informational content of dividends” (MM 1961, p.430). Since then, a
large body of theoretical studies11 has formalized this relationship by assuming various
signaling costs of dividends in order to generate a model (signaling) equilibrium. According
to all these models, a change in the dividend rate can be interpreted as a change in
management’s expectations about the firm’s future profitability. There are mainly two
empirical implications of all cash flow signaling models: (1) The unexpected dividend change
should induce a stock price reaction in the same direction of the dividend change. (2) Analysts
should update their earnings forecast following the announcement of dividend changes. With
regard to the first implication there is an overwhelming majority of papers documenting a
positive relationship between unexpected dividend changes and stock price reactions12 with
few exceptions such as Watts’s (1973) study showing no economically significant effect of
dividend changes on share prices. However, the empirical literature finds mixed evidence
with regard to the second implication as Ofer and Siegel (1987) document an existing
relationship between dividend changes and changes in analysts’ earnings revisions whereas
11 See, for example, the formal models by Bhattacharya (1979), Kalay (1980), John and Williams (1985), Miller and Rock (1985) and Ofer and Thakor (1987). 12 See, among many papers, Pettit (1972), Woolridge (1983) and, more recently, Amihud and Li (2006) for the US market. For the German market, see empirical evidence by Gerke et al. (1997), Amihud and Murgia (1997) and Gugler and Yurtoglu (2003).
7
Lang and Litzenberger’s (1989) study fails to document such a relationship. Given the
substantial support in the literature for the first implication, this corroborates our first
hypothesis outlined in the previous section.
Conveying favorable information to investors via dividend announcements might be of more
importance for smaller than for larger companies because smaller firms are usually not
adequately covered by financial analysts. Therefore, we expect the information asymmetry
between management and market participants to be stronger in small compared to large
companies. Among others, Eddy and Seifert (1988), Yoon and Starks (1995) and Amihud and
Li (2006) confirm this hypothesis employing US data. So far, there exists no study testing the
influence of firm size on abnormal returns after dividend change announcement in the
German market. Hence, we formulate the following hypothesis:
H2: The informational role of dividend announcements is more important in smaller firms.
Hence, the magnitude of the stock price reaction is decreasing in firm size.
Firm size is measured as the logarithm of the firm's total stock value 14 days before the
dividend announcement. As a robustness check, we also employ the number of analysts
covering the firm as proxy for information asymmetry between management and capital
market participants. This variable is usually highly correlated with firm size and its use is in
line with previous studies such as Amihud and Li (2006).
Free cash flow hypothesis
Adjacent to the cash flow signaling hypothesis the finance literature has mainly tested one
other explanation of the market reaction to the announcement of changes in dividends in
Anglo-Saxon countries: Jensen’s (1986) free cash flow hypothesis. He argues that dividend
payments are an effective instrument to prevent managers from investing in negative net
present value projects. In our context, the important empirical implication that emerges from

8
his hypothesis is that firms with poor investment opportunities may reduce agency costs and
hence increase shareholder value by distributing free cash flows to shareholders. Lang and
Litzenberger (1989) were the first who tested the free cash hypothesis against the cash flow
signaling hypothesis in the US market. The intuition of (behind) their approach was that they
expected a larger price impact of dividend changes in overinvesting firms compared to ones
that do not overinvest if the free cash flow hypothesis was the right explanation of the
announcement effect of dividends. In contrast, the cash flow signaling hypothesis expects the
same market reaction regardless of the firm’s investment opportunities. Lang and
Litzenberger (1989) defined overinvesting firms as ones with average Tobin’s Q lower than
one. Their results corroborated the free cash flow hypothesis as firms with Q less than unity
experienced a more pronounced price reaction than firms whose Q exceeded unity. Gugler
and Yurtoglu (2003) confirm Lang and Litzenberger’s (1989) results in the German market as
they find a larger price drop after dividend decreases for firms having poor investment
opportunities compared to other firms.
However, Yoon and Starks (1995) using a larger sample than Lang and Litzenberger (1989)
find evidence against the free cash flow hypothesis in the US market. They argue that the
stronger price appreciation after dividend increases of firms with Q less than unity is due to
the characteristics of these firms. In their descriptive analysis they show for dividend
increases that firms with Q less than unity are smaller, have a higher dividend change and
exhibit a higher dividend yield. After controlling for these characteristics in their multivariate
regressions of the cumulative abnormal returns they do not find a systematic difference in the
magnitude of the market reaction between firms with higher and lower Q than one. This
finding is not consistent with the free cash flow hypothesis. Given the mixed results in the
literature we formulate the following hypothesis:

9
H3: Firms with poor investment opportunities measured by Tobin’s Q experience a larger
price appreciation (drop) after the announcement of a dividend increase (decrease).
Tobin’s Q is measured as the ratio of the book value total assets plus the firm’s market
capitalization (common and preferred equity) minus the book value of equity divided by the
book value of total assets at the end of the previous accounting year.
According to Jensen (1986), the firm’s free cash flow level itself is a proxy for the potential
agency conflict between the firm’s managers and shareholders. Managers in firms with high
free cash flows are tempted to consume perks. Moreover, we expect this conflict to be more
severe in firms which have no valuable growth opportunities measured by Tobin’s Q. To the
best of our knowledge, there is no empirical paper testing the influence of the firm’s free cash
flow level itself on the magnitude of the market reaction after a dividend announcement.
Therefore, we formulate the following hypothesis:
H4: Firms with a high free cash flow level exhibit a stronger stock price reaction after the
announcement of a dividend change.
H4b: Firms with a high free cash flow level that are overinvesting (firms with Tobin’s Q
lower than median) exhibit a stronger stock price reaction after the announcement of a
dividend change than firms that are not overinvesting (firms with Tobin’s Q higher than
median).
We follow Lehn and Poulsen (1989) in the construction of our free cash flow measure. Free
cash flow is defined as operating income plus depreciation, depletion and amortization minus
income taxes plus the change in net deferred taxes minus minority interest on net income
minus interest expense on debt minus common and preferred dividends paid plus extra items
and the gain/loss via the sale of assets in the year before the dividend announcement. The free
cash flows are then divided by the companies’ net sales of the same fiscal year.
10
Rent Extraction Hypothesis
Gugler and Yurtoglu (2003) developed an alternative explanation of why dividend changes
affect shareholder value which suits the particular Continental European/German corporate
governance framework: the rent extraction hypothesis. There are two features of the German
corporate governance system which are relevant in the context of our study: (1) the particular
ownership structure and (2) the degree of minority shareholder protection. The typical capital
market listed German firm exhibits a concentrated ownership structure which is dominated by
a small number of large shareholders (in the following called “blockholder”). Franks and
Mayer (2001) find in their study based on 171 German listed firms in 1990 that “85% of the
largest quoted companies have a single shareholder owning more than 25% of the voting
shares”13. This percentage seems to be stable over time (at least for non-financial companies).
In a study based on all non-financial companies listed on the ‘official’ trading segment of the
Frankfurt stock exchange between 1997 and 2004 (264 companies), Andres (2008) states that
the percentage observed by Franks and Mayer (2001) is strikingly consistent with ownership
patterns 15 years later, “with 84.5% of the firms featuring a shareholder with a stake of more
than 25%.”
Furthermore, La Porta et al. (2000) find empirical evidence that the German corporate
governance system provides only weak protection for minority shareholders. If shareholder
rights are not well protected by law, ownership by large blockholders can be an effective way
of protecting shareholders’ interests. Due to their substantial equity stake, these investors both
have the power and the incentives to monitor management. However, concentrated ownership
can also imply potential drawbacks. Large shareholders can use their control rights in order to
maximize their own utility, which might, through the extraction of private benefits, come at
13 According to the German Stock Corporation Act (AktG), a stake of 25% provides a blocking minority and allows the blockholder to prevent far reaching decisions of the general shareholders’ meeting, like issues of new shares.

11
the expense of other shareholders. In line with these arguments, Bebchuk (1999) shows in a
theoretical model that in corporate governance systems such as Germany, in which private
benefits of control are significant, the ownership structure is characterized by larger
blockholders who extract those private benefits of control.
Against the background of these institutional facts, dividend change announcements may
provide information about the magnitude of the conflict between large blockholders and
minority shareholders. As dividends are paid out on a pro-rata basis both, large blockholders
and small, outside shareholders benefit from dividend distributions to the same extent. Hence,
dividends can not only mitigate the agency conflict between management and outside
shareholders but also the conflict of interest between large blockholders and minority
shareholders. As a consequence, we would expect that in firms which are characterized by a
strong conflict of interest between both types of shareholders dividend change announcements
will induce more pronounced stock price changes. This leads us to formulate the following
hypothesis:
H5: Firms which are characterized by a severe large-small shareholder conflict exhibit a
stronger stock price reaction following a dividend change announcement.
We employ two instruments to order to measure the magnitude of the conflict between large
and small shareholders: (1) information about the firms’ shareholding structure and (2)
information about the types of shares the firms have issued in order to calculate the firms’
cash-flow-right-voting-right-ratio.
Controlling factors
In line with the empirical literature (e.g. Yoon and Starks 1995 and Amihud and Li 2006), we
additionally control for other factors which had a significant influence on shareholder value
following dividend change announcements or are expected to do so: the dividend yield and
12
leverage. Among other authors, Bajaj and Vijh (1990) argued that the stock price reaction
following an unexpected dividend change should be more pronounced in firms with high
dividend yields if the investors in those firms have a preference for stocks with a high yield.
This phenomenon is called “clientele effect”. Fehrs et al. (1988) and Amihud and Li (2006)
corroborate this hypothesis empirically. In the corporate governance literature (e.g. Jensen
1986 and da Silva et al 2004), debt is regarded as a substitutive corporate governance
instrument to dividends. This governance role of debt originates in the fact that interest
payments on outstanding debt are mandatory for the management and hence decrease the
firm’s free cash flow. We expect the market reaction of dividend announcements to be
negatively related to the firm’s leverage.
3. Data and Descriptive Statistics
The sample of our analysis is based on all firms that were included in the DAX, MDAX, or
SDAX14 index as of December 31, 2002 (i.e. the 150 largest exchange-listed German firms).
We cover these companies from 1996-2006 and collect data on all dividend announcements
over this period. As German firms pay (and therefore also announce) dividends on an annual
basis, our sample results in a panel with a theoretical maximum of 1,650 firm-year
observations. For 312 firm-year observations, it was not possible to identify the exact date on
which the dividend was announced (all announcement data was obtained from Reuters
newswires). In line with Amihud and Li (2006) we excluded firms from the financial service
sector (122 firm-year observations). In addition, firm-years in which a firm had a ‘control
agreement’15 in place (7), or years in which firms acted as either acquirer or target in a M&A
transaction (11) were dropped from the sample. The main aim of our study is to measure the
announcement returns of dividend payments as well as identifying the determinants of the 14 The DAX (largest firms), MDAX (mid caps), and SDAX (small caps) are the three major indexes of Deutsche Börse for firms from classic sectors. 15 Control agreements are defined as agreements between a company and its parent company and take the form of either Profit and Loss Agreements (Gewinnabführungsvertrag) or Subordination of Management Agreements (Beherrschungsvertrag).

13
abnormal returns that are due to information conveyed in the dividend announcement.
Therefore, it is crucial to ensure that firms do not release other information on the same date.
As a result, 64 firm-year observations had to be excluded because of the announcement of
other value-relevant information (e.g. restructurings, changes in the board etc.) that could
potentially bias our analysis. At this point, it is important to note that dividend announcements
are frequently accompanied by earnings announcements as dividends are a direct result of
past/future earnings. In our cross-sectional analysis, we control for the effect of
contemporaneous earnings announcements by including adequate control variables (earnings
estimation error, see below). Finally, 31 firm-year observations were excluded due to missing
data items. This procedure results in a sample of 1,103 firm-year observations.
One of the main contributions of our analysis is the use of I/B/E/S forecasts as a proxy for the
market’s expectation. Even though the companies in our sample are among the 150 largest
German firms, analyst coverage for some of the smaller companies is very limited, in
particular during the early years of the sample period.16 As proxy for the market’s
expectation, we compute the arithmetic mean of the last analyst forecasts before the dividend
payment was announced.17 To mitigate the effect of outliers, firms had to be covered by at
least two analysts in any one year. This requirement leads to the exclusion of another 181
firm-year observations with no or less than two analyst forecasts and a final sample of 922
firm-year observations with complete data.
Some of our sample firms (21 firms in 2002) have issued multiple share classes, usually
ordinary shares that carry voting rights along with non-voting preference shares.18 In these
cases, we only included the share class for which analyst forecasts are available in our
16 While estimates of expected sales, EBITDA, EBIT, or EPS are often available, analyst forecasts on dividends are sometimes not provided. 17 In 93% of our observations, the consensus estimate refers to the last month before the dividend payment was announced. In 63 cases (6.8%) we used earlier forecast data (up to three months). Observations were excluded if no analyst forecasts were available for the three months preceding the dividend announcement. 18 The only exception is Siemens AG, where preference shares were endowed with six times the voting rights of ordinary shares (from 1920 till 1998). Voting and cash flow rights of Siemens AG were adjusted accordingly.

14
sample.19 It should be noted that focusing on one of the two share classes should not induce a
bias in our analysis. A closer look at these firms reveals that dividends on ordinary shares
usually change along with dividends on preference shares, a finding that confirms Goergen et
al.’s (2005) observation on German firms during the period from 1984 to 1993. In addition,
we included special dividends in our dividends per share measure. It has been pointed out in
the literature (see e.g. Goergen et al. 2005 and Andres et al. 2009) that special dividends
frequently reflect permanent changes in dividend policy rather than transitory increases.
However, large one-off payments (Sonderausschüttungen) – which are associated with special
anniversaries or the sale of subsidiaries – were excluded. This procedure is also in line with
previous studies on the dividend policy of German firms (Behm and Zimmermann 1993,
Goergen et al. 2005, Andres et al. 2009).
As pointed out earlier, we hypothesize that ownership characteristics are an important
determinant of the announcement returns of dividend changes. We therefore collected data on
ownership structures from Hoppenstedt yearbooks.20 All shareholdings of ordinary shares and
preference shares that are larger than 5% were gathered on an annual basis.21 As German
shareholders frequently use complex control structures (pyramid holdings) we tracked
shareholdings from the first-tier to ultimate control levels using Hoppenstedt yearbooks and
Commerzbank’s wer gehört zu wem? guides. As a typical example of a pyramid holding
structure, figure 1 illustrates the ownership and control structures used by the Röchling family
to control Rheinmetall AG, a producer of automotive components and defense equipment. At
the first tier, Röchling Industrie Verwaltung GmbH, a private company, holds 65.6% of the
ordinary (voting) share capital in Rheinmetall AG as well as 9.2% of the non-voting
19 In cases in which companies have issued multiple share classes, I/B/E/S estimates usually refer to preference shares as only non-voting preference shares are traded publicly. In most of these firms, ordinary (voting) shares are held by a controlling shareholder and not traded on the stock exchange. 20 These books provide in-depth information about all market-listed German companies. 21 During our sample period, shareholdings of more than 5% had to be registered with the German Financial Supervisory Authority (BaFin, see §21 of the German Securities Trading Act (Wertpapierhandelsgesetz). Shareholdings of less than 5% – even when reported in Hoppenstedt – were excluded for reasons of data consistency.

15
preference stock. At the second layer, the Röchling family holds 76.2% of Röchling Industrie
Verwaltung GmbH, with the remainder being held by small shareholders. The Röchling
family thus effectively controls a 65.6% voting stake in Rheinmetall AG, even though only
28.5% of the total equity is provided by the ultimate shareholder. The pyramid structure thus
leads to a large divergence between cash flow rights and voting rights.
We follow the procedure used by da Silva et al. (2004) to identify the ultimate controlling
shareholder. Based on this methodology, the ultimate controlling shareholder is situated at the
first-tier if a) there is no shareholder holding at least 25% of the voting shares22, or b) the
largest shareholder holding more than 25% is a bank, insurance company, the German state, a
foreign company or institution, or a family/individual. In all other cases, the ultimate
controlling shareholder is said to be at a higher tier which is reached if criteria a) or b) are
satisfied. If a widely held firm is reached at a higher layer, the ultimate control lies with this
corporation. As explained in the example above, the cash flow rights of the ultimate
controlling shareholder are computed by multiplying the ownership stakes along the chain
(taking into account ordinary and preference shares).
[Insert Figure 1 about here]
Table 1 presents data on ownership characteristics and summary statistics of the final sample,
subdivided into dividend increases, decreases, and maintained dividends. In line with Amihud
and Li (2006) we treat dividend changes by less than 2.5% as unchanged dividends since
these changes most likely reflect rounding changes.23 In 521 out of the 922 firm-year
observations (56.5%), firms increased their dividends, 316 observations (34.2%) are
22 According to the German Stock Corporation Act (Aktiengesetz), a stake of 25% provides a blocking minority and allows the blockholder to prevent far reaching decisions of the general shareholders’ meeting, like issues of new shares, dismissals of directors, or amendments to the articles of incorporation. 23 Rounding changes are usually due to stock splits or currency conversions from Deutschmarks to Euros. It should be noted that Amihud and Li (2006) use a threshold of 0.5%. However, their sample is based on U.S. firms, which pay dividends on a quarterly basis, leading to small changes. Since German firms pay dividends on a yearly basis, dividend changes are usually comparatively large. Andres et al. (2009) document an average dividend increase (cut) of 36% (30%) for a sample of 220 German firms for the period 1984-2005.

16
associated with maintained dividends, and in only 86 firm-years (9.3%) were dividend
payments reduced.24 Among the dividend cuts, 33 cases (or 38.8% of the dividend cuts) are
dividend omissions. All accounting data items and share price data were obtained from
Thompson Financial’s Datastream database. Data on analyst forecasts are taken from the
Institutional Brokers’ Estimate System (I/B/E/S). As argued above, dividend announcements
should only trigger market reactions if they convey new information. In addition to the
classification of dividend announcements into dividend increases, decreases, and maintained
dividends, we therefore also apply an alternative classification which is based on conditional
expectations. Following Campbell et al. (1997), we define dividend announcements as good
(bad) news if the announcement is more than 5% above (below) the dividend expected by
market participants. We calculate the average of (at least two) analyst forecasts in the month
preceding the dividend announcement to proxy for the market’s expectation. Accordingly, all
announcements that lie in the 10% range around the average analyst forecast are classified as
no news.
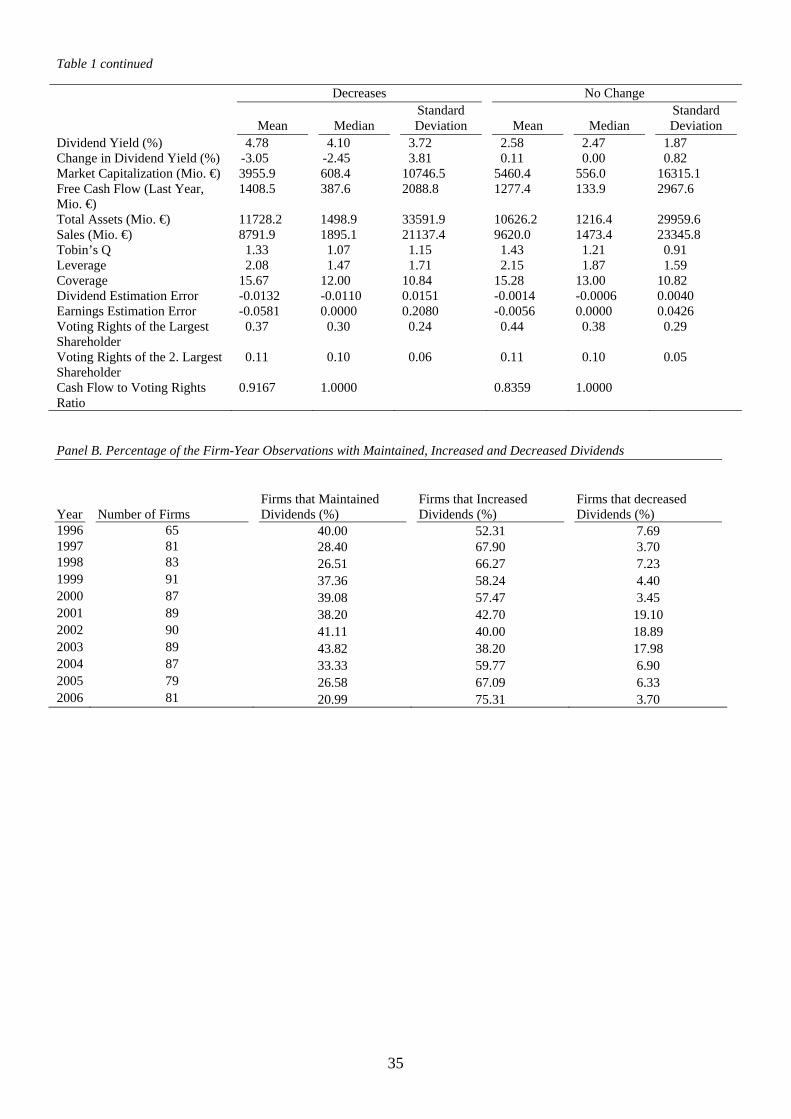
Panel A of Table 1 shows that firms that increase dividends differ substantially from firms
that maintain or decrease dividend payments. With an average coefficient of 1.84,25 they are
less heavily leveraged than firms that decrease (2.08) or maintain (2.15) dividends. In
addition, they exhibit higher values of Tobin’s q26 (1.84 compared to 1.33 for firms that cut
dividends, and 1.43 for firms that maintain dividends) and a much lower average dividend
yield27 (1.90% compared to 4.78% for decreases and 2.58% for maintained dividends),
24 Compared to Gugler and Yurtoglu (2003) we observe a slightly higher number of dividend increases and less dividend decreased. In their sample (from 1992 through 1998) 43.8% of the announcements are classified as dividend increases, 36.8% unchanged dividends, and 19.4% dividend cuts. 25 Leverage is defined as the sum of total current liabilities and long term debt divided by the book value of equity. 26 In line with other empirical corporate finance studies, we use market-to-book as a proxy for Tobin’s q. Tobin’s q is thus defined as market value of equity plus total assets minus book value of equity, divided by the book value of total assets. 27 The dividend yield (DIV_Y) is defined as DIV(i, t-1) / P(i,t), where DIV (i, t-1) is the dividend per share of firm (i) in year t-1, and P(i, t) is the split adjusted share price 14 days before the dividend is announced in year t (this definition follows the procedure suggested in Amihund and Murgia (1997)).

17
suggesting that firms that increase dividends tend to be growth stocks. On the other hand, they
are larger than firms in the other two subgroups, both in terms of total assets and sales. With
respect to corporate control structures, our sample confirms one of the stylized facts of the
German system of corporate governance. On average, about 52% of the voting shares are held
by the two largest shareholders. Furthermore, an average cash flow to voting rights ratio of
0.86 for the controlling shareholder indicates that control structures that violate the one-share-
one-vote principle are commonly used.
The percentage of firm-year observations with increased, decreased, and maintained
dividends over the sample period is documented in Panel B of Table 1. The distribution of
dividend increases, cuts and unchanged dividends suggests that the composition of our sample
is representative of all exchange-listed firms and mirrors the trend observed in other recent
empirical studies (e.g. Julio and Ikenberry 2004). With the exception of 1996/97, the
percentage of firms that increase dividends declines gradually, reaching a low of 38.2% in
2003, until it finally takes a sharp turn upward in 2004. In line with a poor economic
environment following the burst of the technology bubble, the proportion of dividend cutting
firms is significantly higher during the years 2001-2003. In sum, our 11-year sample period
covers an economic boom period, followed by an economic recession, and a second boom
period.
[Insert Table 1 about here]
4 Event Study Results and Univariate Analysis
We measure the stock price reaction to the announcement of dividend payments using
standard event-study methodology. Based on the market model (Brown and Warner 1985),
the abnormal return it for firm i on day t is calculated as
mtiiitit RR ˆˆ , (1)
18
where Rit is the return of firm i on day t, and Rmt the return on the CDAX market portfolio28
on day t. The coefficients ˆi and
i are OLS estimates obtained from regressions of firm i’s
daily returns on the market return over the estimation window from t = -121 till t = - 2
(relative to the announcement day (t = 0)). We use two measures of abnormal returns, the
cumulative average abnormal returns, CAAR-1;1, measured over the three-day interval from t
= -1 till t = +1, and the average abnormal return on the announcement day, AAR0. The
statistical significance of these returns is measured by the standardized cross-sectional t-
statistic proposed by Boehmer et al. (1991) and the non-parametric Corrado (1989) test
statistic.
Table 2 reports the event study results. In Panel A, all announcements are classified into three
groups, increases, decreases and unchanged dividends. These groups are then subdivided into
good news, bad news, and no news, based on the information content of the dividend
announcements (as defined above). The results in Panel A show that the average abnormal
return on the announcement day, AAR0, is highly significant for dividend increases (0.81%)
and decreases (-1.07%), but insignificant in cases of unchanged dividends (0.17%). Over the
three-day interval around the announcement, dividend increases lead to an average CAAR-1;1
of 1.44%, also highly significant. The cumulative average abnormal return is negative (-
0.47%), but insignificant for dividend cuts. Surprisingly, unchanged dividends are associated
with a positive and significant three-day CAAR of 0.64%. A closer look at the three
subcategories reveals that the positive announcement return for unchanged dividends is driven
by a highly significant return of 2.61% for announcements in which a maintained dividend is
a positive surprise for market participants. It thus seems that market expectations play an
important role in measuring dividend announcement returns.
[Insert Table 2 about here]
28 The CDAX is a broad, value-weighted German index and comprises about 350 companies.
19
This finding is confirmed by the results in Panel B of Table 2, where all announcements are
categorized as good news, bad news, or no news. Abnormal returns are highest for dividend
announcements that are good news for market participants, with an average announcement
day return of 1.12% and a three-day CAAR of 2.02% (both highly significant). Comparing
the number of announcements in the three groups to the classification into increases,
decreases, and no change, it becomes obvious that an increase in dividends does not
necessarily imply good news for market participants. Out of 521 dividend increases, less than
50% (258) are in fact positive announcements. If market participants expected an even higher
increase (i.e. if the announcement is classified as bad news despite the increase), we observe
an announcement day return of -0.28% and a CAAR of -0.16%. In line with these results,
unchanged dividends are associated with highly significant and positive returns on the
announcement day (0.73%), and a three-day CAAR of 2.61% if market participants expected
a dividend cut.
In conclusion, these results indicate that market participants tend to incorporate publicly
available information into stock prices before firms officially announce dividend payments.
This also implies that ‘naïve’ dividend announcement models (which assume that the
expected dividend equals the previous dividend) are misspecified. Treating all dividend
changes as surprises does not account for the ability of market participants to incorporate
information in stock prices when it first becomes available.
As discussed in the hypothesis section, we expect that conflicts between large and small
shareholders potentially have an impact on dividend policy and on announcement returns. We
classify firms as being either widely held or closely held based on shareholdings of voting
equity. If a firm does not have a single shareholder holding more than 25% of the voting
equity, it is classified as widely held. If a controlling shareholder holds more than 25% of the
voting shares, the firm is said to be closely held. Based on this definition, about one-third
20
(317) of the firm-year observations in our sample are classified as widely held. The
proportion of widely held and closely held firms is roughly similar among the three subgroups
dividend increases, decreases, and no change. Table 3 shows several firm characteristics of
our sample, subdivided into the two ownership groups, as well as test statistics that test for
differences in means and medians. Widely held firms seem to be significantly larger, less
heavily leveraged, and show lower values of Tobin’s q. With a mean CAAR-1;1 of 1.14%,
abnormal returns are higher for closely held firms (compared to 0.71% for widely held firms),
yet not significantly. The differences between widely held and closely held firms are again
similar among the different subgroups (not reported).
[Insert Table 3 about here]
5 Multivariate Analysis
The results of the event study show a significant reaction of stock prices to dividend
announcements of German firms. A closer analysis of the abnormal returns has revealed that
the magnitude of the price reaction seems to be influenced by prior investor expectations.
However, the univariate analysis above does not control for interdependencies between other
firm characteristics. Most notably, information asymmetries should be higher for smaller
firms (Petersen and Rajan 1992). We therefore also employ a multivariate regression
framework to test whether market expectations, proxied by I/B/E/S analyst forecasts, are a
significant determinant of announcement returns. In the following random-effects panel
model (based on all announcements), we use the three-day announcement return, CAAR-1;1,
as the dependent variable. In the set of explanatory variables, we include the dividend
estimation error (DIV_ERR), defined as dividend per share minus the estimated dividend per
share (last I/B/E/S consensus estimate prior to the announcement), both divided by the split
adjusted stock price 14 days before the dividend is announced, and the change in dividend
yield (DIV_CHGN, defined as current minus last year’s dividend per share standardized by

21
the split adjusted stock price 14 days before the dividend is announced). A significant
coefficient of DIV_CHGN would lend support to the naïve view of dividend changes as it
indicated that the total change, not just the unexpected part, is informative. As additional
control variables, we add the earnings estimation error (EPS_ERR, defined similar to the
dividend estimation error using the average earnings-per-share I/B/E/S estimate29), dividend
yield (DIV_Y, as defined above), a control for firm size (MC, natural logarithm of market
capitalization), a dummy that is equal to one if the firms Tobin’s q is below unity (TQ1), as
well as industry and year dummies for each of the 16 sample industries and each year of the
sample period. We obtain the following results (t-statistics are based on robust variance
estimates):
CAAR = 0.028 + 0.992 DIV_ERR + 0.14 DIV_CHGN + 0.002 EPS_ERR + 0.22 DIV_Y
(t =) (0.88) (4.49)*** (1.28) (0.13) (2.07)**
– 0.002 MC – 0.007 TQ1 (2)
(t=) (-2.08)** (-1.15)
N = 922 R2 (adj.) = 10.6%
The results confirm that market expectations have a significant influence on abnormal
announcement returns. The coefficient of the dividend error variable is positive and highly
significant while the coefficient of the change in dividend yield is insignificant. This means
that a higher (lower) divergence between I/B/E/S consensus estimates and the actual dividend
is associated with a higher (lower) announcement return and lends support to our first
hypothesis. In line with previous studies (e.g. Amihud and Li 2006), the magnitude of the
announcement returns is negatively related to firm size and positively related to the dividend
yield. As pointed out above, our findings indicate that empirical studies that classify dividend
announcements based on the direction of dividend changes (i.e. increases vs. decreases) are
29 The earnings estimation error is set to zero if dividends and earnings are not announced on the same day.
22
misspecified. Since only the unexpected component of dividend announcements seems to
matter for price changes, it might be more plausible to classify announcements based on their
news content. We therefore test our hypotheses for the classification into good news and bad
news and compare these results to the ‘classical’ subsamples dividend increases and dividend
decreases.
In analyzing the determinants of dividend announcement returns, we use several random-
effects panel regressions.30 In all model specifications, the three-day announcement return is
used as the dependent variable. As independent variables, we include the magnitude of the
dividend change (DIV_CHGN, as defined above), control variables for the market’s
expectations, DIV_ERR and EPS_ERR, as well as the other controls used in regression (2).
To test our hypotheses 3 and 4 concerning the free cash flow signaling hypothesis, our first
specification further includes lagged free cash flow (as defined above), and a variable that
interacts free cash flow with the Tobin’s q dummy. The interaction term is supposed to
measure the influence of free cash flows on announcement returns in firms that are most
susceptible to the problem of overinvestment since they have only very few investment
opportunities. Lastly, we include firm leverage, defined as total (short and long term) debt
divided by the book value of equity.
[Insert Table 4 about here]
The results in Table 4 using all 922 announcements confirm our previous findings. In model
specification (1), the coefficient of the dividend estimation error is highly significant and
positive. In addition, the dividend yield has a significantly positive and firm size a
significantly negative impact on announcement returns. The effect of DIV_CHGN (the
magnitude of the dividend change) is insignificant. If we compare these results to
30 The Hausman test does not reject the null hypothesis of zero correlation between the vector of explanatory variables and the error term. Therefore, the more efficient random-effects estimator is used in all regressions.
23
specification (2), where a naïve model is tested, it is striking that the coefficient becomes
highly significant. This finding again implies that dividend announcement models that do not
control for market expectations are misspecified as they omit an important variable. In this
specification, it seems as if the magnitude of the dividend change is informative. However, it
only captures part of the omitted variable (i.e. prior market expectations). With respect to the
free cash flow hypothesis, all coefficients are insignificant in both model specifications. This
finding stands in contrast to Lang and Litzenberger (1989) who document positive abnormal
returns for overinvesting firms, but confirms Gugler and Yurtoglu’s (2003) results on
dividend increases for a sample of German firms.
In the next step, we analyze announcements that are categorized as good (bad) news and
increases (decreases) separately. As prior market expectations have been shown to be an
important determinant of announcement returns, we also include control variables for the
dividend and earnings estimation error in all regressions. To test the rent extraction
hypothesis, we use (in addition to the controls defined above) several independent variables
that are based on the firms’ ownership characteristics. The voting rights of the largest
shareholder (VR1) are included if they exceed a threshold of 5%. In the presence of a
controlling shareholder, an (unexpectedly large) increase in dividends should be regarded as a
strong signal since it reduces the amount of cash under the control of the dominant
shareholder and therefore reduces the likelihood of minority shareholder expropriation.
Consequently, a positive coefficient of VR1 is expected for good news, or increases
respectively. For bad news, or dividend decreases, we expect a negative coefficient. We also
include the squared term of VR1 to control for a non-linear relationship. On the other hand,
the risk of expropriation should be lower in firms with another large shareholder who has the
power and the incentive to control the dominant shareholder. As suggested in Gugler and
Yurtoglu (2003), we add a control variable that measures the voting rights of the second
largest shareholder if there is a second shareholder who holds more than 5%. Lastly, the

24
difference between the cash flow rights and the voting rights of the controlling shareholder is
captured by the variable CRVR. Since dividends are paid on a pro-rata basis, a large
divergence of cash flow rights and voting rights for the controlling shareholder (i.e. a low
CRVR ratio31) increases the incentives to extract funds through other channels than dividends.
Hence, we expect a negative relationship between announcement returns and the ratio of cash
flow rights to voting rights for good news (increases).
Table 5 contains the results of these model specifications. For good news and dividend
increases we find a non-linear relationship between the voting rights of the largest shareholder
and dividend announcement returns. For bad news and dividend decreases, no such effect can
be observed. In addition, the presence of a second largest shareholder does not seem to have
an influence on dividend announcement returns. With respect to the ratio of cash flow rights
to voting rights we find negative and significant coefficients for the subsamples good news
and increases. This implies that the market reaction is stronger in cases in which the
controlling shareholder is willing to increase (pro rata) dividend payments despite strong
incentives to expropriate minority shareholders and supports our fifth hypothesis. In both
subsamples, good news and increases, the coefficient of the variable DIV_CHGN_P, which
measures the magnitude of the dividend change, is insignificant. This confirms our previous
finding that the ‘absolute’ change of the dividend yield does not have explanatory power if
the regression controls for prior market expectations. In the good news and increases
subsamples, all other explanatory variables show the signs and significance levels of the
previous model specifications. Surprisingly, none of the control variables is significant in the
bad news and decrease subsamples. It should be noted, though, that the number of
observations is much smaller in these subsamples, in particular in the subsample of dividend
decreases.
31 The ratio of cash flow right to voting rights is set to 0 if there is no shareholder controlling (at least) 25% of the voting shares.
25
[Insert Table 5 about here]
In additional model specifications, we interact the VR1 variable with the dividend estimation
error in order to test whether the reaction is stronger for firms with a dominant shareholder if
the unanticipated part of the dividend change is higher.32 The coefficient of the interaction
term is positive and highly significant in the subsamples good news and increases, indicating
that the “unanticipated bang-for-the-buck”33 is higher for firms with supposedly entrenched
and powerful large shareholders.
In sum, the results of our multivariate analysis confirm that the stock price reaction to the
announcement of dividend payments is significantly related to the information content of the
announcement. The larger the divergence between the market’s expectations (proxied by
I/B/E/S consensus estimates) and the actual dividend, the higher are abnormal announcement
returns. This confirms our first hypothesis. We also find support for the hypothesis that the
magnitude of the stock price reaction decreases with firm size (hypothesis two). Our tests of
the cash flow signaling hypothesis do not show any significant pattern. Finally, our results
indicate that the conflict between large (controlling) and minority shareholders has an
influence on announcement returns. The stock price reaction is significantly higher if a) firms
have a controlling shareholder who holds very high ownership stakes and might therefore be
entrenched, or b) if incentives to expropriate minority shareholders are high due to deviations
from the one-share-one-vote principle.
32 These regression models are not reported but available upon request. 33 Bernheim and Wantz (1995) introduced the term “bang for the buck”, standing for the share price response per dollar of dividend (change).
26
6 Conclusion
So far, empirical research which has investigated the informational content of dividend
announcements mainly relied upon the assumption that the last year dividend is the best proxy
for the next year dividend. As most of the previous studies on dividend announcements were
conducted in the 80s and the beginning of the 90s, this assumption seems to be valid as the
information efficiency in capital markets has only substantially increased during the last
decade. It is an open question whether today’s markets are more efficient than in the past.
Strong support for the view that today’s markets have become more efficient comes from
Amihud and Li (2006) who emphasize in their study on the evolution of the information
content of dividend announcements in the US that “…analyst reports, media coverage
(specialized television and radio channels), and the recent increased use of the Internet…”
(see Amihud and Li 2006, p. 638) have increased the availability of public information.
This paper employs I/B/E/S analyst forecasts of dividends as market expectation for future
dividends in order to account for the recent development. Analysts work at the nexus of
private and public information and hence incorporate historical data and other firm specific
information in predicting future performance.
The main finding of our paper is that neglecting analysts’ market expectation in measuring
dividend announcement returns in efficient capital markets leads to biased results. Therefore,
future studies on dividend announcements should include analyst forecasts when computing
expected returns.
We investigate 921 dividend announcements from 1996-2006 in Germany, a country with a
corporate governance system different from the US and the UK. In addition, the time horizon
for the market to process public information into security prices is relatively long in Germany
as dividends are usually paid on an annual basis. Our results show that the market reacts

27
statistically and economically significant at the announcement of unexpected dividend
changes. Even for unchanged dividend announcements which constitute good news for the
market we observe positive and significant CARs.
Employing several random-effects panel regressions we further find that the larger the
conflict between large and small shareholders in Germany, the higher is the market reaction
due to unexpected dividend changes.

28
Literature
Aharony, J. and Swary, I., “Quarterly Dividend and Earnings Announcements and
Stockholders’ Return: An Empirical Analysis”, The Journal of Finance, Vol. 35, No. 1, 1980,
pp. 1 – 12
Allen, F. and Michaely, R. “Payout Policy” In: Constantinides, G., Harris, M., Stulz, R.
(Eds.), Handbook of the Economics of Finance, 2003, North-Holland, Amsterdam
Amihud, Y. and Li, K., “The Declining Information Content of Dividend Announcements and
the Effects of Institutional Holdings”, The Journal of Financial and Quantitative Analysis,
Vol. 41, No. 3, 2006, pp. 637 – 660
Amihud, Y. and Murgia, M., “Dividends, Taxes, and Signaling: Evidence from Germany”,
The Journal of Finance, Vol. 52, No. 1, 1997, pp. 397 – 408
Andres, C., “Large Shareholders and Firm Performance: An Empirical Examination of
Founding-Family Ownership”, The Journal of Corporate Finance, Vol. 14, 2008, pp. 431 –
445
Andres, C., Betzer, A., Goergen, M. and Renneboog, L., “Dividend policy of German firms:
A panel data analysis of partial adjustment models”, The Journal of Empirical Finance, Vol.
16, No. 2, 2009, pp. 175-187
Bebchuk, L., “A Rent-Protection Theory of Corporate Ownership and Control”, NBER WP
7203, 1999
Becht, M. and Boehmer, E. “Ownership and voting power in Germany” The Control of
Corporate Europe, Oxford University Press, 2001, pp. 128 – 53
Behm, U. and Zimmermann, H., “The Empirical Relationship Between Dividends and
Earnings in Germany”, Zeitschrift für Wirtschafts- und Sozialwissenschaften, Vol. 133, 1993,
pp. 225 – 254
Bernheim, B.D. and Wantz, A., “A Tax-Based Test of the Dividend Signaling Hypothesis”,
American Economic Review, Vol. 85, 1995, pp. 532 – 551
Bhattacharya, S., “Imperfect Information, Dividend Policy, and the ‘Bird in the Hand’
Fallacy”, Bell Journal of Economics, Vol. 10, 1979, pp. 259 – 270
29
Boehmer, E., Musumeci, J. and Poulsen, A., “Event-Study Methodology under Conditions of
Event-Induced Variance”, The Journal of Financial Economics, Vol. 30, 1991, pp. 253 – 272
Brown, P., How, J.C.Y, and Verhoeven, P., “The Accuracy of Analysts’ Dividend Forecasts
around the World”, The Pacific-Basin Finance Journal, Vol. 16, 2008, pp. 411 – 435
Brow, S.J. and Warner, J.B., “Using Daily Stock Returns: The Case of Event Studies”, The
Journal of Financial Economics, Vol. 14, 1985, pp. 3 – 31
Campbell, J.Y., Lo, A.W. and MacKinley, A.C., “The Econometrics of Financial Markets”
Princeton University Press, New Jersey, 1997
Corrado, C.J., “A Nonparametric Test for Abnormal Security-Price Performance in Event
Studies”, The Journal of Financial Economics, Vol. 23, 1989, pp. 385 – 395
Eddy, A. and Seifert, B., “Firm Size and Dividend Announcements”, The Journal of
Financial Research, Vol. 11, 1988, pp. 295 – 302
Faccio, M. and Lang, L.H.P. “The ultimate ownership of western European corporations” The
Journal of Financial Economics, Vol. 65, No. 3, 2002, pp. 365-395
Fama, E., “Efficient Capital Markets: A Review of Theory and Empirical Work”, The Journal
of Finance, 1970, pp. 383 – 420
Fama, E., “Efficient Capital Markets II”, The Journal of Finance, Vol. 46, 1991, pp. 1575 –
1617
Fama, E., Babiak, H., “Dividend Policy: An Empirical Analysis”, The Journal of the
American Statistical Association, Vol. 63, 1968, pp. 1132 – 1161
Fehrs, D., Benesh, G. and Peterson, D., “Evidence of a Relation between Stock Price
Reactions around Cash Dividend Changes and Yields”, The Journal of Financial Research,
Vol. 11, 1988, pp. 111 – 123
Frankfurter, G.M., Wood, B.G. and Wansley, J., “Dividend Policy, Theory and Practice”, 1st
Edition, Academic Press, Elsevier Science, San Diego u.a.
Franks, J. and Mayer, C. “Ownership and control of German corporations” Review of
Financial Studies, Vol. 14, 2001, pp. 943-77
30
Franks, J. and Mayer, C. “Ownership and control” In: H.Sibert (Ed.), Trends in Business
Organisation: Do Participation and Cooperation Increase Competitiveness?, Tübingen:
Mohr, 1995, pp. 171 – 95
Fuller, K., “The Impact of informed trading on Dividend Signaling: A Theoretical and
Empirical Examination”, The Journal of Corporate Finance, Vol. 9, 2003, pp. 386 – 407
Gerke, W., Oerke, M. and Sentner, A., “Der Informationsgehalt von Dividendenänderungen
auf dem deutschen Aktienmarkt“, Die Betriebswirtschaft, No. 57, 1997, pp. 810 – 822
Goergen, M., Renneboog, L. and da Silva, L.C., “When do German firms Change their
Dividends?”, The Journal of Corporate Finance, Vol. 11, 2005, pp. 375 – 399
Gugler, K. and Yurtoglu, B.B., “Corporate governance and Dividend pay-out policy in
Germany”, European Economic Review, Vol. 47, 2003, pp. 731 – 758
Gurgul, H., Mestel, R. and Schleicher, C., “Stock Market Reactions to Dividend
Announcements: Empirical Evidence from the Austrian Stock Market”, Financial Markets
and Portfolio Management, Vol. 17, 2003, pp. 332 – 350
Jensen, M., “Agency Costs of Free Cash Flow, Corporate Finance, and the Market for
Takeovers”, American Economic Review, Vol. 76, 1986 , pp. 323 – 329
John, K. and Williamson, J., “Dividends, Dilution and Taxes: A Signaling Equilibrium”, The
Journal of Finance, Vol. 40, 1985, pp. 1053 – 1070
Julio, B. and Ikenberry, D.L., “Reappearing Dividends”, The Journal of Applied Corporate
Finance”, Vol. 16, No.4, 2004, pp. 89 – 100
Kalay, A., “Signaling, Information Content, and the Reluctance to Cut Dividends”, The
Journal of Financial and Quantitative Analysis, Vol. 15, 1980, pp. 855 – 869
La Porta, R., Lopez de Silanes, F. and Schleifer, A. “Corporate ownership around the World”,
The Journal of Finance, Vol. 54, No. 2, 1999, pp. 471-517
La Porta, R., Lopez de Silanes, F., Schleifer, A. and Vishny, R., “Investor protection and
corporate governance“ The Journal of Financial Economics, Vol. 58, 2000, pp. 3-29
Lang, L.H.P. and Litzenberger, R.H., “Dividend Announcements”, The Journal of Financial
Economics, Vol. 24, 1989, pp. 181 – 191

31
Lehn, K. and Poulsen, A., “Free Cash Flow and Stockholder Gains in Going Private
Transactions”, The Journal of Finance, Vol. 44, 1989, pp. 771 – 789
Lintner, J., “Distribution of Incomes of Corporations Among Dividends, Retained Earnings,
and Taxes”, The American Economic Review, Vol. 46, 1956, pp. 97 – 113
Mayer, C., “Trust in Financial Markets”, European Financial Management, Vol. 14, No. 4,
2008, pp. 617 – 632
Miller, M. and Modigliani, F., “Dividend Policy, growth and the valuation of Shares”, The
Journal of Business, Vol. 34, 1961, pp. 411 – 433
Miller, M. and Rock, K., “Dividend Policy under Asymmetric Information”, The Journal of
Finance, Vol. 40, 1985, pp. 1031 – 1051
Ofer, A. and Siegel, R. “Corporate Financial Policy, Information, and Market Expectations:
An Empirical Investigation of Dividends”, The Journal of Finance, Vol. 42, No. 4, 1987, pp.
889 – 911
Offer, A. and Thakor, A., “A Theory of Stock Price Responses to Alternative Corporate Cash
Disbursement methods: Stock Repurchases and Dividends, The Journal of Finance, Vol. 42,
1987, pp. 365 – 394
Petersen, M. A. and Rajan, R. G., “The benefits of firm-creditor relationships: evidence from
small business data”, University of Chicago Working Paper #362, 1992
Pettit, R.R., “Dividend Announcements, Security Performance, and Capital Market
Efficiency”, The Journal of Finance, Vol. 27, No. 5, 1972, pp. 993 – 1007
da Silva, L. C., Goergen, M. and Renneboog, L. “Dividend Policy and Corporate
Governance” Oxford University Press , 2004
Watts, R., “The Information Content of Dividends”, The Journal of Business, Vol. 46, No. 2,
1973, pp. 1991 – 211
Womack, K.L., “Do Brokerage Analysts’ Recommendations Have Investment Value?”, The
Journal of Finance, Vol. 51, No. 1, 1996, pp. 137 – 167
Woolridge, J.R., “Dividend Changes and Security Prices”, The Journal of Finance, Vol. 38,
No. 5, 1983, pp. 1607 – 1615

32
Yoon, P.S. and Starks, L.T., “Signaling, investment opportunities, and dividend
announcements”, Review of Financial Studies, Vol. 8, 1995, pp. 995 – 1018

33
Figure 1
The Ownership Structure of Rheinmetall AG
Figure 1 illustrates the control of Rheinmetall AG by pyramiding and different share classes in 1999. In case that the company issued different share classes, “CS” denotes common stock and “PS” preferred stock. At the first-tier of the pyramid, Rheinmetall AG is controlled by Röchling Industrie Verwaltung GmbH, the company’s majority stockholder, which owns 65.6% of the voting shares. This company, in turn, has one blockholder, the Röchling family, who owns 76.2% and thus is the ultimate controlling shareholder. The cash flow rights of the Röchling family in Rheinmetall - defined as the product of its shareholdings along the pyramid - are 28.46%, whereas its voting rights are 65.6%. Hence these control-enhancing mechanisms induce the wedge between cash flow and voting rights and thereby violate the one-share-one-vote principle.
Data source: Hoppenstedt Aktienführer 2000, Verlag Hoppenstedt GmbH, Darmstadt 1999; Commerzbank – wer gehört zu wem, 20. und erweiterte Auflage 2000
Röchling family
34.4% CS; 90.8% PS
Rheinmetall AG
Röchling Industrie Verwaltung GmbH
65.6% CS; 9.2% PS
Free Float
23.8% 76.2%
Free Float

34
Table 1
Summary Statistics Table 1 provides descriptive data for all sample firms. The sample consists of a total of 922 announcements for the 150 largest companies (DAX, MDAX and SDAX) listed on the Frankfurt Stock Exchange on December, 31 2002 for the eleven year period 1996 to 2006. Dividend yield is calculated as DIV(i,y-1)/P(i,y) and market capitalization measures the firm’s total stock value 14 days before the announcement. The change in dividend yield is defined as the change in dividends as a percent of price (P(i,y)) 14 days before the dividend announcement, (DIV(i,y)-DIV(i,y-1)/P(i,y), where DIV(i,y) is the total (adjusted) dividend per share for stock (i) announced for year (y) and DIV(i,y-1) is the total (adjusted) dividend per share for stock (i) announced for the preceding year (y-1 Free cash flow, FCF(i,y-1), is measured as EBIT plus depreciation minus income taxes plus change in net deferred taxes to last year minus minority interest minus interest minus dividends plus extra items and gain/loss sale of assets, all divided by sales (i,y-1). Tobin’s q is defined as the market value of the firm’s equity plus total assets minus book value of equity, all divided by total assets. The firm’s leverage is defined as the sum of total current liabilities and long term debt divided by book value of equity and coverage comprises the number of I/B/E/S analysts. The earnings estimation error is measured as (EPS(i,y)-ESTEPS(i,y)/P(i,y), where EPS(i,y) covers diluted (adjusted) earnings per share for stock (i) announced for year (y) and ESTEPS(i,y) is the estimated earnings per share concerning the last I/B/E/S consensus estimates before the announcement. The cash flow to voting rights ratio is calculated for the ultimate controlling. In addition to the voting rights of the largest shareholder, the voting rights of the second largest shareholder are reported if they exceed 5%. Panel A. Descriptive Statistics for All Announcements, Firms with Increased, Decreased and Maintained Dividends over the Entire Sample Period (1996-2006) All Announcements Increases
Mean
Median Standard Deviation
Mean
Median
Standard Deviation
Dividend Yield (%) 2.40 2.08 2.08 1.90 1.65 1.44 Change in Dividend Yield (%) 0.11 0.14 1.83 0.62 0.35 1.13 Market Capitalization (Mio. €) 6186.3 1084.0 14057.1 6990.5 1702.6 12973.1 Free Cash Flow (Last Year, Mio. €)
645.6 69.5 1967.2 816.4 66.5 2385.1
Total Assets (Mio. €) 12059.7 1457.6 30216.6 12983.2 1712.1 29816.4 Sales (Mio. €) 9634.0 1776.9 20560.5 9779.9 1928.3 18608.0 Tobin’s Q 1.65 1.28 1.26 1.84 1.37 1.41 Leverage 1.94 1.48 2.23 1.79 1.28 2.59 Coverage 16.37 15.00 10.59 17.15 15.00 10.59 Dividend Estimation Error -0.0005 0.0000 0.0080 0.0020 0.0008 0.0059 Earnings Estimation Error -0.0064 0.0000 0.00725 0.0015 0.0000 0.0266 Voting Rights of the Largest Shareholder
0.41 0.36 0.28 0.40 0.38 0.27
Voting Rights of the 2. Largest Shareholder
0.11 0.10 0.06 0.11 0.10 0.06
Cash Flow to Voting Rights Ratio 0.8557 1.0000 0.8577 1.0000
35
Table 1 continued
Decreases No Change
Mean
Median Standard Deviation
Mean
Median
Standard Deviation
Dividend Yield (%) 4.78 4.10 3.72 2.58 2.47 1.87 Change in Dividend Yield (%) -3.05 -2.45 3.81 0.11 0.00 0.82 Market Capitalization (Mio. €) 3955.9 608.4 10746.5 5460.4 556.0 16315.1 Free Cash Flow (Last Year, Mio. €)
1408.5 387.6 2088.8 1277.4 133.9 2967.6
Total Assets (Mio. €) 11728.2 1498.9 33591.9 10626.2 1216.4 29959.6 Sales (Mio. €) 8791.9 1895.1 21137.4 9620.0 1473.4 23345.8 Tobin’s Q 1.33 1.07 1.15 1.43 1.21 0.91 Leverage 2.08 1.47 1.71 2.15 1.87 1.59 Coverage 15.67 12.00 10.84 15.28 13.00 10.82 Dividend Estimation Error -0.0132 -0.0110 0.0151 -0.0014 -0.0006 0.0040 Earnings Estimation Error -0.0581 0.0000 0.2080 -0.0056 0.0000 0.0426 Voting Rights of the Largest Shareholder
0.37 0.30 0.24 0.44 0.38 0.29
Voting Rights of the 2. Largest Shareholder
0.11 0.10 0.06 0.11 0.10 0.05
Cash Flow to Voting Rights Ratio
0.9167 1.0000 0.8359 1.0000
Panel B. Percentage of the Firm-Year Observations with Maintained, Increased and Decreased Dividends Year
Number of Firms
Firms that Maintained Dividends (%)
Firms that Increased Dividends (%)
Firms that decreased Dividends (%)
1996 65 40.00 52.31 7.69 1997 81 28.40 67.90 3.70 1998 83 26.51 66.27 7.23 1999 91 37.36 58.24 4.40 2000 87 39.08 57.47 3.45 2001 89 38.20 42.70 19.10 2002 90 41.11 40.00 18.89 2003 89 43.82 38.20 17.98 2004 87 33.33 59.77 6.90 2005 79 26.58 67.09 6.33 2006 81 20.99 75.31 3.70

36
Table 2 Wealth Effects of Dividend Announcements
Table 2 presents the average abnormal returns (AAR0) at the announcement date and the cumulative average abnormal returns (CAAR-1,1) over the event window -1 to +1 relative to the announcement date estimated by the market model. Panel A classifies the announcements into three groups, increases, decreases and no change, and then subdivides them into good news, bad news and no news. In Panel B the announcements are first categorized into good news, bad news and no news and then subdivided into increases, decreases and no change. The test statistic proposed by Boehmer et al. (1991) and the non-parametric test statistic of Corrado (1989) are reported in columns 4 and 5 and in columns 7 and 8, respectively. Asterisks denote statistical significance at the 0.01(***), 0.05(**) and 0.10(*)-level. Panel A. Increases, Decreases and No Change
# AAR0 T-Statistic Corrado CAAR-1,1 T-Statistic Corrado
Increases 521 0.81% 5.18*** 4.56*** 1.44% 6.71*** 5.20***
Good News 258 1.18% 6.14*** 4.98*** 2.02% 7.05*** 5.00***
Bad News 70 -0.28% -1.60 -1.01 -0.16% -0.44 -0.42
No News 193 0.71% 2.55** 2.92*** 1.25% 3.24*** 3.82***
Decreases 85 -1.07% -3.82*** -3.63*** -0.47% -1.35 -0.45
Good News 7 - - - - - -
Bad News 71 -1.27% -4.18*** -3.88*** -0.68% -1.72* -0.89
No News 7 - - - - - -
No Change 316 0.17% 1.34 2.42** 0.64% 2.47** 3.18***
Good News 28 0.73% 2.68*** 2.74*** 2.61% 3.69*** 3.88***
Bad News 124 -0.24% -0.25 -0.29 0.15% 0.61 0.72
No News 164 0.38% 1.49 2.94*** 0.68% 1.57 2.62***
Panel B. Good News, Bad News and No Change
# AAR0 T-Statistic Corrado CAAR-1,1 T-Statistic Corrado
Good News 293 1.12% 6.64*** 5.33*** 2.02% 7.76*** 5.56***
Increases 258 1.18% 6.14*** 4.98*** 2.02% 7.05*** 5.00***
Decreases 7 - - - - - -
No Change 28 0.73% 2.68*** 2.74*** 2.61% 3.69*** 3.88***
Bad News 265 -0.52% -2.47** -2.79*** -0.15% -0.47 -0.22
Increases 70 -0.28% -1.60 -1.01 -0.16% -0.44 -0.42
Decreases 71 -1.27% -4.18*** -3.88*** -0.68% -1.72* -0.89
No Change 124 -0.24% -0.25 -0.29 0.15% 0.61 0.72
No News 364 0.53% 2.86*** 3.61*** 1.00% 3.58*** 4.30***
Increases 193 0.71% 2.55** 2.92*** 1.25% 3.24*** 3.82***
Decreases 7 - - - - - -
No Change 164 0.38% 1.49 2.94*** 0.68% 1.57 2.62***
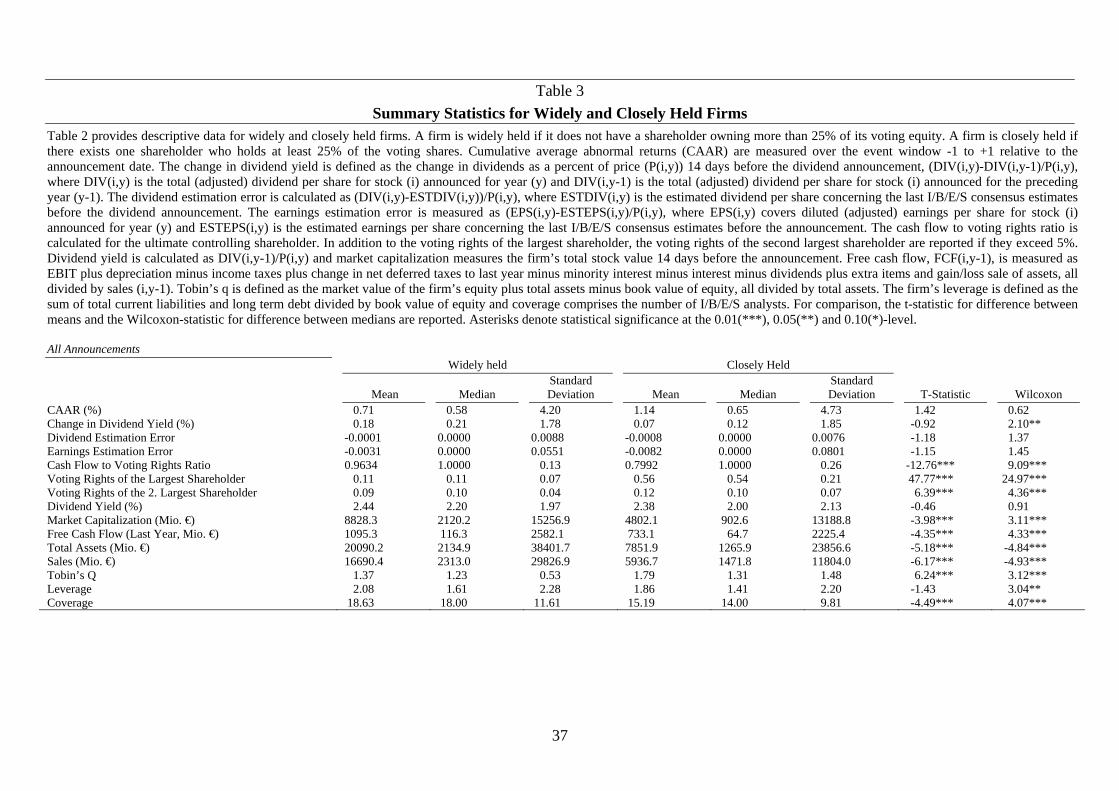
37
Table 3
Summary Statistics for Widely and Closely Held Firms Table 2 provides descriptive data for widely and closely held firms. A firm is widely held if it does not have a shareholder owning more than 25% of its voting equity. A firm is closely held if there exists one shareholder who holds at least 25% of the voting shares. Cumulative average abnormal returns (CAAR) are measured over the event window -1 to +1 relative to the announcement date. The change in dividend yield is defined as the change in dividends as a percent of price (P(i,y)) 14 days before the dividend announcement, (DIV(i,y)-DIV(i,y-1)/P(i,y), where DIV(i,y) is the total (adjusted) dividend per share for stock (i) announced for year (y) and DIV(i,y-1) is the total (adjusted) dividend per share for stock (i) announced for the preceding year (y-1). The dividend estimation error is calculated as (DIV(i,y)-ESTDIV(i,y))/P(i,y), where ESTDIV(i,y) is the estimated dividend per share concerning the last I/B/E/S consensus estimates before the dividend announcement. The earnings estimation error is measured as (EPS(i,y)-ESTEPS(i,y)/P(i,y), where EPS(i,y) covers diluted (adjusted) earnings per share for stock (i) announced for year (y) and ESTEPS(i,y) is the estimated earnings per share concerning the last I/B/E/S consensus estimates before the announcement. The cash flow to voting rights ratio is calculated for the ultimate controlling shareholder. In addition to the voting rights of the largest shareholder, the voting rights of the second largest shareholder are reported if they exceed 5%. Dividend yield is calculated as DIV(i,y-1)/P(i,y) and market capitalization measures the firm’s total stock value 14 days before the announcement. Free cash flow, FCF(i,y-1), is measured as EBIT plus depreciation minus income taxes plus change in net deferred taxes to last year minus minority interest minus interest minus dividends plus extra items and gain/loss sale of assets, all divided by sales (i,y-1). Tobin’s q is defined as the market value of the firm’s equity plus total assets minus book value of equity, all divided by total assets. The firm’s leverage is defined as the sum of total current liabilities and long term debt divided by book value of equity and coverage comprises the number of I/B/E/S analysts. For comparison, the t-statistic for difference between means and the Wilcoxon-statistic for difference between medians are reported. Asterisks denote statistical significance at the 0.01(***), 0.05(**) and 0.10(*)-level. All Announcements Widely held Closely Held
Mean
Median Standard Deviation
Mean
Median
Standard Deviation
T-Statistic
Wilcoxon
CAAR (%) 0.71 0.58 4.20 1.14 0.65 4.73 1.42 0.62 Change in Dividend Yield (%) 0.18 0.21 1.78 0.07 0.12 1.85 -0.92 2.10** Dividend Estimation Error -0.0001 0.0000 0.0088 -0.0008 0.0000 0.0076 -1.18 1.37 Earnings Estimation Error -0.0031 0.0000 0.0551 -0.0082 0.0000 0.0801 -1.15 1.45 Cash Flow to Voting Rights Ratio 0.9634 1.0000 0.13 0.7992 1.0000 0.26 -12.76*** 9.09*** Voting Rights of the Largest Shareholder 0.11 0.11 0.07 0.56 0.54 0.21 47.77*** 24.97*** Voting Rights of the 2. Largest Shareholder 0.09 0.10 0.04 0.12 0.10 0.07 6.39*** 4.36*** Dividend Yield (%) 2.44 2.20 1.97 2.38 2.00 2.13 -0.46 0.91 Market Capitalization (Mio. €) 8828.3 2120.2 15256.9 4802.1 902.6 13188.8 -3.98*** 3.11*** Free Cash Flow (Last Year, Mio. €) 1095.3 116.3 2582.1 733.1 64.7 2225.4 -4.35*** 4.33*** Total Assets (Mio. €) 20090.2 2134.9 38401.7 7851.9 1265.9 23856.6 -5.18*** -4.84*** Sales (Mio. €) 16690.4 2313.0 29826.9 5936.7 1471.8 11804.0 -6.17*** -4.93*** Tobin’s Q 1.37 1.23 0.53 1.79 1.31 1.48 6.24*** 3.12*** Leverage 2.08 1.61 2.28 1.86 1.41 2.20 -1.43 3.04** Coverage 18.63 18.00 11.61 15.19 14.00 9.81 -4.49*** 4.07***
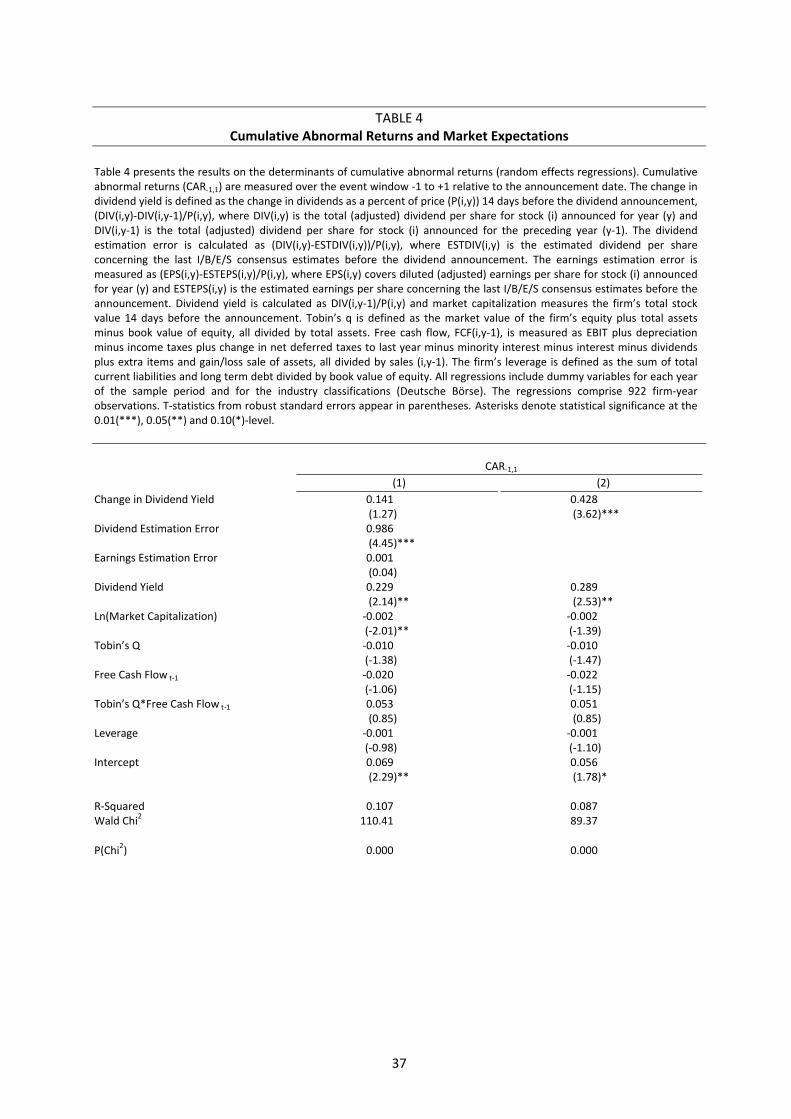
37
TABLE 4 Cumulative Abnormal Returns and Market Expectations
Table 4 presents the results on the determinants of cumulative abnormal returns (random effects regressions). Cumulative abnormal returns (CAR‐1,1) are measured over the event window ‐1 to +1 relative to the announcement date. The change in dividend yield is defined as the change in dividends as a percent of price (P(i,y)) 14 days before the dividend announcement, (DIV(i,y)‐DIV(i,y‐1)/P(i,y), where DIV(i,y) is the total (adjusted) dividend per share for stock (i) announced for year (y) and DIV(i,y‐1) is the total (adjusted) dividend per share for stock (i) announced for the preceding year (y‐1). The dividend estimation error is calculated as (DIV(i,y)‐ESTDIV(i,y))/P(i,y), where ESTDIV(i,y) is the estimated dividend per share concerning the last I/B/E/S consensus estimates before the dividend announcement. The earnings estimation error is measured as (EPS(i,y)‐ESTEPS(i,y)/P(i,y), where EPS(i,y) covers diluted (adjusted) earnings per share for stock (i) announced for year (y) and ESTEPS(i,y) is the estimated earnings per share concerning the last I/B/E/S consensus estimates before the announcement. Dividend yield is calculated as DIV(i,y‐1)/P(i,y) and market capitalization measures the firm’s total stock value 14 days before the announcement. Tobin’s q is defined as the market value of the firm’s equity plus total assets minus book value of equity, all divided by total assets. Free cash flow, FCF(i,y‐1), is measured as EBIT plus depreciation minus income taxes plus change in net deferred taxes to last year minus minority interest minus interest minus dividends plus extra items and gain/loss sale of assets, all divided by sales (i,y‐1). The firm’s leverage is defined as the sum of total current liabilities and long term debt divided by book value of equity. All regressions include dummy variables for each year of the sample period and for the industry classifications (Deutsche Börse). The regressions comprise 922 firm‐year observations. T‐statistics from robust standard errors appear in parentheses. Asterisks denote statistical significance at the 0.01(***), 0.05(**) and 0.10(*)‐level.
CAR‐1,1
(1) (2)
Change in Dividend Yield 0.141 (1.27)
0.428 (3.62)***
Dividend Estimation Error 0.986 (4.45)***
Earnings Estimation Error 0.001 (0.04)
Dividend Yield 0.229 (2.14)**
0.289 (2.53)**
Ln(Market Capitalization) ‐0.002 (‐2.01)**
‐0.002 (‐1.39)
Tobin’s Q ‐0.010 (‐1.38)
‐0.010 (‐1.47)
Free Cash Flow t‐1 ‐0.020 (‐1.06)
‐0.022 (‐1.15)
Tobin’s Q*Free Cash Flow t‐1 0.053 (0.85)
0.051 (0.85)
Leverage ‐0.001 (‐0.98)
‐0.001 (‐1.10)
Intercept 0.069 (2.29)**
0.056 (1.78)*
R‐Squared 0.107 0.087 Wald Chi
2 110.41 89.37
P(Chi2) 0.000 0.000

38
TABLE 5 Dividend Announcement Returns and Ownership Characteristics
Table 5 presents the results on the determinants of cumulative abnormal returns for good news/increases (random effects regressions) and bad news/decreases (OLS regressions). Cumulative abnormal returns (CAR‐1,1) are measured over the event window ‐1 to +1 relative to the announcement date. The change in dividend yield is defined as the change in dividends as a percent of price (P(i,y)) 14 days before the dividend announcement, (DIV(i,y)‐DIV(i,y‐1)/P(i,y), where DIV(i,y) is the total (adjusted) dividend per share for stock (i) announced for year (y) and DIV(i,y‐1) is the total (adjusted) dividend per share for stock (i) announced for the preceding year (y‐1). The dividend estimation error is calculated as (DIV(i,y)‐ESTDIV(i,y))/P(i,y), where ESTDIV(i,y) is the estimated dividend per share concerning the last I/B/E/S consensus estimates before the dividend announcement. The earnings estimation error is measured as (EPS(i,y)‐ESTEPS(i,y)/P(i,y), where EPS(i,y) covers diluted (adjusted) earnings per share for stock (i) announced for year (y) and ESTEPS(i,y) is the estimated earnings per share concerning the last I/B/E/S consensus estimates before the announcement. Dividend yield is calculated as DIV(i,y‐1)/P(i,y) and market capitalization measures the firm’s total stock value 14 days before the announcement. Tobin’s q is defined as the market value of the firm’s equity plus total assets minus book value of equity, all divided by total assets. Free cash flow, FCF(i,y‐1), is measured as EBIT plus depreciation minus income taxes plus change in net deferred taxes to last year minus minority interest minus interest minus dividends plus extra items and gain/loss sale of assets, all divided by sales (i,y‐1). The firm’s leverage is defined as the sum of total current liabilities and long term debt divided by book value of equity. The cash flow to voting rights ratio is calculated for the ultimate controlling. In addition to the voting rights of the largest shareholder, the voting rights of the second largest shareholder (>5%) are included in the regression framework. All regressions include dummy variables for each year of the sample period and for the industry classifications (Deutsche Börse). T‐statistics from robust standard errors appear in parentheses. Asterisks denote statistical significance at the 0.01(***), 0.05(**) and 0.10(*)‐level.
CAR‐1,1
Good News Increases Bad News Decreases
Change in Dividend Yield 0.480 (1.50)
0.195 (0.90)
‐0.044 (‐0.27)
0.186 (0.69)
Dividend Estimation Error 1.296 (2.16)**
0.780 (2.55)**
0.421 (1.03)
0.716 (1.77)*
Earnings Estimation Error 0.132 (1.45)
0.187 (2.85)***
‐0.000 (‐0.02)
‐0.017 (‐1.17)
Dividend Yield 0.497 (2.26)**
0.421 (2.17)**
‐0.012 (‐0.07)
0.300 (1.15)
Ln(Market Capitalization) ‐0.002 (‐0.79)
‐0.002 (‐1.56)
0.000 (0.16)
‐0.002 (‐0.51)
Tobin’s Q ‐0.004 (‐0.39)
‐0.005 (‐0.46)
‐0.010 (‐1.09)
‐0.020 (‐1.56)
Free Cash Flow t‐1 0.053 (1.53)
‐0.015 (‐0.54)
‐0.011 (‐0.33)
0.064 (0.60)
Tobin’s Q*Free Cash Flow t‐1 ‐0.084 (‐0.97)
‐0.010 (‐0.12)
0.059 (0.36)
0.051 (0.26)
Leverage ‐0.002 (‐1.99)**
‐0.001 (‐1.08)
‐0.001 (‐0.34)
0.001 (0.43)
Voting Rights of the Largest Shareholder ‐0.086 (‐1.71)*
‐0.066 (‐2.01)**
0.037 (0.88)
‐0.048 (‐0.62)
Voting Rights of the Largest Shareholder2 0.108
(1.99)** 0.080
(2.12)** ‐0.035 (‐0.82)
0.081 (0.91)
Voting Rights of the 2. Largest Shareholder ‐0.001 (‐0.27)
0.001 (0.19)
0.004 (‐0.69)
0.001 (0.09)
Cash Flow to Voting Rights Ratio ‐0.034 (‐2.13)**
‐0.024 (‐2.01)**
‐0.017 (‐1.10)
‐0.003 (‐0.12)
Intercept 0.070 (1.09)
0.101 (2.02)**
‐0.002 (‐0.05)
‐0.015 (‐0.16)
R‐Squared 0.282 0.167 0.082 0.248 Wald Chi
2/F‐Statistic 247.63 95.13 0.93 1.53 P(Chi2)/P(F‐Statistic) 0.000 0.000 0.554 0.096