diversity in the c-suite
TRANSCRIPT
Stanford CloSer looK SerieS
Stanford CloSer looK SerieS 1
By DaviD F. Larcker anD Brian TayanapriL 1, 2020
Diversity in the C-suitethe diSmal State of diverSity among fortune 100 Senior exeCutiveS
introduction
There has been a broad push in recent years to increase diversity
at the board and CEO levels of public corporations. Proponents
argue that increased representation across gender and ethnic
groups improves corporate decision making.1 Furthermore, it
is consistent with fairness and demonstrates that leadership
opportunities should be equally available to all qualified members
of the workplace.
To this end, State Street launched the “Fearless Girl” campaign
in 2017, calling on its portfolio companies to increase the number
of women on their boards.2 Catalyst Group has long advocated
for greater representation by females in both the boardroom and
higher levels of corporations. And Goldman Sachs announced
that, as of summer 2020, the company would not help companies
go public unless they have at least one diverse board member.3,4
Despite these and other efforts, however, diversity on boards
and in senior leadership positions has not reached the levels to
which advocates aspire. According to Institutional Shareholder
Services, women comprise 27 percent of S&P 500 board seats
and 19 percent of mid- and small-cap company board seats (see
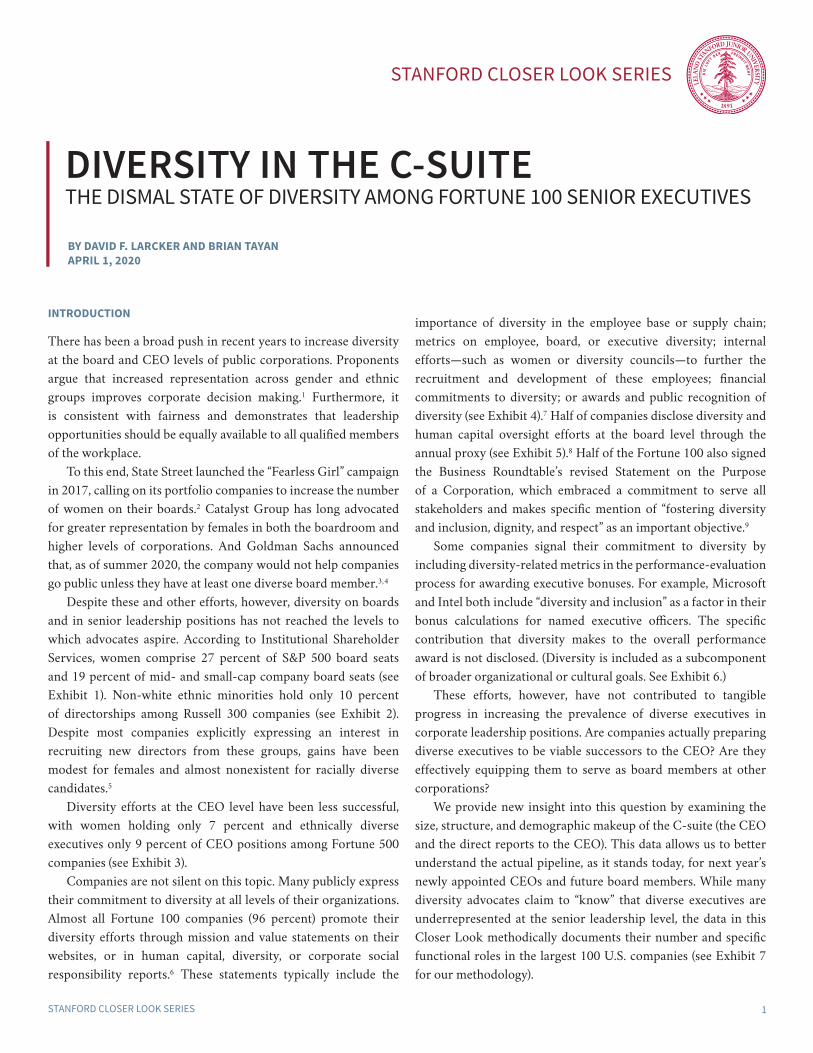
Exhibit 1). Non-white ethnic minorities hold only 10 percent
of directorships among Russell 300 companies (see Exhibit 2).
Despite most companies explicitly expressing an interest in
recruiting new directors from these groups, gains have been
modest for females and almost nonexistent for racially diverse
candidates.5
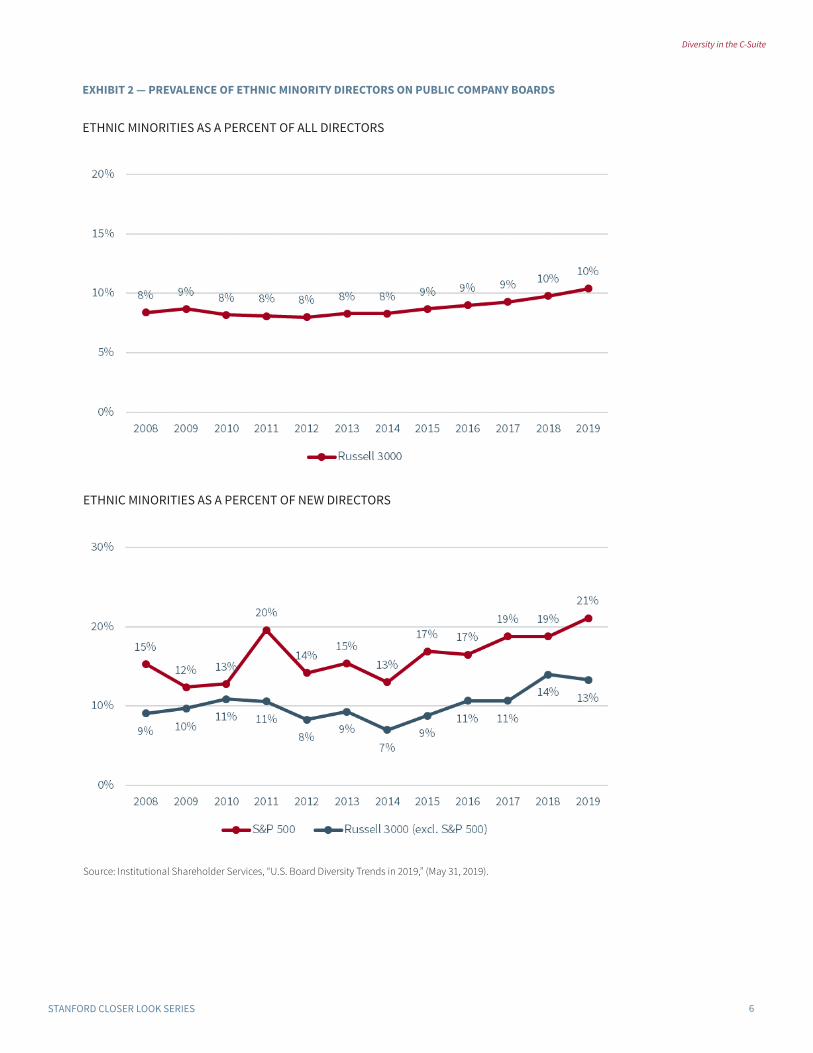
Diversity efforts at the CEO level have been less successful,
with women holding only 7 percent and ethnically diverse
executives only 9 percent of CEO positions among Fortune 500
companies (see Exhibit 3).
Companies are not silent on this topic. Many publicly express
their commitment to diversity at all levels of their organizations.
Almost all Fortune 100 companies (96 percent) promote their
diversity efforts through mission and value statements on their
websites, or in human capital, diversity, or corporate social
responsibility reports.6 These statements typically include the
importance of diversity in the employee base or supply chain;
metrics on employee, board, or executive diversity; internal
efforts—such as women or diversity councils—to further the
recruitment and development of these employees; financial
commitments to diversity; or awards and public recognition of
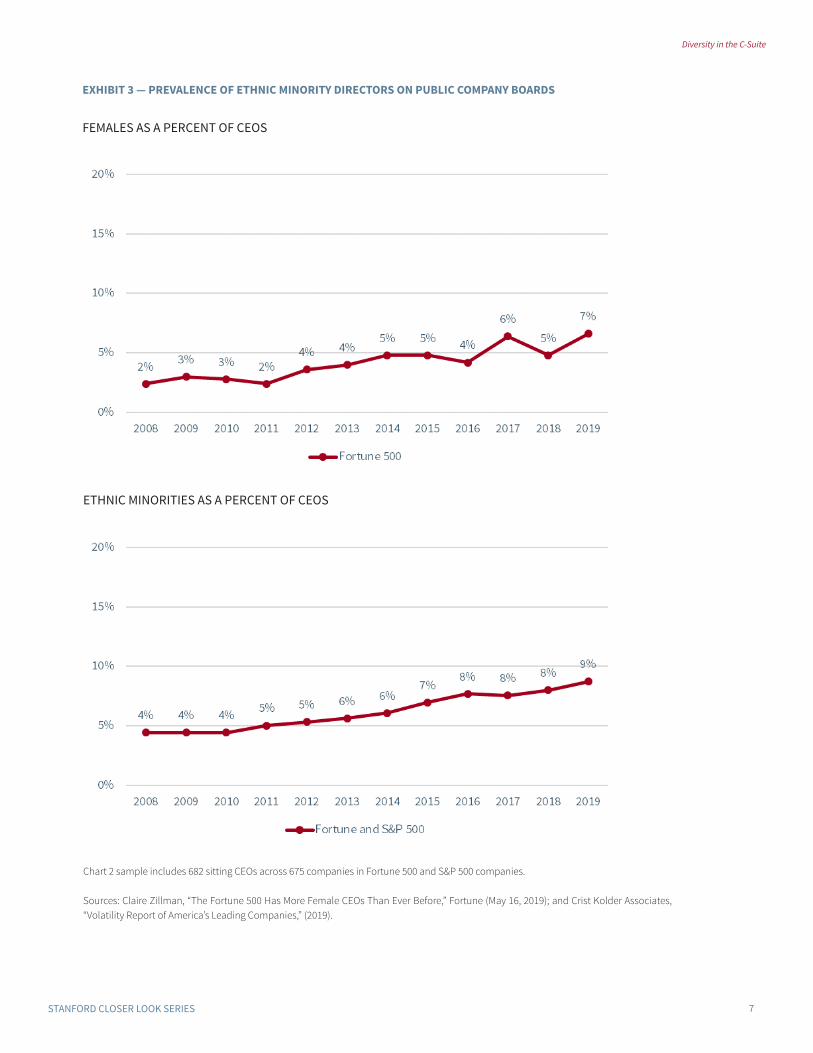
diversity (see Exhibit 4).7 Half of companies disclose diversity and
human capital oversight efforts at the board level through the
annual proxy (see Exhibit 5).8 Half of the Fortune 100 also signed
the Business Roundtable’s revised Statement on the Purpose
of a Corporation, which embraced a commitment to serve all
stakeholders and makes specific mention of “fostering diversity
and inclusion, dignity, and respect” as an important objective.9
Some companies signal their commitment to diversity by
including diversity-related metrics in the performance-evaluation
process for awarding executive bonuses. For example, Microsoft
and Intel both include “diversity and inclusion” as a factor in their
bonus calculations for named executive officers. The specific
contribution that diversity makes to the overall performance
award is not disclosed. (Diversity is included as a subcomponent
of broader organizational or cultural goals. See Exhibit 6.)
These efforts, however, have not contributed to tangible
progress in increasing the prevalence of diverse executives in
corporate leadership positions. Are companies actually preparing
diverse executives to be viable successors to the CEO? Are they
effectively equipping them to serve as board members at other
corporations?
We provide new insight into this question by examining the
size, structure, and demographic makeup of the C-suite (the CEO
and the direct reports to the CEO). This data allows us to better
understand the actual pipeline, as it stands today, for next year’s
newly appointed CEOs and future board members. While many
diversity advocates claim to “know” that diverse executives are
underrepresented at the senior leadership level, the data in this
Closer Look methodically documents their number and specific
functional roles in the largest 100 U.S. companies (see Exhibit 7
for our methodology).

Diversity in the C-Suite
2Stanford CloSer looK SerieS
Our intention is not to criticize any specific company, but
instead to highlight the current composition of the C-suite across
the entire Fortune 100. We recognize that this analysis represents
a single point in time. The composition of each company can and
will change over time, resulting in either increased or decreased
diversity. However, in aggregate, these numbers reflect the degree
of diversity as it stands today.
demographic composition of the c-suite
In order for an executive to be a viable CEO or board candidate,
they must first have the managerial and functional skills required
for those jobs. For a board candidate, this typically means having
CEO, operating, or senior finance experience. In 2019, 68
percent of new independent directors had these backgrounds (see
Exhibit 8).10 For a CEO, this means having profit or loss (P&L)
responsibility or CFO experience. Over 90 percent of internally
promoted CEOs served in a role with one of these responsibilities
prior to appointment. Very few CEOs (5 percent) are promoted
from functional groups outside of these roles, such as marketing,
risk management, human resources, or general counsel (see
Exhibit 9).11 In the case of CEO promotions, being a direct report
to the CEO is also critical. Almost no companies promote a CEO
from more than one level below the CEO.12
If companies are adequately preparing executives for board and
CEO positions, it therefore follows that diverse candidates must
be represented in these specific roles (operating, P&L, or finance).
Diverse executives are much less likely to be CEO candidates (and
have lower potential to be a board candidate) if they serve in non-
P&L positions, even if they directly report to the CEO. That is, not
all direct reports of the CEO are equally positioned to become CEO or
join a board.
To better understand the current pipeline for future leadership,
we examine the composition of the direct reports to the CEO.13
(We use the term “C-suite” to refer to the CEO and his or her
direct reports; the term “C+1” refers only to the direct reports.)
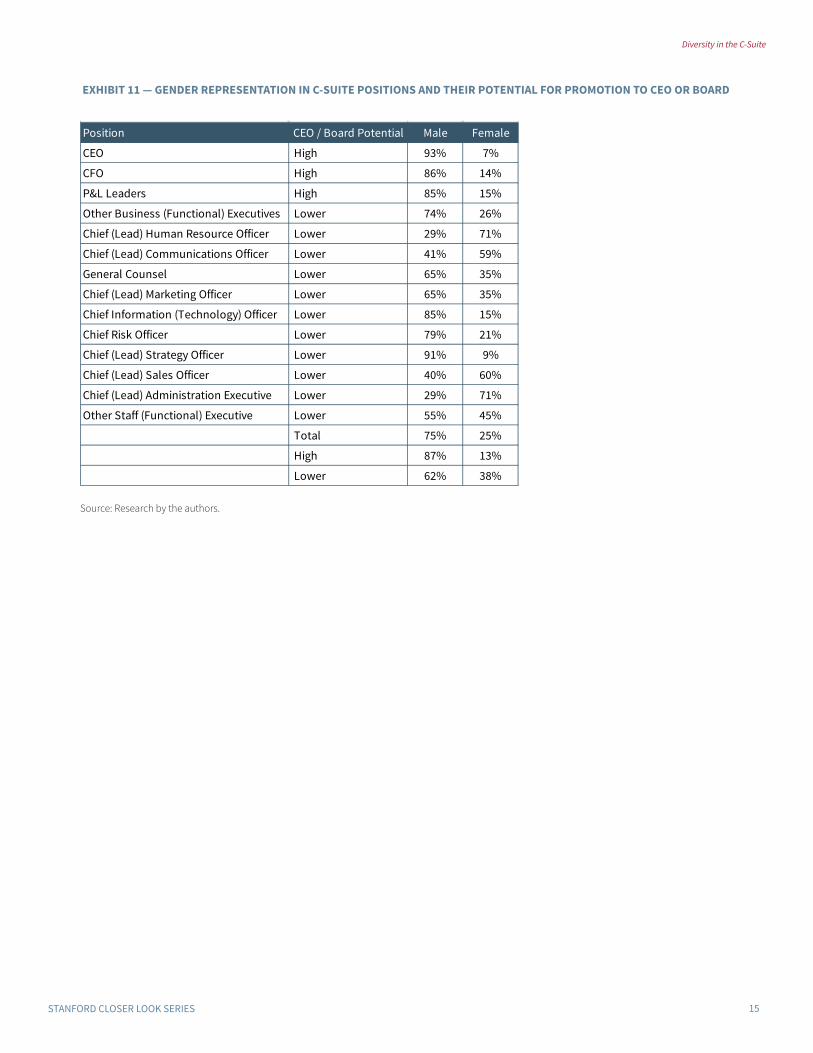
Our findings on gender diversity are as follows:
• Women are severely underrepresented in the C-suite. Only 25
percent of total C-suite positions are held by women. Only 7
companies have a female CEO. Nine of the Fortune 100 have
no women directly reporting to the CEO (C+1 level).
• Women are underrepresented in the most common C+1 positions.
The three most common direct reports of the CEO are P&L
leaders, CFOs, and general counsel. Women hold only 15
percent, 14 percent, and 35 percent of these roles, respectively.
• Women are underrepresented in positions that directly feed into
future CEO and board roles, and they have greater representation in
positions that are less likely to lead to these appointments. Women
hold only 13 percent of positions with high potential for
CEO promotion and board recruitment (CEO, CFO, and P&L
leaders). By contrast, they hold 38 percent of positions with
lower potential for advancement (general counsel, human
resources, chief risk officer, etc.). That is, the representation
of women in the C-suite is skewed toward lower potential
positions.
• Very few companies have a “deep bench” of female executives. Nine
companies have no women in the C-suite. Women comprise a
third or more of the C-suite in 27 Fortune 100 companies, 40
percent or more of the C-suite in 10 companies, and half in
only 2 companies. No Fortune 100 company has a majority of
female executives in the C-suite.
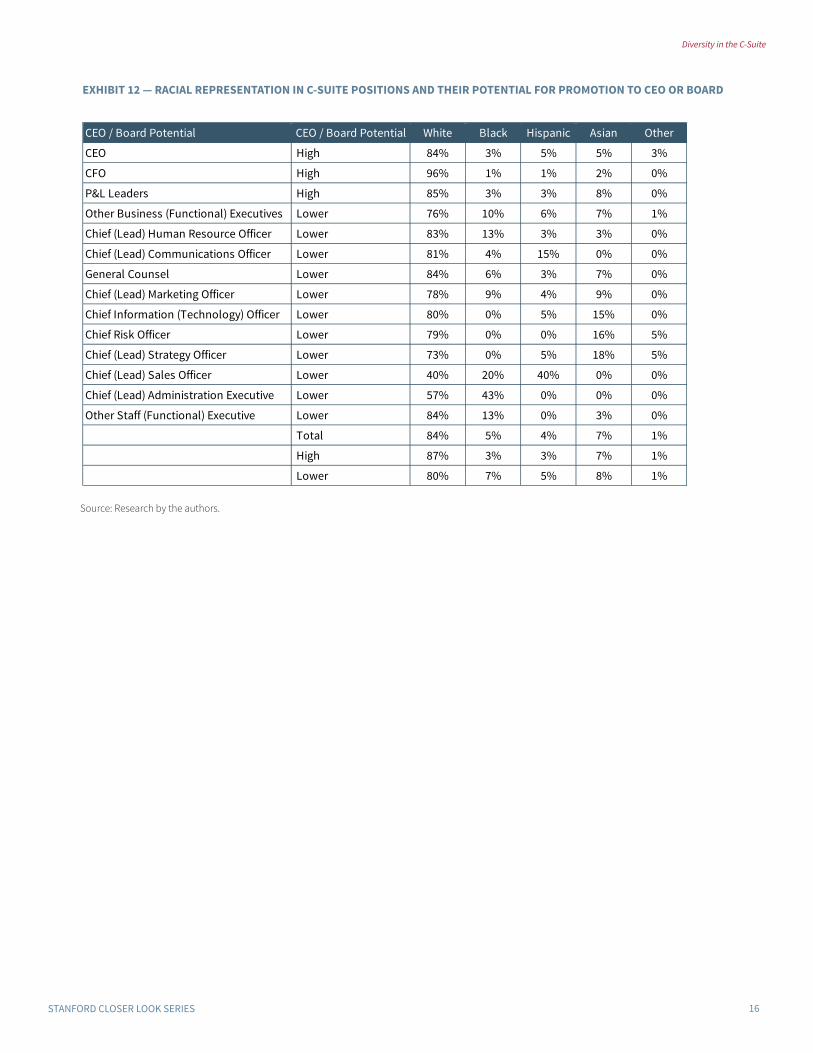
Our findings on racial and ethnic diversity are as follows:
• C-suite is even less diverse by race. Racially diverse executives
hold only 16 percent of total C-suite positions. Only 16 have
a non-white CEO.14 Twenty-six of the Fortune 100 have no
ethnic diversity at the C+1 level, and 6 have no ethnic or
gender diversity at this level.
• The CFO role is the least racially diverse position in the C-suite.
There are only 4 CFOs who are not white.
• The representation of racially diverse executives in the C-suite is
slightly skewed toward positions with lower potential for advancement.
Similar to our finding above, we find that ethnically diverse
executives have lower representation in positions that directly
feed into future CEO and board roles—although the degree
to which this occurs is much lower than it is among female
executives. Racially diverse executives hold only 13 percent of
high potential positions (CEO, CFO, and P&L), and 20 percent
of lower potential positions. The very low prevalence of non-
white CFOs accounts for almost all of this skewing.
• Few companies have a large number of racially diverse executives
in the C-suite. Twenty-six companies have no racially diverse
executives in the C-suite. Non-white executives comprise a
third or more of the C-suite in only 13 companies, 40 percent
or more in only 5 companies, and half or more in only 2
companies.
(This data is summarized in Exhibits 10-13. Organizational charts
of the C-suites of each of the Fortune 100 as of January and
February 2020 are available here.)
All of this data demonstrates that while companies tout their

Diversity in the C-Suite
3Stanford CloSer looK SerieS
efforts and their commitment to diversity, diversity is substantially
missing at the CEO and C+1 levels. Furthermore, among CEO
direct reports, diversity is less prevalent in positions that are most
likely to be prime candidates for advancement. Instead, we find
that many diverse executives serve in terminal functional roles
that are not typically on a path to becoming CEO, and also not
on a path (as it stands today compared with what boards look for
in new directors) to corporate board service. Unless changes are
made, the current composition of the C-suite of Fortune 100 does
not portend well for increased diversity of corporate leadership in
coming years.
Why this matters
1. While companies promote their diversity efforts, they have
not been especially successful bringing diversity to the
C-suite. C-suites of the Fortune 100 are characterized by
low representation of female executives and even lower
representation of ethnically diverse executives. What accounts
for this lack of representation? At what step along the way does
the process of promoting diverse executives break down?
2. Many companies publish diversity statistics on their website
to demonstrate their commitment to diversity and their
success in adding more diverse individuals to managerial roles.
However, these data generally do not include the diversity of
the C-suite and, in fact, somewhat obscure the degree to which
the highest level of corporate leadership lacks diversity. How
“honest” are diversity statistics? Should companies disclose
diversity in greater detail by level or function? Would this
highlight deficiencies and accelerate the rate of advancement?
3. The representation of racially diverse executives is low and
fairly constant across job functions. This is not true of female
executives, who have much higher representation in lower
potential leadership roles—such as human resources, general
counsel, and corporate communications. What accounts for
this difference in distribution?
4. If P&L and CFO experience are key determinants of future
promotion to the CEO role and board seats, companies need to
do more to prepare diverse executives for these roles. Decisions
are made on a company-by-company basis, presumably based
on the individual talent pool and job openings available,
and yet in aggregate company promotion efforts are failing.
Do company diversity initiatives actually lead to tangible
improvement? If so, when will this show up in the C-suite?
1 This is a common claim for those arguing for more diversity. The research evidence on this point is not conclusive. See: David F. Larcker and Brian Tayan, “Diverse Boards: Research Spotlight,” Stanford Quick Guide Series (April 2016), available at: https://www.gsb.stanford.edu/faculty-research/publications/diverse-boards.
2 State Street, “State Street Global Advisors Calls on 3,500 Companies Representing More Than $30 Trillion in Market Capitalization to Increase Number of Women on Corporate Boards,” press release (March 10, 2017).
3 Hugh Son, “Goldman Won’t Take Companies Public Without ‘At Least One Diverse Board Candidate,’ CEO Says,” CBNC ( January 23. 2020).
4 It is interesting to note that diversity advocates in recent years have focused their efforts primarily on increasing female representation on boards and less so on representation by non-white ethnic minorities. Search consultants we have interviewed acknowledge this fact but do not have an explanation for it.
5 According to Spencer Stuart, recruiting female directors was the highest priority profile for new directors in 2019 (above directors with technical expertise, active CEO experience, financial experience, or operating experience); and recruiting female and minority directors are each among the top five highest priorities over the next three years. See Spencer Stuart, “U.S. Board Index,” (2019); see also Heidrick & Struggles, “Board Monitor: U.S. 2019” (2019).
6 Research by the authors, conducted February and March 2020.7 Some companies publish diversity employment statistics or make their
Equal Employment Opportunity data available through their website to demonstrate diversity representation in their organization. For example, see Amazon, “Our Workforce Data,” available at: https://www.aboutamazon.com/working-at-amazon/diversity-and-inclusion/our-workforce-data; and Apple, “Equal Employment Opportunity, 2018 Employer Information Report,” available at: https://www.apple.com/diversity/pdf/2018-EEO-1-Consolidated-Report.pdf.
8 This statistic includes only reference to the board’s role in overseeing diversity or inclusion efforts in the employment ranks. It excludes board diversity efforts, which are required by the SEC under Regulation S-K. See Securities and Exchange Commission, “17 CFR Parts 229, 239, 240, 249, and 274. Proxy Disclosure Enhancements [Release Nos. 33-9089; 34-61175; IC-29092; File No. S7-13-09].”
9 Business Roundtable, “Business Roundtable Redefines the Purpose of a Corporation to Promote ‘An Economy that Serves All Americans,’” press release (August 19, 2019).
10 The rest of new independent directors have experience outside the corporation, either as an investment professional, banker, accountant, consultant, academic, or lawyer. Spencer Stuart, U.S. Board Index (2019).
11 Crist Kolder Associates, “Volatility Report of America’s Leading Companies,” (2019).
12 Estimate provided to the authors by a professional recruiter.13 Studies have been done that examine the named executive officers
(NEOs) of public companies. However, an analysis that includes only NEOs does not provide the full picture because it includes only five individuals: the CEO, the CFO, and the three other most highly paid executive officers. It is possible that a group of NEOs might include executives who are not direct reports to the CEO, and it is very likely that a CEO has direct reports in addition to NEOs. An analysis of the full C+1 level is therefore more accurate and complete.
14 This is higher than the number of female CEOs but still very low (16 percent).

Diversity in the C-Suite
4Stanford CloSer looK SerieS
David Larcker is Director of the Corporate Governance Research Initiative at the Stanford Graduate School of Business and senior faculty member at the Rock Center for Corporate Governance at Stanford University. Brian Tayan is a researcher with Stanford’s Corporate Governance Research Initiative. They are coauthors of the books Corporate Governance Matters and A Real Look at Real World Corporate Governance. The authors would like to thank our research assistants for the detailed data collection required for this project, and Michelle E. Gutman for additional research assistance in the preparation of these materials.
The Stanford Closer Look Series is dedicated to the memory of our colleague Nicholas Donatiello.
The Stanford Closer Look Series is a collection of short case studies that explore topics, issues, and controversies in corporate governance and leadership. It is published by the Corporate Governance Research Initiative at the Stanford Graduate School of Business and the Rock Center for Corporate Governance at Stanford University. For more information, visit: http:/www.gsb.stanford.edu/cgri-research.
Copyright © 2020 by the Board of Trustees of the Leland Stanford Junior University. All rights reserved.

Diversity in the C-Suite
5Stanford CloSer looK SerieS
exhibit 1 — prevalence of female directors on public company boards
Source: Institutional Shareholder Services, “U.S. Board Diversity Trends in 2019,” (May 31, 2019).
females as a percent of all directors
females as a percent of new directors
Diversity in the C-Suite
6Stanford CloSer looK SerieS
exhibit 2 — prevalence of ethnic minority directors on public company boards
Source: Institutional Shareholder Services, “U.S. Board Diversity Trends in 2019,” (May 31, 2019).
ethnic minorities as a percent of all directors
ethnic minorities as a percent of new directors
Diversity in the C-Suite
7Stanford CloSer looK SerieS
exhibit 3 — prevalence of ethnic minority directors on public company boards
Chart 2 sample includes 682 sitting CEOs across 675 companies in Fortune 500 and S&P 500 companies.
Sources: Claire Zillman, “The Fortune 500 Has More Female CEOs Than Ever Before,” Fortune (May 16, 2019); and Crist Kolder Associates, “Volatility Report of America’s Leading Companies,” (2019).
females as a percent of ceos
ethnic minorities as a percent of ceos
Diversity in the C-Suite
8Stanford CloSer looK SerieS
exhibit 4 — selected language from human capital and diversity statements
Exxonmobil
Through a range of programs, activities and investments, we strive to create and maintain a diverse workforce representative
of the numerous geographies where we do business. Our Global Diversity Framework is the foundation for this approach,
with three interrelated objectives:
• Attract, develop and retain a premier workforce, from the broadest possible pool, to meet our business needs worldwide;• Actively foster a productive work environment where individual and cultural differences are respected and valued, and
where all employees are encouraged to contribute fully to the achievement of superior business results;• Identify and develop leadership capabilities to excel in a variety of international and cultural environments.
The framework communicates these existing principles in the context of our increasing global operations.
AmEricAn ExprEss
Diversity by the Numbers• Women comprise over 50 percent of our global workforce and more than 30 percent of senior executives• We contributed to 7 research studies in partnership with Center for Talent Innovation, focusing on how to advance
women in the workplace• 21 percent of our board are women• 46 percent of our senior management team is diverse• 16 Employee networks with nearly 100 chapters globally, bringing together employees with shared backgrounds• 3 Executive employee networks that support black, Hispanic, and female executive leaders
boEing
Diversity Councils and Business Resource Groups
Diversity Councils are integrated groups of site leaders, managers and employees who work to improve employee
engagement, provide learning and leadership opportunities, increase communication and facilitate implementation of
organizational diversity plans. Diversity Councils are supported by a local executive champion. Boeing has more than 40
Diversity Councils.
Business Resource Groups are employee-led associations designed to further personal and professional development,
promote diversity within the company and strengthen networking. The members share a common interest, such as race,
gender or cultural identity. The nine groups collectively have more than 130 chapters around the world. Membership is
open to all employees.
Boeing Business Resource Groups include:• Boeing Asian Professional Association• Boeing Black Employees Association• Boeing Employee Ability Awareness Association• Boeing Employee Pride Alliance• Boeing Familia • Boeing Generation to Generation• Boeing Native American Network• Boeing Veteran Engagement Team• Boeing Women Inspiring Leadership
Sources: ExxonMobil, available at: https://corporate.exxonmobil.com/en/company/careers/global-diversity#globalDiversityFramework; American Express, available at: https://www.americanexpress.com/us/global-diversity-and-inclusion/index.html; and Boeing, available at: https://jobs.boeing.com/diversity (Accessed March 6, 2020).

Diversity in the C-Suite
9Stanford CloSer looK SerieS
exhibit 5 — selected board disclosure of diversity and human capital efforts
gEnErAl motors
The Board reviews candidates for all senior executive positions to confirm that qualified and diverse successor-candidates
are available for all positions and that development plans are being utilized to strengthen the skills and qualifications of
successor candidates.
The Board’s investment in people development does not stop with management succession planning. It actively takes an
interest in making sure all employees are fully engaged and realizing their potential. To accomplish this, the Board annually
reviews the diversity pipeline at all levels of the Company and receives an update on various hiring initiatives for diversity
groups supported by the Company. At this time, the Board believes it has a deep and diverse talent pipeline from which to
promote employees at all levels of the Company.
johnson & johnson
The Board and Committees are actively engaged in overseeing the company’s talent development and human capital
management strategies designed to attract, develop and retain global business leaders who can drive financial and strategic
growth objectives and build long-term shareholder value. The Board’s involvement in leadership development and
succession planning is systematic and ongoing, and the Board provides input on important decisions in each of these areas.
[...]
To improve the Board’s understanding of the company’s culture and talent pipeline, the Board conducts meetings and
schedules site visits at the company’s locations and meets regularly with high-potential executives in formal and informal
settings. More broadly, the Board is regularly updated on key talent indicators for the overall workforce, including diversity
and inclusion, recruiting and development programs, and is updated on the company’s human capital development strategy.
pEpsico
Beyond leadership development, our Board is continuously focused on developing an inclusive and respectful work
environment where our employees across the entire workforce are empowered to speak with truth and candor, raise
concerns and implement new ideas in the best interests of the business. The Board and its applicable Committees regularly
engage with employees at all levels of the organization, including through periodic visits to PepsiCo’s operations, to provide
oversight on a broad range of human capital management topics, including corporate culture, diversity and inclusion, pay
equity, health and safety, training and development and compensation and benefits.
Sources: General Motors, DEF 14A (April 18, 2019); Johnson & Johnson, DEF 14A (March 13, 2019); and PepsiCo, DEF 14A (March 22, 2019).

Diversity in the C-Suite
10Stanford CloSer looK SerieS
exhibit 6 — diversity metrics in executive compensation programs
microsoft
Culture & Organizational Leadership (33.3% weight)
Mr. Nadella continued to demonstrate his commitment to evolve Microsoft culture, where his successes include achieving
aspirational goals for diversity goals in hiring and retention. In fiscal year 2019, nearly 80% of employees and managers
surveyed indicated they understand how to leverage a new core priority for inclusion to contribute towards building a
more diverse and inclusive workplace. Moreover, 90% of employees said their managers created an inclusive environment.
Work remains to be done to provide additional training and resources for the Company’s mid-level managers and address
the needs of the millennial workforce.
Surveys of employee sentiment and Senior Leadership Team feedback show strong support for Mr. Nadella’s cultural push
for One Microsoft and Growth Mindset initiatives.
intEl
We set ambitious goals for our company and make strategic investments to advance progress in the areas of environmental
sustainability, supply chain responsibility, diversity and inclusion, and social impact that benefit the environment and
society. […]
Long-term total stockholder return provides one measure of value creation, though we also consider other indicators of
success for our deployment of capital, such as diversity advancement for our human capital. […]
Operational Performance (50% Weighting)
Corporate-level and administrative group employees, including each of our listed officers other than Mr. Shenoy, are paid
based on average of 10 business units’ scores, subject to any adjustment for performance against corporate-level diversity
and inclusion goal (focused on hiring and retaining diverse talent—not achieved).
Sources: Microsoft, Form DEF 14A (October 16, 2019); and Intel, Form DEF 14A (April 3, 2019).

Diversity in the C-Suite
11Stanford CloSer looK SerieS
exhibit 7 — methodology and data collection
During the time period December 2019 to February 2020, a group of skilled, professional researchers methodically collected
and verified information to identify the exact direct reports to the CEOs of all Fortune 100 companies, including their title,
race, and gender. This is a difficult and tedious task because an executive’s being listed as a named executive officer in the
proxy statement or on an executive leadership webpage does not guarantee that the executive reports to the CEO.
Our methodology for the research study was as follows:
Step 1: Identify the executive leadership team of each company and their position.
Step 2: Use research tools to verify who does and does not report to the respective CEOs, including:
• A proprietary database that includes employment information about executives • Public filings, including proxy statements, 10-Ks, and annual reports• RelSci, a relationship capital platform that includes corporate executives• LinkedIn• Company websites• Company press releases indicating hire or promotion dates for executives
Step 3: Call an executive at each company to verify the CEO’s direct reports. In most cases, a second or third executive was
called to ensure high confidence in the data.
The data for each company and the date that each company was verified is noted on each company organizational chart
available at here.

Diversity in the C-Suite
12Stanford CloSer looK SerieS
exhibit 8 — professional backgrounds of neWly elected independent directors
Sources: Spencer Stuart, U.S. Board Index (2019).
new director Backgrounds - 2019 total men women
active ceos 15% 20% 9%
retired ceos 15% 21% 7%
line and functional leaders 14% 6% 23%
financial executives/cfos/treasurers 10% 8% 13%
investors/investment managers 9% 13% 6%
division/subsidiary presidents 9% 8% 11%
Bankers/investment bankers 5% 6% 4%
academics/nonprofit executives 4% 4% 5%
active chairs/presidents/coos 3% 4% 3%
consultants 3% 2% 5%
public accounting executives 3% 2% 3%
retired chairs/presidents/coos 2% 2% 2%
General counsel 1% 0% 2%
lawyers 1% 1% 1%
others 6% 3% 8%

Diversity in the C-Suite
13Stanford CloSer looK SerieS
exhibit 9 — immediate previous position of sitting ceos
Note: Sample includes 675 companies and 682 sitting CEOs among the Fortune 500 and S&P 500 Index.
Source: Crist Kolder Associates, Volatility Report of America’s Leading Companies, (2019).
25% 25%
15%
8% 7% 6% 6% 6%
3%
0%
5%
10%
15%
20%
25%
30%
coo divisionalpresident
president presidentand coo
ceo cfo operatingexecutive
other founder
Diversity in the C-Suite
14Stanford CloSer looK SerieS
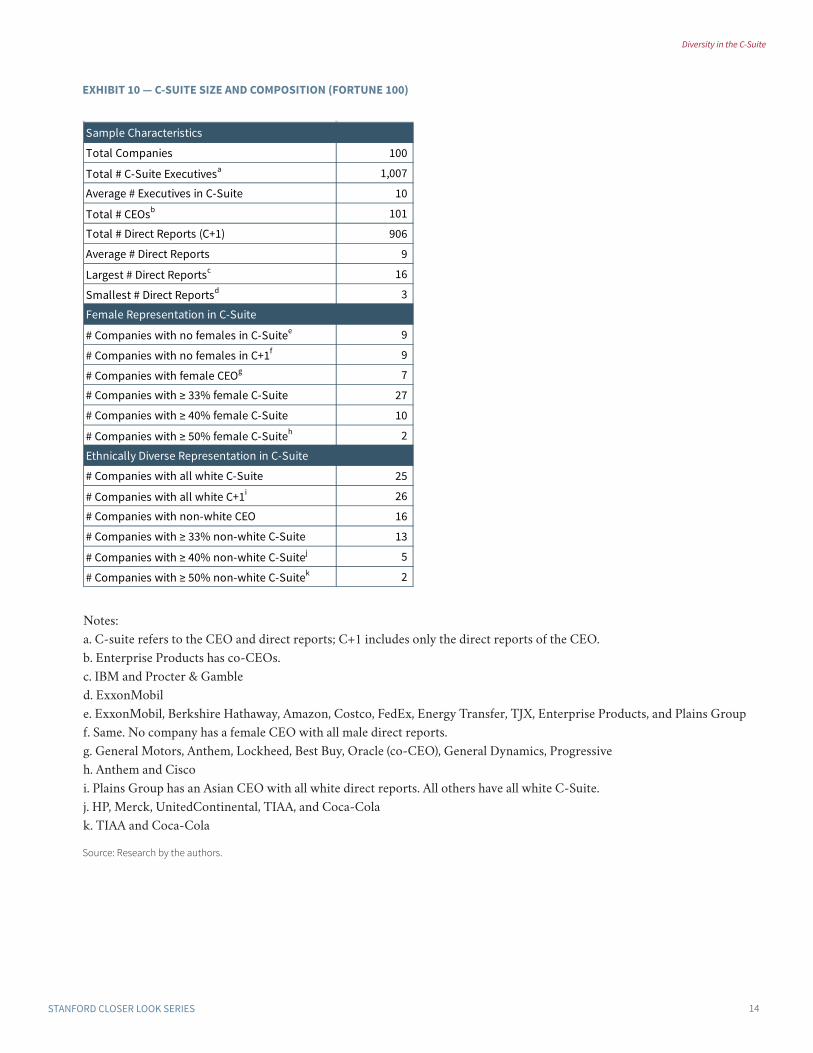
exhibit 10 — c-suite size and composition (fortune 100)
sample characteristics
total companies 100
total # c-suite executivesa 1,007
average # executives in c-suite 10
total # ceosb 101
total # direct reports (c+1) 906
average # direct reports 9
largest # direct reportsc 16
smallest # direct reportsd 3
female representation in c-suite
# companies with no females in c-suitee 9
# companies with no females in c+1f 9
# companies with female ceog 7
# companies with ≥ 33% female c-suite 27
# companies with ≥ 40% female c-suite 10
# companies with ≥ 50% female c-suiteh 2
ethnically diverse representation in c-suite
# companies with all white c-suite 25
# companies with all white c+1i 26
# companies with non-white ceo 16
# companies with ≥ 33% non-white c-suite 13
# companies with ≥ 40% non-white c-suitej 5
# companies with ≥ 50% non-white c-suitek 2
Source: Research by the authors.
Notes:
a. C-suite refers to the CEO and direct reports; C+1 includes only the direct reports of the CEO.
b. Enterprise Products has co-CEOs.
c. IBM and Procter & Gamble
d. ExxonMobil
e. ExxonMobil, Berkshire Hathaway, Amazon, Costco, FedEx, Energy Transfer, TJX, Enterprise Products, and Plains Group
f. Same. No company has a female CEO with all male direct reports.
g. General Motors, Anthem, Lockheed, Best Buy, Oracle (co-CEO), General Dynamics, Progressive
h. Anthem and Cisco
i. Plains Group has an Asian CEO with all white direct reports. All others have all white C-Suite.
j. HP, Merck, UnitedContinental, TIAA, and Coca-Cola
k. TIAA and Coca-Cola
Diversity in the C-Suite
15Stanford CloSer looK SerieS
exhibit 11 — gender representation in c-suite positions and their potential for promotion to ceo or board
Source: Research by the authors.
position ceo / Board potential male female
ceo high 93% 7%
cfo high 86% 14%
p&l leaders high 85% 15%
other Business (functional) executives lower 74% 26%
chief (lead) human resource officer lower 29% 71%
chief (lead) communications officer lower 41% 59%
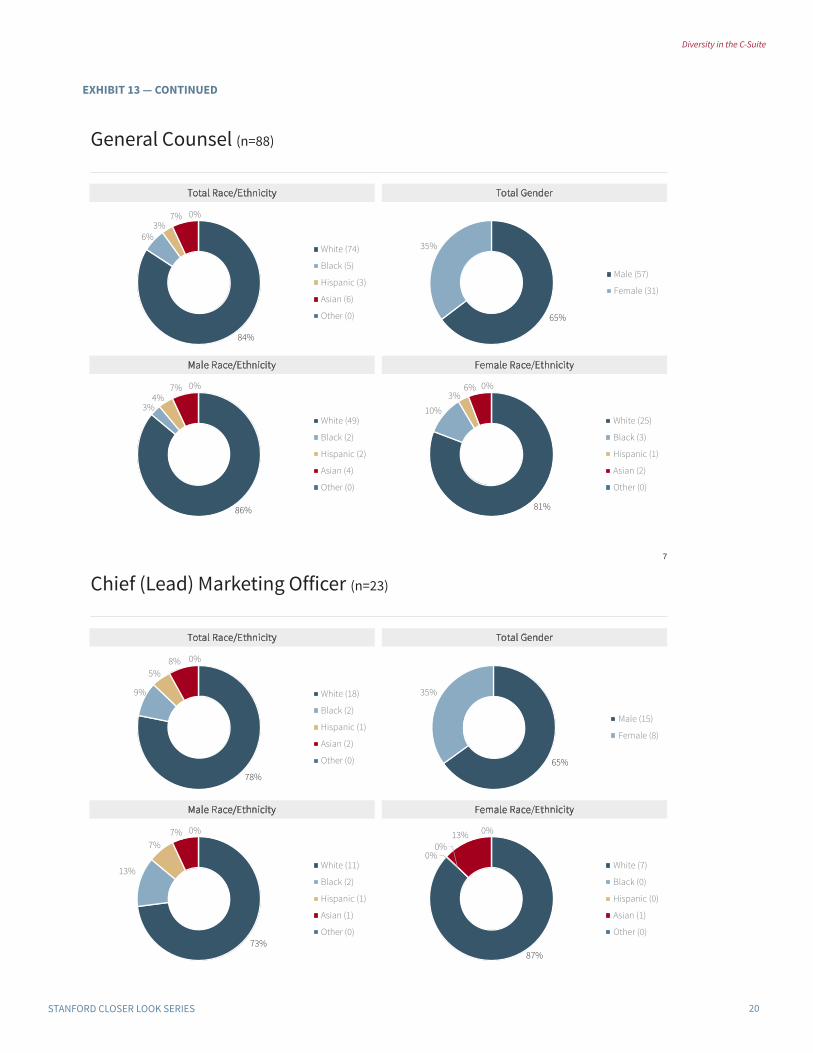
General counsel lower 65% 35%
chief (lead) marketing officer lower 65% 35%
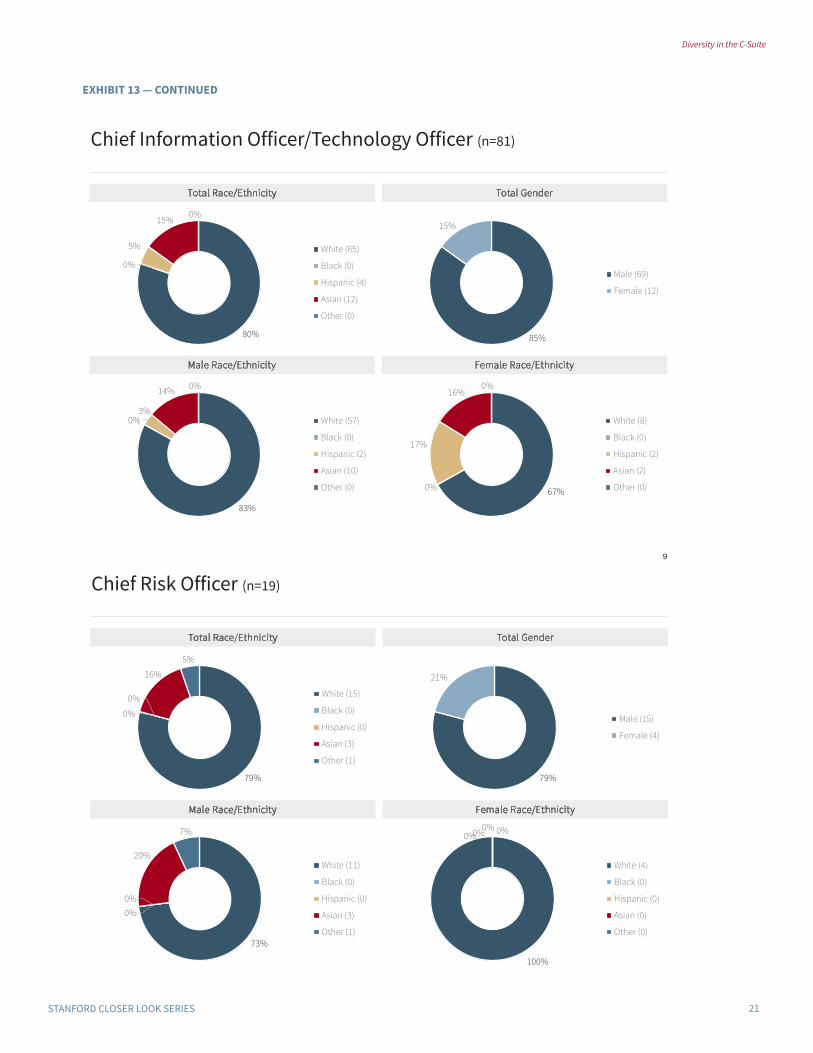
chief information (technology) officer lower 85% 15%
chief risk officer lower 79% 21%
chief (lead) strategy officer lower 91% 9%
chief (lead) sales officer lower 40% 60%
chief (lead) administration executive lower 29% 71%
other staff (functional) executive lower 55% 45%
total 75% 25%
high 87% 13%
lower 62% 38%
Diversity in the C-Suite
16Stanford CloSer looK SerieS
exhibit 12 — racial representation in c-suite positions and their potential for promotion to ceo or board
Source: Research by the authors.
ceo / Board potential ceo / Board potential white Black hispanic asian other
ceo high 84% 3% 5% 5% 3%
cfo high 96% 1% 1% 2% 0%
p&l leaders high 85% 3% 3% 8% 0%
other Business (functional) executives lower 76% 10% 6% 7% 1%
chief (lead) human resource officer lower 83% 13% 3% 3% 0%
chief (lead) communications officer lower 81% 4% 15% 0% 0%
General counsel lower 84% 6% 3% 7% 0%
chief (lead) marketing officer lower 78% 9% 4% 9% 0%
chief information (technology) officer lower 80% 0% 5% 15% 0%
chief risk officer lower 79% 0% 0% 16% 5%
chief (lead) strategy officer lower 73% 0% 5% 18% 5%
chief (lead) sales officer lower 40% 20% 40% 0% 0%
chief (lead) administration executive lower 57% 43% 0% 0% 0%
other staff (functional) executive lower 84% 13% 0% 3% 0%
total 84% 5% 4% 7% 1%
high 87% 3% 3% 7% 1%
lower 80% 7% 5% 8% 1%

Diversity in the C-Suite
17Stanford CloSer looK SerieS
exhibit 13 — gender and racial representation by c-suite position
Chief Executive Officer (n=101)
Total Race/Ethnicity Total Gender
Male Race/Ethnicity Female Race/Ethnicity
84%
3%5%
5% 3%
White (85)
Black (3)
Hispanic (5)
Asian (5)
Other (3)
93%
7%
Male (94)
Female (7)
85%
3%5%
5% 2%
White (79)
Black (3)
Hispanic (5)
Asian (5)
Other (2)
86%
0%0%
0% 14%
White (6)
Black (0)
Hispanic (0)
Asian (0)
Other (1)
1
Chief Financial Officer (n=96)
2
Total Race/Ethnicity Total Gender
Male Race/Ethnicity Female Race/Ethnicity
96%
1%1% 2% 0%
White (92)
Black (1)
Hispanic (1)
Asian (2)
Other (0)
97%
1%1% 1% 0%
White (80)
Black (1)
Hispanic (1)
Asian (1)
Other (0)
92%
0%0% 8% 0%
White (12)
Black (0)
Hispanic (0)
Asian (1)
Other (0)
86%
14%
Male (83)
Female (13)

Diversity in the C-Suite
18Stanford CloSer looK SerieS
exhibit 13 — continued
P&L Leaders (n=349)
3
Total Race/Ethnicity Total Gender
Male Race/Ethnicity Female Race/Ethnicity
85%
4%3%
8% 0%
White (298)
Black (12)
Hispanic (9)
Asian (29)
Other (1)
86%
3%3%
8% 0%
White (256)
Black (9)
Hispanic (9)
Asian (22)
Other (0)
79%
6%0%
13%2%
White (42)
Black (3)
Hispanic (0)
Asian (7)
Other (1)
85%
15%
Male (296)
Female (53)
Other Business (Functional) Executives (n=72)
4
Total Race/Ethnicity Total Gender
Male Race/Ethnicity Female Race/Ethnicity
76%
10%
6%7% 1%
White (55)
Black (7)
Hispanic (4)
Asian (5)
Other (1)
85%
7%4%
4% 0%
White (45)
Black (4)
Hispanic (2)
Asian (2)
Other (0)
53%
16%
10%
16%
5%
White (10)
Black (3)
Hispanic (2)
Asian (3)
Other (1)
74%
26%
Male (53)
Female (19)
Diversity in the C-Suite
19Stanford CloSer looK SerieS
exhibit 13 — continued
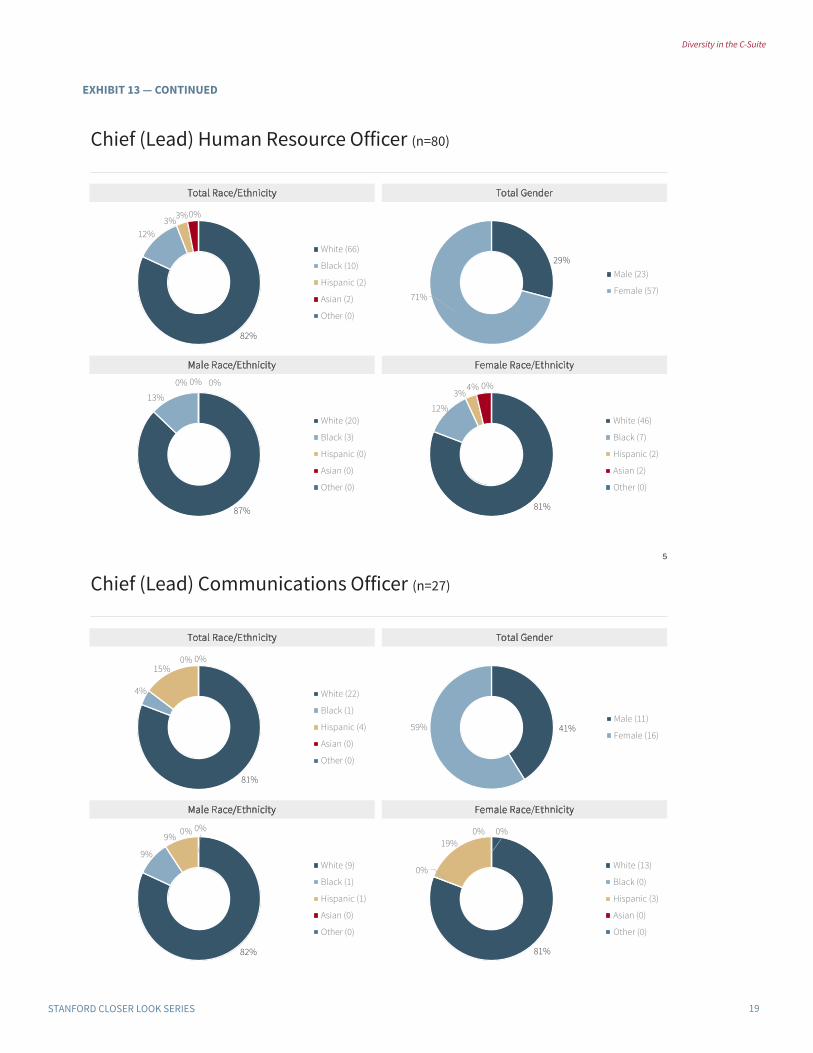
Chief (Lead) Human Resource Officer (n=80)
5
Total Race/Ethnicity Total Gender
Male Race/Ethnicity Female Race/Ethnicity
82%
12%3%3%0%
White (66)
Black (10)
Hispanic (2)
Asian (2)
Other (0)
87%
13%
0% 0% 0%
White (20)
Black (3)
Hispanic (0)
Asian (0)
Other (0)
81%
12%
3%4% 0%
White (46)
Black (7)
Hispanic (2)
Asian (2)
Other (0)
29%
71%
Male (23)
Female (57)
Chief (Lead) Communications Officer (n=27)
6
Total Race/Ethnicity Total Gender
Male Race/Ethnicity Female Race/Ethnicity
81%
4%
15%0% 0%
White (22)
Black (1)
Hispanic (4)
Asian (0)
Other (0)
82%
9%
9% 0% 0%
White (9)
Black (1)
Hispanic (1)
Asian (0)
Other (0)
81%
0%
19%0% 0%
White (13)
Black (0)
Hispanic (3)
Asian (0)
Other (0)
41%59%Male (11)
Female (16)
Diversity in the C-Suite
20Stanford CloSer looK SerieS
exhibit 13 — continued
General Counsel (n=88)
7
Total Race/Ethnicity Total Gender
Male Race/Ethnicity Female Race/Ethnicity
84%
6%3%
7% 0%
White (74)
Black (5)
Hispanic (3)
Asian (6)
Other (0)
86%
3%4%
7% 0%
White (49)
Black (2)
Hispanic (2)
Asian (4)
Other (0)
81%
10%
3%6% 0%
White (25)
Black (3)
Hispanic (1)
Asian (2)
Other (0)
65%
35%
Male (57)
Female (31)
Chief (Lead) Marketing Officer (n=23)
8
Total Race/Ethnicity Total Gender
Male Race/Ethnicity Female Race/Ethnicity
78%
9%
5%8% 0%
White (18)
Black (2)
Hispanic (1)
Asian (2)
Other (0)
73%
13%
7%7% 0%
White (11)
Black (2)
Hispanic (1)
Asian (1)
Other (0)
87%
0%0%
13% 0%
White (7)
Black (0)
Hispanic (0)
Asian (1)
Other (0)
65%
35%
Male (15)
Female (8)
Diversity in the C-Suite
21Stanford CloSer looK SerieS
exhibit 13 — continued
Chief Information Officer/Technology Officer (n=81)
9
Total Race/Ethnicity Total Gender
Male Race/Ethnicity Female Race/Ethnicity
80%
0%
5%
15% 0%
White (65)
Black (0)
Hispanic (4)
Asian (12)
Other (0)
83%
0%3%
14% 0%
White (57)
Black (0)
Hispanic (2)
Asian (10)
Other (0) 67%0%
17%
16%0%
White (8)
Black (0)
Hispanic (2)
Asian (2)
Other (0)
85%
15%
Male (69)
Female (12)
Chief Risk Officer (n=19)
10
Total Race/Ethnicity Total Gender
79%
0%
0%
16%
5%
White (15)
Black (0)
Hispanic (0)
Asian (3)
Other (1)
79%
21%
Male (15)
Female (4)
Male Race/Ethnicity Female Race/Ethnicity
100%
0%0%0% 0%
White (4)
Black (0)
Hispanic (0)
Asian (0)
Other (0)73%
0%0%
20%
7%
White (11)
Black (0)
Hispanic (0)
Asian (3)
Other (1)

Diversity in the C-Suite
22Stanford CloSer looK SerieS
exhibit 13 — continued
Chief (Lead) Strategy Officer (n=22)
11
Total Race/Ethnicity Total Gender
Male Race/Ethnicity Female Race/Ethnicity
73%
0%
4%
18%
5%
White (16)
Black (0)
Hispanic (1)
Asian (4)
Other (1)
75%
0%
5%
15%5%
White (15)
Black (0)
Hispanic (1)
Asian (3)
Other (1)
50%
0% 0%
50%
0%
White (1)
Black (0)
Hispanic (0)
Asian (1)
Other (0)
91%
9%
Male (20)
Female (2)
Chief (Lead) Sales Officer (n=5)
12
Total Race/Ethnicity Total Gender
Male Race/Ethnicity Female Race/Ethnicity
40%
20%
40%
0% 0%
White (2)
Black (1)
Hispanic (2)
Asian (0)
Other (0)
0%
50%50%
0% 0%
White (0)
Black (1)
Hispanic (1)
Asian (0)
Other (0) 67%0%
33%
0% 0%
White (2)
Black (0)
Hispanic (1)
Asian (0)
Other (0)
40%60%Male (2)
Female (3)

Diversity in the C-Suite
23Stanford CloSer looK SerieS
exhibit 13 — continued
Chief (Lead) Administrative Executives (n=7)
13
Total Race/Ethnicity Total Gender
Male Race/Ethnicity Female Race/Ethnicity
57%
43%
0% 0% 0%
White (4)
Black (3)
Hispanic (0)
Asian (0)
Other (0)
0%
100%
0%0% 0%
White (0)
Black (2)
Hispanic (0)
Asian (0)
Other (0)
80%
20%0%0% 0%
White (4)
Black (1)
Hispanic (0)
Asian (0)
Other (0)
29%
71%
Male (2)
Female (5)
Other Staff (Functional) Executives (n=38)
14
Total Race/Ethnicity Total Gender
Male Race/Ethnicity Female Race/Ethnicity
84%
13%0%3% 0%
White (32)
Black (5)
Hispanic (0)
Asian (1)
Other (0)
86%
9%0%5% 0%
White (18)
Black (2)
Hispanic (0)
Asian (1)
Other (0)
82%
18%0% 0% 0%
White (14)
Black (3)
Hispanic (0)
Asian (0)
Other (0)
55%
45%Male (21)
Female (17)