diversity and reach of penn state extension …
TRANSCRIPT

The Pennsylvania State University
The Graduate School
Department of Agricultural Economics, Sociology and Education
DIVERSITY AND REACH OF PENN STATE EXTENSION PROGRAMS AND EFFECT
OF BROKERAGE AND NETWORK POSITION ON EXTENSION PROGRAM
OUTCOMES THROUGH SOCIAL NETWORK ANALYSIS (SNA)
A Thesis in
Agricultural and Extension Education
by
Anil Kumar Chaudhary
© 2014 Anil Kumar Chaudhary
Submitted in Partial Fulfillment
of the Requirements
for the Degree of
Master of Science
August 2014

ii
The thesis of Anil Kumar Chaudhary was reviewed and approved* by the following: Rama Radhakrishna Professor of Agricultural and Extension Education Thesis Adviser
Edgar Yoder Professor of Agricultural and Extension Education
Wenpin Tsai Professor of Business Administration
Connie Baggett Associate Professor of Agricultural and Extension Education Program Chair of Agricultural and Extension Education
*Signatures are on file in the Graduate School.

iii
ABSTRACT
This study was designed to understand the diversity and reach of Cooperative Extension
programs in Pennsylvania delivered by Penn State Extension and the influence of network
variables (brokerage and centrality) on program outcomes (program business performance and
demand for the program) using Social Network Analysis (SNA).
The study was conducted at Penn State Extension (PSE), the outreach wing of the College of
Agricultural Sciences at the Pennsylvania State University. The population for this study
consisted of all the programs offered by Penn State Extension and the program stakeholders. The
sampling method used for this study was a ‘census’ of all programs and their stakeholders. The
study utilized the SNA methodology and ex-post facto research design. The independent
variables used in the study were the network variables, which included five types of brokers
(liaison, gatekeeper, representative, itinerant, and coordinator), and degree centrality of
Extension programs. There were two dependent variables, change in program business
performance and change in demand for the programs. The independent variables were analyzed
using UCINET 6 and network maps were drawn using NetDraw’s spring embedding algorithm.
Data were analyzed using the Statistical Package for Social Sciences (SPSS 21). Binary logistic
regression was used to test the hypotheses. The study had four hypotheses regarding influence of
network variables (degree centrality, gatekeeper brokerage, consultant brokerage, and liaison
brokerage) on Extension program outcomes (program business performance and demand for the
programs).
Results showed that network of Penn State Extension is widespread and programs are well
connected to stakeholders in the form of number of stakeholders and connections of programs to

iv
stakeholders. Analysis using backward Wald binary logistic regression revealed that all the
independent variables together (degree centrality, gatekeeper brokerage, consultant brokerage,
and liaison brokerage) were statistically significant in predicting the business performance of
programs but were unable to significantly explain the change in demand for the programs. Only
degree centrality statistically predicted the change in business performance of programs but it
had no relationship with demand for Extension programs. None of the other variables
significantly predicted the change in business performance or demand for the programs.
Overall, it can be concluded that, SNA is useful to understand the outreach of Extension and in
understanding various outcomes of Extension programs. Based on the findings of the study, it is
recommended that emphasis be placed to encourage collaboration among various programs, a
need for systematic and accurate data collection and management that provides reliable data for
all Extension activities. Further, it is recommended that future research be conducted by using
the egocentric network to understand the all actors involved in Penn State Extension.
Key Words: Social Network Analysis (SNA), Cooperative Extension, Reach, Programs,
Stakeholders, Brokerage, Degree Centrality

v
TABLE OF CONTENTS
List of Tables……………………………………………………………………………………viii
List of Figures…………………………………………………………………………………….ix
Acknowledgements……………………………………………………………………………….x
CHAPTER 1 ……………………………………………………………………………………...1
INTRODUCTION……………………………………………………………………………1
Cooperative Extension System (CES)………………………..………………………1
Penn State Extension…………………………………………………………………2
Technology in Extension……………………………………………………………..3
Role of Social Network Analysis…………………………………………………….4
Significance or the Need for the Study………………………………………………6
Reorganization of Extension…………………………………………………………6
Purpose and Objectives……………………………………………………………..10
Hypothesis/ Research Questions……………………………………………………10
Assumptions………………………………………………………………………...11
Limitations…………………………………………………………………………..11
Operational Definitions……………………………………………………………..12
Organization of Thesis……………………………………………………………...14
CHAPTER 2…………………………………………………………………………………….15
REVIEW OF LITERATURE ………………………………………………………………15
Use of SNA and Study of Various
Network Characteristics …………………………………………………….……...16
Brokerage and its Effect on
Program/Organization/Individual Business Performance and
Demand of Program/Product/Organization ………………………………………..23
Brokerage…………………………………………………………………………...23
Centrality in general and specifically
Degree Centrality and its Effect on Program/Organization/Individual
Business Performance and Demand of
Program/Product/Organization……………………………………………………...33
Centrality……………………………………………………………………………33
Summary……………………………………………………………………………40
CHAPTER 3…………………………………………………………………………………….42
METHODOLOGY…………………………………………………………………………42
Population and Sample……………………………………………………………...44
Research Design…………………………………………………………………….44

vi
Variables of the study and Data Collection…………………………………………45
Independent variables……………………………………………………………….45
Dependent Variables………………………………………………………………..47
Data Analysis and Interpretation……………………………………………………49
CHAPTER 4..……………………………………………………………………………………53
RESULTS AND FIDINGS…………………………………………………………………53
Objective 1………………………………………………………………………….54
Objective 2………………………………………………………………………….68
Objective 3………………………………………………………………………….75
CHAPTER 5…………………………………………………………………………………….80
SUMMARY, CONCLUSIONS AND RECOMMENDATIONS………………………….80
Purpose and Objectives……………………………………………………………..80
Hypotheses/ Research Questions……………………………………………………81
Summary of Study Procedures……………………………………………………...81
Summary of Results………………………………………………………………...84
Objective 1………………………………………………………………………….84
Finding ……………………………………………………………………84
Conclusions……………………………………………………………….86
Discussion………………………………………………………………...87
Objective 2………………………………………………………………………….88
Findings…………………………………………………………………..88
Conclusions………………………………………………………………89
Discussion………………………………………………………………...90
Objective 3…………………………………………………………………………91
Findings…………………………………………………………………..91
Conclusions………………………………………………………………92
Discussion………………………………………………………………...93
Recommendations for Extension Administration………………………………….94
Recommendations for accountability and reporting……………………………….94
Recommendations for further research…………………………………………….95
CHAPTER 6..……………………………………………………………………………………96
INTAD EXTRA CHAPTER………………………………………………………………..96
Introduction…………………………………………………………………………97
Goals and Objectives………………………………………………………………..99
Target audiences of the program…………………………………………………..102
What needs to be known about target audiences…………………………………..104
How the information about target audiences need to be collected………………..104

vii
Potential challenges to reach the target audiences………………………………...105
Strategies for program development………………………………………………105
Strategies for program implementation……………………………………………106
Strategies for program evaluation…………………………………………………106
Ways to increase program sustainability………………………………………….107
What other critical questions……………………………………………………...107
REFERENCES………………………………………………………………………………...109
APPENDICES…………………………………………………………………………………116
APPENDIX A: IRB Application ………………………………………………………….116
APPENDIX B: Survey Electronic Mails…………………………………………………..118
APPENDIX C: MS Thesis Survey Questionnaire………………………………………...122
APPENDIX D: Additional data for Extension …………………………………………...127

viii
LIST OF TABLES
TABLES Page
1. List of Programs and Values of Degree Centrality for each
Program……………………………………………………………………………….54
2. List of Teams and Values of Degree Centrality for each team……………………….57
3. List of Programs and Values of Different Brokerage
Types for each Program………………………………………………………………58
4. Increase in Grants and Contracts (Business Performance)…………………………...69
5. Logistic Regression Analysis of Change in Program’s Business
Performance Status as a function of Degree
Centrality and Brokerage Measures…………………………………………………..74
6. The Observed and Predicted Frequencies for change in
Programs’ Business Performance Status by
Logistic Regression with the cutoff of 0.50…………………………………………..74
7. Direct Contact for the Programs (Face to Face)……………………………………....75
8. Logistic Regression Analysis of Change in Demand for the
Program Status as a function of Degree Centrality and
Brokerage Measures…………………………………………………………………..79

ix
LIST OF FIGURES
FIGURES Page
1. Organization and Reporting Structure of Penn State Extension…………………….....9
2. An example of brokerage process adapted from
Stovel and Shaw (2013)………………………………………………………………24
3. Different types of Brokerage Structures as adapted from
Gould & Fernandez (1989)…………………………………………………………...26
4. Conceptual Framework of the Study…………………………………………………43
5. Overall Network of Penn State Extension
(Programs and their Stakeholders)…………………………………………………….63
6. Overall Network of Penn State Extension
(Programs and their Government Stakeholders)……………………………………..65
7. Overall Program Network……………………………………………………………66
8. Overall Network of Penn State Extension
(Teams and their Stakeholders)………………………………………………………68
9. “SNA Education Program for Karnataka State
Extension Education Unit” Logic Model…………………………………………...101

x
ACKNOWLEDGEMENTS
I would like to convey special thanks to all those who had supported me for last two years in
successful completion of my MS Thesis. Special thanks to Dr. Rama Radhakrishna, my advisor
and committee chair, for his continuous encouragement and support throughout my degree
program. I would also extend my thanks to my committee members, Dr. Edgar Yoder and
Dr.Wenpin Tsai for their continuous support. I would further extend my thanks to Penn State
Extension Director, Dr. Dennis Calvin, Extension program leaders, State Extension team leaders,
and staff at Extension communication office and grants office for their kind support in providing
data for my study. Also special thanks to all the faculty members and graduate students in
Agricultural and Extension Education program who provided moral support during last two
years. I am very much thankful to my parents (Mr. Vidhyadhar Singh and Mrs. Sulochana Devi),
my brother (Ajit Singh Chaudhary) and other family members for their kind support and
encouragement during the whole degree program. I would also like to thank my special friend
Pari, for her continuous moral and emotional support.

1
CHAPTER 1
INTRODUCTION
Cooperative Extension System (CES):
Extension has a long history of delivering programs to clientele. In the last 100 years,
Cooperative Extension System (CES) has gained the reputation as the most effective technology
diffusion organization along with being the largest non-formal adult education organization in
the world (Franz & Towson, 2008; Rogers, 1992). CES personnel have a very good
understanding of the current problems and issues and they strive to provide appropriate solutions
for communities to prosper and individuals to live better. According to Mincemoyer, Perkins and
Lillehoj (2004), CES is a community based organization in US which addresses societal issues
through direct connection with research expertise available in the land grant universities.
CES in land grant universities functions by offering various non-formal, non-credit educational
programs in areas such as agricultural crop production, economic and community development,
animal production, family and consumer sciences, 4-H and youth development, nutrition, diet
and health and conservation of environment and natural resources (Franz & Townson, 2008;
NIFA, n.d.). CES addresses the complex issues facing society in rural, urban and suburban areas
through the above mentioned educational programs with grass roots level involvement in
problems/issues identification for individuals, community organizations and overall
communities. Typically CES maintains local offices in most of the nation’s 3000 counties and
with the help of thousands of extension educators and specialists across the United States (Bull,
Cote, Warner, & McKinnie, 2004; NIFA, n.d.; Rasmussen, 1989).

2
CES in the last 100 years has addressed various issues and crises in local communities, such as
serving as a catalyst for improvement of crop productivity, helping communities to withstand
local issues such as regional droughts and local economic depressions to national crisis of great
depression and both world wars (Cartwright, Case, Gallagher, & Hathaway, 2002; Rasmussen,
1989).
In the past 20 plus years many trends has affected the CES. These include change in clientele
demographics and target audiences, migration of a predominate rural population to cities,
reduction in number of farms and farm population, mismatch between collaboration of research
and Extension, new technologies, and the way Extension has been funded. But CES sustained or
adapted to these changes and this year (2014) CES celebrated its 100th Anniversary (Ilvento,
1997; Peters, Franz, 2012). Now, to be sustainable for the next 100 years CES personnel should
be receptive to adapting to change, accepting new technologies, and developing new financial
partners. To be sustainable CES personnel have to consider the needs of undeserved audiences in
suburban and urban areas (Bull, et al., 2004; Calvin, 2010).
Penn State Extension:
Penn State Extension (PSE) housed in College of Agricultural Sciences had served the
communities and businesses in the commonwealth of Pennsylvania in various ways through its
unbiased, science-based educational programs developed using relevant and appropriate research
findings. Over these years “ demonstrations of new technology, farming methods, environmental
stewardship and management practices, leadership skills, home management skills, healthy
living skills, citizenship, and youth development have helped farmers remain profitable,
communities remain economically, politically, and socially viable, families remain

3
economically, emotionally, and physically healthy, and children develop into productive
citizens” (Calvin 2010, p. 9). On the 100th
anniversary, Dr. Calvin (Director of PSE) said, "We
need to adapt to changing demands and not simply live off the legacy of the last 100 years”
(Calvin, 2014, pp. 16).
Technology in Extension:
There has been great advancement in the development and use of technology in the last two
decades. Knowledge disseminated through technology has become the central focus of a global
economy, specifically to CES; as it is the organization which transfers research based knowledge
from land grant universities to the general public to address the societal issues (Albright, 2000;
Gregg & Irani, 2004; Green, 2012; Guenthner & Swan, 2011).
In 2008, 35% of adults in the US had an account on various social networking sites compared to
only 5% in 2005, and this trend is growing at a very fast pace as exhibited by Facebook which
had 300 million unique users in 2009. This trend is not prevalent only in urban and suburban
areas but also in rural areas. High speed internet access in rural areas increased by 22% from
2008 to 2009 (Corbett, 2009; Horrigan, 2009; Lenhart, 2009). This growing trend in use of
technology by CES stakeholders is presenting both challenges and opportunities for Extension
educators and administrators (Diem, Hino, Marting, & Meisenbach, 2011; Green, 2012;
Guenthner, & Swan, 2011).
A number of studies have been conducted related to the use of technology by Extension
educators and Extension clientele, successful use of technology by Extension professionals and
readiness of Extension to adopt new technologies (Diem et al., 2011; Green, 2012; Gregg &

4
Irani, 2004; Guenthner & Swan, 2011; West, 2007). The general consensus from these studies
suggests the following:
Top technologies used by Extension stakeholders mainly farmers were email, text
messaging, digital photos, YouTube and Wii.
Extension agents have embraced information technology in their job responsibilities with
expanded use of e-mail, presentation software, and word processing. These were the
highest used technologies by them.
Technology is a powerful, affordable, easy to use and reliable method to conduct
program evaluation more efficiently and easily.
Technology can be successfully utilized by Extension educators to enhance their outreach
capabilities to thousands of stakeholders across US with research based information.
Time, money and training were identified as key barriers to technology adoption by
Extension educators along with fear of losing traditional audiences due to using
technology and new methods of program delivery.
In an environment of deep budget cuts, tight funding and shifts in demographics in US, CES has
to embrace the use of technology in conducting their routine activities in order to do more with
limited resources, reach larger numbers of clientele, serve new audiences and showcase the
public value of its programs to stakeholders through new program evaluation methods such as
Social Network Analysis (SNA).
Role of Social Network Analysis:
Social Network Analysis (SNA) is a methodology which provides complementary visual and
statistical components for analyzing the traits of actors and their relationships in a network.

5
Brass, Galaskiewicz, Greve & Tsai (2004) defined network “as a set of nodes and the set of ties
representing some relationship, or lack of relationship, between the nodes” (p. 795). Nodes are
the actors such as individuals, groups, subunits, and organizations and ties are the relationships
between these various actors. The relationships can be friendship, advice, common membership
to any institution or depend on the need of the study. According to network perspective, actors
are embedded within the network of interconnected relationships which provides both
opportunities and constraints on the behavior of actors. A holistic network approach also helps
researchers to capture the functioning/interaction of any individual actor/unit within the network
as a whole (Brass et al., 2004; Kilduff & Tsai, 2003).
SNA methodology has been widely utilized in disciplines such as sociology, business
management and public health for understanding various individual or organizational outcomes
(Springer & de Steiguer, 2011). SNA has been used in a diversity of applications, including
analyzing roles of intra-firm networks and corporate business partnerships (Tsai & Ghoshal,
1998); and examining how ideas and information are transferred amongst a field of
professionals, understanding the role of networks in various organizational outcomes (Brass et
al., 2004). However, this methodology is still underused in agricultural and extension education
and literature on SNA studies in agricultural and extension education is scarce.
Bartholomay, Chazdon, Marczak and Walker (2011) conducted a study to examine the outreach
of University of Minnesota (UM) Extension to organizations outside UM. They utilized the SNA
as the methodology to understand the outreach of UM. They found that the outreach network of
UM Extension was both broad in its reach and strong in its connection. They concluded that
SNA has great potential to describe and understand the Extension outreach. Springer and De
Steiguer (2011) also concluded that SNA has much to offer for Extension professionals and
6
specifically the visual and statistical elements in SNA. In another study, Roberts, Murphy and
Edgar (2010) using SNA methodology recommended that teacher educators have to understand
the social networks of student teachers for better learner to learner interaction.
Significance or the Need for the Study:
According to Extension Committee on Organization and Policy (ECOP), Cooperative Extension
System (CES) is regarded as the “best kept secret” by the land grant universities. They found that
only 3% of total population knows about Extension and in that population less than 30% of
agricultural population knows about CES (Calvin, 2012). Over the past few decades there has
been a shift in demographics in suburban and urban areas across the US and in Pennsylvania
which led to a decreasing proportion of the population staying in rural areas and less than 2% of
the population engaged in agriculture (Calvin, 2012; Franz & Townson, 2008; Ilvento, 1997;
Peters & Franz, 2012). In addition, there have been deep budget cuts, complex accountability and
staffing structures, widely varying programs and delivery methods and increasing anti-
intellectual and anti-governmental sentiments (Peters & Franz, 2012). These factors have
contributed to CES personnel being in a defensive position across the US and Pennsylvania
(Calvin, 2010; Calvin, 2012; Franz & Townson, 2008; Ilvento, 1997).
Reorganization of Extension:
In 2007, to meet the needs of new and traditional stakeholders and sustain the organization in
times of tight funding structures, the Cooperative Extension in the College of Agricultural
Sciences at the Pennsylvania State University entered a process called “Reframing.” As a result
of this reframing, Cooperative Extension was divided into 19 Natural Work Groups (NWGs)
delivering 81 state Extension programs. These 81 state programs were regarded as the major
7
educational efforts by Cooperative Extension to address the key issues faced by the residents of
Pennsylvania. Prior to reframing in 2007, Cooperative Extension delivered 700 different
programs (Calvin, 2010).
With the University Core Council’s recommendations for improvement in the organization and
operation of the College of Agricultural Sciences and Cooperative Extension amidst budget cuts
for Cooperative Extension in FY2011-12, Cooperative Extension underwent another
restructuring in 2011. Cooperative Extension adopted a new “business model” and renamed itself
“Penn State Extension (PSE)” to improve its visibility in communities of Pennsylvania as one
organization offering different educational programs to address societal issues rather than being
known by varied education programs such as 4-H and Master Gardner’s (Calvin, 2012).
Based on the recommendation and input from within the PSE and from stakeholders of PSE, five
statements were developed to characterize the attributes of PSE:
A unified, agile organization focused on strategic areas of excellence
With a team approach to research and educational program development and delivery
Distributed through a county-based presence addressing local needs
In collaboration with diverse, statewide partnerships
Providing stakeholders with university access to research-based information through
high quality, consistent educational programs delivered using diverse technologies and
formats (Calvin, 2012, The New Extension, pp.2).
In the new PSE, leadership at 67 counties in Pennsylvania was consolidated into 19 Districts and
two urban counties. Each of the district directors in the new system were responsible for 2-5
counties and have the sole responsibility of leadership and management of PSE at the county

8
level with no personal obligation for specific Extension program development and delivery. At
the same time the new PSE was reorganized into 11 Penn State Extension Teams replacing the
earlier 19 Natural Work Groups. These 11 teams are responsible for educational program
development and delivery within 11 Program Priority Initiatives (PPIs) to address the issues
faced by the residents in Pennsylvania. These 11 teams have to work collaboratively to deliver
the educational programs that satisfy 11 PPIs. These teams have to deliver a minimum of two
programs each to satisfy PPIs and may deliver additional programs if there exists a clear need by
stakeholders that were not addressed by these11 priority areas. This effort reduced the total
number of programs offered by PSE to 20-30 as compared to 82 programs in the previous model.
The program development and delivery for 11 teams are supervised by the seven program
leaders across the state. The 11 teams under the new PSE model are:
Dairy
Poultry
Equine
Livestock
Field and Forage Crops
Renewable Natural Resources
Horticulture
Family and Consumer Sciences
Food Safety and Health
4-H Youth Development
Ag Entrepreneurship, Economic and Community Development
Recently (2014), a 12th
team was added to the PSE called Veterinary. The 11 priority areas for
PSE are:
Animal Welfare and Environments
Water
9
Food Safety and Processing
Sustainable Agricultural Businesses
Pest Prediction/Response
STEM Education and Positive Youth Development
Rural Safety and Health
Gas Drilling (Marcellus Shale and other gas fields)
Bio-based On-Farm Energy Production and Use
Childhood Obesity
Green Infrastructure (Calvin, 2012)
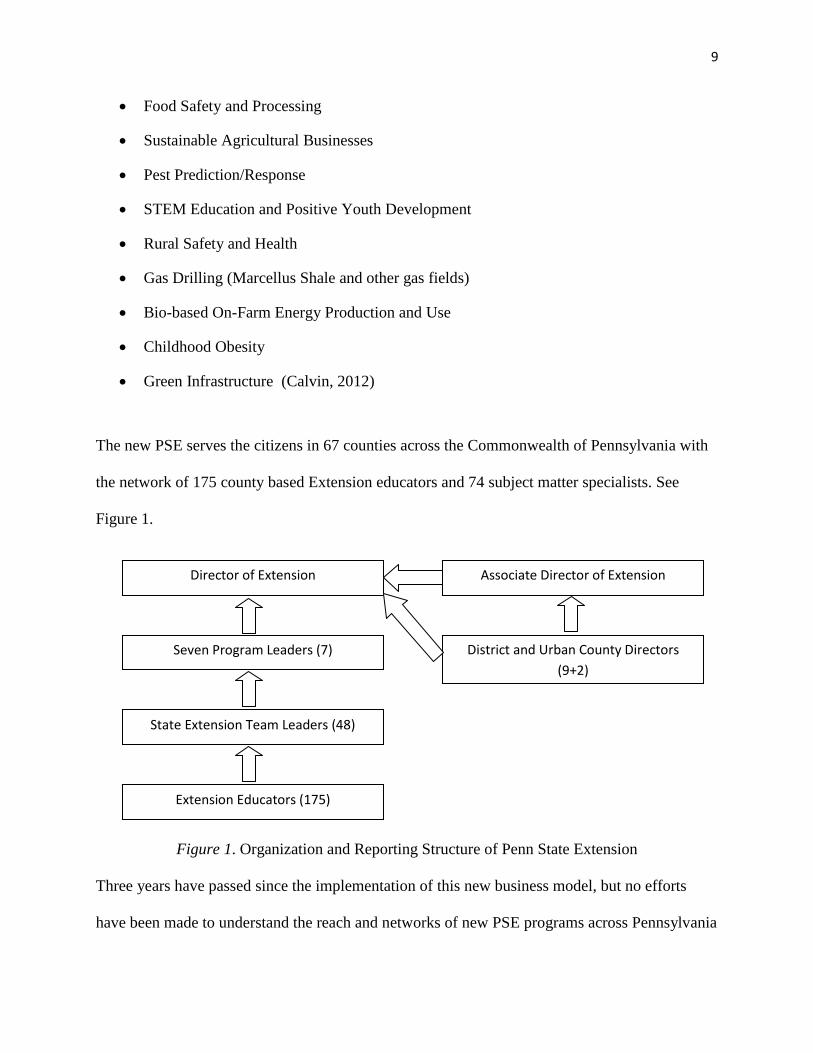
The new PSE serves the citizens in 67 counties across the Commonwealth of Pennsylvania with
the network of 175 county based Extension educators and 74 subject matter specialists. See
Figure 1.
Figure 1. Organization and Reporting Structure of Penn State Extension
Three years have passed since the implementation of this new business model, but no efforts
have been made to understand the reach and networks of new PSE programs across Pennsylvania
Director of Extension
Seven Program Leaders (7)
State Extension Team Leaders (48)
Extension Educators (175)
District and Urban County Directors
(9+2)
Associate Director of Extension

10
and how successful PSE is in adaptation of its new business model, to current funding
requirements and in addressing the issues faced by the citizens of Pennsylvania. Thus, this study
was designed to determine the diversity and reach of PSE.
Purpose and Objectives:
The purpose of this study was to understand the diversity and reach of Cooperative Extension
programs in Pennsylvania delivered by Penn State Extension and the influence of various
network variables (Brokerage and Centrality) on two program outcomes (program business
performance and demand for the program) through Social Network Analysis (SNA). Specific
objectives of the study were to:
1. Develop a holistic network map of programs and program stakeholders to understand the
diversity and reach of Extension programs in Pennsylvania.
2. Examine the influence of five types of brokerage (liaison, itinerant, gatekeeper,
representative, and coordinator) and degree centrality on Extension program business
performance.
3. Examine the influence of five types of brokerage (liaison, itinerant, gatekeeper,
representative, and coordinator) and degree centrality on demand for Extension programs.
Hypotheses/ Research Questions:
The following four hypotheses guided the study:
Hypothesis 1: For all five types of brokerage (liaison, itinerant, gatekeeper, representative and
coordinator), programs which control the flow of information and resources between pairs of
other programs are hypothesized to have higher business performance than the programs that do
not control the flow of information and resources.

11
Hypothesis 2: The higher the degree centrality of the program, greater would be its business
performance.
Hypothesis 3: For all five types of brokerage (liaison, itinerant, gatekeeper, representative and
coordinator), programs which control the flow of information and resources between pairs of
other programs are hypothesized to have greater demand among stakeholders than the programs
that do not control the flow of information and resources.
Hypothesis 4: The higher the degree centrality of the program the greater would be its demand
among the stakeholders.
Assumptions:
One of the major assumptions of the study was that if a program is occupying any of the five
type of brokerage (liaison, itinerant, gatekeeper, representative, and coordinator) position in the
network and with higher values for the degree centrality then that program will perform better in
the business and has more demand from the stakeholders of CES in Pennsylvania.
Limitations:
One of the limitations of the study was that the data for the two dependent variables, program
business performance and demand for the program, was collected through secondary data
provided by Extension administration. The researcher, based on a brief review of major activities
in each program, segregated the data for both dependent variables into 60 program areas.
Another limitation of the study was considering the increase/change in both dependent variables
from year 2011-12 to 2013-14, and year 2013-14 was not completed, so the researcher used the
latest available data for business performance measured by grants and developmental funding

12
till 15th
March and assumed that this represents the overall number of grants and contracts for the
year 2013-14. Demand of the program was operationally measured by face-to-face direct
contacts of the program. The researcher was unable to get the complete data for the year 2013-
14, so the researcher used the available data for three years (2010-11, 2011-12 and 2012-13) and
using this three year data, the researcher projected the data for the year 2013-14. Regarding data
for the independent variables, the researcher relied on program leaders and state extension team
leaders to provide the list of programs and the program stakeholders. Based on their input, the
researcher drew the complete network of PSE and calculated the other independent variables of
the study.
The number of cases in the study is exactly equal to the minimum number of cases required for
the binary logistic regression, which also may have affected the results. Caution should be used
in interpreting the results of the study, as results are applicable to PSE and as such cannot be
generalized beyond Pennsylvania.
Operational Definitions:
Extension program: A program is defined as a set of orchestrated educational experiences
purposefully selected to address a locally identified need or issue of broad public concern
(Rennekamp, 1995).
The researcher created the following criteria to define a program to be included in the study:
Conducted throughout the Commonwealth of Pennsylvania
The program is in operation for a minimum of three years
A major initiative of each specific state Extension team, such as Master Gardeners,
Dining with Diabetes, Better Kid care

13
Workshops, webinars and courses were not considered as a program.
Stakeholders: Stakeholders are who have direct or indirect vested interest in the Extension
program. Researcher included both direct and indirect stakeholders.
Brokerage: Is the extent to which a program links otherwise with unconnected other programs.
Liaison broker: It is a type of brokerage relation in which two unconnected programs and broker
program occupy the three different separate teams, i.e., program which is acting as a broker, the
program which is being brokered by the broker and program for which broker is doing brokering.
Itinerant broker: It is a type of brokerage in which two unconnected programs may belong to
same team while the broker program belongs to a different team.
Gatekeeper broker: It is the kind of brokerage in which the broker program and one of the
unconnected programs belongs to same team and the other unconnected program belongs to
different team. The broker program is the controller for incoming information to its team and it
has to decide whether to grant access of this information to its team or not.
Representative broker: It is the kind of brokerage in which the broker program and one of the
unconnected programs belongs to same team and the other unconnected program belongs to
different team. In this, a broker program of the team represents the complete team and negotiates
to outside unconnected program teams on behalf of its team.
Coordinator broker: It is a kind of brokerage in which all three programs belong to the same
team and the brokerage relationship is completely internal to the group.
Centrality: It is operationally defined as how a program is central in the network compared to
other programs.

14
Degree centrality: It is the number of direct ties a program has with other programs in the
complete network of Extension programs offered by PSE.
Business performance of Extension program: Business performance of an Extension program
refers to the total amount of grants and developmental funding received for that specific
program. Additional revenue sources such as fees, sale of publications and other sources of
funding were not included in calculation of business performance of Extension programs.
Demand for the Extension program: The number of direct face-to-face contacts for each
program.
Organization of Thesis:
This thesis is divided into six chapters. The first chapter, “Introduction,” describes the history of
CES, Penn State Extension, and use of technology in Extension, importance of SNA, and
purpose and limitations of the study. The second chapter, “Review of Literature,” provides an
overview of literature reviewed as per objectives of the study. Chapter three, “Methodology,”
provides a description of how, from whom and what data were collected for the study and how
the collected data was analyzed. Chapter four “Results,” presents the major findings of the study
by objectives. Chapter five “Conclusions and Recommendations,” discusses the findings, its
practical significance and suggestions for future research.
Chapter six, application of SNA to international agriculture and education settings (in this case,
India), is a fulfillment for the dual title degree program in International Agriculture and
Development (INTAD). Consequently, a detailed review of the application of SNA to Indian
agricultural Extension is discussed.
15
CHAPTER 2
REVIEW OF LITERATURE
The purpose of this study was to understand the diversity and reach of Cooperative Extension
programs in Pennsylvania delivered by Penn State Extension and the influence of various
network variables (Brokerage and Centrality) on two program outcomes (program business
performance and demand for the program) through Social Network Analysis (SNA). Specific
objectives of the study were to:
1. Develop a holistic network map of programs and program stakeholders to understand the
diversity and reach of Extension programs in Pennsylvania.
2. Examine the influence of five types of brokerage (liaison, itinerant, gatekeeper,
representative, and coordinator) and degree centrality on Extension program business
performance.
3. Examine the influence of five types of brokerage (liaison, itinerant, gatekeeper,
representative, and coordinator) and degree centrality on demand for Extension programs.
The researcher found that there is limited literature related to application of Social Network
Analysis (SNA) in agricultural and extension education and specifically to Cooperative
Extension Service (CES) to examine the reach of Extension programs in the communities and to
evaluate the Extension programs using social network perspective. Therefore, the researcher has
attempted to present select literature available related to the profession of agricultural and
extension education, but mostly relied on the studies completed in business management, public
health and sociology professions.

16
This chapter is divided into three broad areas: (1) use of SNA and study of various network
characteristics, (2) brokerage in general and specifically five types of brokerage and its effect on
program/organization/individual business performance and demand of
program/product/organization, (3) centrality in general and specifically degree centrality and its
effect on program/organization/individual business performance and demand of
program/product/organization.
Use of SNA and Study of Various Network Characteristics:
The societal structure described using interaction between members of society or networking
among organizations can be best understood as network of relations, therefore SNA can be
described as a useful tool to define and describe different organizations and for assessing the
impact of various organizational structures (Zack, 2000). SNA can be defined by relations
between individuals or group of individuals or organizations and defines society as constituted of
networks made up of relationship or ties between actors or nodes (Williams, 2005). The
arrangement these ties assume is defined as the ‘Social Structure,’ which means way individual
actor act in the network is not only defined by the personal attributes of actor but also influenced
by pattern of relations in which the actor is embedded (Vera & Schupp, 2006). Based on the
level or focus of analysis, nodes in the network may represent different entities such as
individuals, groups of individuals, technology, the entire organization, or even countries that
mean whatever being the unit of analysis for the researcher form the unit/organization being
studied (Zack, 2000). Relationship or ties defines the flow of resources between the nodes/actors
which can be material or non-material (Wasserman & Faust, 1994) and these “resources might
include social support, emotional support, companionship, time, information, expertise, money,
business transactions, shared activity, and so on.” (Williams, 2005, p. 22). The relationship

17
between two nodes/actors can be either informal means based on trust or formal means the
relationship is bounded by formal contract (Provan, Fish, & Sydow, 2007). Wasserman and
Faust (1994) proposed four theoretical propositions to define SNA:
Actors in all social systems are interdependent, not independent.
Actors are related through links that channel information, affection, and other
resources.
The structure of those relations both constrains and facilitates action.
The patterns of relations among actors define economic, political and social structures
(p. 4).
SNA perspective which includes both method and theory, restricts studying the individual
relationship in isolation from the network which the individual is the part, that’s why ‘dyad,’ or
relationship between two individuals/actors is the building blocks of the network study (Borgatti
& Everett, 1997; Williams, 2005). In traditional social sciences the data set would be a person-
by-attribute matrix, where individual is the point of study and individual attributes of the
individual were the variables. But in network studies, the data set would be person-by-person
matrix, which is recording the single variable (dyadic attribute) among a set of actors (Borgatti &
Everett, 1997).
In a network, all nodes are not connected to every other node, which in turn differentiates one
network with other networks. Some clusters in a network are densely knit, where most of the
nodes are connected to each other, while others are loosely knit and both clusters are connected
via sparsely connected areas called bridges (Williams, 2005). Resources that are shared across

18
nodes through are finite and that make these resources scarce, which in turn produce the
hierarchy structure in the previous neutral network. This hierarchy in the network in turn
describes the feature that some nodes in the network are central while others are peripheral. The
resources attenuates as they travel from one node to another, which in turn influences the
accessibility of resources by various nodes in the network based on their position in the network
as central or peripheral (Williams, 2005).
SNA originally started as a descriptive way of representing the networks graphically, gradually
evolved from a technique to represent the networks graphically to a methodology with various
explanatory powers by analyzing the data on social relations through relational data analysis
(Butts, 2008; Gould, 2003; Vera, & Schupp, 2006).
Depending on the level of analysis, the networks can be dealt in two ways: egocentric and whole
network. The ‘egocentric’ approach deals with the role of individual actor with respect to the
characteristics of networks in which that individual is embedded, whereas the ‘whole network’
approach considers the structure of entire network in describing certain organizational outcomes
or social phenomenon (Borgatti & Everett, 1997; Butts, 2008; Vera & Schupp, 2006).One
challenge for researchers in describing SNA data was to define network boundary (Butts, 2008).
In understanding the various phenomenon in social sciences, SNA can be applied in five major
themes: “the structure and functioning of organizations; genealogies of knowledge formation and
transmission; the operationalization of social capital concepts; the diffusion of information and
innovation; and the regulation of social networks” (Vera & Schupp, 2006, p. 410). The current
study falls into first theme that the structure and functioning of organizations.

19
Over the years, studying the network variables has become an important approach in
understanding various organizational outcomes (Brass, et al., 2004; Stevenson & Greenberg,
2000). In the past decades, researchers have studied various network variables that included
network centrality (Freeman, 1979), centralization, structural holes (Burt, 1992), brokerage
(Gould & Fernandz, 1989), social capital (Putnam, 1993), strength of weak ties (Grannovater,
1973), clique analysis and structural equivalence (Borgati & Everett, 1992) and others.
In the following paragraphs, studies from other disciplines that had numerous applications of
SNA are presented. For each of the studies, description of how the SNA was used to understand
various social phenomenon using network sociograms and other related network characteristics
is presented.
In the discipline of agricultural and extension education, Bartholomay et al. (2011) conducted a
study to understand the outreach of Minnesota Extension to organizations which were external to
the University of Minnesota. They assumed that networks play an essential role in how and
where extension carries out its outreach activities. To prove this, they designed a survey which
consisted of questions on depth of connections between UM Extension and organizations
external to UM, who initiated the connection and perceived importance of Extension’s
contribution to the organization. As a need for full participation of staff in networks studies, data
on above mentioned measures was collected from all Extension staff members, including civil
services and part-time through a web-based survey. A total of 96% Extension Staff responded to
the survey. To describe the depth of relationship, the authors used traditional statistical methods
and to draw the outreach network of UM Extension, researchers utilized the UCINET 6 and
NetDraw software.

20
The findings revealed that UM Extension’s networking with external organizations were mostly
made up of partnership (43.1%) and substantive information (22. 4%). The network maps of UM
Extension revealed that its network were widely distributed, but the whole network was split in
two parts with youth development and family development programs on the left side and other
programs and central Extension were on the right side of the split. Network map also revealed
that UM Extension had broad outreach to government departments and other related
organizations.
The authors concluded that UM Extension was both deeply and broadly connected to the
organizations external to UM. There were some smaller networks in the whole network map of
UM Extension representing that some organizations were unique to specific program or cluster
of program areas. Overall, the authors suggested a bright future for the use of SNA in Extension
evaluation agenda and concluded that SNA has the great potential to improve reporting, increase
internal collaboration and assess the outreach efforts of organizations such as Extension
(Bartholomay et al., 2011).
Another study conducted by Springer and De Steiguer (2011) used SNA to understand the
networks of collaborative watershed initiative. In this study, the authors concluded that SNA
methodology can provide new insights into watershed and other forms of collaborative initiatives
for natural resource management. They also concluded that SNA has much to offer for Extension
professionals and specifically the visual and statistical elements in SNA which provide extra
insight into characteristics of groups.
Roberts, Murphy and Edgar (2010) conducted a study to explore the social interactions between
the student teachers during the student teaching experience. They found that every student

21
teacher have interacted with their peers during their teaching experience. However, they
interacted with a small percentage of their peers on a weekly basis. Another finding was that
student teachers most frequently used the telephone or face-to-face modes to interact with their
peers. They recommended that teacher educators have to understand the social networks of
student teachers for better learner to learner interaction which in turn increase the overall
learning of student teachers during their teaching experience.
Rhoades, Thomas and Davis (2009) conducted a study in Ohio to understand the social
networking among 4-H youth and the way the youths use the social networking sites to share
information about 4-H and Extension. They found that youth are using social networking sites to
share information about the 4-H clubs and projects, but Extension educators had created a
limited number of pages for youths to network with each other.
The SNA was used by Lauber, Decker and Knuth (2008) to understand the collaborative,
community-based natural resource conservation and development in the communities. They used
the multiple case study approach, and selected three communities where community based
projects were successful. Data was collected from 8-10 individuals in each community through
semi-structured interviews. The questions were based on who were the key stakeholders in the
success of the project and what roles had been played by interactions between the stakeholders.
Researchers used NetDraw software to draw the stakeholders’ interaction network maps.
Based on the coding of interviews, researchers found five reasons for interaction between the
stakeholders, which were: exchange of ideas, knowledge dissemination, getting funds and other
tangible resources and exerting influence. Among all the reasons for interaction, exchange of
ideas was highest. Overall, authors concluded that SNA provides a unique way to understand the

22
interaction between stakeholders and success of community-based natural resource management
projects.
Mandarano (2009) conducted a study to demonstrate the value of SNA in evaluation of
effectiveness of collaborative planning in the development of social capital by use of new and
improved inter-organizational networks. The researcher used the case study approach and
collected data using both interviews and surveys. Data was analyzed using UCINET 6 software
and researchers used similarities, hierarchical clustering, density, and circle graph and centrality
applications.
The results of similarity application in UCINET showed that organizations within habitat group
are linked based on common interests. Among all the networks, resource exchange network had
the highest density of 95%, while the fund exchange network had the lowest density of 46%. The
results also showed that availability and accessibility of resources impacted the formation of new
relationships. Researchers concluded that SNA helped in identification of new relationships
formed among participants due to common interests they shared, which in turn improved the
social capital.
Hawe and Ghali (2008) used SNA to understand the social structure of high school staff and
teachers to promote the health intervention in the school. Data for the study was collected from
teachers and staff using in-depth interviews. Data was analyzed using UCINET 6 software and
researchers used network density and network centralization application of the software.
They found that principal and vice principals were most central in the network and support staffs
were most peripheral in the advice-seeking network of the school. The density in the network
was highest for knowing the person by name (66%). Based on these results they concluded that
23
SNA offers a unique opportunity for identification of key persons and social connections in the
network which in turn helps in successful implementation of health intervention.
Fowler, Christakis, Steptoe, Roux (2009) used SNA to understand the spread of happiness in the
large social network of Framingham heart study. They found that people’s happiness in the
network depends on their connection to other people in the network who were happy and
concluded that SNA offers a unique methodology in understanding the spread of happiness.
Pow, Gayen, Elliott, and Raeside (2012), explored the application of SNA in the nursing
profession. They found that SNA provides a simple and easy method in understanding the
interactions between nurses and patients and how these interactions can help in understanding
the various health outcomes of the patients.
Brokerage and its Effect on Program/Organization/Individual Business Performance and
Demand of Program/Product/Organization:
Brokerage:
Brokerage refers to the occupancy of structural position by an actor in the network which
links/connects otherwise unconnected actors and mediates the flow of information and resources
between those unconnected actors (See Figure 2) or trade on gaps in the social structure (Burt,
1992; Gould & Fernandez, 1989; Fernandez & Gould, 1994; Stovel & Shaw, 2013). The broker
represented with black (solid) circle occupies the gap in otherwise unconnected two actors
represented with white (hollow) circle. In more formal terms brokerage can be defined as the
process of connecting actors in a system of social, economic and political relations in order to
access valued information and resources (Stovel, Golub, & Milgrom, 2011).

24
Figure 2. An example of brokerage process adapted from Stovel and Shaw (2013)
According to Stovel and Shaw (2013), the vital characteristics/properties of brokerage were “(a)
they bridge a gap in social structure and (b) they help goods, information, opportunities, or
knowledge flow across that gap (p.141).” Brokerage is the only mechanism through which
isolated/unconnected individuals can interact economically, politically, and socially (Stovel &
Shaw, 2013).
Actors with higher brokerage gain more access to information and resources because they were
likely to access heterogeneous and non-redundant information (Burt, 1992; Yin, Wu, & Tsai,
2012) then the actors with low or no brokerage. According to Burt, occupancy of brokerage
position provides an actor the control benefits because having the higher brokerage position the
actor can manipulate the negotiation between unconnected actors. With the information,
resources and control benefits, the actors with higher brokerage become more influential and
perform well in the business compared to firms with lower brokerage (Fernandez & Gould,
1994; Stovel and Shaw, 2013; Stovel et al., 2011). In the individual network actors with high
brokerage capabilities are able to do more innovations at the organization (Hargadon & Sutton,
1997), get the job more easily (Granovatter, 1973), get promotions more quickly (Burt, 1992)
and more successful in their careers (Podolny & Baron, 1997).
In order to provide empirical support to the fact that network position of brokers provides them
competitive advantage and it is persistent, Ryall and Sorenson (2007) conducted a study using
biform game methodology. They found that brokers can exploit the advantage and sustain their
position only when; a) there were no substitute for the position of broker or the value they create,

25
b) brokerage occurs at more than two actors, and c) brokers were not stuck at their intermediary
position and can leave that anytime time when they require.
Gould and Fernandez (1989) introduced the concept of brokerage typology that further
categorizes the brokerage. They identified five structurally different types of brokers or five
types of brokerage relations on the basis of information flow and partitioning of actors into non
overlapping groups.
The five distinct types of brokers were liaison, itinerant, coordinator; gatekeeper and
representative (see Figure 3). The first type “Liaison” is a brokerage relation in which all three
actors occupy different groups. One example for liaison brokerage is the negotiator who resolves
the conflict between firm management and firm employees, other example can be the middleman
between farmers and consumers (Gould &Fernandez, 1989; Fernandez & Gould, 1994).
The second type of brokerage is the “itinerant,” in which two unconnected actors may belong to
same subgroup while the broker belongs to different group. The mediator in this kind of
transaction is an outsider, so this type of brokerage is also called as “Cosmopolitan” or
“consultant” broker. The best example for this kind of brokerage is the stockbroker, where
brokerage firms are quite differentiated from their clients and according to stockbroker the buyer
and seller make up an undifferentiated group (Gould &Fernandez, 1989; Fernandez & Gould,
1994).
The third type of brokerage is the “coordinator,” in which all three actors belong to the same
group and the brokerage relationship is completely internal to the group. The example for this
kind of brokerage is the Federal Reserve Bank, which act as a controller and a clearing house for
all other banks in a country (Gould & Fernandez, 1989; Fernandez & Gould, 1994).

26
The fourth type of brokerage is “gatekeeper,” it is the controller for incoming information to
his/her group and he/she has to decide whether to grant access of this information to its group or
not. An example to this kind of brokerage is the Census Bureau, which is responsible for
gathering and processing the information and later distribution to other government
organizations (Gould &Fernandez, 1989; Fernandez & Gould, 1994).
Figure 3. Different types of Brokerage Structures as adapted from Gould & Fernandez (1989)
The last type of brokerage is “representative.” In this, a member of the subgroup represents the
complete group and negotiate to outside groups on behalf of his/her group. An example may be
during the conflict between airline industry and government; American Airlines represent the
Liaison Itinerant C
Coordinator
Gatekeeper Representative

27
airlines group and negotiate with the government (Gould &Fernandez, 1989; Fernandez &
Gould, 1994).
Gatekeeper and representative brokers perform the information processing and external
representation and have clear-cut relevance to boundary spanning role and taking advantage of
their positions (Gould &Fernandez, 1989; Fernandez & Gould, 1994).
Literature related to the application of brokerage is briefly described below:
Fernandez and Gould (1994) conducted a study to find the relationship between occupancy of
brokerage position and influence in health policy domain. In this study researchers utilized the
five kinds of brokerage (liaison, itinerant, gatekeeper, representative and coordinator) types
proposed by Gould and Fernandez (1989). The five hypothesis of their study were:
HYPOTHESIS 1 - For all five brokerage types, actors who control two- step paths
between pairs of other actors are perceived as more influential, on average, than actors
who do not.
HYPOTHESIS 2 -Among government organizations, the relationship between influence
and occupancy of liaison and itinerant brokerage positions will be attenuated by a
tendency to take stands on policy events.
HYPOTHESIS 3 -Among government organizations, the relationship between influence
and occupancy of representative and gatekeeper brokerage positions will not be
attenuated by a tendency to take stands on policy events.

28
HYPOTHESIS 4 -For nongovernment organizations, the relationship between influence
and liaison, gatekeeper, representative, and itinerant brokerage position will be
unaffected by advocacy of specific policies.
HYPOTHESIS 5 -Taking stands on policy events will contribute to the influence of
coordinators, whether or not they are government organizations (p. 1461-1463).
Fernandez and Gould used the data from Laumann and Knoke’s (1987) study on social structure
of national energy and health policy domains. The dependent variable of the study was influence
reputation, which was measured through each respondent’s view on which actor was most
influential in formulating the health policy. The data on communication flow was measured by
researchers asking organizational informants to identify organizations with which their
organization discusses health policy issues regularly. For calculation of values for five types of
brokerage, researchers used partial brokerage scores and they used 15 common interest
subgroups as the partitioning vectors. The moderating variable of the study was measured by
analyzing which policy events each organization take public stand. This study used organization
age and size as the control variables. In order to reduce the spurious relationship, percentage
effort of each organization for health policy domain was also measured. Multiple regressions
were used to prove the hypothesis.
In this study, Fernandez and Gould (1994) found the positive correlation between all five types
of brokerage and highest correlation was between liaison and itinerant and among representative,
gatekeeper and coordinator. All five types of brokerage were positively related to influence in
health policy domain irrespective of governmental and non-governmental organizations, this

29
finding supported hypothesis 1 of the study. In the same way hypotheses 2, 3, 4, 5 were also
supported by results of the study.
Overall Fernandez and Gould concluded that the governmental organizations remain influential
when connecting disparate actors only when they remain neutral to specific health policy
agendas.
In order to clarify that boundary spanning roles were not performed by one person, Friedman and
Podolny (1992) conducted a longitudinal network study utilizing the network data for labor
negotiations. They found that some individuals in the network broker ties towards their
opponents (representative broker) while others had the broker ties from their opponents
(gatekeeper brokers). They concluded that the role conflict for different individuals in
negotiation networks must be analyzed differently both in form of concept and methodology and
more options should be available to negotiator to better management of role conflicts.
Networks are dynamic and keep evolving with time (Gulati & Gargiulo, 1999). It is very hard to
define the current organizational outcomes with existing network structure, as past network or
‘network memory’ also contributes to current outcomes (Soda, Usai & Zaheer, 2004). Soda et al.
(2004) conducted a longitudinal study at the TV performance project firms in Italy to define the
effect of network memory on current organizational outcomes. In their study, they considered
current TV project performance as dependent variable and past and current internal closure
(defines how connected were the specialists in project and mutually shares trust, knowledge and
routines) and past and current structural holes (it is a gap in the network and actors embedded in
networks rich in structural holes will gain capacity to utilize their position for personal advantage
by acting as a broker (Burt, 1992). To avoid the effect of external factors on dependent variable,

30
researchers controlled size of project, average age of networks, and current project centrality
(past research indicated effect of network centrality on performance of organization (Tsai &
Ghoshal, 1998). Upon analyzing the multiple regression results researchers found that past
network closure among network members affect the current organization performance in a
curvilinear fashion and current structural holes enhanced the performance of organization
compared to past structural holes. Overall, researchers concluded that social capital contained in
the network in the form of closure sustained over time while social capital in form of structural
holes decayed over time.
Upon reviewing the vast literature on brokerage, Täube (2004) found that brokerage concept is
well discussed and classified and operationalized into five types on brokerage based on their
affiliation to various subgroups but little effort have been made to assess the social capital
associated to these different types of brokers due to their position in the network. Täube designed
an instrument to capture the social capital associated with the liaison, itinerant, gatekeeper,
representative and coordinator brokerage roles.
In order to assess the benefits hold by gatekeeper brokers in innovator networks, Graf and
Krüger (2011) conducted a SNA study utilizing the patent data. Upon deeply studying the
internal and external contacts of gatekeepers using multiple regressions, researchers found that
gatekeepers were unable to extract all the benefits associated with their position and gatekeeper
provides some sort of public benefits along with their personal benefits in the innovation
networks.
The findings of Graf and Krüger (2011) were further supported by Graf (2011), where researcher
expanded the previous study. In this study Graf found that for gatekeepers in order to reap the

31
competitive advantage of their position, their absorptive capacity (absorption of new knowledge
from external actors and diffusion to local actors in its subgroup) was more vital than the size
(large actor have more linkages) of the gatekeeper. Graf also found that gatekeeper role was
mainly served by public research organizations compared to private organizations.
In order to understand the technology brokering in a product development firm, Hargadon and
Sutton (1997) conducted an ethnography study at IDEO, the largest product design consulting
firm in US. Upon analysis of data, researchers found that IDEO simultaneously worked with
multiple industries on development of various products. Having the opportunity of working with
many industries, the designers at IDEO exploited the benefits of their network position by
developing new products for one industry using the existing technology from other industry.
Researchers concluded that network position blended with organizational memory of IDEO
designers helped them to become technology broker and develop new and innovative products.
Oke, Idiagbon-Oke, and Walumbwa, (2008) found the deficiency in literature regarding the
impact of power (both personal and positional) associated with the broker position on ties
strength in horizontal network and outcomes of new product development firms. To fill this
deficiency they conducted a survey research with 13 networks comprised of 42 organizations.
Based on the results of structural equation modeling they concluded that relationship between
use of power by brokers and outcomes of new product development firms was completely
mediated by strength of ties among horizontal network members.
Technology brokers catalyze the innovation process in an organization, but despite their
catalyzing process they found difficulty in embedding inside the networks as network members
had difficulty to grasp the value to work done by technology brokers (Klerkx & Leeuwis, 2009).

32
Even after wide research on network brokers, little research have been conducted on
physiological antecedents of network brokers (Oh & Kilduff, 2008). In order to understand these
physiological antecedents, Oh and Kilduff (2008) conducted a study on Korean entrepreneurs in
Canadian urban areas. They found that, persons with high self-monitoring tended to become
direct brokers in Korean community by connecting unconnected direct acquaintances. Those
with high self-monitoring also exhibit the indirect brokerage and establish ties to important
network members outside the Korean community. By these results they concluded that there was
ripple effect of self-monitoring on social structure and personality relates to brokers at different
levels of the network.
Using the typology proposed by Gould and Fernandez (1989), a very few research studies have
been conducted in the past and they considered the macro-level consequences of particular form
of brokerage. For example, studies done by Friedman and Podolny (1992) analyzing the labor
negotiations; Gould & Fernandez (1994) analyzed the health policy domain. Recently, Hillmann
(2008) utilized this framework to understand the state building efforts in the colonial Vermont.
Studies to date on network variables have made substantial contributions in conceptualizing the
idea of brokerage both theoretically and empirically, but limited studies have been conducted to
explore the brokerage typology (Gould &Fernandez, 1989) and its effect on various
organizational outcomes.
33
Centrality in general and specifically Degree Centrality and its Effect on
Program/Organization/Individual Business Performance and Demand of
Program/Product/Organization:
Centrality:
Centrality is one of the most studied variables in the network literature across the disciplines
(Brass & Burkhardt, 1992; Brass et al., 2004; Powell, Koput, Smith-Doerr, & Owen-Smith,
1999; Sparrowe, Liden, Wayne, & Kraimer, 2001). Centrality refers to the extent to which an
actor occupies a central position in the network when compared to other actors in the network.
The centrality in a network can be conceptualized and analyzed in a variety of ways, but
Freeman (1979) summarized three measures of centrality: Degree, Closeness and Betweenness.
Degree Centrality: degree is the number of nodes that a focal node is connected to and it
measures the direct involvement of the focal node in the network. This measure is most simple
and calculated by just counting the number of links to or from an actor to other actors in the
network. In simple words degree centrality can be defined as the number of direct ties an actor
has. The reason for its simplicity is that for its calculation the local network around the focal
node needs to be considered. In the directed network data the degree centrality can be segregated
into in-degree and out-degree. The in-degree defines the number of ties coming from outside to
the focal node and this measure is an indicator of prestige of the focal node. The out-degree can
be defined as the number of ties going outside from the focal node; this measure is an indicator
of influence of the focal node. The degree centrality measure represents the number of
alternatives available with an actor and availability of more alternatives means more access to
information, less dependency on others and more power.
34
Assumptions: major assumption for degree centrality is that it considers only the direct
connections/links to the focal node and considers just the one point reach in network from the
focal actor compared to the whole network.
Limitations: one of the major limitations is that it considers only the direct connections to the
focal actor and ignores the rest of the whole network means focal actor can reach to a vast
number of other actors indirectly but the assumption of direct connection restricts its reach. One
actor might have high degree centrality, but those to which it connects might be rather
disconnected from network as a whole. In this case, although the actor is central but it is central
only in a local neighborhood. Degree centrality is also dependent on the network size: small
network means less alternative and large network means more alternatives. (Freeman, 1979;
Opsahl, Agneessens, & Skvoretz, 2010; Chan, & Liebowitz, 2006; Borgatti, 2005).
Closeness centrality: this centrality measure considers the centrality of the focal actor based on
how close it is to other actors in the network and how fast focal actor has the capability to spread
the information to other actors in the network. This measure considers both direct and indirect
links of an actor and is calculated by summing up the path lengths of the shortest paths
(geodesics) from the focal point to all other points. This measure can be interpreted to represent
efficiency (how an actor reaches other actor in the shortest steps) or independence (being close to
all other actors, focal actor needs to be less dependent on others for access to information and
resources).
Assumptions: this measure considers only the shortest path (geodesic) with which the focal actor
is connected to others in the whole network and this measure only works with in the connected
network (no isolates) and distance between two unconnected points is considered as infinite.

35
Limitations: one of the major limitations for closeness centrality is that it lacks its applicability to
networks which have the disconnected or isolate actors. Another limitation is that it only
considers the shortest paths, but what about the other paths through which the focal actor can
reach to other actors in the network (Freeman, 1979; Opsahl, Agneessens, & Skvoretz, 2010;
Chan, & Liebowitz, 2006; Borgatti, 2005).
Betweenness Centrality: this measure represents the extent to which an actor falls in between
pairs of other actors on the shortest paths (geodesics) connecting them and can funnel the flow of
information between the actors it is connecting. The betweenness centrality for an actor is
measured by the frequency with which it falls between pairs of other actors on the shortest
(geodesic) path connecting them. This measure represents the potential control of an actor over
other actors. Actor at an intermediary position, which connects otherwise unconnected can have
greater access to information, resources and can utilize its position for its personal benefits.
Assumptions: this measure only considers an actor as central when it falls on the shortest path
which connects the pair of other actors. This measure considers the whole network and can be
utilized in a network with disconnected actors which are a limitation for closeness centrality.
Limitations: one of the major limitations of this measure is that it only considers the shortest
path, but in a network it is not possible that information can flow only through the shortest path,
but it can take the other paths also (Freeman, 1979; Opsahl, Agneessens, & Skvoretz, 2010;
Chan, & Liebowitz, 2006; Borgatti, 2005; Newman, 2005).
The other alternative centrality or network measures that relax the assumptions or address the
limitations of above three mentioned centrality measures are eigenvector centrality and flow
betweenness centrality.

36
Eigenvector centrality: this measure considers the centrality of the actors with whom the focal
actor is connected. This means that an actor that has a high eigenvector score is one which is
connected or adjacent to actors which have the highest degree centrality. Suppose actor A has an
influence on actor B and actor B have influence on many other actors, then actor A would be the
most influential according to eigenvector centrality. Unlike degree centrality, which weights
every contact equally, the eigenvector weights contacts according to their centralities.
Eigenvector centrality overcomes the limitation of degree centrality as it considers both direct
and indirect connections to the focal actor and considers the whole network, but not the local
network like degree centrality (Borgatti, 2005; Bonacich, 2007).
Flow betweenness centrality: this centrality measure relaxes the assumptions of betweenness and
closeness centrality i.e. shortest path. Flow betweenness (Freeman et al., 1991) counts all paths
that carry information when a maximum flow is pumped between each pair of vertices. Flow
betweenness considers the paths other than the shortest path for maximum flow of information,
but that information still needs to “know” the ideal route (or one of the ideal routes) from each
source to each target, in order to realize the maximum flow.
This measure overcomes the limitations of betweenness and closeness centrality but still it is not
the holistic measure, as information can flow through any path, not just the ideal path or shortest
path and this can be considered as the limitation of this measure (Newman, 2005).
Centrality of an actor in the network provides various advantages to the actor such as getting a
job (Granovatter, 1973), promotions and early career growth (Burt, 1992; Podolny & Barron,
1997), more number of new innovations (Hargadon & Sutton, 1997; Ibara, 1993), better
performance in the job (Brass, 1981), creation of new values and achievement of organization

37
goals (Tsai & Ghoshal, 1998), more availability of power (Brass, 1984), influence on various
decisions of other actors (Friedkin, 1993), and better performance of organization (Powell et
al.,1999; Tsai, 2001).
Below mentioned are the few detailed studies which describe the application of centrality in
various sectors to understand various outcomes of individual and organizations.
In order to assess the effect of central network position on business organization innovation
capacity and performance, Tsai (2001) conducted a social network study at two large
multinational corporations. The dependent variables of the study were business unit innovation
capacity and performance of business unit, the independent variables were absorptive capacity of
business unit (ability of organization to assimilate and replicate the new knowledge learned from
organizations outside its network (Cohen & Levinthal, 1990) and network position (degree
centrality). The control variables used in the study were size of business unit, local competition
and past capacity to innovate and past business performance. Upon analyzing the results of
hierarchical regression, Tsai found that business unit’s degree centrality in the inter-
organizational network did not contribute to its better business performance but positively related
to innovation at business unit. On the other hand, business units with higher absorptive capacity
are going to perform better in the business and effect of degree centrality on business
performance was mediated by absorptive capacity of the organization. He also found that effect
of degree centrality and absorptive capacity on business performance was not mediated by
innovation capacity of business unit. The reasons given by Tsai for no significant association
between degree centrality and business performance were costs for maintaining the central
position outweighed the benefits of degree centrality and the organization lacked capacity to

38
absorb and apply the new knowledge gained through its central position. Tsai suggested further
research to investigate the net effect of network position on business performance.
Powell et al. (1999) conducted another study in the biotech industry to examine the effect of
network centrality (eigenvector) in an inter-organizational network on performance (number of
patent, growth in size and more revenue from sales) of organization. Researchers collected data
for 388 biotechnology firms over a period of ten years through archival data sets. Results from
regression model indicated that centrality was a determining factor for performance of the
biotech firms.
Sparrowe et al. (2001) conducted a study at five different organizations to define the effect of
centrality (degree), network density (average number of ties for each group member) and
network centralization (extent to which network is dominated by few individuals) in a work
group on the individual and group performance. Based on the results of multiple regressions,
researchers found positive relationship between advice network centrality (degree) and
individual performance whereas network centralization at group level was negatively associated
with group performance. They found no relationship between advice network density and group
performance. The researchers also found negative relationship between density of hindrance
networks and group performance.
Baldwin, Bedell, and Johnson (1997) conducted a study to analyze the effect of network
centrality in the network of master of business administration (M.B.A.) students on attitudinal
and performance outcomes of students. The results of structural equation model indicated that
centrality in the communication and friendship network had affected both the attitude and final
grades of the students.

39
Freeman, Roeder, and Mulholland (1980) in their MIT experiment research study found
centrality as an important factor that influences leadership and efficiency in a small network but
network density also turned out relevant influencing factor.
Brass and Burkhardt (1992) conducted a study at a newspaper publishing company to
empirically explore the relationship between power and centrality of actors in an organization.
Results of hierarchical regression indicated that centrality of actor in a network irrespective of
types of centrality (degree, closeness and betweenness) and point of reference were positively
associated with power in an organization.
Brass and Burkhardt (1993) conducted another study at a government bureaucratic organization
to explore the relationship between power in organization (central structural position) and use of
power by actors through behavior tactics in the network. Results of multiple regressions revealed
that individual’s network centrality (degree, closeness and betweenness) and level in the
organizational hierarchy were significantly related to perception of other actors in the network
about the power of central actor in the network.
Centrality of a single business unit in a social interaction network of multiple business units was
found positively related to perceived trustworthiness of single business unit in the whole
network and extent to which single business unit matches its vision with multiple business units
organization as a whole (Tsai & Ghoshal, 1998).
40
Summary:
Social Network Analysis (SNA) offers a unique methodology to describe and measure the
Cooperative Extension outreach. This methodology has been widely used for decades in
disciplines such as sociology, business management and public health for understanding various
individual or organizational outcomes (Springer & De Steiguer, 2011). SNA has also been used
in a diversity of applications, including analyzing roles of intra-firm networks and corporate
business partnerships (Tsai & Ghoshal, 1998), examining how ideas and information are
transferred amongst a field of professionals, understanding the role of networks in various
organizational outcomes (Brass et al.,2004). However, the use of SNA is limited in Cooperative
Extension programs. SNA studies can be done considering two different but complementary
perspectives: the analysis of the individual actor level (egocentric) and the analysis of the whole
network (structure) level.
SNA as a methodology provides complementary visual and statistical components for analyzing
the traits of actors and their relationships. Network studies utilizing various network variables
such as centrality (informs how actors are central in a network compared to other actors) and
brokerage (extent to which actor links otherwise unconnected actors) are able to define various
characteristics of an organization. With the information, resources and control benefits, the
actors with higher brokerage become more influential and perform well in the business compared
to firms with lower brokerage. In the individual network actors with high brokerage capabilities
are able to more innovations at the organization, get the job more easily, get promotions more
quickly, and more successful in their careers. Gould and Fernandez (1989) introduced the
concept of brokerage typology that further categorizes the brokerage into five types of brokerage
relations on the basis of information flow and partitioning of actors into non overlapping groups.

41
Centrality of an actor in the network provides various advantages to the actor such as getting a
job, promotions and early career growth, more number of new innovations, better performance in
the job, creation of new values and achievement of organization goals, more availability of
power, influence on various decisions of other actors, and better performance of organization.
SNA has great potential for use in Extension to understand all the actors involved in Extension
and how they are connected with each other. SNA is a valuable tool to use for accountability and
reporting, assessing internal collaboration, revenue/resource generation and in carrying out
impact studies.

42
CHAPTER 3
METHODOLOGY
This chapter outlines the materials and methods used in this study and divided into five sections:
1) population and sample; 2) research design; 3) variables included in the study and data
collection; 4) data analysis and interpretation.
The purpose of this study was to understand the diversity and reach of Cooperative Extension
programs in Pennsylvania delivered by Penn State Extension and the influence of various
network variables (Brokerage and Centrality) on two program outcomes (program business
performance and demand for the program) through Social Network Analysis (SNA). Specific
objectives of the study were to:
1. Develop a holistic network map of programs and program stakeholders to understand the
diversity and reach of Extension programs in Pennsylvania.
2. Examine the influence of five types of brokerage (liaison, itinerant, gatekeeper,
representative, and coordinator) and degree centrality on Extension program business
performance.
3. Examine the influence of five types of brokerage (liaison, itinerant, gatekeeper,
representative, and coordinator) and degree centrality on demand for Extension programs.
Hypotheses/ Research Questions:
The following four hypotheses guided the study:
Hypothesis 1: For all five types of brokerage (liaison, itinerant, gatekeeper, representative and
coordinator), programs which control the flow of information and resources between pairs of

43
other programs are hypothesized to have higher business performance than the programs that do
not control the flow of information and resources.
Hypothesis 2: The higher the degree centrality of the program, greater would be its business
performance.
Hypothesis 3: For all five types of brokerage (liaison, itinerant, gatekeeper, representative and
coordinator), programs which control the flow of information and resources between pairs of
other programs are hypothesized to have greater demand among stakeholders than the programs
that do not control the flow of information and resources.
Hypothesis 4: The higher the degree centrality of the program the greater would be its demand
among the stakeholders (See Figure 4).
Figure 4. Conceptual Framework of the Study

44
Population and Sample:
This research was conducted with the cooperation of Penn State Extension (PSE), the outreach
component of the College of Agricultural Sciences at the Pennsylvania State University. One site
sampling scheme is very common in the network studies. By selecting a single site, the boundary
of network can be easily defined (e.g. Krackhardt, 1988). By considering the single wing of the
College of Agricultural Sciences, it is easy to assess the effect of various network variables on
the program outcomes (Tsai & Ghoshal, 1998).
One of the requirements for the SNA studies is near to 100% response rate for its surveys and
SNA won’t rely on sampling because it requires full participation to draw the full network
(Bartholomay et al., 2011). To fulfill this requirement and get the complete data to draw
networks, it was decided to use the secondary data which was readily available and included the
list of all the Penn State Extension programs and their stakeholders.
The population for this study consisted of all programs offered by Penn State Extension and the
respective stakeholders. The sampling method used for this study was a ‘census’ meaning all the
programs and the respective stakeholders were used for this study.
Research Design:
This study utilized the SNA methodology and ex-post facto research design. According to
Bartholomay et al. (2011), SNA offers a unique methodology to describe and measure the
Cooperative Extension outreach. SNA is a methodology which provides complementary visual
and statistical components for analyzing the traits of actors and their relationships (Kilduff &
Tsai, 2003). SNA studies can be done considering two different but complementary perspectives:

45
the analysis of the individual actor level and the analysis of the whole network (structure) level.
The current study analyzed the Penn State Extension program networks at the structure level.
In ex-post facto or after the fact design, the research starts after the effect has already occurred.
In this design, the researcher examines the dependent variables of the study first, and then
explores retrospectively to define the possible cause for the effect or the relationship between
dependent and independent variables. In this design, the researcher cannot manipulate the
independent variables as they have naturally occurred in the past. This design is used as a
substitute to true experimental design to study the cause and effect when the effect has already
occurred (Silva, 2010).
In the current study, the dependent variables, demand for the Extension program and program
business performance have already occurred and later network variables were used to define the
current dependent variables.
The major threats identified by researcher with ex-post facto design include non-manipulation of
independent variables, effect of extraneous variables and measurement error. To overcome the
measurement error and the problem of faulty and incomplete data, the secondary data was used
to collect data on independent and dependent variables.
Variables Included in the Study and Data Collection:
Independent Variables:
The independent variables in the current study were the network variables, which included five
types of brokers (liaison, gatekeeper, representative, itinerant, and coordinator), and degree
centrality of the Extension programs.

46
Data for independent variables were collected by listing various programs offered by Penn State
Extension and their stakeholders. This list was first collected from all the seven State Program
Leaders (SPLs) and later from 48 State Extension Team Leaders (SETLs) and the director of
Penn State Extension. The rationale for collecting data at two levels of SPLs and SETLs was to
improve the validity of the data and to reduce bias. Personal meeting and communication with all
the SPLs, SETLs and the director was done to make them aware of the purpose and objectives of
the study. Data for the list of programs and their stakeholders was collected using a survey.
Within one week of meeting with SPLs and SETLs, program identity questionnaire
(SurveyMonkey link) was emailed to all the 7 SPLs and 48 SETLs.
Data from a list of programs and program stakeholders was input to UCINET 6; a user-friendly
SNA package for analysis of social network data (Borgatti, Everett, & Freeman, 2002). This
would be a two mode data, as the nodes were the programs and tie between the two programs
was the shared stakeholders. First, based on the information on various programs and their
stakeholders the two mode matrix was created where the programs were listed in rows and
stakeholders were listed in the columns and if the program had affiliation to specific
stakeholders, then it was dummy coded as 1 and if not then coded as 0. The data analysis of 2-
mode data is challenging and to conduct further analysis, it needs to be converted into one mode
data. The 2-mode data was converted into one mode data through the ‘affiliation’ process in the
UCINET 6. The one mode data was used to calculate the value of degree centrality through
UCINET 6. To calculate the score for various brokerage types, the one mode data was divided
into 12 subgroups based on consideration of 12 teams for PSE. By making the 12 subgroups out
of all the available 60 programs, the five different types of brokerage scores were calculated
through the UCINET 6.

47
Dependent Variables:
There were two dependent variables for the study: change in program business performance and
change in demand for each program. For both the dependent variables, the data were collected in
two stages, the first stage consisted of base line data for the year 2011-12 (the year Penn State
Extension adopted the new business model), and then the data for year 2013-14, and difference
between the baseline and current year would be treated as the value of these two dependent
variables.
The program business performance was operationally defined as the number of grants and
developmental funding (gifts) received by all the programs. The data for this variable was
collected in the form of secondary data. The grants office in the College of Agricultural Sciences
provided the list of all the grants and developmental funding received for financial years 2011-12
and 2013-14 (till March 15, 2014) by Penn State Extension. As of March 15, 2014, the 2013-14
financial year was not fully completed but the researcher assumed that by March 15, most of the
grants and developmental were received by Penn State Extension. Upon receipt of the complete
data sets in the form of grants and developmental funding for financial years, 2011-12 and 2013-
14, the researcher based on brief review of major activities in each program, segregated the
complete list into 60 distinct programs. Upon segregation of data into 60 programs for both
years, the researcher calculated the change in business performance between year 2013-14 and
2011-12. This final value of change in business performance provided data for first dependent
variable, program business performance.
The second dependent variable demand for programs was operationally defined as the number of
participants who attended each of the 60 programs face-to-face. The data for this variable

48
collected in the form of secondary data as the number of participants who attended various
educational activities offered by Penn State Extension for years 2010-11, 2011-12 and 2012-13.
The rationale for collecting data for three years was that data for year 2013-14 was not available
and to project the data, researcher utilized the data from the past three years.
The data projection for the year 2013-14 was done utilizing the “exponential smoothing
method.” This is one of the most popular methods for data projection. This is a kind of averaging
method with use of weights and these weights decrease exponentially for older years, meaning
highest weight to current year and lowest weight to previous year. Unlike average method, this
method also utilizes all the available data points (Ravindran, & Warsing Jr, 2012).
“Under this method, given demands D1, D2,…., Dn, the forecast for period (n+1) is
given by
Fn+1= αDn+ α (1-α) Dn-1+ α (1-α) 2
Dn-2+….. (2.3)
Where α is between 0 and 1 and is called the smoothing constant. Note that α › α (1-α) › α
(1-α)2 › …
Thus, the most recent demand is given the highest weight α and the weights are decreased
by a factor (1-α) as the data gets older.
Equation 2.3 can be rewritten as follows:
Fn+1 = α Dn + (1-α) [αDn-1+ α(1-α) Dn-2 + α(1-α)2
Dn-3……]
Fn+1 = α Dn + (1-α) Fn (2.4)

49
Thus, the forecast for period (n+1) uses the forecast for period n and the actual demand
for period n. The value of α is generally chosen between 0.1 and 0.4. In other words, the
weights assigned to the actual demand are less than that of the forecasted demand, the
reason being, the actual demands fluctuate a lot, while the forecast has smoothed the
fluctuations.” (Ravindran, & Warsing Jr, 2012, p.38)
In this study the researcher used 0.2 as the value of α. Upon projecting the data for year 2013-14,
and using the available data from year 2011-12, the researcher based on brief review of major
activities in each program segregated the complete list into 60 distinct programs. Very extreme
outliers in the data were not included in the study. Upon segregation of data into 60 programs for
both years, the researcher calculated the change in demand for the program between year 2013-
14 and 2011-12. This final value of change in demand for the program provided data for the
second dependent variable, demand for the program.
This study was approved by the Institutional Review Board (IRB) for involvement of human
subjects with PSU IRB # 45329 (See Appendix A).
Data Analysis and Interpretation:
Social Network Analysis (SNA) studies are different than traditional social science studies, as in
traditional social science studies we consider the attributes of a single individual as our variables
but in SNA social relations were considered (Wellman & Berkowitz, 1988). In other words, the
traditional social sciences studies considers the attributes on an individual (monadic attributes)
but SNA studies rely on the attribute of pairs of individuals (dyadic attributes) (Borgatti &
Everett, 1997). In traditional social sciences studies, the data set would be a person-by-attribute
matrix, where persons were the cases and the individual attributes were the variables. But in

50
network studies, the data set would be person-by-person matrix, which is recording the single
variable (dyadic attribute) among a set of actors (Borgatti & Everett, 1997). Network research is
amenable to multiple levels of analysis and can integrate quantitative, qualitative and graphical
data, which allows for more thorough and in-depth analysis of the data. At the same time
network maps generated by SNA provides a degree of realism, which normally lacks in
traditional research (Kilduff & Tsai, 2003)
In normal SNA studies, the data sets are one mode meaning that the relationship/tie between the
individual actors would be a direct relationship, such as two actors tied to each other through
friendship relationships. The other form of relationship between the actors would be the indirect
relationship which is considered as two mode data, where the two actors are not connected
directly but tie exist between the two actors through affiliation to a common group, considered as
the duality of the actor or group (Breiger, 1974).
In this study based on two mode matrix of programs and their stakeholders, the whole network
map of programs and their stakeholders was drawn using Netdraw (Borgatti, 2002). Based on
network maps various characteristics of PSE network were described. At the same time after
converting the two mode matrix into single mode (programs to programs connected through
common stakeholders) through “affiliation” process in UCINET, independent variables of the
study; degree centrality and five types of brokerage were calculated.
Data were analyzed using the Statistical Package for Social Sciences (SPSS 21). Binary logistic
regression was used to test the hypotheses in which dependent variables were dichotomous. In
this study the use of binary logistic regression represent basic exploration or preliminary analysis
wherein multiple independent variables are used to explain change in demand for the programs

51
and business performance of programs. The purpose was to explore simultaneously the influence
of independent variables rather than to infer to a larger pool of programs.
Logistic regression is an alternative to multiple regression where the dependent variable is
nominal or categorical in place of continuous variable (Mertler & Vannatta, 2010). In this study,
the dependent variables; change in program business performance and change in demand for the
program were dichotomized into programs with change (from 2011-12 to 2013-14) in both
dependent variables were negative (decrease in from 2011-12 to 2013-14) and programs with
change (from 2011-12 to 2013-14) for both dependent variables were positive (increase from
2011-12 to 2013-14). The rationale for using the logistic regression in place of linear regression
was: first the linearity assumption of linear multiple regression was not satisfied by current data
and second, there were limited number of cases (60 programs). The number of cases in the study
is exactly equal to the minimum number of cases required for the binary logistic regression. All
the assumptions of binary logistic regression were checked and data satisfied all the assumptions,
except for high correlation (r=0.997) between two independent variables: gatekeeper and
representative broker, which is also called multicollinearity. To overcome the issue of
multicollinearity and meet the assumptions of binary logistic regression, the representative
broker variable was removed from analysis. The reason why gatekeeper broker was used and
representative broker was not included in analysis was that gatekeeper broker had the highest
correlation to the dependent variables compared to the representative broker variable. Another
independent variable, coordinator broker was also not included in the analysis because during
the calculation of five types of brokers, the value for coordinator broker was zero for all the 60
programs. In final model of logistic regression, out of the six independent variables (liaison,
gatekeeper, representative, itinerant, and coordinator brokers and degree centrality) only four

52
variables (liaison, gatekeeper, and itinerant brokers and degree centrality) were used.
Descriptive statistics, such as frequencies and percentages was also used to describe the
independent and dependent variables.

53
CHAPTER 4
RESULTS AND FINDINGS
This chapter presents the results of the study and is organized into three sections based on the
objectives of the study: section one presents the various network maps of Penn State Extension
and description of various characteristics related to reach of Penn State Extension; section two
describes the results related to influence of five types of brokerage (liaison, gatekeeper,
representative, itinerant, and coordinator brokers) and degree centrality on Program Business
Performance; and the third section presents the effect of five types of brokerage (liaison,
gatekeeper, representative, itinerant, and coordinator brokers) and degree centrality on Demand
for Extension Programs.
The purpose of this study was to understand the diversity and reach of Cooperative Extension
programs in Pennsylvania delivered by Penn State Extension and the influence of various
network variables (Brokerage and Centrality) on two program outcomes (program business
performance and demand for the program) through Social Network Analysis (SNA). Specific
objectives of the study were to:
1. Develop a holistic network map of programs and program stakeholders to understand the
diversity and reach of Extension programs in Pennsylvania.
2. Examine the influence of five types of brokerage (liaison, itinerant, gatekeeper,
representative, and coordinator) and degree centrality on Extension program business
performance.
3. Examine the influence of five types of brokerage (liaison, itinerant, gatekeeper,
representative, and coordinator) and degree centrality on demand for Extension programs.

54
Objective 1: Develop a holistic network map of programs and program stakeholders to
understand the diversity and reach of Extension programs in Pennsylvania
Upon analysis of results from degree centrality measure of UCINET, it was found that the top
three programs which had the highest degree centrality were: forest products and services
(19.887), integrated crop production practices (19.718), and diary business management (19.548)
and the three programs which had the lowest degree centrality were: PA farm safety and health
quiz bowl contest (3.107), farm transitions (3.729), and meat and poultry processing (5.311). See
Table 1.
Table 1
List of Programs and Values of Degree Centrality for each Program
Programs Degree Centrality
Ag Entrepreneurship, Economic and Community Development Team
Ag Business Management 9.774
Economic & Community Development 8.362
Marcellus Shale 8.362
Entrepreneurship 9.435
-------------------------------------------------------------------------------------------------------------------------------
Dairy Team
Dairy Business Management 19.548
Dairy Human Resource & Team Management 11.525
Dairy Nutrient & Feed Management 14.068
-------------------------------------------------------------------------------------------------------------------------------
Equine Team
Equine Environmental Stewardship 12.768
Equine Health and Well-Being 8.418
-------------------------------------------------------------------------------------------------------------------------------
Livestock Team
Livestock Production Efficiency 15.367
-------------------------------------------------------------------------------------------------------------------------------
Poultry Team

55
Poultry Health and Management 11.751
---------------------------------------------------------------------------------------------------------------------
Family and Consumer Science Team
Better Kid Care 11.921
PROSPER 11.412
Intergenerational Programs 8.249
Health Insurance and Personal Finance Literacy 8.305
---------------------------------------------------------------------------------------------------------------------
Food Safety and Health Team
Dining with Diabetes 10.621
Expanded Food & Nutrition Education program 8.814
PA Nutrition Education Tracks (SNAP-ED) 9.718
Eat Healthy, Be Active 5.650
StrongWomen/Growing Stronger 10.734
Everybody Walks in Pennsylvania 6.328
Food Safety training for producers 8.192
Food Safety training for processors 6.102
Food Safety for Retail Manager 7.288
Food Safety for Consumers 8.249
Dairy Processing 5.876
Meat and Poultry Processing 5.311
Wine Quality 6.780
---------------------------------------------------------------------------------------------------------------------
Veterinary Team
Mastitis & milk quality 9.774
Bovine Hoof Health 8.249
(Dairy) Beef Quality Assurance and prudent antimicrobial use 7.175
Animal health & welfare 11.751
Dairy Production Medicine Certificate Program 6.271
Animal Nutrition & Metabolic Disease 10.395
---------------------------------------------------------------------------------------------------------------------
4-H and Youth Development Team
4-H and Youth Development 12.938
---------------------------------------------------------------------------------------------------------------------
Field and Forage Crops Team
Integrated Crop Production Practices 19.718
Nutrient and manure management 18.418
Pests (insect, disease and plant) Monitoring and Management 17.062
Soil 17.740
---------------------------------------------------------------------------------------------------------------------
Renewable Natural Resources Team
Forest Products and Services 19.887
Managing Community and Urban Natural Resources 16.667
PA Woodland Owners Education Network 9.492

56
Safe Drinking Water 11.525
Sustaining PA’s Forests Private forest landowners 10.621
Watershed Education 15.085
PA Farm Safety & Health Quiz Bowl Contest 3.107
Safe Tractor & Machinery Operation program 10.508
Safety & Health Management 7.119
Manure Storage Safety 6.102
Renewable Energy 11.638
-------------------------------------------------------------------------------------------------------------------------------
Horticulture Team
Tree Fruit Production Practices 15.989
Retooling the Pennsylvania Tree Fruit Industry with Innovative
Technologies 13.898
Farm Transitions 3.729
Selection, and Evaluation of New/Novel and Traditionally Grown
Specialty Crop Cultivars 13.729
Monitoring, prediction, and management of pests, beneficial and
pollinators 10.96
Best Management Practices for Soil, Water, and Nutrient Management 11.13
Greenhouse and Nursery Production 10.226
Landscape Business Management 12.825
Turf grass Management 12.768
Master Gardener Program 9.153
Analysis of degree centrality for 12 teams revealed that top three teams with the highest degree
centrality were: renewable natural resources (40.264), horticulture (35.178), and field and forage
crops (26.588). See Table 2.

57
Table 2
List of Teams and Values of Degree Centrality for each Team
Teams Degree Centrality
Renewable natural resources 40.264
Horticulture 35.178
Field and forage crops 26.588
Food safety and health 25.613
Dairy 16.627
Family and consumer science 15.547
Ag Entrepreneurship, economic and
community development 15.283
Veterinary 13.096
Equine 9.091
Livestock 7.167
4-H and Youth Development 6.034
Poultry 5.481
Analysis of five brokerage types based on partition vector of 12 teams revealed that none of the
programs occupied the coordinator broker position in the network indicating the value for
coordinator brokerage was zero for all programs. Top three programs which had the highest
gatekeeper brokerage values were: safe drinking water (4.816), manure storage safety (4.816),
and best management practices for soil, water, and nutrient management (1.751); the top three
programs which had the highest values for representative brokerage were similar to gatekeeper
brokerage: safe drinking water (4.816), manure storage safety (4.816), and best management
practices for soil, water, and nutrient management (1.751); the top three programs with highest
consultant brokerage values were: dairy human resource and team management, food safety for
consumers (3.853), intergenerational programs (2.408), and everybody walks in Pennsylvania
(2.408); regarding liaison brokerage the highest brokerage values was same for 31 programs.
See Table 3.

58
Table 3
List of Programs and Values of Different Brokerage types for Each Program
Programs Coordinator
Brokerage
Gatekeeper
Brokerage
Representative
Brokerage
Consultant
Brokerage
Liaison
Brokerage
Ag Entrepreneurship, Economic and Community Development Team
Ag Business
Management 0 0 0 0 1.491
Economic &
Community
Development
0 0 0 0 0
Marcellus Shale 0 0 0 0 0
Entrepreneurship 0 0 0 0 1.491
---------------------------------------------------------------------------------------------------------------------
Dairy Team
Dairy Business
Management 0 0 0 0 1.491
Dairy Human Resource
& Team Management 0 0 0 9.632 0
Dairy Nutrient & Feed
Management 0 0 0 0 0
---------------------------------------------------------------------------------------------------------------------
Equine Team
Equine Environmental
Stewardship 0 0 0 0 1.491
Equine Health and
Well-Being 0 0 0 0 1.491
---------------------------------------------------------------------------------------------------------------------
Livestock Team
Livestock Production
Efficiency 0 0 0 0 1.491
---------------------------------------------------------------------------------------------------------------------
Poultry Team
Poultry Health and
Management 0 0 0 0 1.491
---------------------------------------------------------------------------------------------------------------------
Family and Consumer Science Team
Better Kid Care 0 0 0 0 1.491
PROSPER 0 0 0 0 1.491
Intergenerational
Programs 0 0 0 2.408 1.118
Health Insurance and
Personal Finance
Literacy
0 0 0 0 0

59
---------------------------------------------------------------------------------------------------------------------
Food Safety and Health Team
Dining with Diabetes 0 0 0 0 1.491
Expanded Food &
Nutrition Education
program
0 0 0 0.917 1.349
PA Nutrition Education
Tracks (SNAP-ED) 0 0 0 0.917 1.349
Eat Healthy, Be Active 0 0 0 0 0
StrongWomen/Growing
Stronger 0 0 0 0 1.491
Everybody Walks in
Pennsylvania 0 0 0 2.408 1.118
Food Safety training for
producers 0 0 0 0 1.491
Food Safety training for
processors 0 0 0 0 1.491
Food Safety for Retail
Manager 0 0 0 0 1.491
Food Safety for
Consumers 0 0 0 3.853 0.894
Dairy Processing 0 0 0 0 0
Meat and Poultry
Processing 0 0 0 0 1.491
Wine Quality 0 0 0 0 1.491
---------------------------------------------------------------------------------------------------------------------
Veterinary Team
Mastitis & milk quality 0 0 0 1.376 1.278
Bovine Hoof Health 0 0 0 0.602 1.397
(Dairy) Beef Quality
Assurance and prudent
antimicrobial use
0 0 0 1.07 1.325
Animal health &
welfare 0 0 0 0.963 1.341
Dairy Production
Medicine Certificate
Program
0 0 0 1.204 1.304
Animal Nutrition &
Metabolic Disease 0 0 0 1.926 1.192
---------------------------------------------------------------------------------------------------------------------
4-H and Youth Development Team
4-H and Youth
Development 0 0 0 0 1.491
---------------------------------------------------------------------------------------------------------------------
Field and Forage Crops Team
Integrated Crop 0 0 0 0 1.491

60
Production Practices
Nutrient and manure
management 0 0 0 0 1.491
Pests (insect, disease
and plant) Monitoring
and Management
0 0 0 0 1.491
Soil 0 0 0 0 1.491
---------------------------------------------------------------------------------------------------------------------
Renewable Natural Resources Team
Forest Products and
Services 0 0 0 0 1.491
Managing Community
and Urban Natural
Resources
0 0 0 0 0
PA Woodland Owners
Education Network 0 0.843 0.843 0 1.23
Safe Drinking Water 0 4.816 4.816 0 0
Sustaining PA’s Forests
Private forest
landowners
0 0 0 0 1.491
Watershed Education 0 0 0 0 0
PA Farm Safety &
Health Quiz Bowl
Contest
0 1.643 1.643 0 0.982
Safe Tractor &
Machinery Operation
program
0 0 0 0 1.491
Safety & Health
Management 0 0.838 0.838 0 1.231
Manure Storage Safety 0 4.816 4.186 0 0
Renewable Energy 0 0 0 0 1.491
---------------------------------------------------------------------------------------------------------------------
Horticulture Team
Tree Fruit Production
Practices 0 0 0 0 1.491
Retooling the
Pennsylvania Tree Fruit
Industry with
Innovative
Technologies
0 0 0 0 1.491
Farm Transitions 0 0 0 0 0
Selection, and
Evaluation of
New/Novel and
Traditionally Grown
Specialty Crop
0 0 0 0 1.491
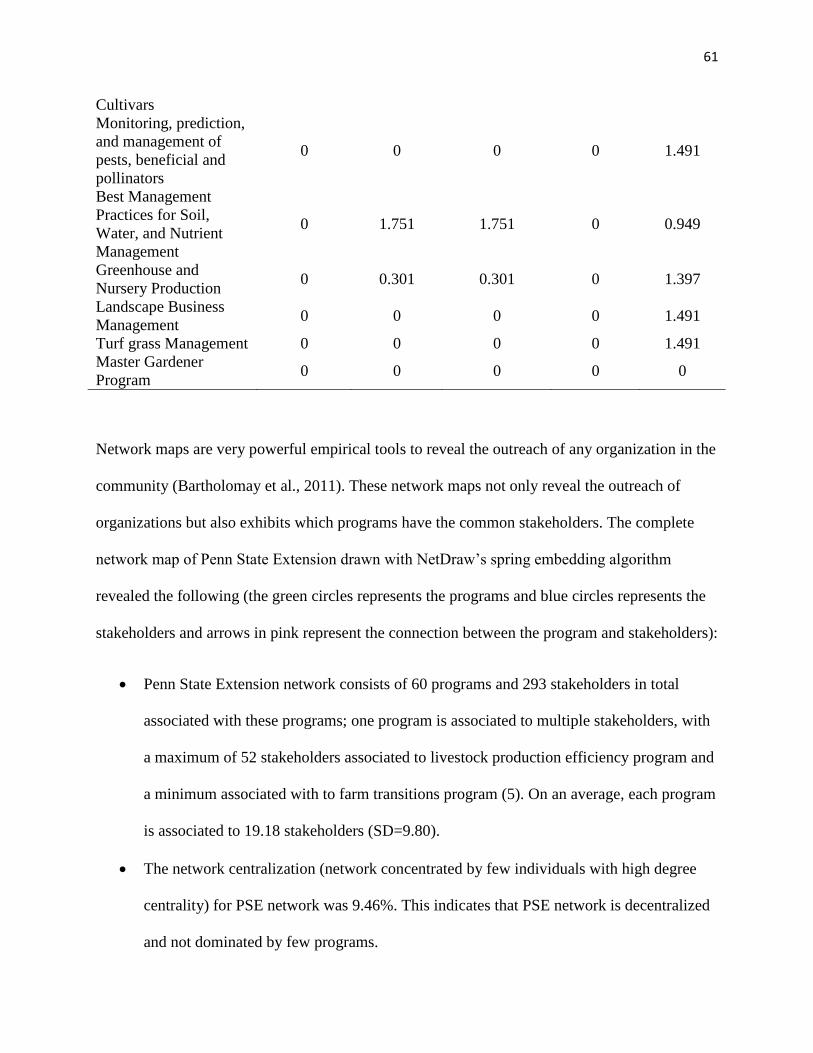
61
Cultivars
Monitoring, prediction,
and management of
pests, beneficial and
pollinators
0 0 0 0 1.491
Best Management
Practices for Soil,
Water, and Nutrient
Management
0 1.751 1.751 0 0.949
Greenhouse and
Nursery Production 0 0.301 0.301 0 1.397
Landscape Business
Management 0 0 0 0 1.491
Turf grass Management 0 0 0 0 1.491
Master Gardener
Program 0 0 0 0 0
Network maps are very powerful empirical tools to reveal the outreach of any organization in the
community (Bartholomay et al., 2011). These network maps not only reveal the outreach of
organizations but also exhibits which programs have the common stakeholders. The complete
network map of Penn State Extension drawn with NetDraw’s spring embedding algorithm
revealed the following (the green circles represents the programs and blue circles represents the
stakeholders and arrows in pink represent the connection between the program and stakeholders):
Penn State Extension network consists of 60 programs and 293 stakeholders in total
associated with these programs; one program is associated to multiple stakeholders, with
a maximum of 52 stakeholders associated to livestock production efficiency program and
a minimum associated with to farm transitions program (5). On an average, each program
is associated to 19.18 stakeholders (SD=9.80).
The network centralization (network concentrated by few individuals with high degree
centrality) for PSE network was 9.46%. This indicates that PSE network is decentralized
and not dominated by few programs.

62
The PSE network was widely distributed and has the wide reach among stakeholders.
Overall, the network was segmented indicating a clear division in the network which was
divided into two halves. The right side of network consisted of animal related and
renewable natural resources programs while the left side consisted of programs related to
plants and safety and health management of consumers (See Figure 5).
Upon further analysis of the network, one can see that complete network was divided into
four clusters, named A, B, C, and D. Cluster A consisted of programs related to
veterinary and dairy; cluster B consists of programs related to plants science, mainly
horticulture and field crops production; cluster C consists of program mainly related to
food safety and health of consumers but this cluster also consisted of master gardener
program; and finally the cluster D consisted of programs related to renewable natural
resources and economic and community development. Programs in each cluster have
more number of stakeholders in common compared to other programs (see Figure 5).
Programs which are located at the center of the network not associated to any cluster are
managing community and urban natural resources and ag. business management.
Some programs were isolated from the network which included food safety, 4-H and
youth development, equine health and wellbeing and livestock production efficiency,
indicating that these programs have specific stakeholders (See Figure 5).

63
Figure 5. Overall Network of Penn State Extension (Programs and their Stakeholders)

64
For an in-depth understanding of the networks of PSE, the network was further simplified into
network of programs and government stakeholders. As a result, there were 33 government
stakeholders. Overall, programs were well connected to government stakeholders indicating that
programs were receiving information and educational resources from local, state and federal
governments. This network also had the four clusters similar to the whole network, but it had few
isolate programs which were not connected to any stakeholders such as farm transitions, manure
storage safety and safe tractor and machinery operation programs (See Figure 6).

65
Figure 6. Overall Network of Penn State Extension (Programs and their Government Stakeholders)

66
Another way of examining networks of PSE is drawing just the networks of the entire 60
programs where the connection between two programs is the common stakeholders. Using the
affiliation process in UCINET, the single mode matrix was generated which was later used to
draw the network map with the help of Netdraw’s spring embedding algorithm. This network
map revealed that all 60 programs were well connected to each other and the overall network is
very dense suggesting more number of connections between the programs and the stakeholders.
See Figure 7.
Figure 7. Overall Program Network

67
The PSE networks were also analyzed by segregating the programs into 12 teams and then
drawing the network of teams and stakeholders. The red circles represent the teams and very
small blue circles represent the stakeholders. The teams were represented with different circle
sizes, where bigger size indicating the more number of connections that teams have with the
stakeholders. The map reveals the following (See Figure 8):
Teams to stakeholder’s network are very widespread, and therefore well connected to
various stakeholders.
Similar to programs to stakeholder’s network, this network (teams) is also clearly divided
into two parts.
Further analysis of this network shows two clusters A and B. Cluster A consisted of all
animal related teams while cluster B contained all plant and natural resources related
teams.
Some teams were isolates, such as 4-H and youth development, livestock indicating that
they have specialized stakeholders (see Figure 8).

68
Figure 8. Overall Network of Penn State Extension (Teams and their Stakeholders)
Objective 2: Examine the influence of five types of brokerage (liaison, itinerant, gatekeeper,
representative, and coordinator) and degree centrality on Extension program business
performance
After analyzing the data for all 60 programs, the top three programs which had the highest
increase in business performance (measured by amount of grant money and developmental
funding (gifts) from year 2011-12 to 2013-14 were: Renewable energy ($2,461,131), Forest
Group A
Group B

69
Products and Services ($1,866,390), and Safety and Health Management ($1,546,814). The top
three programs which had the highest decrease in business performance from year 2011-12 to
2013-14 were: Nutrient and Manure Management (-$17,612,400), Integrated Crop Production
Practices (-$11,095,727), and Pests (insects, disease and plant) Monitoring and Management (-
$3,304,924). See Table 4 for detailed description of change in business performance for each
program.
Table 4
Increase in grants and contracts (Business Performance)
Programs Total grants and
developmental
funding amount ($)
for year 2011-12
Total grants
and
developmental
funding
amount ($) for
year 2013-14
Difference/increase
between 2011-12 to
2013-14 ($)
Ag Entrepreneurship, Economic and Community Development Team
Ag Business
Management 940,272 540,593 -399,679
Economic & Community
Development 1,694,382 1,481,961 -212,421
Marcellus Shale 752,451 1,066,678 314,227
Entrepreneurship 509,629 21,000 -488,629
-------------------------------------------------------------------------------------------------------------
Dairy Team
Dairy Business
Management 3,011,726 595,200 -2,416,526
Dairy Human Resource
& Team Management 2,500 16,171 13,671
Dairy Nutrient & Feed
Management 935,305 1,025,632 90,327
-------------------------------------------------------------------------------------------------------------
Equine Team
Equine Environmental
Stewardship 3,700 1,100 -2,600
Equine Health and Well-
Being 0 0 0
-------------------------------------------------------------------------------------------------------------

70
Livestock Team
Livestock Production
Efficiency 509,696 48,266 -461,430
-------------------------------------------------------------------------------------------------------------
Poultry Team
Poultry Health and
Management 798,352 26,000 -772,352
-------------------------------------------------------------------------------------------------------------
Family and Consumer Science Team
Better Kid Care 1,816,533 1,057,576 -758,957
PROSPER 456,554 616,324 159,770
Intergenerational
Programs 94,693 41,319 -53,374
Health Insurance and
Personal Finance
Literacy
30,000 165,000 135,000
-------------------------------------------------------------------------------------------------------------
Food Safety and Health Team
Dining with Diabetes 43,232 59,068 15,836
Expanded Food &
Nutrition Education
program
37,220 18,895 -18,325
PA Nutrition Education
Tracks (SNAP-ED) 0 0 0
Eat Healthy, Be Active 12,000 0 -12,000
StrongWomen/Growing
Stronger 102,964 572,932 469,968
Everybody Walks in
Pennsylvania 0 0 0
Food Safety training for
producers 114,744 55,000 -59,744
Food Safety training for
processors 0 0 0
Food Safety for Retail
Manager 10,000 0 -10,000
Food Safety for
Consumers 0 0 0
Dairy Processing 0 0 0
Meat and Poultry
Processing 0 0 0
Wine Quality 0 0 0
-------------------------------------------------------------------------------------------------------------
Veterinary Team
Mastitis & milk quality 23,154 12,337 -10,817
Bovine Hoof Health 0 0 0
(Dairy) Beef Quality 19,500 0 -19,500

71
Assurance and prudent
antimicrobial use
Animal health & welfare 39,394 91,200 51,806
Dairy Production
Medicine Certificate
Program
0 0 0
Animal Nutrition &
Metabolic Disease 0 31,993 31,993
-------------------------------------------------------------------------------------------------------------
4-H and Youth Development Team
4-H and Youth
Development 779,203 302,620 -476,583
-------------------------------------------------------------------------------------------------------------
Field and Forage Crops Team
Integrated Crop
Production Practices 13,039,613 1,943,886 -11,095,727
Nutrient and manure
management 17,704,471 92,071 -17,612,400
Pests (insect, disease and
plant) Monitoring and
Management
4,846,728 1,541,804 -3,304,924
Soil 14,551 0 -14,551
-------------------------------------------------------------------------------------------------------------
Renewable Natural Resources Team
Forest Products and
Services 134,010 2,000,400 1,866,390
Managing Community
and Urban Natural
Resources
2,648,117 3,071,187 423,070
PA Woodland Owners
Education Network 1,089,294 1,088,250 -1,044
Safe Drinking Water 0 0 0
Sustaining PA’s Forests
Private forest
landowners
1,242,000 1,086,881 -155,119
Watershed Education 2,878,672 700,000 -2,178,672
PA Farm Safety &
Health Quiz Bowl
Contest
0 0 0
Safe Tractor &
Machinery Operation
program
333,678 521,563 187,885
Safety & Health
Management 1,295,408 2,842,222 1,546,814
Manure Storage Safety 177,199 447,577 270,378
Renewable Energy 4,138,369 6,599,500 2,461,131

72
-------------------------------------------------------------------------------------------------------------
Horticulture Team
Tree Fruit Production
Practices 35,500 66,500 31,000
Retooling the
Pennsylvania Tree Fruit
Industry with Innovative
Technologies
1,435,662 1,413,112 -22,550
Farm Transitions 0 0 0
Selection, and
Evaluation of
New/Novel and
Traditionally Grown
Specialty Crop Cultivars
399,358 56,698 -342,660
Monitoring, prediction,
and management of
pests, beneficial and
pollinators
5,769,346 2,872,195 -2,897,151
Best Management
Practices for Soil, Water,
and Nutrient
Management
118,997 8,046 -110,951
Greenhouse and Nursery
Production 19,249 43,536 24,287
Landscape Business
Management 10,000 0 -10,000
Turf grass Management 203,011 16,780 -186,231
Master Gardener
Program 300,200 0 -300,200
Total 70,570,637 34,259,073
A backward Wald binary logistic regression was performed using four independent variables
(degree centrality, gatekeeper brokerage, consultant brokerage, and liaison brokerage) to
ascertain whether they significantly predicted/explained the change (increase or decrease) in
business performance of programs from year 2011-12 to 2013-14. A test of the full model
(inclusive of all independent variables) against a constant only model was statistically
significant, χ2 (4, N=60) = 10.432, p =0.034, indicating that the predictors (degree centrality,
gatekeeper brokerage, consultant brokerage, and liaison brokerage) were statistically significant

73
in predicting/explaining change in business performance of programs) (see Table 5). The model
correctly classified 66.7% of programs for negative change and 60.0% for positive change in
business performance with an overall correct classification rate of 63.3% (see Table 6). Wald
statistics indicated that none of the four variables individually predicted the change in business
performance of the programs but collectively they were significant predictors (see Table 5). The
researcher then developed the most parsimonious model using backward Wald logistic
regression.
A backward Wald logistic model with degree centrality was significantly different from full
model, χ2 (1, N=60) = 6.307, p =0.012 (see Table 5). Wald statistics confirmed that degree
centrality significantly predicted the change in business performance of the programs. However,
the odds ratio for degree centrality showed that the odds that programs had a positive change
decreased by 16.3% with a single unit increase in degree centrality (see Table 5). Thus, degree
centrality has some influence in distinguishing between which programs have the positive
change and which programs have the negative change in business performance, but the
distinction is not strong as the odds ratio is only 0.837. Results presented above partially
supported the hypotheses 1 and 2 of the study, as all together, four predictors predicted the
change in business performance of programs but individually only degree centrality was a
significant predictor.

74
Table 5
Logistic Regression Analysis of Change in Program’s Business Performance Status as a function
of Degree Centrality and Brokerage Measures (n=60)
Variable
B
SE B
Wald
p
Exp B
95% CI for Exp B
Lower Upper
Step 1 (complete model with all independent variables)
Degree Centrality -0.141 0.081 3.013 0.083 0.869 0.741 1.018
Gatekeeper Brokerage 0.400 0.475 0.707 0.400 1.491 0.588 3.785
Consultant Brokerage 0.360 0.361 0.999 0.318 1.434 0.707 2.908
Liaison Brokerage -0.441 0.514 0.736 0.391 0.644 0.235 1.761
Constant 1.772 1.043 2.888 0.089 5.884 - -
Model Summary (Omnibus Tests): Chi-square=10.432; 2-Log Likelihood = 72.746; df =4; p =0.034; Nagelkerke R2
=0.213, Cox and Snell R2= 0.160
Step 4 (model with one independent variable)
Degree Centrality -0.178 0.077 5.409 0.020 0.837 0.720 0.972
Constant 1.902 0.852 4.796 0.026 6.697 - -
Model Summary (Omnibus Tests): Chi-square=6.307; 2-Log Likelihood = 76.871; df =1; p =0.012; Nagelkerke R2
=0.133, Cox and Snell R2= 0.100
Table 6
The Observed and Predicted frequencies for Change in Program’s Business Performance Status
by Logistic Regression with the cutoff of 0.50
Observed (step 1:
complete model)
Predicted % Correct
Negative Change Positive Change
Negative Change (30) 20 10 66.7
Positive Change (30) 12 18 60.0
Overall % Correct 63.3
Step 4 (only one independent variable, Degree Centrality included)
Negative Change (30) 17 13 56.7
Positive Change (30) 10 20 66.7
Overall % Correct 61.7

75
Objective 3: Examine the influence of five types of brokerage (liaison, itinerant, gatekeeper,
representative, and coordinator) and degree centrality on demand for the Extension programs
After analyzing the data for all 60 programs, the top three programs which had the highest
increase in program demand (measured by number of participants who attended each of the 60
programs face-to-face) from year 2011-12 to 2013-14 among stakeholders were: PROSPER
(17,709), Equine Environmental Stewardship (11,945), and Marcellus Shale (7,223). The top
three programs which had the highest decrease in demand for the program from year 2011-12 to
2013-14 were: Equine Health and Well-being (-23,905), Master Gardner Program (-5,496), and
Dairy Business Management (-5,316). See Table 7 for detailed description of change in demand
for each program.
Table 7
Direct contact for the Programs
Programs Direct
Number of
contacts
for 2010-
11
Direct
Number of
contacts
for 2011-
12
Direct
Number of
contacts
for 2012-
13
Direct
Number of
contacts
for 2013-
14*
Increase
from 2011-
12 to 2013-
14*
Ag Entrepreneurship, Economic and Community Development Team
Ag Business
Management 2,139 101 11,617 4,978 4,877
Economic & Community
Development 17,622 14,298 4,386 11,617 -2,681
Marcellus Shale 59,426 27,650 21,533 34,873 7,223
Entrepreneurship 16,894 8,335 848 8,116 -219
-----------------------------------------------------------------------------------------------------------------
Dairy Team
Dairy Business
Management 8,653 14,226 4,374 8,910 -5,316
Dairy Human Resource
& Team Management 1,054 416 2,423 1,350 934
Dairy Nutrient & Feed 1,276 609 2,835 1,633 1,024

76
Management
-----------------------------------------------------------------------------------------------------------------
Equine Team
Equine Environmental
Stewardship 36,379 3,080 8,475 15,025 11,945
Equine Health and Well-
Being 594 36,338 647 12,433 -23,905
-----------------------------------------------------------------------------------------------------------------
Livestock Team
Livestock Production
Efficiency 7,049 7,716 4,773 6,426 -1,290
-----------------------------------------------------------------------------------------------------------------
Poultry Team
Poultry Health and
Management 12,969 5,503 4,030 7,187 1,684
-----------------------------------------------------------------------------------------------------------------
Family and Consumer Science Team
Better Kid Care 21,091 13,970 7,647 13,753 -217
PROSPER 15,866 11,055 54,954 28,764 17,709
Intergenerational
Programs 870 173 3,243 1,519 1,346
Health Insurance and
Personal Finance
Literacy
3,480 415 0 1,177 762
-----------------------------------------------------------------------------------------------------------------
Food Safety and Health Team
Dining with Diabetes 8,582 3,880 5,792 5,993 2,113
Expanded Food &
Nutrition Education
program
791 3,028 6,728 3,731 703
PA Nutrition Education
Tracks (SNAP-ED) 5,318 6,213 15,086 9,235 3,022
Eat Healthy, Be Active 0 209 195 141 -68
StrongWomen/Growing
Stronger 59,297 44,098 38,950 46,729 2,631
Everybody Walks in
Pennsylvania 0 0 0 0 0
Food Safety training for
producers 2,491 1,387 1,760 1,855 468
Food Safety training for
processors 1,041 1,958 394 1,104 -854
Food Safety for Retail
Manager 5,266 4,727 3,543 4,449 -278
Food Safety for
Consumers 7,041 3,149 2,310 4,000 851
Dairy Processing 0 0 57 21 21
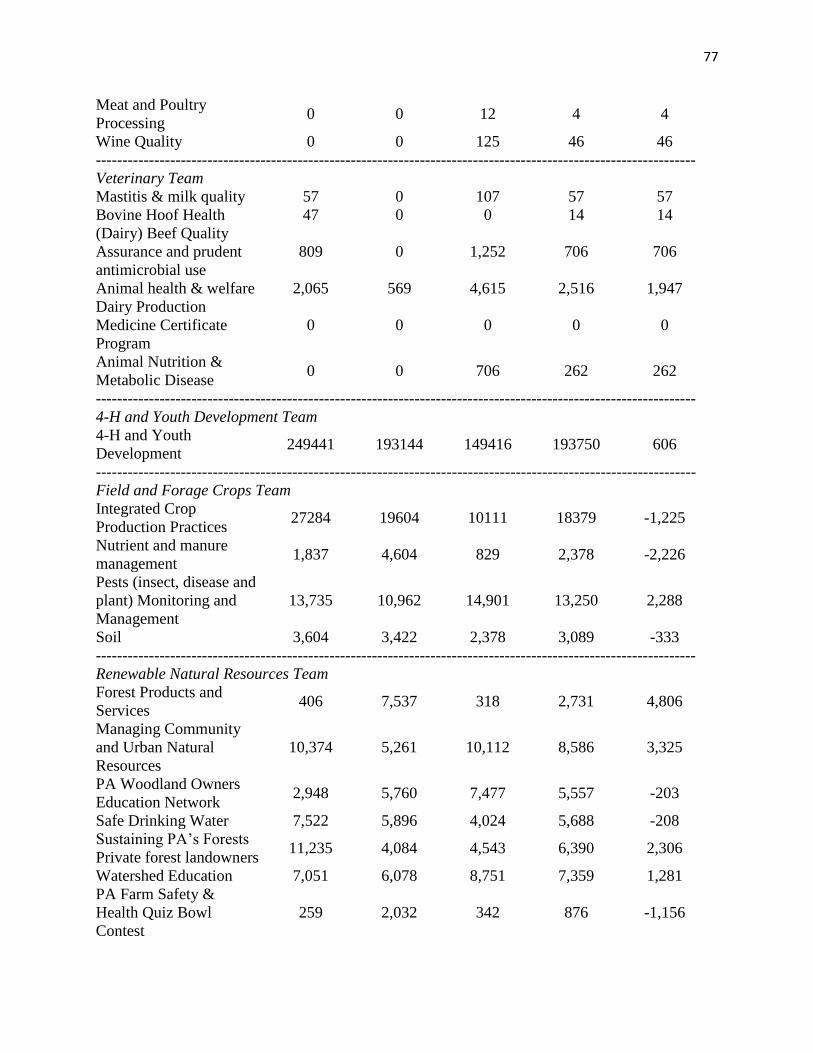
77
Meat and Poultry
Processing 0 0 12 4 4
Wine Quality 0 0 125 46 46
-----------------------------------------------------------------------------------------------------------------
Veterinary Team
Mastitis & milk quality 57 0 107 57 57
Bovine Hoof Health 47 0 0 14 14
(Dairy) Beef Quality
Assurance and prudent
antimicrobial use
809 0 1,252 706 706
Animal health & welfare 2,065 569 4,615 2,516 1,947
Dairy Production
Medicine Certificate
Program
0 0 0 0 0
Animal Nutrition &
Metabolic Disease 0 0 706 262 262
-----------------------------------------------------------------------------------------------------------------
4-H and Youth Development Team
4-H and Youth
Development 249441 193144 149416 193750 606
-----------------------------------------------------------------------------------------------------------------
Field and Forage Crops Team
Integrated Crop
Production Practices 27284 19604 10111 18379 -1,225
Nutrient and manure
management 1,837 4,604 829 2,378 -2,226
Pests (insect, disease and
plant) Monitoring and
Management
13,735 10,962 14,901 13,250 2,288
Soil 3,604 3,422 2,378 3,089 -333
-----------------------------------------------------------------------------------------------------------------
Renewable Natural Resources Team
Forest Products and
Services 406 7,537 318 2,731 4,806
Managing Community
and Urban Natural
Resources
10,374 5,261 10,112 8,586 3,325
PA Woodland Owners
Education Network 2,948 5,760 7,477 5,557 -203
Safe Drinking Water 7,522 5,896 4,024 5,688 -208
Sustaining PA’s Forests
Private forest landowners 11,235 4,084 4,543 6,390 2,306
Watershed Education 7,051 6,078 8,751 7,359 1,281
PA Farm Safety &
Health Quiz Bowl
Contest
259 2,032 342 876 -1,156

78
Safe Tractor &
Machinery Operation
program
8,408 11,676 2,302 7,225 -4,451
Safety & Health
Management 38,820 24,562 13,339 24,660 98
Manure Storage Safety 789 886 2,229 1,355 469
Renewable Energy 3,528 2,826 1,464 2,531 -295
-----------------------------------------------------------------------------------------------------------------
Horticulture Team
Tree Fruit Production
Practices 3,099 1,899 11,603 5,854 3,955
Retooling the
Pennsylvania Tree Fruit
Industry with Innovative
Technologies
4,765 7,019 5,596 5,818 -1,201
Farm Transitions 23 569 27 205 -364
Selection, and Evaluation
of New/Novel and
Traditionally Grown
Specialty Crop Cultivars
2,066 1,813 866 1,538 -275
Monitoring, prediction,
and management of
pests, beneficial and
pollinators
15,493 17,144 14,817 15,788 -1,356
Best Management
Practices for Soil, Water,
and Nutrient
Management
4,463 5,233 4,269 4,646 -587
Greenhouse and Nursery
Production 5,808 4,536 2,715 4,241 -295
Landscape Business
Management 6,401 359 580 2,245 1,886
Turf grass Management 7,205 4,449 2,574 4,577 128
Master Gardener
Program 47,556 35,976 11,819 30,480 -5,496
Total 782,287 600,434 500,819 617,823
Note: * represents the projected values
A backward Wald binary logistic regression was performed on three independent variables of the
study (degree centrality, gatekeeper brokerage, and liaison brokerage), to ascertain whether they
significantly predicted the change (increase or decrease) in demand of the program from year
2011-12 to 2013-14. Only three independent variables were used because of an issue with the

79
values for consultant brokerage. For those programs coded a zero (0) on the dependent variable
demand for the program, they exhibited a constant for the variable consultant brokerage.
Inclusion of consultant brokerage in the model led to an unstable model; therefore consultant
brokerage was not included.
The results of logistic regression for demand for the programs are summarized in Table 8.
Neither the full model nor the reduced model was statistically significant.
Table 8
Logistic Regression Analysis of Change in Demand for the Program Status as a function of
Degree Centrality and Brokerage Measures (n=60)
Variable
B
SE B
Wald
p
Exp B
95% CI for Exp B
Lower Upper
Step 1 (complete model with all independent variables)
Degree Centrality -0.088 0.071 1.553 0.213 0.915 0.797 1.052
Gatekeeper Brokerage -0.389 0.333 1.361 0.243 0.678 0.353 1.302
Liaison Brokerage -0.279 0.506 0.303 0.582 0.757 0.280 2.041
Constant 1.702 0.950 3.210 0.073 5.483 - -
Model Summary (Omnibus Tests): Chi-square=3.042; 2-Log Likelihood = 78.461; df =3; p =0.385; Nagelkerke R2
=0.067, Cox and Snell R2= 0.049
Step 3 (model with one independent variable)
Degree Centrality -0.082 0.068 1.460 0.227 0.921 0.806 1.052
Constant 1.226 0.787 2.428 0.119 3.408 - -
Model Summary (Omnibus Tests): Chi-square=1.498; 2-Log Likelihood = 80.005; df =1; p =0.221; Nagelkerke R2
=0.033, Cox and Snell R2= 0.025

80
CHAPTER 5
SUMMARY, CONCLUSIONS AND RECOMMENDATIONS
This chapter summarizes the findings of the study, draws conclusions and provides a discussion
for each objective. In addition, overall recommendations and implications are presented for
Extension administrators, program reporting and accountability and for further research.
Purpose and Objectives:
The purpose of this study was to understand the diversity and reach of Cooperative Extension
programs in Pennsylvania delivered by Penn State Extension and the influence of various
network variables (Brokerage and Centrality) on two program outcomes (program business
performance and demand for the program) through Social Network Analysis (SNA). Specific
objectives of the study were to:
1. Develop a holistic network map of programs and program stakeholders to understand the
diversity and reach of Extension programs in Pennsylvania.
2. Examine the influence of five types of brokerage (liaison, itinerant, gatekeeper,
representative, and coordinator) and degree centrality on Extension program business
performance.
3. Examine the influence of five types of brokerage (liaison, itinerant, gatekeeper,
representative, and coordinator) and degree centrality on demand for Extension programs.

81
Hypotheses/ Research Questions:
The following four hypotheses guided the study:
Hypothesis 1: For all five types of brokerage (liaison, itinerant, gatekeeper, representative and
coordinator), programs which control the flow of information and resources between pairs of
other programs are hypothesized to have higher business performance than the programs that do
not control the flow of information and resources.
Hypothesis 2: The higher the degree centrality of the program, greater would be its business
performance.
Hypothesis 3: For all five types of brokerage (liaison, itinerant, gatekeeper, representative and
coordinator), programs which control the flow of information and resources between pairs of
other programs are hypothesized to have greater demand among stakeholders than the programs
that do not control the flow of information and resources.
Hypothesis 4: The higher the degree centrality of the program the greater would be its demand
among the stakeholders.
Summary of Study Procedures:
This research was conducted with the cooperation of Penn State Extension (PSE), the outreach
component of the College of Agricultural Sciences at the Pennsylvania State University. The
population for this study consisted of all the programs offered by PSE and the respective
stakeholders. The sampling method used for this study was a ‘census’ meaning all the programs
and the respective stakeholders were used for this study. The study utilized SNA methodology
and ex-post facto research design.

82
The independent variables in the study were the network variables, which included five types of
brokers (liaison, gatekeeper, representative, itinerant, and coordinator), and degree centrality of
Extension programs.
Data for independent variables was collected for various programs offered by PSE and the
program stakeholders from all the seven State Program Leaders (SPLs), 48 State Extension Team
Leaders (SETLs) and the director of Penn State Extension through an electronic questionnaire
using SurveyMonkey. Data from a list of programs and program stakeholders was entered into
UCINET 6; a user-friendly SNA package for analysis of social network data (Borgatti, Everett,
& Freeman, 2002). Based on two mode matrix of programs and their stakeholders, the complete
network map of programs and the stakeholders was drawn using Netdraw (Borgatti, 2002).
Using network maps, characteristics of PSE network were also described. After converting the
two mode matrix into single mode (programs to programs connected through common
stakeholders) through the “affiliation” process in UCINET, the independent variables, degree
centrality and five types of brokerage were calculated.
There were two dependent variables for the study, which included change in program business
performance and change in demand for each program. For both the dependent variables, the data
were collected in two stages. In the first stage existing base line data for the year 2011-12 (the
year PSE adopted the new business model), and then the data for year 2013-14 were collected.
The difference between the baseline and current year (2013-2014) was treated as the change
value for these two dependent variables. The dependent variable, program business performance
was operationally defined as the number of grants and developmental funding (gifts) received by
all the programs. Additional revenue sources such as fees, sale of publications and other sources
of funding were not included in calculation of business performance of Extension programs. The
83
data for this variable was collected from the database maintained in the grants and contracts
office.
The second dependent variable, demand for programs was operationally defined as the number
of participants who attended each of the 60 programs, face-to-face. The data for this variable was
collected using the contact information for number of participants who attended various
educational programs offered by Penn State Extension for years 2010-11, 2011-12 and 2012-13.
The rationale for collecting data for three years was that data for year 2013-14 was not available
and to project the data, the researcher utilized the data from past three years. The data projection
for the year 2013-14 was completed utilizing the “exponential smoothing method.”
Data were analyzed using the Statistical Package for Social Sciences (SPSS 21). Binary logistic
regression was used to test the hypotheses. The dependent variables (change in program business
performance and change in demand for the program) were dichotomized into programs with
negative change (from 2011-12 to 2013-14) or programs with positive change. All the
assumptions of binary logistic regression were checked and data satisfied all the assumptions,
except for a very high correlation (r=0.997) between two independent variables: gatekeeper and
representative broker, a strong indicator of potential multicollinearity problems. To overcome
the issue of multicollinearity (in this case almost an issue of singularity) and reduce potential
problems of multicollinearity, the representative broker variable was removed from the analysis.
Another independent variable, coordinator broker was also not included in the analysis because
during the calculation of five types of brokers, the value for coordinator broker was zero (a
constant) for all the 60 programs. In the final binary logistic regression analysis, out of the six
independent variables in the study (liaison, gatekeeper, representative, itinerant, and
coordinator brokers and degree centrality), only four variables (liaison, gatekeeper, and

84
itinerant brokers and degree centrality) were used. The study also used descriptive statistics,
such as frequencies and percentages to describe the independent and dependent variables.
Summary of Results:
For each objective of the study, findings are presented first, followed by conclusion and
discussion.
Objective 1: Develop a holistic network map of programs and program stakeholders to
understand the diversity and reach of Extension programs in Pennsylvania
Findings: Findings related to degree centrality of programs revealed that the top three programs
with the highest degree centrality were: forest products and services, integrated crop production
practices, and dairy business management. On the other hand, the programs with the lowest
degree centrality were PA farm safety and health quiz bowl contest, farm transitions, and meat
and poultry processing. Among Extension program teams, the highest degree centrality was
recorded for renewable natural resources, followed by horticulture and field and forage crops.
Based on findings of the study none of the programs occupied the coordinator brokerage
position, while safe drinking water, manure storage safety, and best management practices for
soil, water, and nutrient management programs occupied the highest brokerage positions for both
representative and gatekeeper brokerage. Regarding consultant brokerage, the programs which
utilized their position most were dairy human resource and team management, food safety for
consumers, intergenerational programs, and everybody walks in Pennsylvania program. Finally,
for liaison brokerage, 31 programs had the same brokerage values which indicated that they had
the same potential to broker unconnected programs.
85
Penn State Extension offered 60 programs which were connected to 293 stakeholders, with an
average of 19.18 (SD=9.80) stakeholders per program (maximum=52, minimum=5). The entire
network map of programs to stakeholders revealed that whole network of PSE is widespread.
The network was divided in two parts and further analysis revealed that the entire network
contained four clusters A, B, C, and D. The programs which are part of a cluster have more in
common compared to other programs. There were few programs that were in the center of the
network such as managing community and urban natural resources and ag business management
and few programs were isolates such as programs related to food safety, 4-H and youth
development, equine health and wellbeing and livestock production efficiency. These programs
being isolates represent the specificity of stakeholders and have less in common with other
programs. The network was further simplified by just keeping the government stakeholders, such
as government agencies that were the primary funding sources for programs. Upon
simplification, the network characteristics were similar to the original network, but there were
few isolates which were not connected to any stakeholders -- farm transitions, manure storage
safety and safe tractor and machinery operation program.
PSE networks were further studied by a different perspective by explaining just programs to
programs network where the connection between two programs was common stakeholders. This
network shows that programs were well connected and the network was very dense (See Figure
7).
The PSE network was further simplified by condensing the 60 programs into 12 teams. The team
to stakeholder’s network was also very widespread. This network was also divided into two parts
and had two clusters A and B. Some teams were isolates representing their specificity to
stakeholders such as 4-H and youth development and livestock.

86
Conclusions: Based on the degree centrality results for programs it was concluded that programs
in natural resources, dairy and plant sciences were more connected to various other programs.
Programs in these areas have a number of alternatives available, and these programs can utilize
these alternatives for being more successful in organizational outcomes such as business
performance. The programs with lowest degree centrality values had limited connections and
limited resources available to them. In order to perform better, either they need to develop more
connections and collaborations with other programs or get merged with other larger programs in
their area of activity.
From the brokerage results, it was concluded that none of the programs acted as a coordinator or
local within group broker, indicating that all the programs for each team were well connected
and there were no gaps. Programs such as safe drinking water, manure storage safety, and best
management practices for soil, water, and nutrient management had the highest values for both
representative and gatekeeper brokerages suggesting that these programs controlled the flow of
information with in their teams. Both brokerage types-- representative and gatekeeper—for all
the programs were very highly related to each other (r=0.997). While many of the programs hold
liaison brokerage indicating that these programs were able to access the non-redundant
information from other two programs.
Analyzing the network maps of programs and their stakeholders it was concluded that the PSE
network is widely distributed and has extensive reach in the community by connections to
various stakeholders. The network consists of some clusters, and in examining the clusters it was
concluded that programs in these clusters have more in common. Efforts should be made for
greater collaboration between programs in each cluster that may be lacking in the current
network. The presence of some isolates (programs related to food safety, 4-H and youth

87
development, equine health and wellbeing and livestock production efficiency) in the whole
network suggests that they are niche areas and are less connected to stakeholders of other
programs because of their distinctiveness in their goals and objectives or unique program areas.
Similar conclusions were made for programs to government stakeholders. However, for isolates
(farm transitions, manure storage safety and safe tractor and machinery operation programs) in
programs to government stakeholders’ network, efforts should be made to increase their
connections to government agencies which may ultimately contribute to better performance.
The teams and stakeholders’ network are also very much consistent with programs and
stakeholder’s network. Similar conclusions were drawn as for teams and stakeholders’ network.
Overall it can be concluded that, SNA has much to offer in order to understand the outreach of
extension and in understanding various outcomes for PSE programs. The work of Extension is
largely dependent on the relationships with stakeholders, so SNA should be frequently utilized
by Extension to understand the dynamic outreach network to better serve target audiences.
Overall, SNA will be important in the future as Extension looks for alternative ways to utilize the
limited resources more efficiently.
Discussion: There are very limited studies which utilized SNA to understand the outreach of
Extension. The findings of the study were consistent with Bartholomay et al. (2011), who
applied SNA in a Minnesota Extension study. They found that the reach of programs in the
network was very wide, and the Minnesota complete network was divided into two parts with
existence of three clusters in the network. These results are consistent with the current study, but
the only difference found was that in the Minnesota study, master gardener programs was located
in the center of the network with no association to any cluster while in the current study master

88
gardener program was part of a cluster named ‘C’ (See Figure 5). This difference can be
explained by the fact that different states have different structures for Extension and different
association of various programs to different groups. Another difference was that in the
University of Minnesota Extension study, the 4-H program was part of the cluster that comprised
family and consumer science but in the current study 4-H and youth development was found to
be an isolate. A plausible reason for this difference is that 4-H and youth development programs
are different in the two states. For example, University of Minnesota has a center for youth
development, while it is not the case in Pennsylvania. In Pennsylvania, the administrative
structure has undergone several changes during the past decade.
The conclusions of Bartholomay et al. (2011) and Springer & de Steiguer (2011) studies support
the conclusions from the current study that SNA provides valuable information for understanding
Extension outreach and various outcomes of Extension programs and for identification of greater
internal collaboration among programs.
Objective 2: Examine the influence of five types of brokerage (liaison, itinerant, gatekeeper,
representative, and coordinator) and degree centrality on Extension program business
performance
Findings: Findings of the study revealed that the top three programs which had a positive
change in business performance were: renewable energy, forest products and services, and safety
and health management. The three programs with highest negative change in business
performance were: nutrient and manure management, integrated crop production practices, and
pests (insects, disease and plant) monitoring and management.

89
Analysis of backward Wald binary logistic regression revealed that full model containing all the
independent variables (degree centrality, gatekeeper brokerage, consultant brokerage, and liaison
brokerage) was statistically significant compared to the constant only model. But Wald statistics
indicated that none of the four predictors as a collective group were significantly affecting the
business performance. A reduced model with only degree centrality was found statistically
significant (p <.05) and Wald statistics revealed that degree centrality significantly affected the
business performance of programs. Degree centrality was mainly associated with negative
change in business performance of programs.
Conclusions: Based on the findings for objective 2, it was concluded that programs under the
renewable natural resources team are performing better compared to others by securing a greater
number of grants over the years. This trend can be attributed to the fact that funding agencies and
formula funding are emphasizing sustenance of nature by investing more in renewable energy
sources. The highest decrease in program business performance occurred in the field and forage
crops teams. This may imply that research on crop development is less emphasized by funding
agencies as farmers in US are able to produce enough food to feed the US population and
beyond.
The results of backward Wald logistic regression revealed that all kinds of brokerage types in
association with degree centrality significantly predicted/explained the change in business
performance. However, individually, only degree centrality explained a relatively small portion
of the change. Programs holding a brokerage position can only explain the change in business
performance in association with degree centrality. This implies that in addition to acting as a
broker, program also needs to have more connections to other programs in the network. But the
programs which have the higher degree centrality are going to see little decrease in business

90
performance. The possible reasons for these findings could be attributed to the fact that the
programs holding the brokerage positions have low absorptive capacity. This means that they
were unable to utilize benefits associated (information and resources) with their position, and
that made these programs to establish extra contacts as degree centrality, which predicted the
change in business performance. Another possible reason for such results would be the presence
of measurement error (inconsistent format of data collection, data availability, and poor data
quality) relative to both independent and dependent variables.
Discussion: The findings achieved in this study are very much consistent with Tsai (2001) where
he found that higher centrality of a business unit in an inter-organizational network did not
contribute to the business performance of the unit. Tsai concluded that costs of maintaining the
central position outweighed the benefits associated with central position and organization in
central position had poor absorptive capacity. On the other hand, a study by Soda et al. (2004)
found that current structural holes (a gap in the network or lack of connection between actors
which can be utilized by an actor for its personal benefit) in the network along with past network
closure (more connectedness among actors in the network) enhanced the performance of an
organization. These findings are consistent with the current study findings that different types of
brokerage positions (structural holes) along with degree centrality (closure) affect the business
performance of the programs. Graf and Krüger (2011) in their study found that gatekeeper
brokers in the innovation network were unable to extract complete benefits associated with their
position due to their poor absorptive capacity in the network. These findings also support the
findings achieved in this study that five types of brokers were unable to predict the reliable
change in business performance of the programs because programs occupying these network

91
positions were unable to utilize all the benefits associated with their position besides their poor
absorptive capacities.
Powell et al. (1999) findings contradict the findings of this study. They found that centrality in
an inter-organizational network is a determining factor for better performance in biotech firms.
Plausible reason could be the use of eigenvector centrality by Powell et al., which is more
powerful compared to degree centrality. Further it should be noted here that degree centrality
only considers the number of direct contacts, whereas eigenvector centrality considers the
centrality of direct contacts. On the other hand, Sparrowe et al. (2001) found that higher degree
centrality of an individual in an advice network was positively associated with individual
performance. The reason why Powell et al. and Sparrowe et al. findings are not similar to the
findings of the current study is because the current study considered the business performance of
programs (groups of individuals) not as single individuals and degree centrality considered the
availability of all resources not just the information. It must be noted that outcomes of the
network vary with type of network, for example network of individuals and network of
organizations have different outcomes.
Objective 3: Examine the influence of five types of brokerage (liaison, itinerant, gatekeeper,
representative, and coordinator) and degree centrality on demand for the Extension programs
Findings: The number of participants who attended the 60 face-to-face programs, from 2011-12
to 2013-14 revealed that the top three programs which had the highest change in demand for the
program were PROSPER, equine environmental stewardship and Marcellus shale. The top three
programs which had the highest negative change in demand for programs were equine health and
wellbeing, master gardeners, and dairy business management.

92
The findings of backward Wald binary logistic regression revealed that the complete model
inclusive of all independent variables (degree centrality, gatekeeper brokerage, consultant
brokerage, and liaison brokerage) was not statistically significant compared to constant only
model. The variables as a collective group were not able to significantly explain changes in
demand for the programs.
Conclusions: Based on the findings, it can be concluded that programs dealing with issues like
early child care and environmental damage due to drilling of natural gas in Pennsylvania
(Marcellus shale) have become more important (popular) and attracted an increasing number of
people. Marcellus shale, which was earlier a small program, has grown exponentially in the past
few years due to its potential long-term effect on the lives of Pennsylvania residents. Whereas
highest decrease in demand for programs such as equine health and wellbeing, master gardeners
program and dairy business management could be attributed to less interest of people in horses,
and the increase in growth of master gardener in past years has peaked. It should be noted that
the demand for programs was measured by face-to-face attendance of audiences to the programs
only; however, in recent years, online delivery methods are an increasing trend in Extension.
Therefore, programs attracting fewer audiences should consider offering programs through
online delivery methods due to increased use of social media sites.
The results of backward Wald logistic regression suggests that none of the five type of brokerage
positions and degree centrality predicted/explained the change in demand for the program. The
reason why none of the five types of brokerage and degree centrality explained the change in
demand for the programs may be poor absorptive capacity of programs to use the new
information. Additionally, the increasing trend to reach people via online programs than face-to-
face should be considered. As indicated previously, data quality is also a concern.

93
Discussion: The researcher found limited literature which supports the findings of current study.
The reason for such findings would be poor data quality, bias in selection of indicators for
measuring the change in demand for the programs, increasing trend to reach people via online
programs than face-to-face, and lack of available data for number of people reached by online
programs.
The findings of the current study were not similar to the conclusion achieved in Hargadon and
Sutton (1997) study that network position in association with network memory (information and
resources provided by past networks) leads to production of new innovative products. These new
innovative products ultimately lead to more demand of product in the market. The reason why
current study hasn’t supported these findings could be the use of network memory in Hargadon
and Sutton (1997) study compared to five types of brokerage in the current study. Network
memory means contacts in the past which in turn enhance the demand for the product, but five
types of brokerage positions provides competitive advantage but plays no role in increasing
demand of new product and stakeholders.
Soh (2003) found that more number of repeated partners and high network centrality of firm
influenced the performance/demand of firms’ new product in the market. The findings of Soh’s
study were also not supported by the results of current study. The reason may be the inclusion of
five types of brokerage variables with degree centrality and poor data quality.

94
Based on the findings, conclusions and discussions achieved in this study, recommendations and
implications were offered for Extension administration, accountability and reporting and future
research.
Recommendation for Extension administration
The results of the study should be communicated to the entire PSE system for better
collaboration among programs in the time of tight funding and scarce resources.
There is a need for a centralized data management system for Extension to better plan
and document outcomes of extension programs in a systematic manner.
Administrators should encourage collaborative work among programs such as joint grant
writing, conducting programs together where there are common stakeholders considering
the various clusters found in the study.
Recommendation for accountability and reporting
In order to improve the reporting and accountability, key evaluation and outcome data
from all the programs should be collected through a standard data collection format that
is common across programs. Such format should not only help reporting both federal and
state mandates but also help in systematically evaluating all Extension programs.
Extension professionals need to use innovative methods of evaluation, including SNA,
which provides a clear picture of about reach of Extension among stakeholders. Networks
have to be analyzed periodically to assess change, improve internal collaboration, share
information and resources among programs in order to better serve the communities and
address the issues facing society more efficiently.

95
Recommendation for further research
Future researchers should examine egocentric network compared to structural network by
contacting every individual involved in PSE work for getting the list of programs and
whom they are serving.
Researchers should try to include some control variables such as age of programs, past
performance, network memory, other forms of revenue sources that defines business
performance of programs other than grants and gifts and area of operation to better
understand predictors of business performance and program demand.
Further study is needed to understand how the programs receive/secure grants and use
new ways to reach the target audiences by studying the advice network of the entire
individuals in PSE.

96
CHAPTER 6
INTAD Extra Chapter
This chapter, application of SNA to international agriculture and education settings (in this case,
India), is a fulfillment for the dual title degree program in International Agriculture and
Development (INTAD). Consequently, a detailed review of the application of SNA to Indian
agricultural Extension is discussed.
Using SNA as a framework, an approach for developing a SNA Education Program was
proposed. Specifically, the following questions guided the approach.
a) Who is going to be the audience for the proposed program? What information is needed
about the audience prior to developing and implementing the SNA education program
b) What methods will help obtain this information?
c) What potential challenges one may encounter in reaching the audience?
d) What goals and objectives will guide the program?
e) What strategies are needed to develop, implement and evaluate this program?
f) What will indicate to justify that the program is sustainable today as well as in the future?
g) And finally, what other critical questions that might help or hinder the program and how
these questions will be addressed?
A logic model specifying the sequence of actions which describe what the program will be and do
will be discussed. Identify key components of the logic model-- the inputs, outputs, expected
impact, assumptions, and external factors will guide the development, implementation, and
outcomes of SNA Education Program.
97
Introduction:
India is a vast country with varied agro-ecological situations and farmers with unequal resource base
operate under these situations. India has 53.11% of arable land with 53.97% of the population is
economically active in agriculture (Qamar & Swanson, 2013). Farmers in India are widely dispersed
that makes them hard to reach and different farmers have different information needs. Extension
promoted agricultural productivity, sustainable resource base, transmission of new technologies, and
agricultural development, but links between research, Extension and farmers in India is inadequate
and uncoordinated (Ferroni & Zhou, 2012). Farmers now work with various information sources to
tap on the markets and new available technologies and inputs to provide good quality products to
consumers (Ferroni & Zhou, 2012). The most important source of information to farmers is other
progressive farmers (16.8%), input dealers (13.2%), radio (9.4%) and TV (7%). Extension workers
as source of information is very limited (5.8%). Krishi Vighyan Kendra run by Indian Council of
Agricultural Research (ICAR) is mere 0.6% (Adhiguru et al., 2009). All different providers of
Extension just reach to 40% of total farmers in the country and typically advantage goes to large
growers (Ferroni & Zhou, 2012).
Extension has disproportionately benefited large farmers and neglected small and marginal farmers
and underrepresented population. Considering this, central and state governments are working
toward making Extension “pluralistic” and new thinking for Extension are decentralization,
outsourcing, cost-recovery, involvement of private sector and non-governmental organizations
(NGOs), and use of information communication technologies (Adhiguru, Birthal, & Ganesh Kumar,
2009; Ferroni & Zhou, 2012). Extension in India is inadequately funded with limited availability of
Extension agents characterized by lack of motivation, competence, performance and accountability
(Anderson, 2007). In public sector Extension, the evaluation and accountability of various Extension

98
programs and projects offered by Extension is very limited and there is a dire need for
experimentation, documentation, replication and scaling up what works with Extension to fulfill the
diverse needs of agricultural producers (Ferroni & Zhou, 2012). The problem is compounded by the
fact that the farm holdings in the country are shrinking in size, production costs are rising, and the
resource drain from the farm sector is mounting in recent decades (Planning Commission, 2005). By
the year 2020, India need to reach a production level of about 296.6 MT of food grains respectively
from the present production level of 206.39 MT (Planning Commission, 2005). The projected
production must emanate from improved resource productivity. Over the years, manpower and a
shortage of funding have adversely affected the performance of public sector agricultural extension
services. In India there are about 120 million farm holdings and the number is growing year by year.
If it is proposed to provide one village extension worker for every 800-1000 farm families, then the
requirement of field level extension workers is estimated to be about 1.3-1.5 million, against the
present availability of only about 0.1 million workers. Presently no state government can provide the
required number of field level workers, as it is cost prohibitive. The fund allocation for extension
activities under extension reform was very meager (Planning Commission, 2005).
Considering the need for increased accountability in Extension and to increase their reach in the
farming community across various economic statuses of farmers (small, medium or large),
evaluation is very much required for Extension system. It is very hard to visualize the reach and
penetration of Extension in the farming community, studying the networks of Extension personals
and farming community is a very good proposition to understand the reach of Extension. According
to Bartholomay, et al. (2011) Social Network Analysis (SNA) offers a unique method for describing
and measuring Extension outreach. SNA is a methodology which provides complementary visual
and statistical components for analyzing the traits of actors and their relationships (Kilduff & Tsai,

99
2003). This methodology has been widely used for decades in disciplines such as sociology, business
management and public health for understanding various individual or organizational outcomes
(Springer & de Steiguer, 2011). SNA has also been used in a diversity of applications, including
analyzing the roles of intra-firm networks and corporate business partnerships (Tsai & Ghoshal,
1998), examining how ideas and information are transferred amongst a field of professionals,
understanding the role of networks in various organizational outcomes (Brass et al.,2004). However,
the use of SNA does not exist in Indian Extension.
Considering this, an SNA education program is designed for all the extension educators,
administrators and various departments to utilize this method in their evaluation efforts. This will
help understand the reach of Extension in the farming community and to identify constraints that
hinder their efforts.
Goals and Objectives:
The goal of this program is to educate the Extension educators and Extension administrators of
different public agencies involved in agricultural Extension about the importance of SNA in
understanding the diversity and reach of Extension in the farming community with the help of visual
network maps of extension personals and their connection to farming community. Looking at the
visual network maps and relationship of various network variables to various Extension outcomes,
find out what constraints limiting the reach of Extension and by what ways Extension can increase
its penetration in the farming community to help farmers to increase their production and income.
Specific objectives of this program are:
1. During the months of November and December, 2014, 60% of Extension educators
associated with various public institutions will participate in the SNA education workshop

100
that will be held at UAS, Bangalore, Dharwad and Raichur from 9am-5pm, measured by
analyzing the enrollment forms of the workshop.
2. Extension educators associated with public institutions in Karnataka state will increase their
awareness and knowledge about the importance of SNA in understanding their reach in the
farming community by 50% after completion of a series of workshops measured by pre and
posttest.
3. Six months after completion of SNA education program workshop, 40% of Extension
educators associated with public institutions in Karnataka state out of the total who attended
the workshop will integrate the SNA methodology in their work to understand their reach in
the farming community assessed through personal interview and analyzing the official
records at the Extension administration.
4. One year after completion of SNA education program workshop, 70% of Extension
educators associated with public institutions in Karnataka state out of those who integrated
SNA methodologies with their work life after two months will complete an initial assessment
of their reach in the community and come out with the network maps, possible constraints to
their reach and ways to overcome these constraints. The objective will be measured by
reviewing the reports and network maps developed by the target audiences and observation
of how the results from the study are utilized in their accountability for their reach in the
farming community.

101
Figure 9. “SNA Education Program for Karnataka State Extension Education Unit” Logic Model

102
Target audiences of the program:
Due to the presence of varied agro-ecological conditions, varied income, land holdings and
resource level of farmers, and different departments managing agricultural sector/activities in
India, agricultural Extension is done by a variety of public, private and non-governmental
organizations. Due to the extensive dissemination of Extension education dissemination by
different organizations, the SNA education program will consider only the public institutions
involved in agricultural Extension in the state of Karnataka, India. The target audiences for this
program would be all the Extension educators and administrators at the various public
institutions in Karnataka state which are mentioned below.
• Karnataka State Department of Agriculture (DOA): this department is responsible for
agricultural Extension in the state. Specifically, in the department, Directorate of Extension looks
after the agricultural Extension. Extension educators from this department take the new
technology to the farmers. This department is also responsible for the implementation of one of
the important district level agriculture Extension model i.e. ATMA (Agriculture Technology
Management Agency). ATMA is a registered society of key stakeholders (farmers, development
departments, NGOs, input dealers, mass media, agribusiness companies, farmer organizations
etc.) involved in sustainable agricultural development at the district level.
• Indian Council of Agricultural Research (ICAR): it is the apex body which looks after the
agricultural research and education across the country. It comprises of 99 ICAR institutes and 53
state agricultural universities spread across India. Its Extension education division carries out
Extension activities across all the states of the country. State of Karnataka has 4 agriculture and
horticulture universities and a number of ICAR institutes.

103
• Agricultural Extension Division of ICAR: this division performs Extension activities
through 631 Krishi Vigyan Kendras (KVKs) and 44 Agricultural Technology Information
Centers (ATIC) across the country and Karnataka also have the KVKs and ATIC.
• State Agricultural Universities: Karnataka state has 4 agricultural and horticultural
universities. In these universities, Directorate of Extension carries out the limited Agricultural
Extension activities across the state. These universities also work in collaboration with the
Agricultural Extension Division of ICAR.
• National Institute of Agricultural Extension Management (MANAGE): it is an
autonomous established by the Government of India to assist central and state governments to
help improve their pluralistic Extension systems by bringing positive changes in policies,
programs and personal skills. This institute offers various trainings and offer one year diploma to
agricultural input dealers and responsible for implementation of the Agri-Clinics and Agri.
Business Centers Schemes across India.
• State Agricultural Management and Extension Training Institutes (SAMETI): it is present
in every state and conducts training courses on new agricultural technologies, extension
management, gender issues, extension reform and new information technologies.
• Commodity boards: every state has specific commodity boards which carry out Extension
in the state related to that specific commodity. Karnataka state has the Central Silk Board, Coffee
Board, Tobacco Board, and Cashew Export Promotion Council.
• Raitha Sampark Kendra (RSK): It is a Karnataka state specific organization, which is
founded with the goal to decentralize the Extension and provide Extension services to the
farmers at the Hobli level (Planning commission, 2005).

104
What needs to be known about target audiences before the development and
implementation of the SNA education program?
The first thing to be known by the programmer before developing and implementing a new
program is to understand the local context. That means before the development of the program
the programmer will understand the agricultural Extension system in the state of Karnataka, how
different public agricultural Extension organizations function, what is the level of relationship
between the extension educators and farmers, what are the ways in which extension programs are
disseminated to farmers, and how these organizations carry out the accountability for different
programs, where the accountability records are stored and how the results of the these
accountability results are incorporated into future programs.
Specific things to be known about the target audiences before the development and
implementation of the SNA education program are: personal interest and motivation towards
new methods to improve program accountability, education level, prior trainings in the area of
program SNA and program evaluation, their competencies, reception to new technologies, desire
to change, how proactive they are to technology change, and their understanding that they are
responsible to serve the farming community.
How the information about target audiences needs to be collected?
Information about the specific things to be known about the different target audiences and
answers to questions mentioned above will be collected through conducting a needs assessment
in Karnataka state with SNA education as the concentration of needs assessment. During needs
assessment, focus group interviews will be conducted across the state with Extension educators

105
and administrators of different public organizations, interview with the key informants and
visiting different organizations.
Potential challenges to reach the target audiences:
The main challenges to reach the target audiences are: different work schedules for different
organizations, geographically distant locations for different target audiences, support from
administration and state government, personal interest of target audiences to meet the
programmer regarding the SNA education program, development of SNA education benefit
message (that how it helps them in their work life) in a way that is best understood by all the
target audiences and at last lack of trust and buy in.
Strategies for Program Development:
After understanding the local situation and based on the results of the needs assessment, the SNA
education program will be designed. Based on the local needs of the target audiences two-day
workshops will be developed, which will be delivered during the month of November and
December, 2014 at the UAS Bangalore, UAS Dharwad and UAS, Raichur in separate sessions.
Bangalore, Dharwad and Raichur are the three main locations to cover the target audiences
across the state. At the same time, programmer will develop the curriculum and educational
material for the workshop, such as a PowerPoint presentation, poster gallery, live examples of
hypothetical network maps and practical lab where participants can execute what they learnt
during the workshop. The programmer will write the goals and objectives of the program,
develop the logic model to guide the program and develop the time frame for the program. At the
same time ways to evaluate the program are decided and indicators to assess the program success
are formalized.

106
Strategies for program implementation:
Once the location and day of the workshop id decided, curriculum, educational materials, and the
program will be advertised among all the stakeholders and efforts will be done to raise their
interest to attend the program. Later workshops will be conducted by the programmer with the
assistance of stakeholders at the three agricultural universities and the Department of
Agriculture.
Strategies for program evaluation:
For the evaluation of the SNA education program, the following procedures will be followed:
first the evaluation plan will be developed based on the objectives of the program; second, the
use of Rockwell and Bennett (2004) TOPS model to guide the evaluation process. Third,
indicators to assess the success of the program will be identified. Both formative and summative
evaluations will be used for program improvement and assess the outcomes of the program. Just
after completion of the workshops, a feedback form will be provided to participants to assess
their reaction on the quality of the program and ways to improve the program. Pre and posttest
questionnaire will be developed to assess the change in the knowledge of participants regarding
SNA. Three months after the conclusion of workshops, personal interviews and review of
various records will be done to assess the integration of SNA concept by the target audiences in
their evaluation of Extension activities. In the long-term, after one year, the participants who
utilized SNA to assess their reach of the farming community will be surveyed by assessing the
reports of results and visual network maps.

107
Ways to increase the sustainability of the program today as well as in the future:
Major constraint to the sustainability of any program are: lack of funding, lack of motivation,
especially to use the SNA methodology, lack of support from the administrators and colleagues,
and lack of practical application of program to real life situations.
These constraints to the sustainability of SNA program will be overcome by providing incentive
to target audiences who incorporate this methodology in their work life, a success story can be
used to demonstrate: 1) the practical usage of the program and ways in which SNA methodology
helped the successful extension educator, 2) to assess his/her reach in the farming community
and ability, 3) to identify barriers and opportunities to increase their reach in the community, 4)
being useful for accountability of Extension funding to support these efforts from state and
central government and 5) proper support should be offered from administrators. Extension
educators who are using this methodology should be encouraged to train their colleagues in the
organization so that use of SNA methodology becomes self-sustainable.
What other critical questions that might hinder the program and how to overcome them?
Other critical questions that hinders the program are: lack of experts in the SNA methodology,
lack of competencies and resources available with various extension educators to carry out
evaluation using this methodology, lack of common governing body for Extension that guides
Extension across the state not the different organizations with the different accountability
requirements, and lack of interest among Extension educators to carry out the systematic
evaluation as most of them view evaluation as their own personal evaluation.
Ways to overcome the above mentioned questions, are to start a program development and
evaluation center at the state level with experts in program development, evaluation and SNA

108
methodology. Such a center will help in providing training to the Extension educators, inclusion
of courses related to SNA and program evaluation in the B.Sc. agriculture curriculum to increase
expertise in advanced methods of evaluation such as SNA. All the Extension offices should be
equipped with proper resources and computers with all the required software packages to carry
out the data analysis. There should be a common administrative department at the state level,
which looks after all the Extension activities across the state and have common accountability
procedures for the entire Extension organizations.

109
REFERENCES
Adhiguru, P., Birthal, P.S., & Ganesh Kumar, B. (2009). Strengthening pluralistic agricultural
information delivery system in India. Agricultural Economics Research Review, 22, 71-
79.
Albright, B.B. (2000). Cooperative Extension and the information technology era: An
assessment of current competencies and future needs of county Extension agents.
(Doctoral dissertation, Texas A&M University, 2000). Dissertation Abstracts
International, 61, 2668.
Anderson, J.R. (2007). Agricultural Advisory Services. Background paper for the World
Development Report 2008. Washington, DC: Agriculture and Rural Development
Department, World Bank.
Baldwin, T. T., Bedell, M. D., & Johnson, J. L. (1997). The social fabric of a team-based MBA
program: Network effects on student satisfaction and performance. Academy of
Management Journal, 40(6), 1369-1397.
Bartholomay, T., Chazdon, S., Marczak, M. S., & Walker, K. C. (2011). Mapping Extension's
networks: Using social network analysis to explore Extension's outreach. Journal of
Extension, 49(6), 6FEA9.
Bonacich, P. (2007). Some unique properties of eigenvector centrality. Social Networks, 29, 555-
564.
Borgatti, S.P. (2005). Centrality and network flow. Social Networks, 27, 55-71.
Borgatti, S.P., (2002). Netdraw Visualization Software. Cambridge, MA: Analytic technologies.
Borgatti, S. P., & Everett, M. G. (1992). Notions of position in social network
analysis. Sociological Methodology, 22(1), 1-35.
Borgatti, S. P., & Everett, M. G. (1997). Network analysis of 2-mode data. Social Networks,
19(3), 243-269.
Borgatti, S.P., Everett, M.G. and Freeman, L.C. (2002). UCINET for Windows: Software for
Social Network Analysis. Harvard, MA: Analytic Technologies.
Brass, D. J. (1981). Structural relationships, job characteristics, and worker satisfaction and
performance. Administrative Science Quarterly, 26, 331-348.
Brass, D. J. (1984). Being in the right place: A structural analysis of individual influence in an
organization. Administrative Science Quarterly, 29(4) 518-539.
Brass, D. J., & Burkhardt, M. E. (1992). Centrality and power in organizations. In N. Nohria and
R. Eccles (Eds.), Networks and Organizations (191-215). Boston: Harvard Business
School Press.
Brass, D. J., & Burkhardt, M. E. (1993). Potential power and power use: An investigation of
structure and behavior. Academy of Management Journal, 36(3), 441-470.
110
Brass, D. J., Galaskiewicz, J., Greve, H. R., & Tsai, W. (2004). Taking stock of networks and
organizations: A multilevel perspective. Academy of Management Journal, 47(6), 795-
817.
Breiger, R. L. (1974). The duality of persons and groups. Social forces, 53(2), 181-190.
Bull, N.H., Cote, L.S., Warner, P.D., & McKinnie, M.R. (2004). Is Extension relevant for the
21st century? Journal of Extension, 42 (6), 6COM2.
Burt, R.S. (1992). Structural Holes: The Social Structure of Competition. Cambridge, MA:
Harverd University Press.
Butts, C. T. (2008). Social network analysis: A methodological introduction. Asian Journal of
Social Psychology, 11(1), 13-41.
Calvin, D. (2010). Faculty Senate Report on Extension. Penn State Extension. Retrieved from
http://extension.psu.edu/about/reports/CoopExtReport-01dec20101.pdf
Calvin, D.(2012). Extension Update to University Faculty Senate Report. Retrieved from
http://extension.psu.edu/about/reports/extension-update-to-university-faculty-senate-
report/view
Calvin, D. (May 2, 2014). The next 100 years: Extension marks centennial, innovates for the
future. Retrieved on May 16, 2014 from
http://news.psu.edu/story/314307/2014/05/02/research/next-100-years-extension-marks-
centennial-innovates-future
Cartwright, S., Case, P., Gallagher, T., & Hathaway, R. (2002). Extension's role in responding to
community crisis: Lessons from Klamath Falls, Oregon. Journal of Extension, 40(6),
6FEA2.
Chan, K., & Liebowitz, J. (2006). The synergy of social network analysis and knowledge
mapping: a case study. International Journal of Management and Decision Making, 7
(1), 19-35.
Cohen, W. M., & Levinthal, D. A. (1990). Absorptive capacity: a new perspective on learning
and innovation. Administrative Science Quarterly, 35(1), 996-1004.
Corbett, P. (2009). 2009 Facebook demographics and statistics report: 276% growth in 35-54
year old users. Retrieved from http://istrategylabs.com/2009/01/2009-facebook-
demographics-and-statistics-report-276-growth-in-35-54-year-old-users/
Diem, K. G., Hino, J., Martin, D., & Meisenbach, T. (2011). Is Extension ready to adopt
technology for delivering programs and reaching new audiences? Journal of
Extension, 49(6), 6FEA1.
Fernandez, R. M., & Gould, R. V. (1994). A dilemma of state power: Brokerage and influence in
the national health policy domain. American Journal of Sociology, 99(6), 1455-1491.

111
Ferroni, M., & Zhou, Y. (2012). Achievements and challenges in agricultural Extension in India.
Global Journal of Emerging Market Economics, 4 (3), 319-346.
Fowler, J. H., Christakis, N. A., Steptoe, & Roux, D. (2009). Dynamic spread of happiness in a
large social network: longitudinal analysis of the Framingham Heart Study social
network. BMJ: British Medical Journal, 238 (3), 23-27.
Franz, N. K., & Townson, L. (2008). The nature of complex organizations: The case of
Cooperative Extension. New Directions for Evaluation, 2008(120), 5-14.
Freeman, L. C. (1979). Centrality in social networks conceptual clarification. Social Networks,
1(3), 215-239.
Freeman, L. C., Roeder, D., & Mulholland, R. R. (1980). Centrality in social networks: II.
Experimental results. Social Networks, 2(2), 119-141.
Friedkin, N. E. (1993). Structural bases of interpersonal influence in groups: A longitudinal case
study. American Sociological Review, 58, 861-861.
Friedman, R. A., & Podolny, J. (1992). Differentiation of boundary spanning roles: Labor
negotiations and implications for role conflict. Administrative Science Quarterly, 37(1),
28-47.
Gould, R. V. (2003). Uses of Network Tools in Comparative Historical Research. In J. Mahoney
& D. Rueschemeyer (Eds) Comparative Historical Analysis in the Social Sciences (241-
269). Cambridge, Cambridge University Press.
Gould, R. V., & Fernandez, R. M. (1989). Structures of mediation: A formal approach to
brokerage in transaction networks. Sociological Methodology, 19, 89-126.
Graf, H. (2011). Gatekeepers in regional networks of innovators. Cambridge Journal of
Economics, 35(1), 173-198.
Graf, H., & Krüger, J. J. (2011). The performance of gatekeepers in innovator networks. Industry
and Innovation, 18(1), 69-88.
Granovetter, M. S. (1973). The strength of weak ties. American Journal of Sociology, 78(6),
1360-1380.
Green, S. (2012). Extension Online: Utilizing Technology to Enhance Educational
Outreach. Journal of Extension, 50(5), 5TOT4.
Greg, J.A., & Irani, T.A. (2004). Use of Information Technology by County Extension Agents of
the Florida Cooperative Extension Service. Journal of Extension, 42(3), 3RIB2.
Guenthner, J. F., & Swan, B. G. (2011). Extension learners' use of electronic technology. Journal
of Extension, 49(1), 1FEA2.
Gulati, R., & Gargiulo, M. (1999). Where do interorganizational networks come from? American
Journal of Sociology, 104(5), 1439-1493.

112
Hargadon, A., & Sutton, R. I. (1997). Technology brokering and innovation in a product
development firm. Administrative Science Quarterly, 42(4), 716-749.
Hawe, P., & Ghali, L. (2008). Use of social network analysis to map the social relationships of
staff and teachers at school. Health Education Research, 23(1), 62-69.
Hillmann, H. (2008). Localism and the limits of political brokerage: Evidence from
revolutionary vermont1. American Journal of Sociology, 114(2), 287-331.
Horrigan, J. (2009). Home broadband adaptation increases sharply in 2009 with big jumps
among seniors, low-income households. Retrieved from
http://www.pewinternet.org/Press-Releases/2009/Home-broadband-adoptation-increases-
supply-in-2009.aspx
Ibarra, H. (1993). Network centrality, power, and innovation involvement: Determinants of
technical and administrative roles. Academy of Management Journal, 36(3), 471-501.
Ilvento, T. W. (1997). Expanding the role and function of the Cooperative Extension System in
the university setting. Paper presented at the NAREA annual conference, Sturbridge, MA.
Kilduff, M., & Tsai,W. (2003). Social Networks and Organizations. Thousand Oaks, CA: Sage.
Klerkx, L., & Leeuwis, C. (2009). Establishment and embedding of innovation brokers at
different innovation system levels: Insights from the Dutch agricultural sector.
Technological Forecasting and Social Change, 76(6), 849-860.
Krackhardt, D. (1988). Predicting with networks: Nonparametric multiple regression analysis of
dyadic data. Social Networks, 10(4), 359-381.
Lauber, T. B., Decker, D. J., & Knuth, B. A. (2008). Social networks and community-based
natural resource management. Environmental Management, 42(4), 677-687.
Laumann, E. O., & Knoke, D. (1987). The organizational state: Social choice in national policy
domains. Madison: University of Wisconsin Press.
Lenhart, A. (2009). The democratization of online social networks: A look at the change in
demographics of social network users over time. Presentation at AoIR 10.0 in
Milwaukee, WI on October 8, 2009. Retrieved from
http://www.pewinternet.org/2009/10/08/the-democratization-of-online-social-networks/
Mandarano, L. A. (2009). Social network analysis of social capital in collaborative planning.
Society and Natural Resources, 22(3), 245-260.
Mertler, C. A., & Vannatta, R. A. (2010). Advanced and multivariate statistical methods:
Practical Application and Interpretation. Los Angeles, CA: Pyrczak Publishing.
Mincemoyer, C., Perkins, D., & Lillehoj, C. (2004). Perceptions of the Cooperative Extension
Service: A community resource for youth and family programs. Journal of extension,
42(3), 5FEA5. Retrieved from http://www.joe.org/joe/2004october/a5.php

113
National Institute of Food and Agriculture (NIFA) (n.d.). Extension. Retrieved from
http://www.csrees.usda.gov/qlinks/extension.html
Newman, M.E.J. (2005). A measure of betweenness centrality based on random Walks. Social
Networks, 25, 39-54.
Oh, H., & Kilduff, M. (2008). The ripple effect of personality on social structure: self-monitoring
origins of network brokerage. Journal of Applied Psychology, 93(5), 1155-1164.
Oke, A., Idiagbon-Oke, M., & Walumbwa, F. (2008). The relationship between brokers’
influence, strength of ties and NPD project outcomes in innovation-driven horizontal
networks. Journal of Operations Management, 26(5), 571-589.
Opsahl, T., Agneessens, F., & Skvoretz, J. (2010). Node centrality in weighted networks:
Generalizing degree and shortest paths. Social Networks, 32(3), 245-251.
Peters, S., & Franz, N. K. (2012). Stories and storytelling in Extension work. Journal of
Extension, 50(4), 4FEA1.
Planning commission (2005). Agricultural Extension Approach for XI Five-Year Plan. Retrieved
from http://www.manage.gov.in/extnref/XI-RECOMMENDATIONS.pdf
Podolny, J. M., & Baron, J. N. (1997). Resources and relationships: Social networks and
mobility in the workplace. American Sociological Review, 62, 673-693.
Pow, J., Gayen, K., Elliott, L., & Raeside, R. (2012). Understanding complex interactions using
social network analysis. Journal of Clinical Nursing, 21, 2772-2779.
Powell, W. W., Koput, K. W., Smith-Doerr, L., & Owen-Smith, J. (1999). Network position and
firm performance: Organizational returns to collaboration in the biotechnology industry.
Research in the Sociology of Organizations, 16(1), 129-159.
Provan, K. G., Fish, A., & Sydow, J. (2007). Interorganizational networks at the network level:
A review of the empirical literature on whole networks. Journal of Management, 33(3),
479-516.
Putnam, R. (1993). The prosperous community: social capital and public life. The American
Prospect, 4 (13). Retrieved from http://prospect.org/article/prosperous-community-social-
capital-and-public-life
Qamar, M.K., & Swanson, B.E. (2013). Republic of India: Extension and Advisory Services.
Washington, DC: International Food Policy Research Institute. Retrieved from
http://esa.ifpri.info/files/2013/02/INDIA-Extension-and-Advisory-Services-387KB.pdf
Rasmussen, W. (1989). Taking the university to the people: Seventy-five years of Cooperative
Extension. Ames: Iowa State University Press.
Ravindran, A. R., & Warsing Jr, D. P. (2012). Supply Chain Engineering: Models and
Applications. Boca Raton, CRC Press.

114
Rennekamp, R. (1995). The Program Development Process. University of Kentucky,
Cooperative Extension Service, Lexington, KY. Retrieved from
http://www.communitydevelopment.uiuc.edu/sp/altapp/UK-CES-
%20Program%20Development.pdf
Rhoades, E., Thomas, J. R., & Davis, A. (2009). Social networking among youth: How is 4-H
represented. Journal of Extension, 47(5), 5FEA6.
Roberts, T. G., Murphy, T. H., & Edgar, D. W. (2010). Exploring interaction between student
teachers during the student teaching experience. Journal of Agricultural
Education, 51(1), 113-125.
Rockwell, K., & Bennett, C. (2004). Targeting outcomes of programs: A hierarchy for targeting
outcomes and evaluating their achievement. Agricultural Leadership, Education &
Communication Department, University of Nebraska – Lincoln. Retrieved from
http://digitalcommons.unl.edu/aglecfacpub/48/
Rogers, E. M. (1992). Prospectus for a cooperative extension system in education. Science
Communication, 13(3), 248-255.
Ryall, M. D., & Sorenson, O. (2007). Brokers and competitive advantage. Management Science,
53(4), 566-583.
Silva, C. N. (2010). Ex Post Facto Study. In Salkind, N.L. (Eds.), Encyclopedia of Research
Design (466-467). Thousand Oaks: Sage Publications, Inc.
Soda, G., Usai, A., & Zaheer, A. (2004). Network memory: The influence of past and current
networks on performance. Academy of Management Journal, 47(6), 893-906.
Soh, P. H. (2003). The role of networking alliances in information acquisition and its
implications for new product performance. Journal of Business Venturing, 18(6), 727-
744.
Sparrowe, R. T., Liden, R. C., Wayne, S. J., & Kraimer, M. L. (2001). Social networks and the
performance of individuals and groups. Academy of Management Journal, 44(2), 316-
325.
Springer, A. C., & De Steiguer, J. E. (2011). Social network analysis: A tool to improve
understanding of collaborative management groups. Journal of Extension, 49(6), 6RIB7.
Stevenson, W. B., & Greenberg, D. (2000). Agency and social networks: Strategies of action in a
social structure of position, opposition, and opportunity. Administrative Science
Quarterly, 45(4), 651-678.
Stovel, K., Golub, B., & Milgrom, E. M. M. (2011). Stabilizing brokerage. Proceedings of the
National Academy of Sciences, 108 (Supplement 4), 326-332.
Stovel, K. & Shaw, L. (2013). Brokerage. Annual Review of Sociology, 38, 139-158.
Täube, V. G. (2004). Measuring the social capital of brokerage roles. Connections, 26(1), 29-52.

115
Tsai, W., & Ghoshal, S. (1998). Social capital and value creation: The role of intra-firm
networks. Academy of Management Journal, 41(4), 464-476.
Tsai, W. (2001). Knowledge transfer in intra-organizational networks: Effects of network
position and absorptive capacity on business unit innovation and performance. Academy
of Management Journal, 44(5), 996-1004.
Vera, E. R., & Schupp, T. (2006). Network analysis in comparative social sciences. Comparative
Education, 42(3), 405-429.
Wasserman, S., & Faust, K. (1994). Social Network Analysis: Methods and applications.
Cambridge, Cambridge university press.
Wellman, B., & Berkowitz, S. D. (1988). Social structures: A network approach (Vol. 2).
Cambridge, Cambridge university press.
West, B.C. (2007). Conducting program evaluations using the internet. Journal of Extension, 45
(1), ITOT3.
Williams, K. H. (2005). Social networks, social capital, and the use of information and
communications technology in socially excluded communities: a study of community
groups in Manchester, England (Doctoral dissertation, University of Michigan).
Yin, X., Wu, J., & Tsai, W. (2012). When unconnected others connect: Does degree of brokerage
persist after the formation of a multi-partner alliance? Organization Science, 23(6), 1682-
1699.
Zack, M.H. (2000). Researching organizational systems using social network analysis.
Proceedings of the 33rd Annual Hawaii International Conference on System Sciences.
doi: 10.1109/HICSS.2000.926933

116
APPENDIX A

117
Date: March 11, 2014 From: The Office for Research Protections - FWA#: FWA00001534 Courtney A. Whetzel, Compliance Coordinator
To: Anil Kumar Chaudhary Re: Determination of Exemption
IRB Protocol ID: 45329 Follow-up Date: March 10, 2019 Title of Protocol: Diversity and Reach of Cooperative Extension Programs and Effect of Brokerage
and Network Position on Extension Program Outcomes through Social Network Analysis (SNA)
The Office for Research Protections (ORP) has received and reviewed the above referenced eSubmission application. It has been determined that your research is exempt from IRB initial and ongoing review, as currently described in the application. You may begin your research. The category within the federal regulations under which your research is exempt is: 45 CFR 46.101(b)(2) Research involving the use of educational tests (cognitive, diagnostic, aptitude, achievement), survey procedures, interview procedures or observation of public behavior, unless: (i) information obtained is recorded in such a manner that human subjects can be identified, directly or through identifiers linked to the subjects; and (ii) any disclosure of the human subjects' responses outside the research could reasonably place the subjects at risk of criminal or civil liability or be damaging to the subjects' financial standing, employability, or reputation. Given that the IRB is not involved in the initial and ongoing review of this research, it is the investigator’s responsibility to review IRB Policy III “Exempt Review Process and Determination” which outlines:
What it means to be exempt and how determinations are made
What changes to the research protocol are and are not required to be reported to the ORP
Ongoing actions post-exemption determination including addressing problems and complaints, reporting closed research to the ORP and research audits
What occurs at the time of follow-up
Please do not hesitate to contact the Office for Research Protections (ORP) if you have any questions or concerns. Thank you for your continued efforts in protecting human participants in research. This correspondence should be maintained with your research records.
Vice President for Research
Office for Research Protections
The Pennsylvania State University
The 330 Building, Suite 205
University Park, PA 16802
Phone : (814) 865-1775
Fax: (814) 863-8699
Email : [email protected]
Web : www.research.psu.edu/orp

118
APPENDIX B

119
Initial Survey Electronic Mail
Date: Wednesday, April 2, 2014
Dear Program Leaders and State Extension Team Leaders,
I am working on my MS thesis titled "Diversity and Reach of Cooperative Extension Programs and Effect
of Brokerage and Network Position on Extension Program Outcomes through Social Network Analysis
(SNA)."
My research involves two parts: first part is to draw the network of all the programs offered by Penn State
Extension across the Commonwealth of Pennsylvania and their stakeholders. Data on list of all programs
and their stakeholders will be collected from all the program leaders and state Extension team leaders.
Refer to question # 1 in the survey.
Second part of my research is to assess the effect of network variables: centrality and brokerage on
Extension program outcomes: program business performance, demand for the program and program
identity. For this part of the research, most of the data is secondary except for program identity variable.
For program identity data will be collected from all program leaders and state Extension team leaders.
Refer to question # 2 in the survey.
While answering the program identity question, please consider the complete program area if you are a
program leader; and if you are state Extension team leader, please consider all the programs coming under
state Extension team.
This study is approved by the Institutional Review Board of Penn State for use of human subjects. PSU
IRB # 45329.
Please, complete this survey by 12th April, 2014. If you have any questions, please contact me. We truly
appreciate your time and assistance in the conduct of this research.
Thank you very much for completing this survey.
Here is a link to the survey:
https://www.surveymonkey.com/s.aspx
This link is uniquely tied to this survey and your email address. Please do not forward this message.
Please note: If you do not wish to receive further emails from us, please click the link below, and you will
be automatically removed from our mailing list.
https://www.surveymonkey.com/optout.aspx
Yours Sincerely
Anil Kumar Chaudhary
Graduate Assistant
009 Ferguson Building
Department of Agricultural Economics, Sociology and Education
Penn State University
Email id: [email protected]
Phone # 814-441-6209

120
Remainder Electronic Mails
Date: Thursday, April 10, 2014
Dear Program Leaders and State Extension Team Leaders,
One week ago, I sent you a survey regarding my MS thesis titled "Diversity and Reach of Cooperative
Extension Programs and Effect of Brokerage and Network Position on Extension Program Outcomes
through Social Network Analysis (SNA)." As of today, I have not received your completed survey.
Could you please take a few minutes from your busy schedule to complete the survey? Your responses
are valuable to my efforts in drawing the network of all the programs offered by Penn State Extension
across the Commonwealth of Pennsylvania and their stakeholders and later analyzing the effect of
network variables: centrality and brokerage on Extension program outcomes: program business
performance, demand for the program and program identity.
While answering the program identity question, please consider the complete program area if you are a
program leader; and if you are state Extension team leader, please consider all the programs coming under
state Extension team.
This study is approved by the Institutional Review Board of Penn State for use of human subjects. PSU
IRB # 45329.
Here is a link to the survey:
https://www.surveymonkey.com/s.aspx
Please complete the survey and return it by April 15, 2014.
Thank you again for your time and cooperation. If you have further questions, please contact me
([email protected] or 814-441-6209). Best wishes.
Sincerely,
Anil Kumar Chaudhary
Graduate Assistant
009 Ferguson Building
Department of Agricultural Economics, Sociology and Education
Penn State University
Email id: [email protected]
Phone # 814-441-6209
Please note: If you do not wish to receive further emails from us, please click the link below, and you will
be automatically removed from our mailing list.
https://www.surveymonkey.com/optout.aspx
Date: Wednesday, April 16, 2014
Dear Program Leaders and State Extension Team Leaders,
I request you please spare 10 minutes from your busy schedule to complete my survey. Without your
response I cannot complete my MS thesis.
Two week ago, I sent you a survey regarding my MS thesis titled "Diversity and Reach of Cooperative

121
Extension Programs and Effect of Brokerage and Network Position on Extension Program Outcomes
through Social Network Analysis (SNA)." As of today, I have not received your completed survey.
Could you please take a few minutes from your busy schedule to complete the survey? I need to complete
my MS thesis and your responses are valuable to my efforts in drawing the network of all the programs
offered by Penn State Extension across the Commonwealth of Pennsylvania and their stakeholders and
later analyzing the effect of network variables: centrality and brokerage on Extension program outcomes:
program business performance, demand for the program and program identity.
While answering the program identity question, please consider the complete program area if you are a
program leader; and if you are state Extension team leader, please consider all the programs coming under
state Extension team.
This study is approved by the Institutional Review Board of Penn State for use of human subjects. PSU
IRB # 45329.
Here is a link to the survey:
https://www.surveymonkey.com/s.aspx
Please complete the survey and return it by April 18, 2014. Please respond to my survey.
Thank you again for your time and cooperation. If you have further questions, please contact me
([email protected] or 814-441-6209). Best wishes.
Sincerely,
Anil Kumar Chaudhary
Graduate Assistant
009 Ferguson Building
Department of Agricultural Economics, Sociology and Education
Penn State University
Email id: [email protected]
Phone # 814-441-6209
Please note: If you do not wish to receive further emails from us, please click the link below, and you will
be automatically removed from our mailing list.
https://www.surveymonkey.com/optout.aspx

122
APPENDIX C
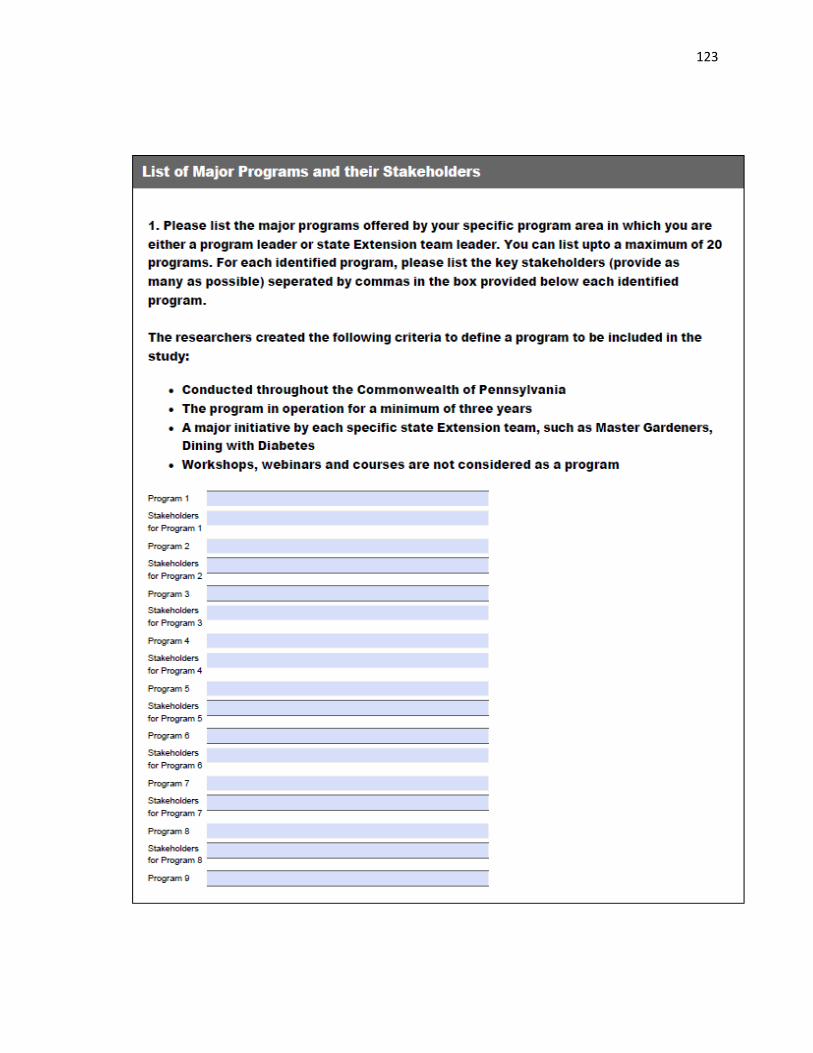
123

124

125

126

127
APPENDIX D

128
State Extension Teams
Educational Material Distribution
2013-14 2012-13 2011-12
Dairy 1,326 1,854 3,384
Equine 17,458 10,852 17,204
Poultry 25,428 37,566 33,509
Livestock 17,656 16,961 20,959
Field and Forage Crops 25,241 68,536 49,314
Horticulture 75,515 68,244 89,234
Renewable Natural Resources 53,359 83,744 88,724
Ag Entrepreneurship, Economic and
Community Development 13,734 43,378 52,984
Family and Consumer Science 21,467 31,254 25,873
Food Safety and Health 214,424 157,444 168,578
4-H Youth Development 88,314 83,953 60,727
Veterinary 0 0 0
Total 553,922 603,786 610,490
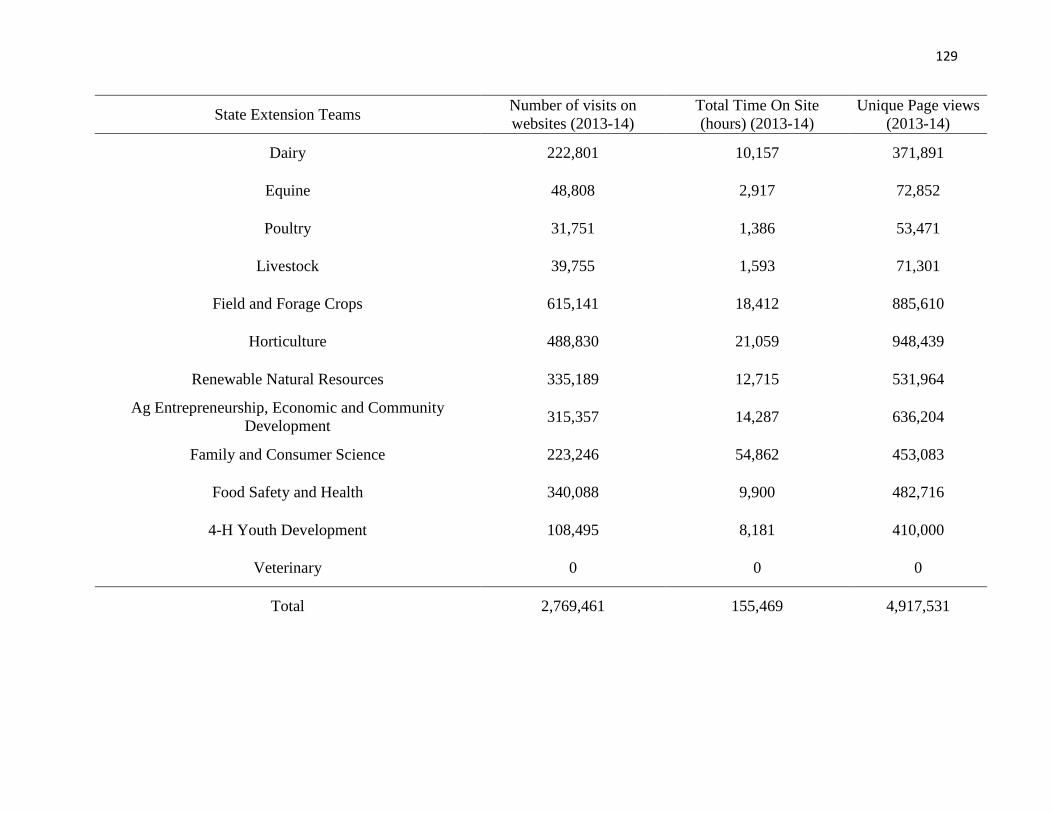
129
State Extension Teams Number of visits on
websites (2013-14)
Total Time On Site
(hours) (2013-14)
Unique Page views
(2013-14)
Dairy 222,801 10,157 371,891
Equine 48,808 2,917 72,852
Poultry 31,751 1,386 53,471
Livestock 39,755 1,593 71,301
Field and Forage Crops 615,141 18,412 885,610
Horticulture 488,830 21,059 948,439
Renewable Natural Resources 335,189 12,715 531,964
Ag Entrepreneurship, Economic and Community
Development 315,357 14,287 636,204
Family and Consumer Science 223,246 54,862 453,083
Food Safety and Health 340,088 9,900 482,716
4-H Youth Development 108,495 8,181 410,000
Veterinary 0 0 0
Total 2,769,461 155,469 4,917,531

130
Government Stakeholders:
Sr. No. Name of the Stakeholder
1 County Economic Development Departments
2 Regions or Groups of Municipalities
3 PA Department of Agriculture (PDA)
4 National Resource Conservation Service (NRCS)
5 PA Department of Environmental Protection (DEP)
6 PA Equine Council
7 PA State Conservation Commission
8 School Districts
9 USDA-NIFA
10 Centre for Disease Control (CDC)
11 Pennsylvania Office of Child Development and Early Learning
12 Health Care Providers
13 Center for Medicare and Medicaid Services
14 PA Department of Health
15 PA and County area Agencies on Aging
16 Township Offices
17 Extension Board Members
18 Parks and Recreation Centers
19 USDA: Agriculture Research Service (ARS)
20 USDA-FDA
21 PSU-PDA Animal Care
22 PA Department of Education (PDE)
23 Office of Ethics and Compliance
24 County Commissioners
25 Office of Juvenile and Delinquency Protection (OJJDP)
26 Local County Conservation Districts
27 PA Department of Environmental Resources
28 Legislators
29 Municipal and County Elected Officials**
30 Municipal Commissions
31 Department of Conservation and Natural Resources Staff
32 PA Bureau of Forestry
33 PA Game Commission
Note. ** Most Central Stakeholder