diversity and evolutionary origins of fungi associated with seeds
TRANSCRIPT

m y c o l o g i c a l r e s e a r c h x x x ( 2 0 0 9 ) 1 – 1 8
ARTICLE IN PRESS
journa l homepage : www.e l sev i er . com/ loca te /mycres
Diversity and evolutionary origins of fungi associatedwith seeds of a neotropical pioneer tree: a case studyfor analysing fungal environmental samples
Jana M. U’RENa, James W. DALLINGb, Rachel E. GALLERYb,2, David R. MADDISONc,E. Christine DAVISd,1, Cara M. GIBSONc, A. Elizabeth ARNOLDa,*aDivision of Plant Pathology and Microbiology, Department of Plant Sciences, 303 Forbes Building,
University of Arizona, Tucson, AZ 85721 USAbDepartment of Plant Biology, University of Illinois Urbana-Champaign, Urbana, IL 61801 USAcDepartment of Entomology, University of Arizona, Tucson, AZ 85721 USAdDepartment of Biology, Duke University, Durham, NC 27708 USA
a r t i c l e i n f o
Article history:
Received 28 March 2008
Received in revised form
27 October 2008
Accepted 13 November 2008
Corresponding Editor: John Dighton
Keywords:
Alignment
Ancestral state reconstruction
Ascomycota
Barro Colorado Island
Endophytes
Phylogeny
* Corresponding author. Tel.: þ520 621 721E-mail address: [email protected]
1 Current address: Department of Biology2 Current address: Department of Zoology
0953-7562/$ – see front matter ª 2008 The Bdoi:10.1016/j.mycres.2008.11.015
Please cite this article in press as: Jana Mtropical pioneer tree: a case study for aj.mycres.2008.11.015
a b s t r a c t
Fungi associated with seeds of tropical trees pervasively affect seed survival and germination,
and thus are an important, but understudied, component of forest ecology. Here, we examine
the diversity and evolutionary origins of fungi isolated from seeds of an important pioneer tree
(Cecropia insignis, Cecropiaceae) followingburial insoil for fivemonths ina tropical moist forest in
Panama. Our approach,which reliedonmolecularsequence databecausemost isolatesdid not
sporulate in culture, provides an opportunity to evaluateseveral methods currentlyused to an-
alyse environmental samples of fungi. First, intra- and interspecific divergence were estimated
for the nu-rITS and 5.8S gene for four genera of Ascomycota that are commonly recovered from
seeds. Using these values we estimated species boundaries for 527 isolates, showing that seed-
associated fungi are highly diverse, horizontally transmitted, and genotypically congruent
with some foliar endophytes from the same site. We then examined methods for inferring
the taxonomic placement and phylogenetic relationships of these fungi, evaluating the effects
of manual versus automated alignment, model selection, and inference methods, as well as the
quality of BLAST-based identification using GenBank. We found that common methods such
as neighbor-joining and Bayesian inference differ in their sensitivity to alignment methods;
analyses of particular fungal genera differ in their sensitivity to alignments; and numerous
and sometimes intricate disparities exist between BLAST-based versus phylogeny-based iden-
tification methods. Lastly, we used our most robust methods to infer phylogenetic relation-
ships of seed-associated fungi in four focal genera, and reconstructed ancestral states to
generate preliminary hypotheses regarding the evolutionary origins of this guild. Our results
illustrate the dynamic evolutionary relationships among endophytic fungi, pathogens, and
seed-associated fungi, and the apparent evolutionary distinctiveness of saprotrophs. Our
study also elucidates the diversity, taxonomy, and ecology of an important group of plant-as-
sociated fungi and highlights some of the advantages and challenges inherent in the use of ITS
data for environmental sampling of fungi.
ª 2008 The British Mycological Society. Published by Elsevier Ltd. All rights reserved.
2.
and Health Sciences, Meredith College, Raleigh, NC 27607 USA.
, University of Oxford, Oxford OX1 3PS UK.ritish Mycological Society. Published by Elsevier Ltd. All rights reserved.
U’Ren et al., Diversity and evolutionary origins of fungi associated with seeds of a neo-nalysing fungal environmental samples, Mycological Research (2009), doi:10.1016/

2 J. M. U’Ren et al.
ARTICLE IN PRESS
Introduction
taxonomic units (OTU) for estimating diversity and other eco-Fungi and oomycetous pathogens are the major cause of
seed mortality in soil for a variety of tropical pioneer trees,
which depend on recruitment from seed banks to colonize
gaps and other disturbances in intact forests (Hall & Swaine
1980; Alvarez-Buylla & Martınez-Ramos 1990; Dalling et al.
1997, 1998; Murray & Garcia 2002; O’Hanlon-Manners &
Kotanen 2004; Gallery et al. 2007a, 2007b). Yet some fungi
recovered from seeds are consistently associated with
higher-than-average germination success, suggesting a posi-
tive role in seed survival or the process of germination itself
(Gallery et al. 2007a). In the soil of lowland forests in Panama
and Costa Rica, >80 % of intact seeds of the neotropical
pioneer tree Cecropia (Cecropiaceae) are infected by cultivable
Ascomycota (Gallery et al. 2007a, 2007b). These fungi are dis-
tributed heterogeneously and appear to be host-generalists
with regard to infecting various pioneer species (Kluger
et al. 2008), but they have differential effects on the species
they infect (Gallery et al. 2007a, 2007b). The scale of diversity
of seed-associated fungi, their transmission patterns, and
their evolutionary relationships with other fungal guilds
are unclear.
The aim of this study was to examine the diversity, taxo-
nomic composition, and evolutionary origins of fungi associ-
ated with seeds of a representative neotropical pioneer tree.
Our approach was based on isolating fungi from surface-ster-
ilized seeds of Cecropia insignis following incubation of seeds
for five months in the forest soil at Barro Colorado Island, Pan-
ama. Because fungi recovered in culture almost never sporu-
lated, we sequenced the fast-evolving nu-rITS and the
intervening 5.8S gene for all isolates, and used standard ap-
proaches for evaluating the identity, diversity, and evolution-
ary relationships of these fungi (e.g. BLAST searches to assign
putative identity, designation of operational taxonomic units
based on sequence similarity measures, and phylogenetic in-
ference). However, like many researchers examining un-
known fungi, we found that current methods have
limitations that, to our knowledge, have not been addressed
empirically in the literature.
To address our biological questions carefully, we used our
dataset of 527 seed-associated fungi and their molecular se-
quence data to examine a series of methodological questions
in the study of fungal environmental samples. We focused on
ITS data, which often are informative at the species level for
fungi, and have been proposed as the locus of choice for ‘bar-
coding’ environmental fungal samples (see http://www.all-
fungi.com/its-barcode.php). ITS data are appealing for
environmental sampling of fungi because of the ease with
which they can be amplified and their prevalence in large pub-
lic databases (e.g. Lutzoni et al. 2004). However, these data are
notoriously difficult to align across diverse taxa, precluding
robust phylogenetic species concepts for diverse samples or
distinctive fungi with few known close relatives (e.g. Vanden-
koornhuyse et al. 2002; Schadt et al. 2003; Arnold et al. 2007).
Despite this difficulty, many studies use ITS data in three pri-
mary ways.
First, some use percent similarity measures to delimit ITS
genotype groups, and then use those groups as operational
Please cite this article in press as: Jana M U’Ren et al., Diversity antropical pioneer tree: a case study for analysing fungal enviroj.mycres.2008.11.015
logical parameters (e.g. Arnold & Lutzoni 2007). OTU are
a proximate, but limited, solution for categorizing environ-
mental samples, such as clones or mycelia sterilia, in the ab-
sence of reliable phylogenetic species concepts (e.g. O’Brien
et al. 2005; Arnold & Lutzoni 2007; Hoffman & Arnold 2008).
In most studies, authors do not justify their use of a given de-
gree of sequence divergence for estimating species bound-
aries and instead rely upon an established level of ITS
similarity (e.g. 95 %) (but see Arnold et al. 2007). A superior ap-
proach is the use of robust, multi-locus, phylogenetic species
concepts (sensu Taylor et al. 2000), but this is largely untenable
in environmental studies, which typically consist of single-lo-
cus datasets, geographically restricted sampling, and a single-
guild focus (e.g. seed-associated fungi, which may include
only a few members of a given fungal lineage, and may ex-
clude closely related species or strains with different ecologi-
cal modes). Because the utility of ITS for species-level
diagnoses varies among clades (Seifert et al. 2007), empirical
solutions, such as lineage-specific estimation of percent se-
quence divergence within and among species, are needed
for rapidly estimating the number of distinctive biological
units. To our knowledge no study has compared current soft-
ware applications for assigning genotype groups, such as
DOTUR (Schloss & Handelsman 2005) and Sequencher (as
used by Arnold et al. 2007), prompting our empirical assess-
ments of these tools.
Second, many studies estimate, with variable precision
and accuracy, the taxonomic placement of unknown fungi us-
ing rapid distance-based and non-phylogenetic algorithms
(Davis et al. 2003; Hogberg & Land 2004; Arenz et al. 2006). For
example, taxonomic identification of sterile and/or uncultiva-
ble fungi from the environment often relies on BLAST
searches of the NCBI GenBank database (Altschul et al. 1990)
and/or comparisons with other databases [e.g. the Assembling
the Fungal Tree of Life (AFToL) database: http://aftol.org] using
BLAST or FASTA (Pearson 1998, 2000; Geml et al. 2005: http://
www.borealfungi.uaf.edu). Although limitations of BLAST-
based identification are widely acknowledged, most published
accounts focus on the problems posed by the undersampling
of fungal diversity and the prevalence of unidentified and mis-
identified sequences in public databases (e.g. Bridge et al. 2003;
Harris 2003; Vilgalys 2003; Nilsson et al. 2005; but see Arnold
et al. 2007), rather than on the quality of identification should
all sequences in the database be reliably identified and repre-
sentative of the diversity in a group. Complete representation
of fungi in public databases remains a distant and perhaps un-
realistic goal, but databases populated by reliably identified
fungi, although geographically, ecologically, or taxonomically
limited, are becoming a reality (e.g. the AFToL and UNITE da-
tabases; Koljalg et al. 2005). An important step forward in envi-
ronmental studies of fungi is to understand the quality of
BLAST-based identification when matches are made to named
taxa, leading us to explicitly address this issue in a phyloge-
netic framework.
Third, a growing number of studies use ITS data to infer the
phylogenetic relationships of unknown fungi within particu-
lar genera, often noting the superiority of phylogenetic analy-
ses over non-phylogenetic matching algorithms (Henry et al.
d evolutionary origins of fungi associated with seeds of a neo-nmental samples, Mycological Research (2009), doi:10.1016/

Diversity and evolutionary origins of seed-associated fungi 3
ARTICLE IN PRESS
2000; Davis et al. 2003; Denman et al. 2003; Promputtha et al.
2007). However, these studies differ markedly in the methods
used to align sequence data and the inference methods used
to reconstruct phylogenetic relationships. Even when only
closely related fungi are considered in ITS-based environmen-
tal samples, automated multiple-sequence alignments are of-
ten unsatisfactory, leading to variation among researchers in
manual editing of alignments and the exclusion of ambiguous
regions (Morrison & Ellis 1997; Landan & Graur 2007). Different
alignments can produce different tree topologies, but the sen-
sitivity of different inference methods to particular alignment
characteristics is not clear (see Morrison & Ellis 1997; Lambert
et al. 2003). In particular, it would be helpful to examine the ef-
fects of manual editing, the exclusion of ambiguous regions,
model selection, and inference approaches on the resulting
phylogenetic trees for environmental sampling data, and per-
haps most importantly, to understand the sensitivity of par-
ticular fungal genera to particular alignment and inference
methods.
To our knowledge, no study has critically evaluated this
suite of methods – from empirical estimation of taxonomic
boundaries using ITS data to the impact of different phyloge-
netic inference approaches – for a focal group of fungi. Here,
we use a large data set of ITS sequences from cultivable fungi
associated with seeds of Cecropia insignis to address the diver-
sity, taxonomic composition, and evolutionary origins of
fungi associated with this important neotropical pioneer
tree. We first estimate percent ITS sequence divergence for
conspecifics, sister taxa, and non-sister taxa in four represen-
tative genera of Ascomycota that are common among seed-
associated fungi and for which published phylogenies exist
(Botryosphaeria, Colletotrichum, Mycosphaerella, and Xylaria).
We then apply these sequence divergence values to estimate
species boundaries for seed-associated fungi representing
the same classes of Pezizomycotina (Dothideomycetes and
Sordariomycetes), which together represent >90% of cultiva-
ble seed-associated fungi at our study site (Gallery et al.
2007a). We use our results to estimate richness, diversity,
transmission patterns, and congruence with another well-
sampled guild at the same site – fungal endophytes from
foliage, which previous studies have suggested are similar
to seed-associated fungi (Gallery et al. 2007a). We evaluate
methods for inferring the phylogenetic relationships of these
unknown fungi and exemplar taxa from GenBank, examining
the importance of manual vs. automated alignment methods,
model selection, and inference methods. We then use our
most robust methods to examine the quality of BLAST-based
identification, considering the taxonomic information pro-
vided by NCBI’s module for inferring fast minimum evolution
trees and our own Bayesian analyses. Finally, we use ances-
tral state reconstructions to generate preliminary hypotheses
regarding the evolutionary origins of seed-associated fungi in
three focal genera (Botryosphaeria, Mycosphaerella, and
Xylaria), considering relationships of seed-associated, endo-
phytic, pathogenic, and saprotrophic fungi. Together, our
analyses not only shed light on a distinctive, understudied,
and ecologically important group of tropical plant-associated
fungi, but also demonstrate several advantages and potential
pitfalls inherent in the use of ITS data in the study of
unknown fungi.
Please cite this article in press as: Jana M U’Ren et al., Diversity antropical pioneer tree: a case study for analysing fungal enviroj.mycres.2008.11.015
Methods
Mature infructescences of five Cecropia insignis individuals/site
were collected from an array of 2 m2 mesh seed traps 1 m
above the forest floor (mesh size¼ 1 mm) and directly from
tree canopies in lowland tropical forest at La Selva, Costa
Rica (10�260 N, 84�000 W; 37–150 m above sea level) and Barro
Colorado Island, Panama (BCI; 9�90 N, 79�510 W; 120–160 m
above sea level) during the fruiting season in 2005. Immedi-
ately after collection, seeds were removed from infructescen-
ces, rinsed in 0.5 % sodium hypochlorite for 2 min, and
surface-dried under sterile conditions in a darkroom. Seeds
were sorted by maternal source into lots of 30, mixed with
10 g of autoclave-sterilized forest soil (115 �C for 2 h), and
enclosed in nylon mesh bags (mesh size¼ 0.5 mm) that effec-
tively exclude most arthropods while allowing seeds to be ex-
posed to viruses, bacteria, fungi, and nematodes (Gallery et al.
2007a). Bags were buried 3 cm beneath the soil surface in
5� 5 m plots below the crowns of four mature female C. insig-
nis individuals at BCI (>50 m apart) and recovered after five
months (December 2005).
At harvest, bags recovered beneath three crowns were
emptied onto sterile filter paper in Petri dishes, moistened
as needed, and allowed to germinate for two months
following the methods of Gallery et al. (2007a). From each
bag, four seeds that did not germinate were selected hap-
hazardly, surface-sterilized by sequential immersion in
95 % ethanol (10 s), 0.5 % sodium hypochlorite (2 min), and
70 % ethanol (2 min) (Gallery et al. 2007a, 2007b), allowed
to surface-dry under sterile conditions, and plated on 2 %
malt extract agar (MEA) slants. Slants were incubated for
six months. Cultivable filamentous fungi were observed in
81 % of seeds. Living vouchers were deposited in the Robert
L. Gilbertson Mycological Herbarium at the University of
Arizona (ARIZ).
Total genomic DNA was extracted from all isolates follow-
ing the methods of Arnold & Lutzoni (2007), and the ITS region
was amplified and sequenced following the methods of Gal-
lery et al. (2007a). Bidirectional sequences were assembled au-
tomatically and quality scores assigned using phred and phrap
(Ewing & Green 1998; Ewing et al. 1998; Gordon et al. 1998) with
automation provided by the ChromaSeq package imple-
mented in Mesquite version 1.91 (Maddison & Maddison:
http://mesquiteproject.org). All assembled sequences were
submitted to GenBank under accession numbers FJ612603–
FJ613109.
Taxonomic placement for each fungus was estimated at
the subphylum and class levels by BLAST searches in GenBank
and by comparison against a phylogenetically referenced da-
tabase of over 6 K ITS sequences for plant-symbiotic fungi
(Arnold unpubl. data). The majority of seed-associated fungi
were identified as Pezizomycotina, with a particular concentra-
tion in the Sordariomycetes (438 isolates), and Dothideomycetes
(89 isolates), both of which are rich in saprotrophs, pathogens,
and endophytes (e.g. James et al. 2006; Arnold et al. 2007;
Arnold & Lutzoni 2007). Our sample included 507 isolates re-
covered in the current study, and 20 additional seed-associ-
ated fungi obtained in similar studies at BCI (Gallery et al.
2007a; Kluger et al. 2008).
d evolutionary origins of fungi associated with seeds of a neo-nmental samples, Mycological Research (2009), doi:10.1016/
4 J. M. U’Ren et al.
ARTICLE IN PRESS
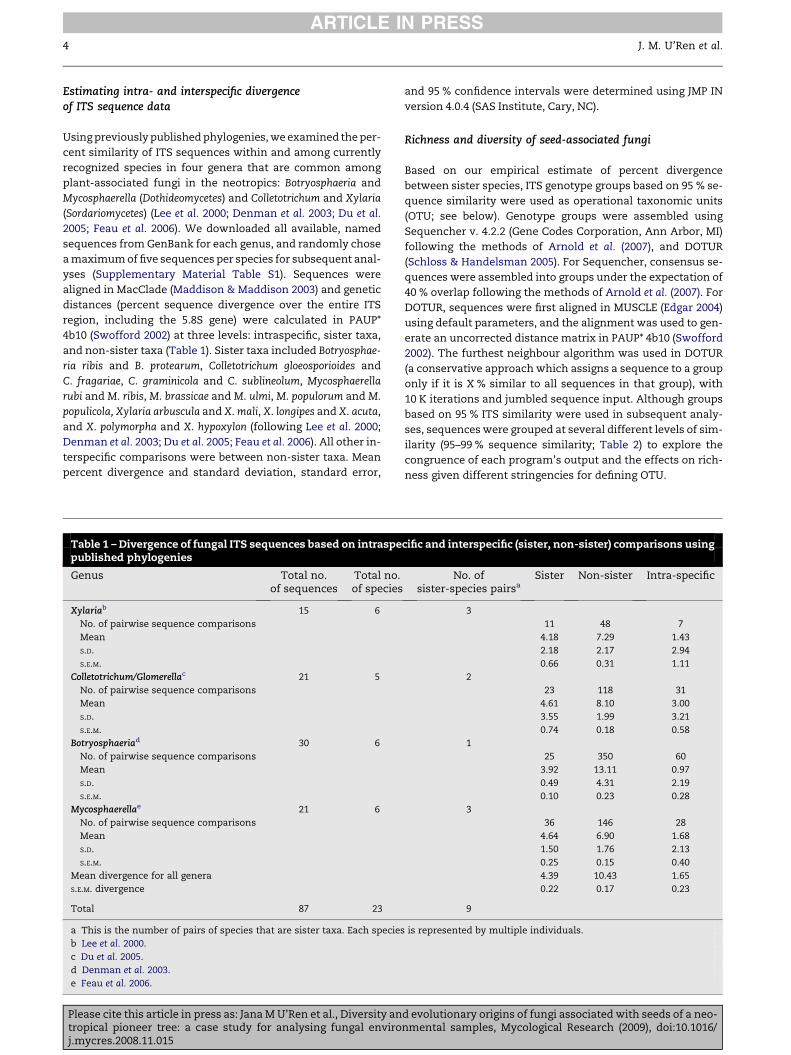
Estimating intra- and interspecific divergenceof ITS sequence data
Using previously published phylogenies, we examined the per-
cent similarity of ITS sequences within and among currently
recognized species in four genera that are common among
plant-associated fungi in the neotropics: Botryosphaeria and
Mycosphaerella (Dothideomycetes) and Colletotrichum and Xylaria
(Sordariomycetes) (Lee et al. 2000; Denman et al. 2003; Du et al.
2005; Feau et al. 2006). We downloaded all available, named
sequences from GenBank for each genus, and randomly chose
a maximum of five sequences per species for subsequent anal-
yses (Supplementary Material Table S1). Sequences were
aligned in MacClade (Maddison & Maddison 2003) and genetic
distances (percent sequence divergence over the entire ITS
region, including the 5.8S gene) were calculated in PAUP*
4b10 (Swofford 2002) at three levels: intraspecific, sister taxa,
and non-sister taxa (Table 1). Sister taxa included Botryosphae-
ria ribis and B. protearum, Colletotrichum gloeosporioides and
C. fragariae, C. graminicola and C. sublineolum, Mycosphaerella
rubi and M. ribis, M. brassicae and M. ulmi, M. populorum and M.
populicola, Xylaria arbuscula and X. mali, X. longipes and X. acuta,
and X. polymorpha and X. hypoxylon (following Lee et al. 2000;
Denman et al. 2003; Du et al. 2005; Feau et al. 2006). All other in-
terspecific comparisons were between non-sister taxa. Mean
percent divergence and standard deviation, standard error,
Table 1 – Divergence of fungal ITS sequences based on intraspepublished phylogenies
Genus Total no.of sequences
Total no.of species
Xylariab 15 6
No. of pairwise sequence comparisons
Mean
S.D.
S.E.M.
Colletotrichum/Glomerellac 21 5
No. of pairwise sequence comparisons
Mean
S.D.
S.E.M.
Botryosphaeriad 30 6
No. of pairwise sequence comparisons
Mean
S.D.
S.E.M.
Mycosphaerellae 21 6
No. of pairwise sequence comparisons
Mean
S.D.
S.E.M.
Mean divergence for all genera
S.E.M. divergence
Total 87 23
a This is the number of pairs of species that are sister taxa. Each species
b Lee et al. 2000.
c Du et al. 2005.
d Denman et al. 2003.
e Feau et al. 2006.
Please cite this article in press as: Jana M U’Ren et al., Diversity antropical pioneer tree: a case study for analysing fungal enviroj.mycres.2008.11.015
and 95 % confidence intervals were determined using JMP IN
version 4.0.4 (SAS Institute, Cary, NC).
Richness and diversity of seed-associated fungi
Based on our empirical estimate of percent divergence
between sister species, ITS genotype groups based on 95 % se-
quence similarity were used as operational taxonomic units
(OTU; see below). Genotype groups were assembled using
Sequencher v. 4.2.2 (Gene Codes Corporation, Ann Arbor, MI)
following the methods of Arnold et al. (2007), and DOTUR
(Schloss & Handelsman 2005). For Sequencher, consensus se-
quences were assembled into groups under the expectation of
40 % overlap following the methods of Arnold et al. (2007). For
DOTUR, sequences were first aligned in MUSCLE (Edgar 2004)
using default parameters, and the alignment was used to gen-
erate an uncorrected distance matrix in PAUP* 4b10 (Swofford
2002). The furthest neighbour algorithm was used in DOTUR
(a conservative approach which assigns a sequence to a group
only if it is X % similar to all sequences in that group), with
10 K iterations and jumbled sequence input. Although groups
based on 95 % ITS similarity were used in subsequent analy-
ses, sequences were grouped at several different levels of sim-
ilarity (95–99 % sequence similarity; Table 2) to explore the
congruence of each program’s output and the effects on rich-
ness given different stringencies for defining OTU.
cific and interspecific (sister, non-sister) comparisons using
No. ofsister-species pairsa
Sister Non-sister Intra-specific
3
11 48 7
4.18 7.29 1.43
2.18 2.17 2.94
0.66 0.31 1.11
2
23 118 31
4.61 8.10 3.00
3.55 1.99 3.21
0.74 0.18 0.58
1
25 350 60
3.92 13.11 0.97
0.49 4.31 2.19
0.10 0.23 0.28
3
36 146 28
4.64 6.90 1.68
1.50 1.76 2.13
0.25 0.15 0.40
4.39 10.43 1.65
0.22 0.17 0.23
9
is represented by multiple individuals.
d evolutionary origins of fungi associated with seeds of a neo-nmental samples, Mycological Research (2009), doi:10.1016/

Table 2 – Comparison of the number of operational taxonomic units generated for 527 seed-associated fungi
Sequence divergence(% similarity)
DOTURa (all sequences) DOTURa (SþD)b Sequencher (all sequences) Sequencher (SþD)b
1 (99 %) 272 278 202 158
2 (98 %) 250 253 177 138
3 (97 %) 235 235 170 126
4 (96 %) 221 226 162 117
5 (95 %) 207 212 155 108
The same datasets yielded markedly different estimates of genotypic richness at all levels of comparison, and differed in estimates of richness
depending on the input of a single master file of all sequences, or independent analysis of sequences in each of two classes.
a DOTUR’s furthest-neighbour algorithm was used.
b The result of 438 sordariomycete (S) and 89 dothideomycete (D) sequences analysed separately.
Diversity and evolutionary origins of seed-associated fungi 5
ARTICLE IN PRESS
Species-accumulation curves and bootstrap (BS) estimates
of total richness were inferred using 50 randomizations of
sample order in EstimateS version 7.5 using both DOTUR
and Sequencher OTU groups (Colwell 2005: http://viceroy.
eeb.uconn.edu/EstimateS) (Fig 1). Diversity was calculated as
Fisher’s alpha, Shannon index, and Simpson’s index to maxi-
mize comparability with other studies. To examine the simi-
larity of fungi associated with seeds from different origins
(La Selva and BCI), similarity indices based on presence/ab-
sence data (Jaccard’s index) and isolation frequency (Mori-
sita–Horn index) for each non-singleton genotype were
calculated in EstimateS (Colwell 2005).
To examine congruence of seed-associated fungi with
known foliar endophytes at the levels of genotype (99 % ITS
similarity) and putative species (95 % ITS similarity; see be-
low), seed-associated fungi were compared against a database
of 6 K ITS sequences of foliar endophytes (Arnold unpubl.
data) using Sequencher 4.2.2. That database includes repre-
sentative endophytes from asymptomatic foliage of 32 host
species in arctic, boreal, temperate, and tropical plant com-
munities (Arnold unpubl. data; Arnold et al. 2007; Arnold &
Lutzoni 2007), including 1150 sequences of endophytic fungi
from BCI.
Examining BLAST-based identification methods
We assessed the quality of the BLAST-based taxonomic as-
signment of 41 isolates representing two focal genera (Xylaria
and Mycosphaerella) using two phylogenetic approaches. First,
GenBank was queried using the BLASTn algorithm for each
sequence, and the top hits recorded. From the same search
output, a fast minimum evolution tree then was generated
automatically using NCBI’s automated pairwise alignment,
the Jukes–Cantor distance measure, and NCBI’s online ‘view
tree’ option (see http://www.ncbi.nlm.nih.gov/CBBResearch/
Desper/FastME.html for details). For each resulting tree, we
examined the placement of our query sequence relative to
its top BLAST match.
Second, an alignment was generated for each genus using
our query sequences; selected top BLASTn hits; the sequence
of the first taxonomically named BLASTn hit, if the top hits
were unidentified; and a selection of named species (see
below). These alignments were assembled automatically in
MUSCLE with manual editing (corresponding to category 2;
see below). Model selection and Bayesian phylogenetic
Please cite this article in press as: Jana M U’Ren et al., Diversity antropical pioneer tree: a case study for analysing fungal enviroj.mycres.2008.11.015
analyses were conducted as described below (i.e. GTRþ IþG
for 5 M generations). The data matrix for Xylaria contained
25 query sequences and 19 of their BLASTn hits, as well as
12 additional sequences representing the diversity of Xylaria
in GenBank (Supplementary Material Table S1), for a total
of 56 sequences. The Mycosphaerella matrix contained 51
sequences, 16 of which were unknown and 35 of which were
NCBI sequences (14 top BLASTn hits and 21 additional
sequences representing the diversity of Mycosphaerella in
GenBank) (Supplementary Material Table S1). Redundant
BLASTn hits from NCBI were removed prior to each analysis.
For each minimum evolution and Bayesian analysis, we
asked three questions: (1) how frequently was a query
sequence reconstructed as sister to its top BLASTn hit; (2) of
the query sequences that were sister to their top BLASTn hit,
how frequently could they be identified to the genus or species
level (i.e. how frequently were they sister to a named taxon);
(3) what proportion of sequences failed to be placed with con-
fidence (i.e. were placed in polytomies, were basal to clades
containing multiple named taxa, or were sister to unidentified
fungi, either from this study or from GenBank; Table 3).
Alignment, model selection, and phylogenetic analyses
Seed-associated and foliar endophytic Botryosphaeria, Colleto-
trichum, Mycosphaerella, and Xylaria were selected for phyloge-
netic analyses from the isolates recovered in this study and
from a living library of 12 145 vouchers maintained at ARIZ
(Arnold & Lutzoni 2007; Gallery et al. 2007a; Kluger et al.
2008). For seed-associated fungi in the same genotype group
(based on 95 % sequence similarity), a single representative
sequence was chosen for phylogenetic analyses. In sum,
sequences from 38 seed-associated fungi (representing 116
isolates) and 80 foliar endophytes were included in our align-
ments: 15 seed-associated isolates and 21 endophytic isolates
of Botryosphaeria; two and 39, respectively, of Colletotrichum;
four and 12 Mycosphaerella; 17 and eight Xylaria. These seed-
associated and endophyte sequences were aligned with
named sequences of each genus (Botryosphaeria, 30 named se-
quences; Colletotrichum, 17; Mycosphaerella, 21; Xylaria, 12)
obtained from GenBank (Supplementary Material Table S1).
We first assessed the effects of three different alignment
methods on resulting phylogenetic trees. For each genus, we
generated (1) an automatic, unedited alignment using MUS-
CLE (Edgar 2004) with default parameters (category 1); (2)
d evolutionary origins of fungi associated with seeds of a neo-nmental samples, Mycological Research (2009), doi:10.1016/

Fig 1 – Species accumulation curve of 155 ITS genotype
groups for 527 seed-associated fungal isolates, 95 % confi-
dence interval, and bootstrap estimate of total species
richness. ITS genotype groups were delineated by sequence
comparisons in Sequencher and DOTUR and reflect 95 %
sequence similarity based on empirical estimates of se-
quence divergence in focal genera.
6 J. M. U’Ren et al.
ARTICLE IN PRESS
a default MUSCLE alignment edited manually in MacClade
(Maddison & Maddison 2003) (category 2); and (3) a fully man-
ual alignment generated in MacClade with ambiguous regions
excluded (category 3). For category 3 alignments, 27 of 548
characters were excluded from the Botryosphaeria alignment
(101–111, 401–406, 425, and 514–525), 89 of 514 from the Colleto-
trichum alignment (38–113 and 394–398), 75 of 518 from the
Mycosphaerella alignment (16–40, 125–128, 142–145, 374–385
442–445, 456–459, 463–479, and 504–516), and 210 of 694 from
the Xylaria alignment (20–29, 76–214, 246–265, 497–519, 565–
572, 588–589, and 631–644). All alignments have been submit-
ted to TreeBASE and can be downloaded from the website of
the corresponding author (www.endophytes.org/alignments).
Topologies and support values resulting from Bayesian analy-
ses of each alignment under the same model of evolution (see
below) were then compared within each genus.
Table 3 – Phylogenetic analysis of BLASTn identification of unkBayesian analyses and minimum evolution analyses (implem
No. of sequences Mycosphaerella
Bayesian Min. e
Sister to top BLASTn hit 3
Identified to species 1
Identified to genus 2
Unidentified 0
Sister to other sequence 4
In polytomy 9
Total 16
Please cite this article in press as: Jana M U’Ren et al., Diversity antropical pioneer tree: a case study for analysing fungal enviroj.mycres.2008.11.015
The appropriate model of evolution was determined for
each alignment using the Akaike Information Criterion (AIC)
in ModelTest (Posada & Crandall 1998) (Supplementary Mate-
rial Table S2). All alignments for Botryosphaeria, Colletotrichum,
Mycosphaerella, and Xylaria were fitted to the GTRþ IþG
model. However, Mycosphaerella and Xylaria category 1 (MUS-
CLE, default) and category 2 (MUSCLE, manually adjusted)
alignments also were fitted to SYMþ IþG. The Xylaria category
3 (fully manual) alignment was fitted to GTRþ IþG,
SYMþ IþG and HKYþ IþG.
Phylogenetic estimations were conducted for each align-
ment and each selected model of evolution using MrBayes
3.1.1 (Huelsenbeck & Ronquist 2001) for 5 M generations
each, using two independent runs (each with four chains)
and sampling every 100th generation. To determine the
burn-in for each analysis, the average S.D. of the split fre-
quencies was evaluated, as well as plots of –lnL values. In
general, the average S.D. of the split frequencies was <0.01
after a maximum of 3.69 M generations for all analyses.
The convergence statistic for Colletotrichum category 1 and
2 alignments (0.0145 and 0.0264), the Mycosphaerella category
1 alignment using both GTRþ IþG and SYMþ IþG (0.0153
and 0.0102), and the Xylaria category 2 alignment using
SYMþ IþG (0.0158) never dropped below 0.01, but plots of
–lnL and other parameters demonstrated a stable plateau af-
ter 4 M generations. Therefore, a burn-in of 4 M generations
was discarded from each run and the majority rule consen-
sus tree and posterior probabilities (PP) were computed us-
ing the remaining 20,002 trees in PAUP* version 4b10
(Swofford 2002).
Because topologies inferred using Bayesian methods were
largely consistent both among alignments and with regard
to different models of evolution, a representative alignment
(category 2: MUSCLE, with manual adjustment) and a single
model (GTRþ IþG) was selected for subsequent phylogenetic
estimations (Figs 2–5).
Neighbor-joining (NJ) analyses also were conducted for
each alignment (categories 1, 2, 3) and each focal genus
(Botryosphaeria, Colletotrichum, Mycosphaerella, and Xylaria) to
assess the sensitivity of NJ to different alignments, and to
compare topologies with Bayesian results (category 2 only)
(Supplementary Figs S1–S4). NJ analyses were conducted us-
ing the default settings in PAUP* version 4b10 [uncorrected
distance measure (p), equal rates, no invariant sites] (Swofford
nown fungi affiliated with Mycosphaerella and Xylaria usingented in GenBank)
Xylaria
volution Bayesian Min. evolution
5 10 19
1 1 1
4 5 14
0 4 4
2 7 3
9 8 3
16 25 25
d evolutionary origins of fungi associated with seeds of a neo-nmental samples, Mycological Research (2009), doi:10.1016/

Endo-6755-Gustavia
Seed-187X-Cecropia
Seed-187Y-Cecropia
Seed-2126-Cecropia
Seed-231AM-Cecropia
Seed-261AC-Cecropia
Seed-CC222d-Cecropia
Seed-R194-Cecropia
Endo-6718-Gustavia
Seed-B357-Cecropia (n=24)Seed-L458-Cecropia
Seed-298AF-Cecropia
Seed-144C3-Ficus*Seed-8089-Cecropia
B. obtusa-AY662399B. obtusa-AY662395B. obtusa-AY662396B. obtusa-AF243408B. obtusa-AY236953Endo-TC06.5-Theobroma
B. ribis-DQ316074Seed-187L-Cecropia
B. ribis-AF243393B. ribis-AY744368B. ribis-AF027744B. ribis-AF452526B. protearum-AF452528B. protearum-AF452537B. protearum-AF452539B. protearum-AF452534B. protearum-AF452540B. dothidea-AF196296B. lutea-DQ316088B. lutea-AF452550B. lutea-AF452554B. lutea-AY259091B. lutea-DQ233604B. dothidea-AF452704Endo-6287-Magnolia
B.dothidea-DQ316084B.dothidea-AF241174B.dothidea-AF464947Seed-L464a-Cecropia
Seed-L464b-Cecropia
Endo-L437.4-Laetia
Endo-H5.3-Heisteria
Endo-m5u7-Ouratea
Endo-469-Laetia
Endo-216-Heisteria
Endo-6694-Trichilia
Endo-Li1.1-Peltigera
Endo-Li1.2-Peltigera
B. proteae-AF196302B. proteae-AF452557B. proteae-AF452563B. proteae-AF452559B. proteae-AF196301Endo-4537-Picea
Endo-4536-Picea
Endo-10786E-Hedera
Endo-m40z8-Ouratea
Endo-m10u5-Ouratea
Endo-6737-Swartzia
Endo-6734-Swartzia
Endo-6730-Swartzia
Endo-435B-Swartzia
99/96
96/95
97/97
100/100
73/70
92/96
100/100
95/97
100/100
100/100
99/100
92/96
100/100
52/52
100/100100/100
93/94
100/100
100/100
91/93
100/10053/56
100/100
100/100
100/100
100/100
100/100
100/100
100/100
100
-
-
100
-
100
99
100
-
100
-100
100100
-
-
100
-
-
100
-
51
-
-
96
100
-
100
98
Pathogen
Endophyte
Seed-Associated
Undetermined/Equivocal
Node Absent
Legend
Fig 2 – Majority rule consensus tree of 20,002 trees generated from alignment method 2 (MUSCLE, with manual adjustment)
of Botryosphaeria spp. using Bayesian analysis of ITS rDNA data, with reconstruction of ancestral states estimating the ori-
gins of fungal guilds. Taxon names of endophytes and seed-associated fungi indicate ecological role-numerical identifier-
host genus. The number of seed-associated isolates with identical genotypes at 95% similarity is indicated in parentheses.
Support values are PPs generated in MrBayes using model GTR + I + G for three different alignment methods: (1) MUSCLE
unedited (before slash; category 1 alignment) (2) MUSCLE with manual editing (after slash; category 2 alignment) and (3)
manual alignment in MacClade (below branch; category 3 alignment). A dash (-) indicates the node was not present in the
majority rule consensus for that alignment. Thickened lines represent neighbor-joining bootstrap support �70% generated
from the category 2 alignment. Pie charts indicate two methods for ancestral state reconstruction: (1) the proportion of trees
in which a given state was significantly more likely than alternative states, or in which a node was equivocal or absent (top);
and (2) among the trees in which a node was present, the average probability of any given state (bottom). The * indicates this
sequence was obtained from Ficus insipida instead of C. insignis.
Diversity and evolutionary origins of seed-associated fungi 7
ARTICLE IN PRESS
Please cite this article in press as: Jana M U’Ren et al., Diversity and evolutionary origins of fungi associated with seeds of a neo-tropical pioneer tree: a case study for analysing fungal environmental samples, Mycological Research (2009), doi:10.1016/j.mycres.2008.11.015
Endo-P101-Cecropia
C. fragariae-DQ868498Endo-P112B-Cecropia
C. fragariae-DQ868497
C. gloeosporioides-AJ749693C. gloeosporioides-AJ749682C. gloeosporioides-AJ749692Endo-P26-Cecropia
Endo-P136-Cecropia
Endo-P17B-Cecropia
Endo-P247A-Cecropia
Endo-P16-CecropiaC. gloeosporioides-AY753987Seed-L90-Cecropia (n=6)Endo-P516-Cecropia
Endo-P302B-Cecropia
Endo-P41-Cecropia
Endo-P43A-Cecropia
Endo-P123A-Cecropia
Endo-P27A-Cecropia
Endo-P1-Cecropia
Endo-P206-Cecropia
Endo-P115A-Cecropia
Endo-P28B-Cecropia
Endo-P164A-Cecropia
Endo-P164B-Cecropia
Endo-P247B-Cecropia
Endo-P515-Cecropia
Endo-P167-Cecropia
Endo-P24B-Cecropia
Endo-P21A-Cecropia
Endo-P21B-Cecropia
Endo-P24A-Cecropia
Endo-P33-Cecropia
Endo-P70-Cecropia
Endo-P11A-Cecropia
Endo-P28A-Cecropia
C. acutatum-AJ749679C. acutatum-AJ749681C. acutatum-AJ749673C. acutatum-AJ749688C. acutatum-AJ749689Endo-P39-Cecropia
Endo-P112A-Cecropia
Endo-299-Laetia
C. sublineolum-DQ003113C. sublineolum-DQ003115C. graminicola-DQ195708C. sublineolum-DQ195716C. graminicola-DQ126257C. graminicola-DQ126252Endo-6719-Gustavia
Endo-10783D-Cecropia
Endo-P250A-Cecropia
Endo-P250B-Cecropia
Endo-P44B-Cecropia
Endo-P43B-Cecropia
Seed-L590-Cecropia
-/52
-/95
66/65
92/95
68/70
59/54
80/86
72/69
100/100
91/90100/100
100/100
100/10099/99
100/100
99/55
100/100
100/100
-
-
-
75
72
-
-
-
--
-
99100
96
100
-
10072
-/54
-
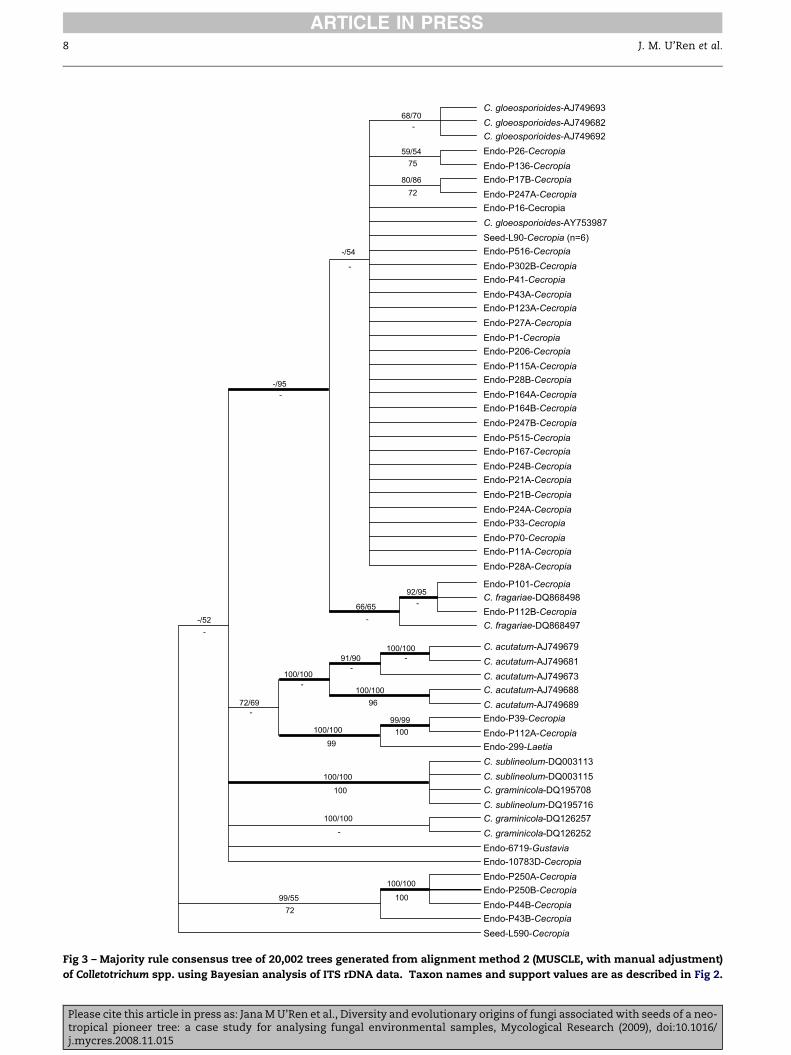
Fig 3 – Majority rule consensus tree of 20,002 trees generated from alignment method 2 (MUSCLE, with manual adjustment)
of Colletotrichum spp. using Bayesian analysis of ITS rDNA data. Taxon names and support values are as described in Fig 2.
ARTICLE IN PRESS
Please cite this article in press as: Jana M U’Ren et al., Diversity and evolutionary origins of fungi associated with seeds of a neo-tropical pioneer tree: a case study for analysing fungal environmental samples, Mycological Research (2009), doi:10.1016/j.mycres.2008.11.015
8 J. M. U’Ren et al.

M. brassicicola-AF362052
M. brassicicola-AF297227
M. brassicicola-AY152557
M. brassicicola-AY152556
M. brassicicola-DQ019330
M. ulmi-DQ019378
M. ulmi-DQ019377
M. populorum-AY752867
M. populorum-DQ029124
M. populorum-AY549465
M. populicola-AY549477
M.populicola-AY152585
M.populicola-AY549472
M. ribis-DQ019368
M. ribis-DQ019367
M. rubi-DQ019369
M. rubi-AY152578
M. rubi-AY152565
Endo-462-Laetia
M. ribis-AY152581
M. ulmi-AY152575
Seed-7830-Cecropia
Endo-4221-Dryas
M. rubi-AY152580
Endo-9295-Pinus
Endo-9329b-Pinus
Endo-9317B-Pinus
Endo-2832-Lycopodium
Endo-2712-Lycopodium
Endo-9669-Pinus
Seed-L651-Cecropia
Seed-L491cla-Cecropia (n=2)
Seed-L491clc-Cecropia
Endo-SHTT48-Trichilia
Endo-DC573-Pinus
Endo-DC513-Pinus
Endo-DC800-Pinus
100/100
83/87
91/93
100/100
80/74
99/99
82/83
100/100
100/100
87/89
72/63
-/55
-/52
-/60
-/61
94/96
73/72
100/100
100/100
100/100
87/89
100/100
100/100
100/100
100/100
100/100
100
-
-
100
100
-
89
99
-
85
-
-
-
- -
63
100
98
-
98
100
97
71
-
-
63
Pathogen
Endophyte
Seed-Associated
Equivocal/Unknown
Node Absent
Legend
Fig 4 – Majority rule consensus tree of 20,002 trees generated from alignment method 2 (MUSCLE, with manual adjustment)
of Mycosphaerella spp. using Bayesian analysis of ITS rDNA data, with reconstruction of ancestral states estimating the
origins of fungal guilds. Taxon names, support values and pie charts are as described in Fig 2.
Diversity and evolutionary origins of seed-associated fungi 9
ARTICLE IN PRESS
2002) with branch support determined through 1 K NJ BS rep-
licates. Although models of evolution can be implemented us-
ing NJ, we chose default settings to represent the method most
commonly found in the literature.
Differences between topologies, as a result of different
alignments or inference methods, were defined as the
sum of well-supported nodes present in the reference
tree, but missing in the comparison tree, divided by the to-
tal number of nodes in the reference tree (Table 4), with
Please cite this article in press as: Jana M U’Ren et al., Diversity antropical pioneer tree: a case study for analysing fungal enviroj.mycres.2008.11.015
well-supported nodes defined as those with �70 % NJ BS
or �95 % Bayesian PP values. Resulting proportions were av-
eraged by genus, inference method, or alignment category
and analysed using ANOVA (if normally distributed) or Wil-
coxon rank-sum tests (if distributions differed significantly
from normal, inferred using the Shapiro–Wilk W statistic
implemented in JMP IN). For convenience, we refer to these
proportions as ‘incongruency scores’. Higher incongruency
scores indicated that a large proportion of well-supported
d evolutionary origins of fungi associated with seeds of a neo-nmental samples, Mycological Research (2009), doi:10.1016/

Seed-B320-Cecropia (n=3)
Seed-L1039-Cecropia
Seed-L970-Cecropia
Endo-P178B-Cecropia
Endo-P187-Cecropia
Seed-L343-Cecropia
X. acuta-AF163026
X. acuta-DQ491493
X. longipes-AF163038
X. longipes-AF163039
Seed-L328-Cecropia
Seed-L1065B-Cecropia
Seed-B492-Cecropia (n=6)
Endo-P562-Cecropia
Seed-B309-Cecropia (n=14)
Endo-P222-Cecropia
Seed-L1008A-Cecropia
Seed-L525cla-Cecropia (n=2)
Endo-P211-Cecropia
X. polymorpha-AF163041
X. polymorpha-AF163042
X. hypoxylon-AF163037
Seed-L460cla-Cecropia (n=4)
Seed-L460clb-Cecropia (n=19)
Seed-L126-Cecropia
Endo-P503-Cecropia
Seed-B124-Cecropia (n=3)
Seed-B088-Cecropia
Seed-L525clc-Cecropia (n=9)
X. hypoxylon-DQ491487
X. arbuscula-AY183369
X. arbuscula-AF163029
X. arbuscula-AF163028
X. mali-AF163040
Endo-P32-Cecropia
Seed-B505-Cecropia
Endo-P394-Cecropia
68/71
-/64
100/100
72/70
61/59
69/69
76/85
100/100
84/86
99/99
80/81100/100
75/78
99/100
94/85
71/75
100/99
100/100
100/100
100/100
-
-
100
-
-
-
-
69
-
98
100
100
-
83
85-
100
98100
99
SaprotrophEndophyteSeed-AssociatedEquivocal/UnknownNode Absent
Legend
Fig 5 – Majority DNA rule consensus tree of 20,002 trees generated from alignment method 2 (MUSCLE, with manual
adjustment) of Xylaria spp. using Bayesian analysis of ITS rDNA data, with reconstruction of ancestral states estimating
the origins of fungal guilds. Taxon names, support values and pie charts are as described in Fig 2.
10 J. M. U’Ren et al.
ARTICLE IN PRESS
nodes present in a reference tree were absent from the
comparison tree (i.e. trees were highly incongruent with
one another). Lower scores indicated that a small propor-
tion of well-supported nodes in a reference tree were ab-
sent from the comparison tree (i.e. trees were relatively
congruent with one another; Table 3).
Evolutionary origins of seed-associated fungi
Using our most robust phylogenetic analyses, we reconstructed
ancestral states to formulate preliminary hypotheses regarding
the evolutionary origins of seed-associated fungi in
Please cite this article in press as: Jana M U’Ren et al., Diversity antropical pioneer tree: a case study for analysing fungal enviroj.mycres.2008.11.015
Botryosphaeria, Mycosphaerella, and Xylaria, which contained mul-
tiple representatives of each ecological guild in well-supported
clades. Terminal taxa from each genus were assigned a code for
ecological mode (pathogens, saprotrophs, endophytes, seed-
associated fungi, or missing data). Coding for Mycosphaerella
and Xylaria taxa obtained from GenBank (Supplementary
Material Table S1) was inferred from the known ecological
mode of each species (e.g. Xylaria arbuscula and X. polymorpha as
saprotrophs). In the case of Botryosphaeria, in which some patho-
genic species have life cycles with an endophytic or latent phase
(Smith et al. 1996; Swart et al. 2000; Denman et al. 2003), taxon
coding was based on the original publication in which each
d evolutionary origins of fungi associated with seeds of a neo-nmental samples, Mycological Research (2009), doi:10.1016/

Ta
ble
4–
Co
mp
ari
son
of
Ba
yesi
an
(MB
)a
nd
NJ
tree
top
olo
gie
s
Ty
pe
of
ali
gn
men
tB
ay
esia
nso
urc
etr
ee
NJ
sou
rce
tree
Pro
po
rtio
no
fcl
ad
es
mis
sin
g(m
issi
ng/t
ota
l)B
otry
o-sp
haer
iaM
yco-
sph
aer
ella
Col
leto
-tr
ich
um
Xyl
ari
aA
vera
gefo
ra
llgen
era
Pro
po
rtio
no
fcl
ad
esm
issi
ng
(mis
sin
g/t
ota
l):
Bot
ryo-
sph
aer
iaM
yco-
sph
aer
ella
Col
leto
-tr
ich
um
Xyl
ari
aA
vera
ge
for
all
gen
era
Ca
tego
ry1
1A
.M
Btr
ee
com
pa
red
wit
hM
B
trees
wit
hd
iffe
ren
ta
lign
men
ts
0.3
90.3
10.4
40.1
10.3
1�
0.1
51A
.N
Jtr
ee
com
pa
red
wit
hN
J
trees
wit
hd
iffe
ren
ta
lign
men
ts
0.4
00.2
40.3
80.3
50.3
4�
0.0
7
1B
.M
Btr
ee
com
pa
red
wit
h
cate
go
ry1
NJ
tree
0.0
90
0.1
10
1B
.N
Jtr
ee
com
pa
red
wit
h
cate
go
ry1
MB
tree
0.1
60.2
40.2
30.2
5
Ca
tego
ry2
2A
.M
Btr
ee
com
pa
red
wit
hM
B
trees
wit
hd
iffe
ren
ta
lign
men
ts
0.3
80.2
90.5
00.1
10.3
2�
0.1
62A
.N
Jtr
ee
com
pa
red
wit
hN
J
trees
wit
hd
iffe
ren
ta
lign
men
ts
0.4
20.2
90.3
80.3
50.3
6�
0.0
5
2B
.M
Btr
ee
com
pa
red
wit
h
cate
go
ry2
NJ
tree
0.0
80
0.1
00
2B
.N
Jtr
ee
com
pa
red
wit
h
cate
go
ry2
MB
tree
0.1
90.1
40.1
50.2
5
Ca
tego
ry3
3A
.M
Btr
ee
com
pa
red
wit
hM
B
trees
wit
hd
iffe
ren
ta
lign
men
ts
0.5
00.6
20.5
70.3
00.5�
0.1
43A
.N
Jtr
ee
com
pa
red
wit
hN
J
trees
wit
hd
iffe
ren
ta
lign
men
ts
0.9
00.5
70.7
50.6
90.7
3�
0.1
4
3B
.M
Btr
ee
com
pa
red
wit
h
cate
go
ry3
NJ
tree
0.0
50
00.1
03B
.N
Jtr
ee
com
pa
red
wit
h
cate
go
ry3
MB
tree
0.2
70.2
40.5
80.3
1
Av
era
ge
A.
All
MB
trees
wit
hd
iffe
ren
t
ali
gn
men
ts
0.4
2�
0.0
70.4
1�
0.1
90.5�
0.0
70.1
7�
0.1
1A
.A
llN
Jtr
ees
wit
hd
iffe
ren
t
ali
gn
men
ts
0.5
7�
0.2
80.3
7�
0.1
80.5�
0.2
10.4
6�
0.2
B.
All
MB
trees
an
dth
eir
corr
esp
on
din
gN
Jtr
ee
0.0
7�
0.0
20
0.0
7�
0.0
60.0
3�
0.0
6B
.A
llN
Jtr
ees
an
dth
eir
corr
esp
on
din
gM
Btr
ee
0.2
1�
0.0
60.2
1�
0.0
60.1
9�
0.0
60.2
7�
0.0
3
Va
lues
ind
ica
tein
con
gru
en
cysc
ore
sa
sd
eta
iled
inth
ete
xt.
Diversity and evolutionary origins of seed-associated fungi 11
ARTICLE IN PRESS
Please cite this article in press as: Jana M U’Ren et al., Diversity antropical pioneer tree: a case study for analysing fungal enviroj.mycres.2008.11.015
isolate and its ecological mode were described. Isolates from un-
known substrates or those with unknown ecological modes were
conservatively coded as missing data.
For each genus, ancestral states were reconstructed on
each of 1 K randomly sampled trees from the posterior of
20,002 trees using the Markov k-state 1 parameter model
in Mesquite version 2.0 (Maddison & Maddison: http://mes-
quiteproject.org). Results are shown on the majority rule
consensus tree of all 20,002 trees for each genus. For each
focal node, ancestral state reconstructions were summa-
rized using pie charts that correspond to two analyses.
First, we determined the proportion of trees in which
a given ecological mode was significantly more likely than
alternative ecological modes, or in which a node was equiv-
ocal or absent from the sample of trees (Arnold et al. in
press). Second, we determined for each node the average
likelihood of each ecological mode among the trees in
which that node was present.
Results
Estimating intra- and interspecific divergenceof ITS sequence data
Empirical estimates of within versus between-species ITS se-
quence divergence in four common genera of seed-associated
fungi (Botryosphaeria, Colletotrichum, Mycosphaerella, and
Xylaria) revealed a mean sequence divergence of 4.39 % (95 %
C.I.¼ 3.96–4.82 %) for sister species and 10.43 % (95 %
C.I.¼ 10.09–10.77 %) for non-sister taxa (Table 1). Mean intra-
specific divergence was significantly lower (1.65 %; 95 %
C.I.¼ 1.19–2.11 %). Mycosphaerella had the highest sister-group
sequence divergence at 4.64 %, whereas Botryosphaeria had the
lowest sister-group sequence divergence at 3.92 %.
The observation of ca 4.39 % mean sequence divergence be-
tween closely related (sister) species for four genera suggests
that 95 % sequence similarity (5 % sequence divergence) is
a reasonable and conservative estimate for delimiting species
boundaries in our sample. Therefore, genotype groups based
on 95 % sequence similarity were used to define OTU for the
remainder of our study.
Diversity of seed-associated fungi
From 527 seed-associated fungi in the Sordariomycetes and
Dothideomycetes, we recovered 155 putative species based on
95 % sequence similarity using Sequencher (Fisher’s
alpha¼ 74.01; Shannon index¼ 4.64; and Simpson’s
index¼ 84.10). Sixty-three putative species (40.7 %) occurred
only once (i.e. were singletons; Table 2). When compared us-
ing 99 % sequence similarity in Sequencher, sequences clus-
tered into 202 distinctive genotypes, of which 105 were
singletons (52.0 %).
The furthest neighbour clustering method in DOTUR
yielded a higher estimate of observed species- and genotypic
richness than did Sequencher. At 95 % ITS similarity, DOTUR
yielded 207 putative species (Fisher’s alpha¼ 125.63; Shannon
index¼ 4.53; Simpson’s index¼ 35.47), and at 99 % sequence
similarity, DOTUR distinguished 272 genotypes (Table 2). The
d evolutionary origins of fungi associated with seeds of a neo-nmental samples, Mycological Research (2009), doi:10.1016/
12 J. M. U’Ren et al.
ARTICLE IN PRESS
majority of these additional genotypes were singletons; for
example, 69 % of genotypes inferred using 95 % similarity
occurred only once.
Over the entire dataset, species-accumulation curves
based on 95 % sequence similarity remained non-asymptotic
regardless of the program used to infer genotype groups,
and BS estimates of total richness consistently exceeded the
95 % confidence interval around observed species richness
(Fig 1). The total richness estimated by the furthest neighbour
algorithm in DOTUR significantly exceeded that estimated by
BS analyses of groups inferred by Sequencher (Fig 1). For sub-
sequent analyses, we used the more inclusive ITS genotype
groups based on Sequencher to conservatively estimate spe-
cies boundaries, recognizing that this method likely underes-
timates richness.
Evidence for horizontal transmission of seed-associated fungi
Following burial in the forest at BCI, seeds originally col-
lected from Panama (BCI) and Costa Rica (La Selva) har-
boured similar fungal communities in terms of diversity
and taxonomic composition. Among 262 isolates cultured
from seeds originally harvested at BCI, 102 putative species
were recovered (Fisher’s alpha¼ 61.5). Among 265 isolates
cultured from seeds originally harvested at La Selva, 106
putative species were recovered (Fisher’s alpha¼ 66.3). Fun-
gal communities associated with seeds of both origins were
similar based on both presence/absence data for non-sin-
gletons (Jaccard’s index¼ 0.50) and isolation frequency
(Morisita–Horn index¼ 0.48). Among 92 putative species
that were recovered more than once (non-singletons), 56
(60.9 %) were recovered from seeds of both geographic ori-
gins. The remaining 36 non-singleton species were found
only in seeds originally harvested at BCI (16 putative spe-
cies), or only in seeds originally harvested from La Selva
(20 putative species). The observation that the majority of
seed-associated fungi were shared between co-incubated
seeds from different geographic origins, coupled with evi-
dence from previous studies showing that Cecropia seeds
rarely harbour cultivable fungi before soil exposure (Gallery
et al. 2007a), is consistent with horizontal transmission.
Genotypic congruence of seed-associated and endophytic fungi
Analysis using the empirical estimate of 95 % ITS sequence
similarity revealed that 40 of 155 putative species recovered
from seeds in this study (25.8 %) were recovered previously
as endophytic fungi from foliage at BCI. When more stringent
analyses were conducted using 99 % sequence similarity, 32 of
202 genotypes (15.8 %) matched previously encountered foliar
endophytic fungi, including representatives of the cosmopol-
itan genera Alternaria, Cladosporium, Fusarium, Hypoxylon,
Kabatiella, Nodulisporium, Pestalotiopsis, Trichoderma, and
Xylaria (genus-level taxonomy inferred using phylogenetic
analyses published elsewhere; e.g. Arnold et al. in press). The
remainder of our isolates did not match any fungi in our endo-
phyte database at 95 or 99 % similarity, and were not perfect
matches of any sequence data available through GenBank.
Please cite this article in press as: Jana M U’Ren et al., Diversity antropical pioneer tree: a case study for analysing fungal enviroj.mycres.2008.11.015
Assessment of BLASTn-based identification methods
Placement of our query sequences relative to their top BLASTn-
hits was assessed using (1) analyses of our query sequences
and their top hits under NCBI’s automated pairwise alignment
and minimum-evolution tree-generating tool, and (2) Bayesian
analyses based on category 2 alignments of our query se-
quences, their top hits, and representative sequences from
NCBI (Supplementary Material Table S1). Our goal was not to
compare the outputs of these different inference methods per
se, but instead to address the potential for the limited taxo-
nomic sampling present in GenBank to overestimate certainty
with regard to placement of unknown sequences.
Although BLASTn and the minimum-evolution module
drew from exactly the same sequences in GenBank, incon-
gruencies between BLASTn-based identification and identifi-
cation based on the minimum-evolution module were
common (Table 3). Only five of 16 Mycosphaerella sequences
(31.3 %), and 19 of 25 Xylaria sequences (76.0 %), were recon-
structed as sister to their top BLASTn hit using the automated
minimum evolution analysis provided by NCBI (Table 3).
Overall, minimum evolution analyses were 1.7–3.2 times
more likely than our Bayesian analyses to place query se-
quences as sister to their top BLASTn hit: only 18.8 % (Mycos-
phaerella) and 40.0 % (Xylaria) of our query sequences were
reconstructed as sister to their top BLASTn hit in Bayesian
analyses (Table 3). Instead, unknown endophytes and seed-
associated fungi were often the closest relatives of our query
sequences, disrupting the relationships between queries and
GenBank sequences seen in minimum evolution trees. Ac-
cordingly, misidentification by BLASTn, indicated by sister re-
lationships between query sequences and sequences other
than their top BLASTn match, was highlighted roughly twice
as frequently by our Bayesian inferences (Table 3). In general,
we observed that the minimum evolution inference module in
NCBI can over-inflate certainty regarding BLASTn-based iden-
tification because only sequences present in GenBank are
considered.
Overall, only 25 % (Mycosphaerella) and 32 % (Xylaria) of
query sequences that were sister to their top BLASTn hit in
minimum evolution analyses were also sister to their top hit
in our Bayesian analyses. Polytomies, which may accurately
reflect unresolved placement given the taxon sampling pres-
ent in the analysis or the limitations of the phylogenetic signal
in the data, occurred with similar frequency in Bayesian and
minimum evolution trees for Mycosphaerella, but were twice
as common in Bayesian trees than in minimum evolution
analyses for Xylaria.
Bayesian analyses indicated that 81.3 % (Mycosphaerella)
and 76 % (Xylaria) of our query sequences could not be
assigned to a named taxon, as demonstrated by (1) sister rela-
tionships to unclassified NCBI sequences or, more frequently,
unidentified sequences from our seed-associated or endo-
phytic fungi, or (2) uncertain placement, either in polytomies
with terminal taxa that might represent multiple species or
placement basal to a clade containing multiple taxa (Supple-
mentary Material Figs S5–S6; Table 3). Overall, Bayesian anal-
yses only allowed one query sequence to be placed to the
species level in Mycosphaerella (i.e. sister to an identified
d evolutionary origins of fungi associated with seeds of a neo-nmental samples, Mycological Research (2009), doi:10.1016/

Diversity and evolutionary origins of seed-associated fungi 13
ARTICLE IN PRESS
species of Mycosphaerella), and two to genus (i.e. sister to se-
quences identified as Mycosphaerella sp.; Supplementary Mate-
rial Fig S5). Bayesian analyses for Xylaria identified one
sequence to the species level (i.e. sister to an identified species
of Xylaria), and five to a higher taxonomic level (e.g. sister to
sequences identified only as Xylariaceae sp. or Xylarialean
fungi; Supplementary Material Fig S6).
Both minimum evolution and Bayesian analyses revealed
that query sequences whose top BLASTn matches are to un-
identified fungi should not be ‘identified’ on the basis of the
first named species in the list of BLASTn results (Supplemen-
tary Material Figs S5–S6). In only one case was a query se-
quence reconstructed as sister to the first named hit when
the top BLASTn hit was to an unidentified fungus: Seed-
L126-Cecropia, for which the top BLASTn hit was an unnamed
sequence, was reconstructed as sister to the first identified
isolate among its BLASTn hits (DQ485958, Botryosphaeria rho-
dina; Supplementary Material Fig S6). One query sequence
(Endo-P562-Cecropia) was placed in a polytomy with both its
top hit (fungal endophyte DQ485962) and its first named hit
(Xylaria sp. EF423534).
Importance of alignment, model selection,and inference method
We generated three alignments (categories 1, 2, and 3) for one
dataset per genus, and examined resulting topologies follow-
ing Bayesian and NJ analyses. Our goal was to evaluate the
sensitivity of each inference method and fungal genus to dif-
ferent alignment methods.
We found that within each genus, Bayesian analyses were
relatively robust to the different alignments and models of
evolution used here: different alignments and evolutionary
models yielded different topologies for each genus, but differ-
ences among those topologies were not supported by signifi-
cant PPs (Figs 2–5). However, Bayesian analyses revealed that
genera differed from one another in their sensitivity to align-
ment methods (one-way ANOVA based on incongruency
scores, F3,8¼ 4.403; P¼ 0.042). The highest incongruency score
was observed in Colletotrichum (0.50� 0.07), which indicated
that ca 50 % of nodes were lost when trees from the different
alignments of the same Colletotrichum matrix were compared
(Table 4). In contrast, Xylaria had a significantly lower incon-
gruency score (i.e. more similar topologies) when Bayesian
trees based on category 1, 2, and 3 alignments were compared
with each other (0.17� 0.11) relative to the other three genera
(post-hoc Student’s t-test, t3¼ 2.306, P< 0.05; Table 4). In con-
trast, genera did not differ significantly from one another
in their responses to different alignment methods under NJ
(Table 4; one-way ANOVA, F3,8¼ 0.456, P¼ 0.720).
Within each genus, NJ analyses were more sensitive to dif-
ferent alignment methods than were Bayesian analyses: aver-
age incongruency scores were higher for comparisons among
alignments under NJ than under Bayesian methods (Table 4).
NJ analyses were particularly sensitive to differences between
category 3 alignments and the automated and semi-automated
alignment methods used here (incongruency score for category
3 versus other alignments under NJ¼ 0.73� 0.14). Topologies of
NJ trees inferred from category 1 and category 2 alignments had
more resolved terminal nodes than did category 3 trees, which
Please cite this article in press as: Jana M U’Ren et al., Diversity antropical pioneer tree: a case study for analysing fungal enviroj.mycres.2008.11.015
in turn lacked resolution due to the exclusion of ambiguously
aligned regions (data not shown).
Overall, NJ trees had higher average incongruency scores
when compared against Bayesian trees (0.19–0.27) than did
Bayesian trees when compared against NJ trees (0–0.07). These
results highlight the greater resolution provided by NJ analy-
ses, which was lost when Bayesian analyses were performed.
All genera experienced a similar loss of resolution under
Bayesian methods relative to NJ methods (one-way ANOVA,
F3,7¼ 1.290, P¼ 0.35), and a similar gain in resolution under
NJ relative to Bayesian methods (Wilcoxon signed-rank test,
chi-square¼ 4.327, P¼ 0.228, df¼ 3).
Phylogenetic relationships and evolutionary originsof seed-associated fungi
Our most robust phylogenetic analysis methods (Bayesian
analyses based on category 2 alignments implementing
GTRþ IþG) revealed several well-supported clades contain-
ing both seed-associated fungi and endophytes for three of
the four focal genera, including four clades in Botryosphaeria
(Fig 2), one in Mycosphaerella (Fig 4), and three in Xylaria (Fig
5). The Colletotrichum tree contained one clade with pathogens,
seed-associated fungi, and endophytes, but this clade was not
well supported and lacked resolution (Fig 3), and thus was not
used in ancestral state reconstructions.
Ancestral state reconstruction illustrated several prelimi-
nary hypotheses for the evolutionary history of seed-associated
fungi, as well as their relationships to pathogens, endophytes,
and saprotrophs in Botryosphaeria, Mycosphaerella, and Xylaria.
In general, more frequent evolutionary associations were seen
among endophytes, pathogens, and seed-associated fungi
than between any of those guilds and saprotrophs (Figs 2, 4, 5).
However, the evolutionary interplay of these ecological modes
differed among genera.
Within Botryosphaeria, ancestral state reconstructions
suggested that several endophytes arose from putatively
seed-associated ancestors (e.g. Fig 2: Endo-6755-Gustavia
and Endo-6718-Gustavia), and highlighted several transi-
tions from pathogenicity to seed-association (e.g. the line-
age containing B. obtusa). Transitions from endophytism to
seed-association were not observed.
In Mycosphaerella, ancestral state reconstructions for three
clades containing both endophytes and seed-associated fungi
reveal that the greatest proportion of trees contain ancestors
whose ecological mode reconstructions were equivocal (Fig
4). However, reconstructions that calculate the average prob-
ability of any given ecological mode among the trees in which
a node was present indicate a seed-associated ancestor for
one endophyte (Endo-SHTT48-Trichilia). Both methods of an-
cestral state reconstruction suggest that the clade containing
all of the pathogens, as well as two endophytes and one seed-
associated fungus, arose from a pathogenic ancestor.
In Xylaria, several endophytes may have arisen from
seed-associated ancestors (e.g. Endo-178B-Cecropia, Endo-
187-Cecropia, and Endo-P222-Cecropia; Fig 5). No transitions
of seed-associated or endophytic fungi to or from saprotro-
phy were observed, suggesting that seed-associated fungi
and endophytes may be evolutionarily distinct from sapro-
trophic lineages (Fig 5).
d evolutionary origins of fungi associated with seeds of a neo-nmental samples, Mycological Research (2009), doi:10.1016/
14 J. M. U’Ren et al.
ARTICLE IN PRESS
Discussion
Many seed-associated fungi remain sterile in culture, and there-
fore cannot be identified on the basis of reproductive morphology.
Inaddition,phylogeneticspeciesconceptsaredifficult toapplyrig-
orously in survey data, which are geographically limited, often re-
stricted to focal guilds, and typically are not exhaustive in terms of
capturing the diversity of focal lineages of fungi. Therefore, desig-
nating operational taxonomic units on the basis of percent se-
quence similarity provides a useful proxy for estimating species
boundaries (e.g. O’Brien et al. 2005; Arnold & Lutzoni 2007). How-
ever, the degree of sequence similarity used to designate fungal
species boundaries often differs among studies because empirical
estimates are rarely, if ever, generated. This is in contrast to bacte-
riology, where empirical studies have suggested that two bacteria
belong to the same putative species if DNA–DNA cross-hybridiza-
tion levels are>70 %, which in turn corresponds to a 16S rDNA se-
quence similarity of>97 % (Stackebrandt & Gobel 1994).
We empirically estimated the amount of ITS sequence di-
vergence for four representative fungal genera. The ITS locus
was chosen due to its extensive use for species-level diagnoses
in fungal environmental studies and systematics (see Arnold
et al. 2007). Although rates of inter- and intraspecific divergence
differ among fungal lineages (Seifert et al. 2007), we observed
relatively consistent patterns of sequence divergence within
species, between sister species, and between non-sister species
in four genera (Table 1). Focal Dothideomycetes had both the
highest and the lowest sister-group sequence divergence esti-
mates, whereas focal Sordariomycetes were intermediate.
Empirical estimation of percent divergence for estimating
fungal species boundaries is important for environmental stud-
ies of fungi. However, we note the following caveats for future
work. First, our estimates are based on published phylogenies,
which represent only a minority of the potential geographic
and taxonomic diversity in each genus. Were each genus sam-
pled to completion, resulting estimates of intra- and interspe-
cific sequence divergence might change markedly. We expect
that tropical members of these genera are most likely to be
undersampled relative to their temperate counterparts. Sec-
ond, most published phylogenies do not contain explicit infor-
mation regarding phylogenetic uncertainty, and in many cases
support values for nodes are not given. Our estimates rely on
robust phylogenies and would be changed if these topologies
prove incorrect. Third, we assume a similar rate of change in
the ITS region across different fungal lineages and among fungi
from different ecological modes or geographic origins (e.g.
pathogens versus endophytes; strongly seasonal temperate cli-
mates versus aseasonal tropical climates), but this may not hold
true. Fourth, very few phylogenies based on loci other than ITS
are available for these genera, limiting the robustness of our es-
timate. Finally, we acknowledge the limitations imposed by us-
ing only a single locus to infer species boundaries (see Taylor
et al. 2000), which is at best a flawed, but still necessary, ap-
proach for categorizing fungal environmental samples.
Richness and diversity of seed-associated fungi
A limited number of computational methods are available for
comparing sequences efficiently and accurately to designate
Please cite this article in press as: Jana M U’Ren et al., Diversity antropical pioneer tree: a case study for analysing fungal enviroj.mycres.2008.11.015
operational taxonomic units. We found marked differences
between two software packages in terms of the richness of
our unknown fungi and the composition of OTU. DOTUR pro-
vided much higher richness estimates than did Sequencher:
from the same datasets, DOTUR recovered as many as 120
more genotype groups (based on 99 % sequence similarity),
and as many as 94 more putative species (based on 95 % sim-
ilarity; Table 2). This striking disparity reveals a major chal-
lenge for biodiversity studies of unknown fungi.
We found that Sequencher can be sensitive to sample com-
position (see Table 2; differences between analyses with all se-
quences versus Sordariomycetes and Dothideomycetes only), and
its sequence comparison algorithm is not publicly available.
However, it is computationally straightforward and its output
has been compared favourably with other tools for delimiting
ITS genotype groups, including comparisons of ITS OTU with
phylogenetic analyses of the nu-rLSU (Arnold et al. 2007).
DOTUR (Schloss & Handelsman 2005) has been used exten-
sively for bacterial environmental studies based on 16S rDNA,
and it is both fast and robust to sample composition (i.e. sum-
ming the number of OTU for the Sordariomycetes and Dothideo-
mycetes, analysed separately, yields a value that is similar to
analyses of the entire dataset; Table 2). However, when a cor-
rected distance matrix is the input for DOTUR, the method is
sensitive to sequence length. Moreover, DOTUR requires an
alignment to generate a distance matrix. This may limit its
utility for loci, such as ITS, for which reliable alignments can
be difficult to generate in phylogenetically diverse datasets.
Because DOTUR was designed for analysis of bacterial 16S
data, it should be used with care when estimating fungal
OTU based on ITS data.
Our DOTUR analyses used the furthest neighbour algo-
rithm, whereby each sequence in an OTU must be X % sim-
ilar to all other sequences, rather than X % similar to only
the most similar sequence in that group. When analyses in
DOTUR were repeated using that program’s nearest neigh-
bour algorithm (whereby each sequence within an OTU
only must have X % similarity to the most similar sequence
in the group), our estimate of the putative number of species
was more consistent with Sequencher (data not shown). In
future studies, it would be useful to validate both DOTUR
and Sequencher output using data sets consisting of a known
number of species, perhaps focusing on a particularly well-
studied and widely sampled fungal genus.
When conservative methods are used to estimate species
boundaries (95 % sequence similarity and Sequencher group-
ings, as used by Arnold & Lutzoni 2007), the diversity of fungi
recovered among only the Dothideomycetes and Sordariomycetes
in this study exceeds that found in similar seed-burial exper-
iments at the same site: we observed a Fisher’s alpha value of
74.01, whereas Gallery et al. (2007a) reported a Fisher’s alpha
value of 38.2 for a smaller data set representing four species
of Cecropia. Despite having more than doubled the number of
fungi recovered by Gallery et al. (2007a), our study did not yet
achieve statistically complete sampling of novel species or ge-
notypes: bootstrap estimates are 25 % higher than observed
species richness (Fig 1). Further sampling is needed to capture
the high diversity of seed-associated fungi at this site, under-
scoring the tremendous richness of fungi capable of infecting
seeds of a single tree species in one tropical forest.
d evolutionary origins of fungi associated with seeds of a neo-nmental samples, Mycological Research (2009), doi:10.1016/

Diversity and evolutionary origins of seed-associated fungi 15
ARTICLE IN PRESS
Assessing BLAST-based identification
Two phylogenetic methods, one automated, distance-based,
and restricted to sequences in GenBank (minimum evolution,
implemented in NCBI) and one model-based, using manually
adjusted automated alignments and considering unpublished
sequences (Bayesian), were compared to examine BLASTn-
based identification of 41 sequences of unknown fungi. BLAST
identification was considered accurate if a query sequence
and its top BLAST hit were sister to each other in resulting
topologies.
Although BLASTn and the minimum-evolution module
relied on the same sequences in GenBank, incongruencies
between these methods were observed for 17 of 41 sequences
examined (41.5 %; Table 3). In turn, Bayesian inference using
an alignment of unknown sequences, their top BLAST hit,
and the next named BLAST hit (if the top hit was to an uniden-
tified sample in GenBank), as well as identified sequences
from NCBI, even more rarely placed query sequences with
their top BLASTn matches. Although our focal genera are
well-represented in GenBank, with ITS sequences of at least
92 species of Mycosphaerella and 13 species of Xylaria present
in the database at the time of our study, the closest relatives
of our query sequences are mostly uncharacterized and/or
are not yet included in public databases. We conclude that
BLASTn and the NCBI minimum-evolution module can falsely
‘over-identify’ unknown fungi: for both of the focal genera in
this study, the majority of sequences were reconstructed in
richer Bayesian analyses in polytomies with, or as sister to,
other unknown fungi whose sequence data are not yet in
public databases.
We realize the attractiveness of BLAST lies in its rapid and
concise estimates of taxonomy, in contrast to phylogenetic
methods that are more time-consuming and hard to interpret
(e.g. see Little & Stevenson 2007 for discussion). However, our
study and others that have highlighted the additional prob-
lems associated with misidentified sequences in GenBank
(see Vilgalys 2003) suggest that BLASTn results should not be
used to assign names to unknown sequences, but rather as
a guide for estimating taxonomic placement. Caution is espe-
cially warranted when the top BLASTn matches are to uniden-
tified fungi; using the first named fungus in the list of BLASTn
hits almost always misidentified the query sequence in our
analyses. Overall, our results support studies from other fields
(e.g. genome annotation) which demonstrate that BLASTn
comparisons do not always yield the closest relative (Koski
& Golding 2001), highlight the importance of populating Gen-
Bank with additional sequence data to improve the quality
of both BLASTn and minimum-evolution analyses, and indi-
cate that analyses using rich datasets are likely to be most
informative.
More generally, our study integrated unknown fungi into
phylogenies with putatively closely related taxa and high-
lighted several cases in which seed-associated and endophytic
fungi represent well-supported clades that are distinct from the
placement of any closely related sequences in GenBank (e.g.
Supplementary Material Figs S5–S6). Whether this outcome
reflects a geographic artefact due to the paucity of published
fungal sequences from Panama or instead embodies true
Please cite this article in press as: Jana M U’Ren et al., Diversity antropical pioneer tree: a case study for analysing fungal enviroj.mycres.2008.11.015
phylogenetic distinctiveness of seed-associated fungi is not
yet clear. Our results provide a reminder that both database-
driven identification and phylogenetically assigned taxon
names are sensitive to the availability of sequence data for
closely related fungi.
Assessing alignment and model selection
Alignment methods strongly affect downstream phylogenetic
analyses of molecular data (Ogden & Rosenberg 2006). Align-
ing ITS sequences can be especially difficult even within fun-
gal genera, and criteria for alignment quality differ among
researchers. Therefore, three different alignment methods
were examined in the context of Bayesian and NJ phylogenetic
inference methods.
The different alignments examined here resulted in no
well-supported topological conflicts when relationships for
each genus were inferred using Bayesian methods. However,
trees generated from our category 1 (MUSCLE only) and cate-
gory 2 (MUSCLE with manual adjustment) alignments were
most similar to each other. This was an expected result given
the low level of sequence editing that differentiated the cate-
gory 2 alignments from category 1. Topologies generated from
the Bayesian analyses of the category 3 (manual) alignments
have less resolution than category 1 and category 2 align-
ments, reflecting manual exclusion of ambiguously aligned
regions. Model selection did not have a large effect on the
tree topologies generated in this study, possibly reflecting
that the different models implemented here, based on Mod-
elTest analyses, are similar to one another (e.g. SYMþ IþG is
the same as GTRþ IþG except for fixed equal nucleotide
frequencies).
Although NJ may perform poorly relative to other phyloge-
netic inference methods in many cases (see Hall 2005), many
studies rely on NJ for estimating the relationships of unknown
fungi because of the algorithm’s speed with large datasets (e.g.
Schadt et al. 2003). Our results suggest that NJ inferences are
much more sensitive to ambiguous regions in alignments
than are Bayesian methods (Table 4). NJ analyses also tended
to give higher statistical support to terminal (species-level)
clades than did Bayesian analyses (Supplementary Material
Figs S3–S6), possibly overestimating confidence in those rela-
tionships. Overall, these results are not unexpected given re-
sults observed for simulated data sets, wherein NJ has been
shown to be more sensitive to alignment error (Ogden &
Rosenberg 2006). We conclude that caution in the use of NJ
methods alone is warranted given the difficulty of aligning
ITS data for many fungal taxa, the lack of phylogenetic uncer-
tainty in NJ analyses, and the potential to overestimate cer-
tainty regarding terminal relationships.
Our Bayesian analyses demonstrate that genera differ
significantly in their sensitivity to alignment methods. This
reflects differences in the variability in ITS sequence data
within particular genera, and highlights the need to consider
the identity of the fungi prior to selecting an analysis approach.
In contrast, genera did not differ in their sensitivity to different
alignments when NJ analyses were performed. In general, BS
values are generally in agreement with PPs for category 2 align-
ments under both inference methods (Figs 2–5), which supports
d evolutionary origins of fungi associated with seeds of a neo-nmental samples, Mycological Research (2009), doi:10.1016/

16 J. M. U’Ren et al.
ARTICLE IN PRESS
the validity of our subsequent analyses regarding the evolution
of seed-associated fungi in these genera.
Evolutionary origins of seed-associated fungi
After incubation below Cecropia trees in lowland tropical for-
est, intact seeds of C. insignis are frequently infected by a di-
verse array of filamentous fungi, especially in the
Sordariomycetes and Dothideomycetes. Given their diversity
(this study; see also Gallery et al. 2007a), their spatial heteroge-
neity in the forest (see Kluger et al. 2008), and their variable
evolutionary relationships with regard to pathogens, endo-
phytes, and saprotrophs (this study), it is likely that these
fungi play diverse ecological roles. Recent studies have sug-
gested that the most common seed-associated fungi in tropi-
cal forests are host-generalists (e.g. Kluger et al. 2008), but that
they still have profound effects on seed germination for par-
ticular tree species, as well as site-specific effects on seed sur-
vival (see Gallery et al. 2007a; Kluger et al. 2008). Our data
complement these studies by not only providing a first hy-
pothesis for the phylogenetic relationships of seed-associated
fungi in several genera, but also an initial set of hypotheses re-
garding their evolutionary and ecological relationships with
representative pathogenic, endophytic and saprotrophic
fungi.
Consistent with previous suggestions of horizontal trans-
mission (see Gallery et al. 2007a; Kluger et al. 2008), our data
show that seeds from different geographic regions (Costa
Rica, Panama) accumulate diverse but highly similar commu-
nities of fungi following burial together in Panama. However,
the prevalence of known endophytic genotypes among seed-
associated fungi, almost certainly an underestimate of the
congruence of these guilds given that neither endophyte nor
seed-associated fungi have been sampled to saturation in
this forest, leaves open the possibility that some fungi in seeds
are vertically transmitted endophytes.
Whereas sequence identity can reveal the overlap of fungi
among different guilds, phylogenetic analyses provide insight
into the evolutionary relationships of different fungal taxa
and ecological modes. Our results indicate close, well-sup-
ported relationships of seed-associated fungi and endophytes
in three of four focal genera (Botryosphaeria, Mycosphaerella,
and Xylaria). Likelihood reconstructions were performed to
find the character state of each node that maximizes the prob-
ability of getting the observed states (i.e. seed-associated, en-
dophyte, pathogen or saprotroph) for terminal taxa. For all
three genera, the second ancestral state reconstruction
method used here, which considers the average probability
of any given ecological mode among trees in which that
node was present, reconstructed ecological states more often
than the first method. However, the first method, which pro-
vides the proportion of posterior trees in which a given state
was significantly more likely than alternative states, or in
which a node was equivocal or absent, was able to unequivo-
cally reconstruct some nodes closer to the tips of these trees.
Within these focal genera, the fungi we recovered from
surface-sterilized seeds appear to share a closer evolutionary
history with pathogens and endophytes than with sapro-
trophs. However, the observation of putatively saprotrophic
fungi as endophytes in other studies (e.g. Fisher & Petrini
Please cite this article in press as: Jana M U’Ren et al., Diversity antropical pioneer tree: a case study for analysing fungal enviroj.mycres.2008.11.015
1992; Hyde et al. 2007; Promputtha et al. 2007), and the possibil-
ity that some seed-associated fungi are saprotrophs despite
being isolated from the interior of surface-sterilized seeds, re-
quires further attention. Given that endophytes of tropical
trees gain entry to the leaf in order to colonize intercellularly,
it follows that endophytes and seed-colonizing fungi could
share a close relationship with pathogens, which also gain en-
try to living tissue to cause disease. Future work will involve
more extensive sampling of pathogens, endophytes, and
seed-associated fungi to more clearly reveal these relation-
ships, and will rely in part on trustworthy analysis methods.
The latter issue motivated and provided the context for the
present study, and will continue to be improved by careful at-
tention from mycologists, enhanced methods, and expansion
of environmental samples beyond single-locus datasets.
Acknowledgements
We gratefully acknowledge the College of Agriculture and Life
Sciences at the University of Arizona and the National Science
Foundation for supporting this research (DEB-0200413, DEB-
0342925, DEB-0516564, and DEB-0640996 to AEA, and DEB-
0343953 to JWD). We further thank NSF for fostering discussion
that informed this work through the Fungal Environmental
Sampling and Informatics Network (FESIN; DEB-0639048 to
Tom Bruns, Karen Hughes, and AEA). JMU was supported by an
NSF-IGERT Fellowship in Genomics at the University of Arizona
while completing this study. We thank Francois Lutzoni and
A. Jon Shaw for logistical support at Duke University, and
Malkanthi Gunatilaka, K. Lindsay Higgins, Michele Hoffman,
Megan McGregor, Alyson Paulick, Evelyn Sanchez, Brett Wolfe
and Mariana del Olmo Ruiz for technical assistance. The helpful
suggestions of two anonymous reviewers improved this manu-
script, for which we are most grateful.
Supplementary material
Supplementary data associated with this article can be found
in the online version, at doi: 10.1016/j.mycres.2008.11.015
r e f e r e n c e s
Altschul SF, Gish W, Miller W, Myers EW, Lipman DJ, 1990. Basiclocal alignment search tool. Journal of Molecular Biology 215:403–410.
Alvarez-Buylla ER, Martınez-Ramos M, 1990. Seed bank versusseed rain in the regeneration of a tropical pioneer tree.Oecologia 84: 314–325.
Arenz BE, Held BW, Jurgens JA, Farrell RL, Blanchette RA, 2006.Fungal diversity in soils and historic wood from the Ross Searegion of Antarctica. Soil Biology & Biochemistry 38: 3057–3064.
Arnold AE, Henk DA, Eells RL, Lutzoni F, Vilgalys R, 2007. Diversityand phylogenetic affinities of foliar fungal endophytes inloblolly pine inferred by culturing and environmental PCR.Mycologia 99: 185–206.
Arnold AE, Lutzoni F, 2007. Diversity and host range of foliarfungal endophytes: are tropical leaves biodiversity hotspots?Ecology 88: 541–549.
d evolutionary origins of fungi associated with seeds of a neo-nmental samples, Mycological Research (2009), doi:10.1016/
Diversity and evolutionary origins of seed-associated fungi 17
ARTICLE IN PRESS
Arnold A.E., Miadlikowska J., Higgins K.L., Sarvate S.D., Gugger P.,Way A., Hofstetter V., Kauff F. & Lutzoni. Hyperdiverse fungalendophytes and endolichenic fungi elucidate the evolution ofmajor ecological modes in the Ascomycota. Systematic Biology Inpress.
Bridge PD, Roberts PJ, Spooner BM, Panchal G, 2003. On the un-reliability of published DNA sequences. New Phytologist 160:43–48.
Colwell RK, 2005. EstimateS: Statistical estimation of speciesrichness and shared species from samples. Online, at <http://viceroy.eeb.uconn.edu/EstimateS>.
Dalling JW, Swaine MD, Garwood NC, 1997. Soil seed bank com-munity dynamics in seasonally moist lowland tropical forest,Panama. Journal of Tropical Ecology 13: 659–680.
Dalling JW, Swaine MD, Garwood NC, 1998. Dispersal patternsand seed bank dynamics of pioneer trees in moist tropicalforest. Ecology 79: 564–578.
Davis EC, Franklin JB, Shaw AJ, Vilgalys R, 2003. EndophyticXylaria (Xylariaceae) among liverworts and angiosperms: phy-logenetics, distribution, and symbiosis. American Journal ofBotany 90: 1661–1667.
Denman S, Crous PW, Groenwald JZ, Slippers B, Wingfield BD,Wingfield MJ, 2003. Circumscription of Botryosphaeria speciesassociated with Proteaceae based on morphology and DNAsequence data. Mycologia 95: 294–307.
Du M, Schardl CL, Nuckles EM, Vaillancourt LJ, 2005. Using mat-ing-type gene sequences for improved phylogenetic resolutionof Colletotrichum species complexes. Mycologia 97: 641–658.
Edgar RC, 2004. MUSCLE: multiple sequence alignment with high ac-curacy and high throughput. Nucleic Acids Research 32: 1792–1797.
Ewing B, Green P, 1998. Base-calling of automated sequencertraces using phred. II. Error probabilities. Genome Research 8:186–194.
Ewing B, Hillier L, Wendl MC, Green P, 1998. Base-calling of au-tomated sequencer traces using phred. I. Accuracy assess-ment. Genome Research 8: 175–185.
Feau N, Hamelin RC, Bernier L, 2006. Attributes and congruence ofthree molecular datasets: inferring phylogenies among Septo-ria-related species from woody perennial plants. MolecularPhylogenetics and Evolution 40: 808–829.
Fisher PJ, Petrini O, 1992. Fungal saprobes and pathogens asendophytes of rice (Oryza sativa L). New Phytologist 120:137–143.
Gallery RE, Dalling JW, Arnold AE, 2007a. Diversity, host affinity,and distribution of seed-infecting fungi: a case study withCecropia. Ecology 88: 582–588.
Gallery RE, Dalling JW, Wolfe B, Arnold AE, 2007b. Role of seed-infecting fungi in the recruitment limitation of neotropicalpioneer species. In: Dennis A, Green R, Schupp E, Westcott D(eds), Chapter 23 in Seed Dispersal: Theory and its Applicationin a Changing World. CABI Press. pp. 479–498.
Geml J, Via Z, Long J, Huston S, Marr T, Taylor DL, 2005. The FungalMetagenomics Project. <http://www.borealfungi.uaf.edu>.
Gordon D, Abajian C, Green P, 1998. Consed: a graphical tool forsequence finishing. Genome Research 8: 195–202.
Hall BG, 2005. Comparison of the accuracies of several phyloge-netic methods using protein and DNA sequences. MolecularBiology and Evolution 22: 792–802.
Hall JB, Swaine MD, 1980. Seed stocks in Ghanaian forest soils.Biotropica 12: 256–263.
Harris DJ, 2003. Can you bank on GenBank? Trends in Ecology &Evolution 18: 317–319.
Henry T, Iwen PC, Hinrichs SH, 2000. Identification of Aspergillusspecies using internal transcribed spacer regions 1 and 2.Journal of Clinical Microbiology 38: 1510–1515.
Hoffman M, Arnold AE, 2008. Geography and host identity inter-act to shape communities of endophytic fungi in cupressa-ceous trees. Mycological Research 112: 331–344.
Please cite this article in press as: Jana M U’Ren et al., Diversity antropical pioneer tree: a case study for analysing fungal enviroj.mycres.2008.11.015
Hogberg N, Land CJ, 2004. Identification of Serpula lacrymans andother decay fungi in construction timber by sequencing of ri-bosomal DNA d a practical approach. Holzforschung 58: 199–204.
Huelsenbeck JP, Ronquist F, 2001. MRBAYES: Bayesian inferenceof phylogenetic trees. Bioinformatics 17: 754–755.
Hyde KD, Bussaban B, Paulus B, Crous PW, Lee S, McKenzie EHC,Photita W, Lumyong S, 2007. Diversity of saprobic microfungi.Biodiversity and Conservation 16: 7–35.
James TY, Kauff F, Schoch CL, Matheny PB, Hofstetter V, Cox CJ,Celio G, Gueidan C, Fraker E, Miadlikowska J, Lumbsch HT,Rauhut A, Reeb V, Arnold AE, Amtoft A, Stajich JE, Hosaka K,Sung GH, Johnson D, O’Rourke B, Crockett M, Binder M,Curtis JM, Slot JC, Wang Z, Wilson AW, Schußler A,Longcore JE, O’Donnell K, Mozley-Standridge S, Porter D,Letcher PM, Powell MJ, Taylor JW, White MM, Griffith GW,Davies DR, Humber RA, Morton JB, Sugiyama J, Rossman AY,Rogers JD, Pfister DH, Hewitt D, Hansen K, Hambleton S,Shoemaker RA, Kohlmeyer J, Volkmann-Kohlmeyer B,Spotts RA, Serdani M, Crous PW, Hughes KW, Matsuura K,Langer E, Langer G, Untereiner WA, Lucking R, Budel B,Geiser DM, Aptroot A, Diederich P, Schmitt I, Schultz M,Yahr R, Hibbett DS, Lutzoni F, McLaughlin DJ, Spatafora JW,Vilgalys R, 2006. Reconstructing the early evolution of fungiusing a six-gene phylogeny. Nature 443: 818–822.
Kluger CG, Dalling JW, Gallery RE, Sanchez E, Weeks-Galindo C,Arnold AE, 2008. Prevalent host-generalism among fungi as-sociated with seeds of four neotropical pioneer species. Journalof Tropical Ecology 24: 351–354.
Koljalg U, Larsson KH, Abarenkov K, Nilsson RH, Alexander IJ,Eberhardt U, Erland S, Hoiland K, Kjoller R, Larsson E,Pennanen T, Sen R, Taylor AFS, Tedersoo L, Vralstad T,Ursing BM, 2005. UNITE: a database providing web-basedmethods for the molecular identification of ectomycorrhizalfungi. New Phytologist 166: 1063–1068.
Koski LB, Golding GB, 2001. The closest BLAST hit is often not thenearest neighbor. Journal of Molecular Evolution 52: 540–542.
Lambert C, Campenhout J-MVan, DeBolle X, Depiereux E, 2003.Review of common sequence alignment methods: clues toenhance reliability. Current Genomics 4: 131–146.
Landan G, Graur D, 2007. Heads or tails: a simple reliability checkfor multiple sequence alignments. Molecular Biology and Evo-lution 24: 1380–1383.
Lee JS, Ko KS, Jung HS, 2000. Phylogenetic analysis of Xylariabased on nuclear ribosomal ITS1–5.8S–ITS2 sequences. FEMSMicrobiology Letters 187: 89–93.
Little DP, Stevenson DW, 2007. A comparison of algorithms forthe identification of specimens using DNA barcodes: examplesfrom gymnosperms. Cladistics 23: 1–21.
Lutzoni F, Kauff F, Cox CJ, McLaughlin D, Celio G, Dentinger B,Padamsee M, Hibbett D, James TY, Baloch E, Grube M, Reeb V,Hofstetter V, Schoch C, Arnold AE, Miadlikowska J, Spatafora J,Johnson D, Hambleton S, Crockett M, Shoemaker R, Sung GH,Lucking R, Lumbsch T, O’Donnell K, Binder M, Diederich P,Ertz D, Gueidan C, Hansen K, Harris RC, Hosaka K, Lim YW,Matheny B, Nishida H, Pfister D, Rogers J, Rossman A,Schmitt I, Sipman H, Stone J, Sugiyama J, Yahr R, Vilgalys R,2004. Assembling the fungal tree of life: progress, classifica-tion and evolution of subcellular traits. American Journal ofBotany 91: 1446–1480.
Maddison DR, Maddison WP, 2003. MacClade 4.06: Analysis ofPhylogeny and Character Evolution. Sinauer Associates,Sunderland, MA.
Morrison DA, Ellis JT, 1997. Effects of nucleotide sequence align-ment on phylogeny estimation: a case study of 18S rDNAs ofApicomplexa. Molecular Biology and Evolution 14: 428–441.
Murray KG, Garcia M, 2002. Contributions of seed dispersal torecruitment limitation in a Costa Rican cloud forest. In: LeveyDJ, Silva WR, Galetti M (eds), Seed Dispersal and Frugivory:
d evolutionary origins of fungi associated with seeds of a neo-nmental samples, Mycological Research (2009), doi:10.1016/
18 J. M. U’Ren et al.
ARTICLE IN PRESS
ecology, Evolution and Conservation. CAB International Press,Wallingford, UK, pp. 323–338.
Nilsson RH, Kristiansson E, Ryberg M, Larsson KH, 2005. Ap-proaching the taxonomic affiliation of unidentified sequencesin public databases d an example from the mycorrhizal fungi.BMC Bioinformatics 6.
O’Brien HE, Parrent JL, Jackson JA, Moncalvo JM, Vilgalys R, 2005.Fungal community analysis by large-scale sequencing of en-vironmental samples. Applied and Environmental Microbiology71: 5544–5550.
O’Hanlon-Manners DL, Kotanen PM, 2004. Evidence that fungalpathogens inhibit recruitment of a shade-intolerant tree,white birch (Betula papyrifera), in understory habitats. Oecologia140: 650–653.
Ogden TH, Rosenberg MS, 2006. Multiple sequence alignmentaccuracy and phylogenetic inference. Systematic Biology 55:314–328.
Pearson WR, 1998. Empirical statistical estimates for se-quence similarity searches. Journal of Molecular Biology 276:71–84.
Pearson WR, 2000. Flexible sequence similarity searching with theFASTA3programpackage. Methods inMolecularBiology132: 185–219.
Posada D, Crandall KA, 1998. MODELTEST: testing the model ofDNA substitution. Bioinformatics 14: 817–818.
Promputtha I, Lumyong S, Dhanasekaran V, McKenzie EHC,Hyde KD, Jeewon R, 2007. A phylogenetic evaluation ofwhether endophytes become saprotrophs at host senescence.Microbial Ecology 53: 579–590.
Schadt CW, Martin AP, Lipson DA, Schmidt SK, 2003. Seasonaldynamics of previously unknown fungal lineages in tundrasoils. Science 301: 1359–1361.
Please cite this article in press as: Jana M U’Ren et al., Diversity antropical pioneer tree: a case study for analysing fungal enviroj.mycres.2008.11.015
Schloss PD, Handelsman J, 2005. Introducing DOTUR, a computerprogram for defining operational taxonomic units and esti-mating species richness. Applied and Environmental Microbiology71: 1501–1506.
Seifert KA, Samson RA, Dewaard JR, Houbraken J, Levesque CA,Moncalvo JM, Louis-Seize G, Hebert PDN, 2007. Prospects forfungus identification using C01 DNA barcodes, with Penicilliumas a test case. Proceedings of the National Academy of Sciences USA104: 3901–3906.
Smith H, Wingfield MJ, Crous PW, Coutinho TA, 1996. Sphaeropsissapinea and Botryosphaeria dothidea endophytic in Pinus spp andEucalyptus spp in South Africa. South African Journal of Botany62: 86–88.
Stackebrandt E, Gobel BM, 1994. Taxonomic note: a place forDNA–DNA reassociation and 16S rRNA sequence analysis inthe present species definition in bacteriology. InternationalJournal of Systematic Bacteriology 44: 846–849.
Swart L, Crous PW, Petrini O, Taylor JE, 2000. Fungal endophytesof Proteaceae, with particular emphasis on Botryosphaeriaproteae. Mycoscience 41: 123–127.
Swofford DL, 2002. PAUP*: Phylogenetic analysis using parsimony(*and other methods) Version 4.0b10. Sinauer Associates,Sunderland, MA.
Taylor JW, Jacobson DJ, Kroken S, Kasuga T, Geiser DM, Hibbett DS,Fisher MC, 2000. Phylogenetic species recognition and speciesconcepts in fungi. Fungal Genetics and Biology 31: 21–32.
Vandenkoornhuyse P, Baldauf SL, Leyval C, Straczek J,Young JPW, 2002. Extensive fungal diversity in plant roots.Science 295: 2051.
Vilgalys R, 2003. Taxonomic misidentification in public DNAdatabases. New Phytologist 160: 4–5.
d evolutionary origins of fungi associated with seeds of a neo-nmental samples, Mycological Research (2009), doi:10.1016/