district report card for 2013-2014 school year
TRANSCRIPT
Form #05-14-039 District Report Card Template 2013-2014 Alaska Department of Education & Early Development Page 1
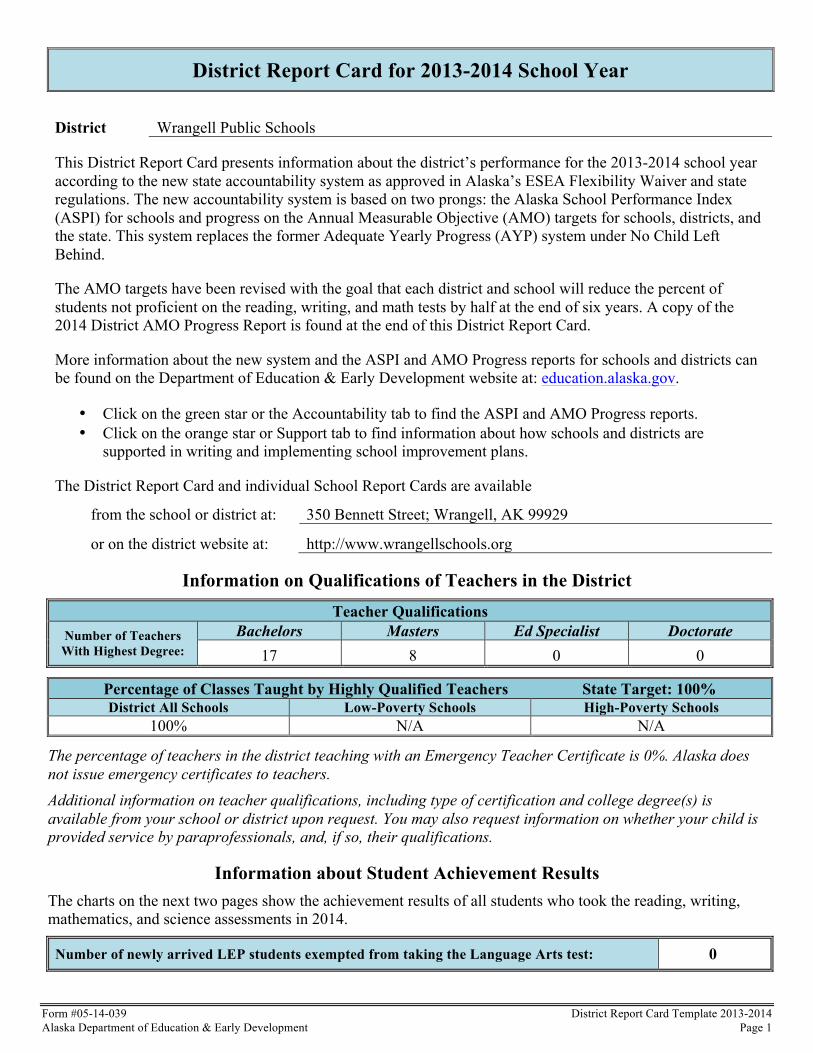
District Report Card for 2013-2014 School Year
District Wrangell Public Schools
This District Report Card presents information about the district’s performance for the 2013-2014 school year according to the new state accountability system as approved in Alaska’s ESEA Flexibility Waiver and state regulations. The new accountability system is based on two prongs: the Alaska School Performance Index (ASPI) for schools and progress on the Annual Measurable Objective (AMO) targets for schools, districts, and the state. This system replaces the former Adequate Yearly Progress (AYP) system under No Child Left Behind.
The AMO targets have been revised with the goal that each district and school will reduce the percent of students not proficient on the reading, writing, and math tests by half at the end of six years. A copy of the 2014 District AMO Progress Report is found at the end of this District Report Card.
More information about the new system and the ASPI and AMO Progress reports for schools and districts can be found on the Department of Education & Early Development website at: education.alaska.gov.
• Click on the green star or the Accountability tab to find the ASPI and AMO Progress reports. • Click on the orange star or Support tab to find information about how schools and districts are
supported in writing and implementing school improvement plans.
The District Report Card and individual School Report Cards are available
from the school or district at: 350 Bennett Street; Wrangell, AK 99929
or on the district website at: http://www.wrangellschools.org
Information on Qualifications of Teachers in the District Teacher Qualifications
Number of Teachers With Highest Degree:
Bachelors Masters Ed Specialist Doctorate 17 8 0 0
Percentage of Classes Taught by Highly Qualified Teachers State Target: 100% District All Schools Low-Poverty Schools High-Poverty Schools
100% N/A N/A
The percentage of teachers in the district teaching with an Emergency Teacher Certificate is 0%. Alaska does not issue emergency certificates to teachers. Additional information on teacher qualifications, including type of certification and college degree(s) is available from your school or district upon request. You may also request information on whether your child is provided service by paraprofessionals, and, if so, their qualifications.
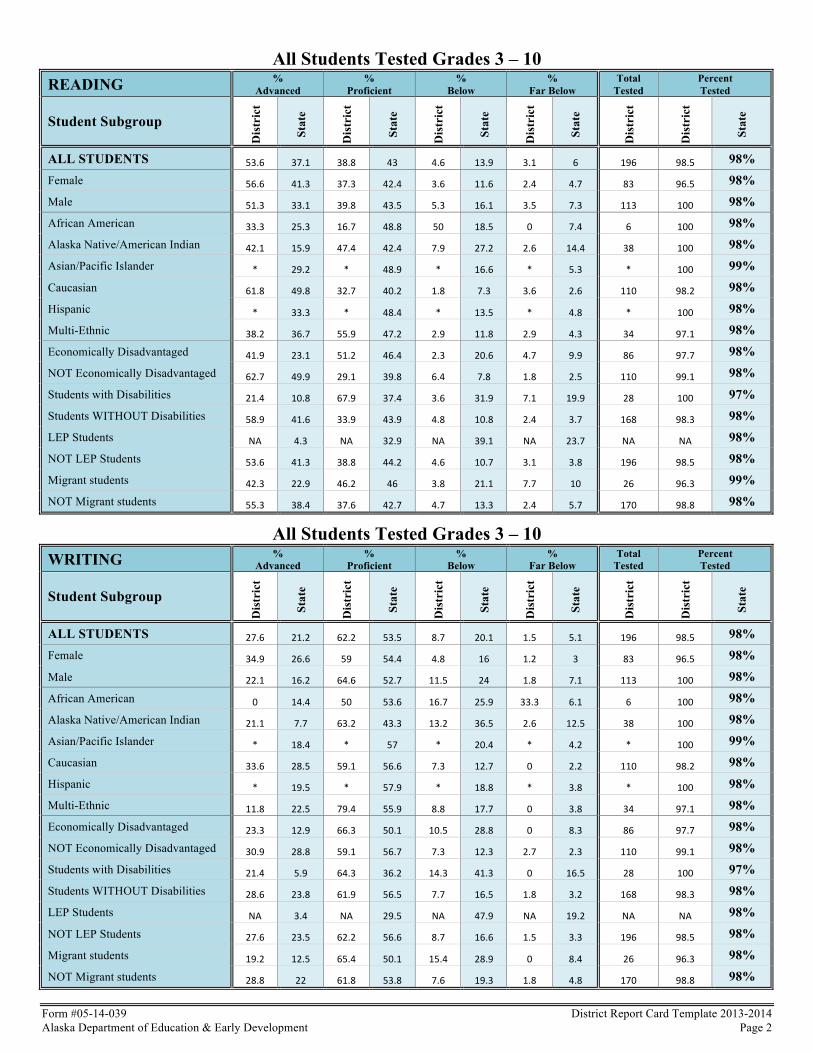
Information about Student Achievement Results The charts on the next two pages show the achievement results of all students who took the reading, writing, mathematics, and science assessments in 2014.
Number of newly arrived LEP students exempted from taking the Language Arts test: 0
Form #05-14-039 District Report Card Template 2013-2014 Alaska Department of Education & Early Development Page 2
All Students Tested Grades 3 – 10 READING %
Advanced %
Proficient %
Below %
Far Below Total
Tested Percent Tested
Student Subgroup
Dis
tric
t
Stat
e
Dis
tric
t
Stat
e
Dis
tric
t
Stat
e
Dis
tric
t
Stat
e
Dis
tric
t
Dis
tric
t
Stat
e
ALL STUDENTS 53.6 37.1 38.8 43 4.6 13.9 3.1 6 196 98.5 98% Female 56.6 41.3 37.3 42.4 3.6 11.6 2.4 4.7 83 96.5 98% Male 51.3 33.1 39.8 43.5 5.3 16.1 3.5 7.3 113 100 98% African American 33.3 25.3 16.7 48.8 50 18.5 0 7.4 6 100 98% Alaska Native/American Indian 42.1 15.9 47.4 42.4 7.9 27.2 2.6 14.4 38 100 98% Asian/Pacific Islander * 29.2 * 48.9 * 16.6 * 5.3 * 100 99% Caucasian 61.8 49.8 32.7 40.2 1.8 7.3 3.6 2.6 110 98.2 98% Hispanic * 33.3 * 48.4 * 13.5 * 4.8 * 100 98% Multi-Ethnic 38.2 36.7 55.9 47.2 2.9 11.8 2.9 4.3 34 97.1 98% Economically Disadvantaged 41.9 23.1 51.2 46.4 2.3 20.6 4.7 9.9 86 97.7 98% NOT Economically Disadvantaged 62.7 49.9 29.1 39.8 6.4 7.8 1.8 2.5 110 99.1 98% Students with Disabilities 21.4 10.8 67.9 37.4 3.6 31.9 7.1 19.9 28 100 97% Students WITHOUT Disabilities 58.9 41.6 33.9 43.9 4.8 10.8 2.4 3.7 168 98.3 98% LEP Students NA 4.3 NA 32.9 NA 39.1 NA 23.7 NA NA 98% NOT LEP Students 53.6 41.3 38.8 44.2 4.6 10.7 3.1 3.8 196 98.5 98% Migrant students 42.3 22.9 46.2 46 3.8 21.1 7.7 10 26 96.3 99% NOT Migrant students 55.3 38.4 37.6 42.7 4.7 13.3 2.4 5.7 170 98.8 98%
All Students Tested Grades 3 – 10 WRITING %
Advanced %
Proficient %
Below %
Far Below Total
Tested Percent Tested
Student Subgroup
Dis
tric
t
Stat
e
Dis
tric
t
Stat
e
Dis
tric
t
Stat
e
Dis
tric
t
Stat
e
Dis
tric
t
Dis
tric
t
Stat
e
ALL STUDENTS 27.6 21.2 62.2 53.5 8.7 20.1 1.5 5.1 196 98.5 98% Female 34.9 26.6 59 54.4 4.8 16 1.2 3 83 96.5 98% Male 22.1 16.2 64.6 52.7 11.5 24 1.8 7.1 113 100 98% African American 0 14.4 50 53.6 16.7 25.9 33.3 6.1 6 100 98% Alaska Native/American Indian 21.1 7.7 63.2 43.3 13.2 36.5 2.6 12.5 38 100 98% Asian/Pacific Islander * 18.4 * 57 * 20.4 * 4.2 * 100 99% Caucasian 33.6 28.5 59.1 56.6 7.3 12.7 0 2.2 110 98.2 98% Hispanic * 19.5 * 57.9 * 18.8 * 3.8 * 100 98% Multi-Ethnic 11.8 22.5 79.4 55.9 8.8 17.7 0 3.8 34 97.1 98% Economically Disadvantaged 23.3 12.9 66.3 50.1 10.5 28.8 0 8.3 86 97.7 98% NOT Economically Disadvantaged 30.9 28.8 59.1 56.7 7.3 12.3 2.7 2.3 110 99.1 98% Students with Disabilities 21.4 5.9 64.3 36.2 14.3 41.3 0 16.5 28 100 97% Students WITHOUT Disabilities 28.6 23.8 61.9 56.5 7.7 16.5 1.8 3.2 168 98.3 98% LEP Students NA 3.4 NA 29.5 NA 47.9 NA 19.2 NA NA 98% NOT LEP Students 27.6 23.5 62.2 56.6 8.7 16.6 1.5 3.3 196 98.5 98% Migrant students 19.2 12.5 65.4 50.1 15.4 28.9 0 8.4 26 96.3 98% NOT Migrant students 28.8 22 61.8 53.8 7.6 19.3 1.8 4.8 170 98.8 98%

Form #05-14-039 District Report Card Template 2013-2014 Alaska Department of Education & Early Development Page 3
All Students Tested Grades 3 – 10 MATHEMATICS %
Advanced %
Proficient %
Below %
Far Below Total
Tested Percent Tested
Student Subgroup
Dis
tric
t
Stat
e
Dis
tric
t
Stat
e
Dis
tric
t
Stat
e
Dis
tric
t
Stat
e
Dis
tric
t
Dis
tric
t
Stat
e
ALL STUDENTS 46.2 32.7 38.5 35.7 7.7 16.1 7.7 15.5 195 98 98% Female 45.1 32.7 41.5 37.3 7.3 15.7 6.1 14.2 82 95.3 98% Male 46.9 32.6 36.3 34.3 8 16.5 8.8 16.7 113 100 98% African American 0 18.6 33.3 35.4 16.7 22.2 50 23.7 6 100 98% Alaska Native/American Indian 39.5 15.7 44.7 31.9 13.2 22 2.6 30.4 38 100 98% Asian/Pacific Islander * 29.4 * 38.6 * 17.3 * 14.7 * 100 99% Caucasian 51.4 42.9 33 36.2 7.3 12.4 8.3 8.5 109 97.3 98% Hispanic * 27.1 * 39.2 * 18.2 * 15.5 * 100 98% Multi-Ethnic 41.2 32.8 52.9 37.8 0 16.3 5.9 13.1 34 97.1 98% Economically Disadvantaged 41.9 20.6 44.2 35.6 7 20.5 7 23.3 86 97.7 98% NOT Economically Disadvantaged 49.5 43.7 33.9 35.9 8.3 12.1 8.3 8.3 109 98.2 98% Students with Disabilities 14.3 10.3 60.7 25.4 14.3 23.6 10.7 40.7 28 100 97% Students WITHOUT Disabilities 51.5 36.5 34.7 37.5 6.6 14.8 7.2 11.2 167 97.7 98% LEP Students NA 6.1 NA 24.6 NA 24.4 NA 45 NA NA 98% NOT LEP Students 46.2 36.1 38.5 37.2 7.7 15 7.7 11.7 195 98 98% Migrant students 34.6 23 53.8 36.9 7.7 18.7 3.8 21.4 26 96.3 98% NOT Migrant students 47.9 33.6 36.1 35.6 7.7 15.9 8.3 14.9 169 98.3 98%
All Students Tested Grades 4, 8, & 10 SCIENCE %
Advanced %
Proficient %
Below %
Far Below Total
Tested Percent Tested
Student Subgroup
Dis
tric
t
Stat
e
Dis
tric
t
Stat
e
Dis
tric
t
Stat
e
Dis
tric
t
Stat
e
Dis
tric
t
Dis
tric
t
Stat
e
ALL STUDENTS 27.1 23.3 51.4 34.2 12.9 24.5 8.6 18 70 98.6 95% Female 25.8 21.1 58.1 35.3 6.5 26 9.7 17.7 31 96.9 95% Male 28.2 25.4 46.2 33.2 17.9 23 7.7 18.4 39 100 95% African American * 9.5 * 28.8 * 33.7 * 28 * 100 97% Alaska Native/American Indian 16.7 8.8 61.1 25 11.1 29.2 11.1 37 18 100 95% Asian/Pacific Islander * 14.6 * 30.3 * 31.5 * 23.7 * 100 97% Caucasian 31.4 33.6 54.3 38.8 5.7 19.4 8.6 8.2 35 97.2 94% Hispanic * 18 * 35.6 * 29 * 17.4 * 100 96% Multi-Ethnic 33.3 21.7 33.3 37.7 33.3 26.5 0 14.2 9 100 96% Economically Disadvantaged 27.3 11.8 57.6 29 12.1 30.4 3 28.7 33 100 95% NOT Economically Disadvantaged 27 33.3 45.9 38.7 13.5 19.3 13.5 8.7 37 97.4 95% Students with Disabilities 36.4 6.5 36.4 18.2 9.1 31.1 18.2 44.2 11 100 94% Students WITHOUT Disabilities 25.4 26 54.2 36.8 13.6 23.4 6.8 13.8 59 98.3 95% LEP Students NA 1.1 NA 8.4 NA 28.8 NA 61.7 NA NA 96% NOT LEP Students 27.1 26 51.4 37.3 12.9 23.9 8.6 12.7 70 98.6 95% Migrant students 16.7 12.5 66.7 29.9 16.7 30.2 0 27.4 6 100 96% NOT Migrant students 28.1 24.3 50 34.6 12.5 24 9.4 17.2 64 98.5 95%

Form #05-14-039 District Report Card Template 2013-2014 Alaska Department of Education & Early Development Page 4
Two-Year Trend for District Students Scoring Proficient or Above by Grade Level
0 20 40 60 80 100
3rd
4th
5th
6th
7th
8th
9th
10th
% Proficient
Grade
Level
READING ASSESSMENTS
Reading 13-‐14 Reading 12-‐13
0 20 40 60 80 100
3rd
4th
5th
6th
7th
8th
9th
10th
% Proficient
Grade
Level
WRITING ASSESSMENTS
Wri<ng 13-‐14 Wri<ng 12-‐13
0 20 40 60 80 100
3rd
4th
5th
6th
7th
8th
9th
10th
% Proficient
Grade
Level
MATHEMATICS ASSESSMENTS
Math 13-‐14 Math 12-‐13
0 20 40 60 80 100
4th
8th
10th
% Proficient
Grade
Level
SCIENCE ASSESSMENTS
Science 13-‐14 Science 12-‐13

Form #05-14-039 District Report Card Template 2013-2014 Alaska Department of Education & Early Development Page 5
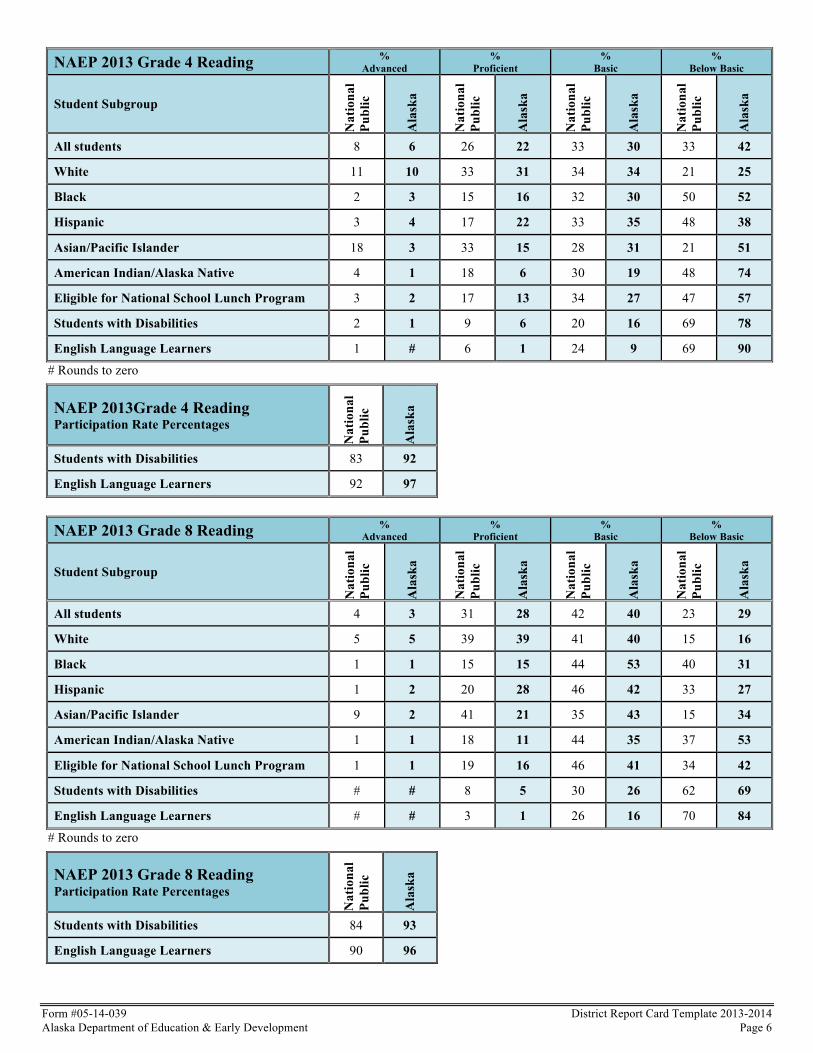
National Assessment of Education Progress (NAEP)
The National Assessment of Educational Progress (NAEP) is the only national test of what students know and can do. The No Child Left Behind Act of 2001 mandated state participation in NAEP reading and mathematics assessments in grades 4 and 8 every other year so that NAEP could serve as the common measure of student achievement.
NAEP does not test each fourth or eighth grader in the state. A representative sample of schools is chosen to participate in the NAEP. No NAEP individual results are given for students or schools; only statewide results are reported. NAEP scores can be used to compare Alaska to the nation and to other states.
NAEP assessments are designed to assess NAEP standards, also known as NAEP frameworks. NAEP does not assess students on the Alaska reading or mathematics standards. Alaska Standards Based Assessments (SBAs) are designed to assess Alaska reading and math standards, and SBAs are administered to all students. More information about the NAEP in Alaska can be found in http://education.alaska.gov/tls/assessment/naep.html.
There are three achievement levels for each grade assessed by NAEP: Basic, Proficient, and Advanced. Proficient on the NAEP indicates students “have demonstrated competency over challenging subject matter.” The following definitions apply to all subjects and all grades assessed by NAEP:
Achievement-Level Policy Definitions
Basic Partial mastery of prerequisite knowledge and skills that are fundamental for proficient work at each grade. Students who do not reach this level of proficiency are reported as Below Basic.
Proficient Solid academic performance for each grade assessed. Students reaching this level have demonstrated competency over challenging subject matter, including subject-matter knowledge, application of such knowledge to real-world situations, and analytical skills appropriate to the subject matter.
Advanced Superior performance.
The charts on the following pages show how Alaska students’ scores on the NAEP assessments compared to the public school students’ scores nationally.
Note: The most current NAEP data available at the time of this report is from 2013. NAEP will be given again in spring 2015. NAEP data is available on the Department of Education & Early Development website at: http://education.alaska.gov/tls/assessment/naep.html.
Form #05-14-039 District Report Card Template 2013-2014 Alaska Department of Education & Early Development Page 6
NAEP 2013 Grade 4 Reading % Advanced
% Proficient
% Basic
% Below Basic
Student Subgroup
Nat
iona
l Pu
blic
Ala
ska
Nat
iona
l Pu
blic
Ala
ska
Nat
iona
l Pu
blic
Ala
ska
Nat
iona
l Pu
blic
Ala
ska
All students 8 6 26 22 33 30 33 42
White 11 10 33 31 34 34 21 25
Black 2 3 15 16 32 30 50 52
Hispanic 3 4 17 22 33 35 48 38
Asian/Pacific Islander 18 3 33 15 28 31 21 51
American Indian/Alaska Native 4 1 18 6 30 19 48 74
Eligible for National School Lunch Program 3 2 17 13 34 27 47 57
Students with Disabilities 2 1 9 6 20 16 69 78
English Language Learners 1 # 6 1 24 9 69 90
# Rounds to zero
NAEP 2013Grade 4 Reading Participation Rate Percentages
Nat
iona
l Pu
blic
Ala
ska
Students with Disabilities 83 92
English Language Learners 92 97
NAEP 2013 Grade 8 Reading %
Advanced %
Proficient %
Basic %
Below Basic
Student Subgroup
Nat
iona
l Pu
blic
Ala
ska
Nat
iona
l Pu
blic
Ala
ska
Nat
iona
l Pu
blic
Ala
ska
Nat
iona
l Pu
blic
Ala
ska
All students 4 3 31 28 42 40 23 29
White 5 5 39 39 41 40 15 16
Black 1 1 15 15 44 53 40 31
Hispanic 1 2 20 28 46 42 33 27
Asian/Pacific Islander 9 2 41 21 35 43 15 34
American Indian/Alaska Native 1 1 18 11 44 35 37 53
Eligible for National School Lunch Program 1 1 19 16 46 41 34 42
Students with Disabilities # # 8 5 30 26 62 69
English Language Learners # # 3 1 26 16 70 84
# Rounds to zero
NAEP 2013 Grade 8 Reading Participation Rate Percentages
Nat
iona
l Pu
blic
Ala
ska
Students with Disabilities 84 93
English Language Learners 90 96

Form #05-14-039 District Report Card Template 2013-2014 Alaska Department of Education & Early Development Page 7
NAEP 2013 Grade 4 Math % Advanced
% Proficient
% Basic
% Below Basic
Student Subgroup
Nat
iona
l Pu
blic
Ala
ska
Nat
iona
l Pu
blic
Ala
ska
Nat
iona
l Pu
blic
Ala
ska
Nat
iona
l Pu
blic
Ala
ska
All students 8 6 34 30 41 40 18 23
White 10 11 43 41 37 38 9 10
Black 1 2 17 20 48 50 34 28
Hispanic 2 3 24 30 47 44 27 23
Asian/Pacific Islander 23 4 41 28 27 43 9 25
American Indian/Alaska Native 2 1 22 12 46 37 30 50
Eligible for National School Lunch Program 2 2 23 20 47 43 27 35
Students with Disabilities 2 1 16 13 38 36 45 50
English Language Learners 1 # 13 8 45 27 41 65
# Rounds to zero
NAEP 2013 Grade 4 Math Participation Rate Percentages
Nat
iona
l Pu
blic
Ala
ska
Students with Disabilities 90 94
English Language Learners 96 98
NAEP 2013 Grade 8 Math %
Advanced %
Proficient %
Basic %
Below Basic
Student Subgroup
Nat
iona
l Pu
blic
Ala
ska
Nat
iona
l Pu
blic
Ala
ska
Nat
iona
l Pu
blic
Ala
ska
Nat
iona
l Pu
blic
Ala
ska
All students 8 7 26 26 39 39 27 28
White 11 11 33 35 39 39 17 15
Black 2 4 12 17 38 38 49 42
Hispanic 3 4 18 20 41 46 38 30
Asian/Pacific Islander 25 3 34 21 27 42 13 34
American Indian/Alaska Native 3 2 18 13 38 35 40 49
Eligible for National School Lunch Program 3 2 17 17 41 38 39 43
Students with Disabilities 1 1 7 6 26 27 66 66
English Language Learners 1 # 4 2 25 21 69 78
# Rounds to zero
NAEP 2013 Grade 8 Math Participation Rate Percentages
Nat
iona
l Pu
blic
Ala
ska
Students with Disabilities 89 93
English Language Learners 93 98

Form #05-14-039 District Report Card Template 2013-2014 Alaska Department of Education & Early Development Page 8