[dissertation title: centered, brief, single spaced cap
TRANSCRIPT

[Dissertation Title: Centered, brief, single spaced – cap the first letter of each word - the
title must match the title found on the signature page]
A Dissertation submitted
to the Graduate School
Valdosta State University
in partial fulfillment of requirements
for the degree of
DOCTOR OF PUBLIC ADMINISTRATION
in Public Administration
in the Department of Political Science
of the College of Arts and Sciences
[Month YEAR]
[NAME]
[Previous Degrees begin with most recent on top]
[e.g., MPA, Valdosta State University, 2010]

© Copyright [YEAR] [Name]
All Rights Reserved

This dissertation, “[Dissertation Title],” by [Full Name], is approved by:
Dissertation Committee [Name, Degree (see sample below)]
Chair [Rank of Field]
Committee
Members [Name, Degree]
[Rank of Field]
[Name, Degree]
[Rank of Field]
Associate Provost for Graduate Studies and Research
Becky K. da Cruz, Ph.D., J.D. Professor of Criminal Justice

FAIR USE
This dissertation is protected by the Copyright Laws of the United States (Public Law 94-
553, revised in 1976). Consistent with fair use as defined in the Copyright Laws, brief
quotations from this material are allowed with proper acknowledgement. Use of the
material for financial gain without the author’s expressed written permission is not
allowed.
DUPLICATION
I authorize the Head of Interlibrary Loan or the Head of Archives at the Odum Library at
Valdosta State University to arrange for duplication of this dissertation for educational or
scholarly purposes when so requested by a library user. The duplication shall be at the
user’s expense.
Signature
I refuse permission for this dissertation to be duplicated in whole or in part.
Signature

i
ABSTRACT
[NOTE: The abstract should tell the reader your topic, research methods, and
major findings. The abstract is double-spaced and should not exceed one page in length.
The most common length is approximately 350 words. Begin Roman numeral page
numbering with this page.]
ii
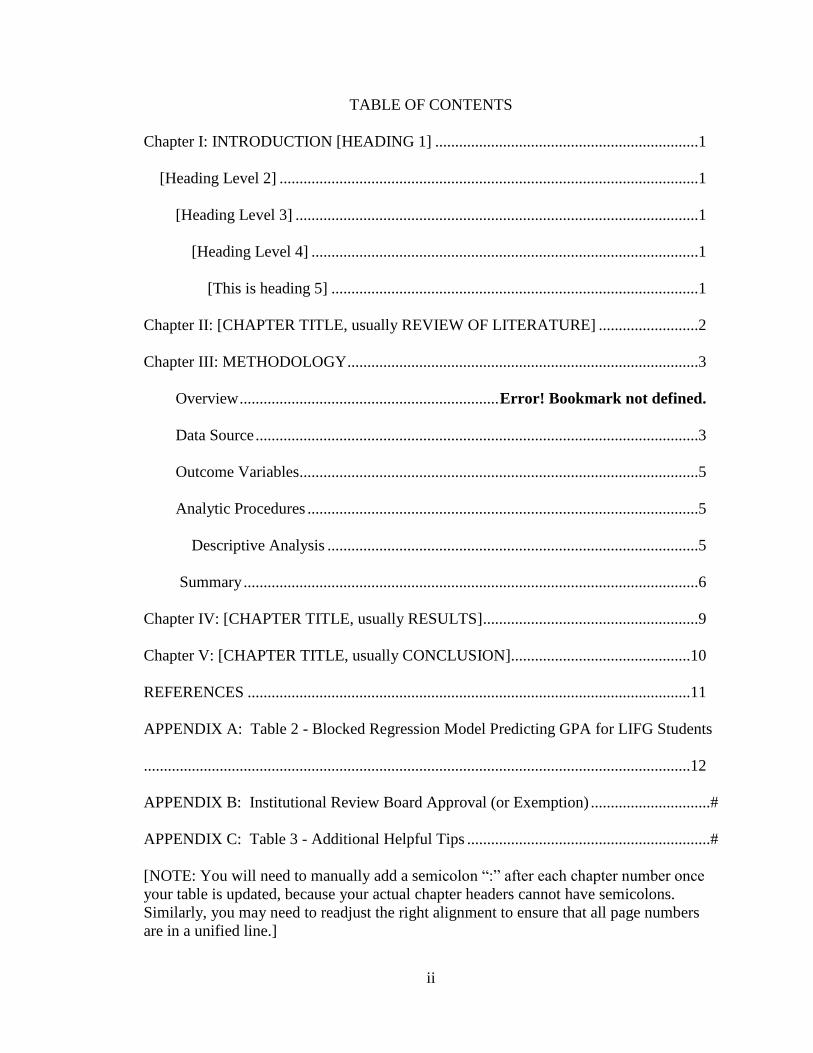
TABLE OF CONTENTS
Chapter I: INTRODUCTION [HEADING 1] ..................................................................1
[Heading Level 2] .........................................................................................................1
[Heading Level 3] .....................................................................................................1
[Heading Level 4] .................................................................................................1
[This is heading 5] ............................................................................................1
Chapter II: [CHAPTER TITLE, usually REVIEW OF LITERATURE] .........................2
Chapter III: METHODOLOGY ........................................................................................3
Overview ................................................................. Error! Bookmark not defined.
Data Source ...............................................................................................................3
Outcome Variables....................................................................................................5
Analytic Procedures ..................................................................................................5
Descriptive Analysis .............................................................................................5
Summary ..................................................................................................................6
Chapter IV: [CHAPTER TITLE, usually RESULTS] ......................................................9
Chapter V: [CHAPTER TITLE, usually CONCLUSION].............................................10
REFERENCES ...............................................................................................................11
APPENDIX A: Table 2 - Blocked Regression Model Predicting GPA for LIFG Students
.........................................................................................................................................12
APPENDIX B: Institutional Review Board Approval (or Exemption) ..............................#
APPENDIX C: Table 3 - Additional Helpful Tips .............................................................#
[NOTE: You will need to manually add a semicolon “:” after each chapter number once
your table is updated, because your actual chapter headers cannot have semicolons.
Similarly, you may need to readjust the right alignment to ensure that all page numbers
are in a unified line.]
iii
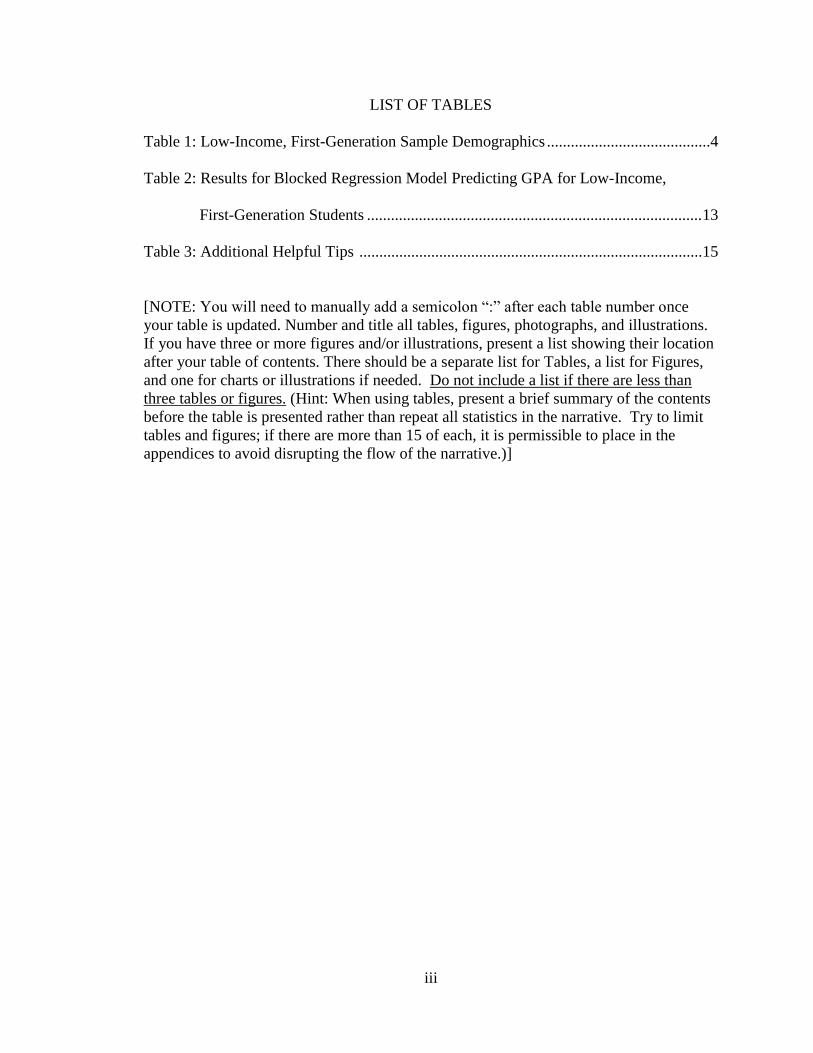
LIST OF TABLES
Table 1: Low-Income, First-Generation Sample Demographics .........................................4
Table 2: Results for Blocked Regression Model Predicting GPA for Low-Income,
First-Generation Students ....................................................................................13
Table 3: Additional Helpful Tips ......................................................................................15
[NOTE: You will need to manually add a semicolon “:” after each table number once
your table is updated. Number and title all tables, figures, photographs, and illustrations.
If you have three or more figures and/or illustrations, present a list showing their location
after your table of contents. There should be a separate list for Tables, a list for Figures,
and one for charts or illustrations if needed. Do not include a list if there are less than
three tables or figures. (Hint: When using tables, present a brief summary of the contents
before the table is presented rather than repeat all statistics in the narrative. Try to limit
tables and figures; if there are more than 15 of each, it is permissible to place in the
appendices to avoid disrupting the flow of the narrative.)]
iv
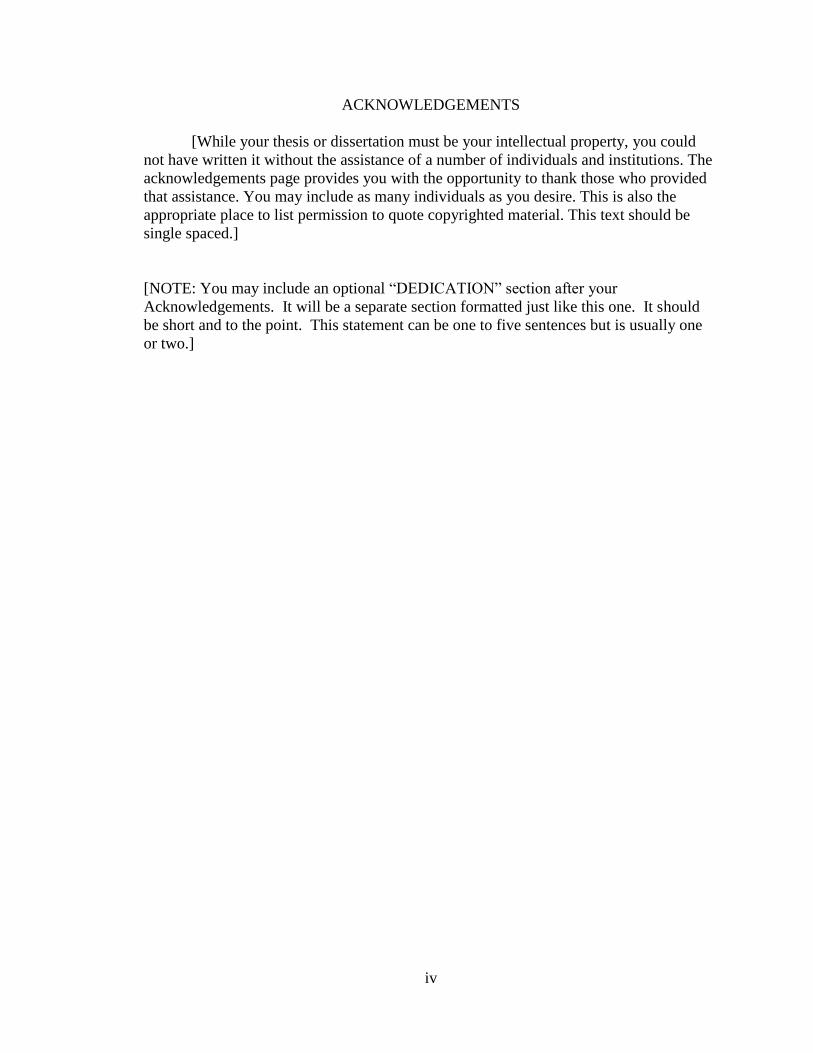
ACKNOWLEDGEMENTS
[While your thesis or dissertation must be your intellectual property, you could
not have written it without the assistance of a number of individuals and institutions. The
acknowledgements page provides you with the opportunity to thank those who provided
that assistance. You may include as many individuals as you desire. This is also the
appropriate place to list permission to quote copyrighted material. This text should be
single spaced.]
[NOTE: You may include an optional “DEDICATION” section after your
Acknowledgements. It will be a separate section formatted just like this one. It should
be short and to the point. This statement can be one to five sentences but is usually one
or two.]
1
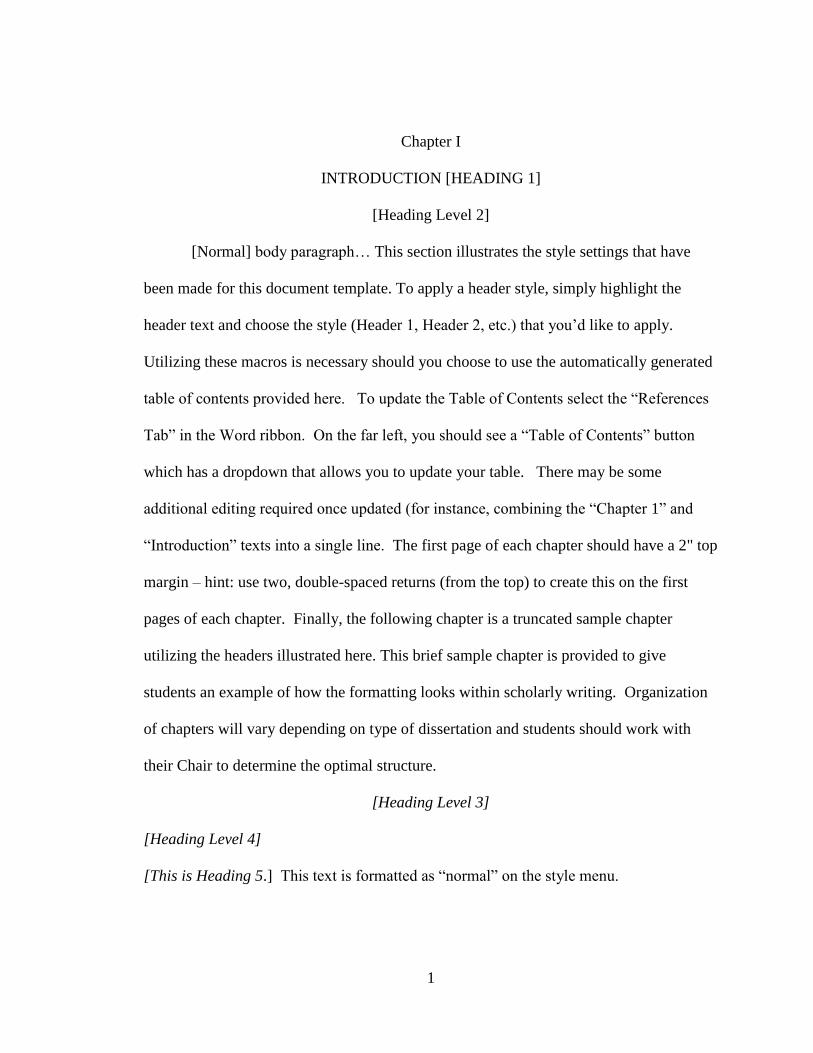
Chapter I
INTRODUCTION [HEADING 1]
[Heading Level 2]
[Normal] body paragraph… This section illustrates the style settings that have
been made for this document template. To apply a header style, simply highlight the
header text and choose the style (Header 1, Header 2, etc.) that you’d like to apply.
Utilizing these macros is necessary should you choose to use the automatically generated
table of contents provided here. To update the Table of Contents select the “References
Tab” in the Word ribbon. On the far left, you should see a “Table of Contents” button
which has a dropdown that allows you to update your table. There may be some
additional editing required once updated (for instance, combining the “Chapter 1” and
“Introduction” texts into a single line. The first page of each chapter should have a 2" top
margin – hint: use two, double-spaced returns (from the top) to create this on the first
pages of each chapter. Finally, the following chapter is a truncated sample chapter
utilizing the headers illustrated here. This brief sample chapter is provided to give
students an example of how the formatting looks within scholarly writing. Organization
of chapters will vary depending on type of dissertation and students should work with
their Chair to determine the optimal structure.
[Heading Level 3]
[Heading Level 4]
[This is Heading 5.] This text is formatted as “normal” on the style menu.

2
Chapter II
REVIEW OF LITERATURE
[Chapter contents: The second chapter of a dissertation is almost always a
Literature Review grounding the current study in extant literature with a critical
examination of how past research provides theoretical and conceptual framing for the
current study as well as any gaps the current study may fill.]

3
Chapter III
METHODOLOGY
Overview
[Sample text and table. Be sure to mention Institutional Review Board approval
or exemption in this chapter.] This chapter begins with a brief exploration of the broader
higher education context that increasing institutionalization of and research on service-
learning are situated within. Service-learning is then explored in detail along with the
research that has investigated the relationship between this pedagogy and student
outcomes. Next, literature on Low-Income, First-Generation (LIFG) students is used to
explicate the host of complex barriers these students commonly experience in their
academic journeys. A critical lens is then used to illustrate the gaps in literature that give
rise to persisting questions about the efficacy of service-learning as a pedagogical
strategy to increase LIFG student success. These questions are further refined and
undergirded with a theoretical and conceptual examination of service-learning for LIFG
students which provided the foundation for this study.
Data Source
Data used in this study is part of an ongoing mixed-methods study exploring the
outcomes and experiences related to participation in service-learning courses for low-
income, first-generation college students. This study utilizes national, longitudinal, data
from matched responses between the 2004 Freshman Survey (TFS) and 2008 College
Senior Survey (CSS), administered by the Higher Education Research Institute. TFS is
given to students within the first 2 weeks of their first year in higher education, and the
4
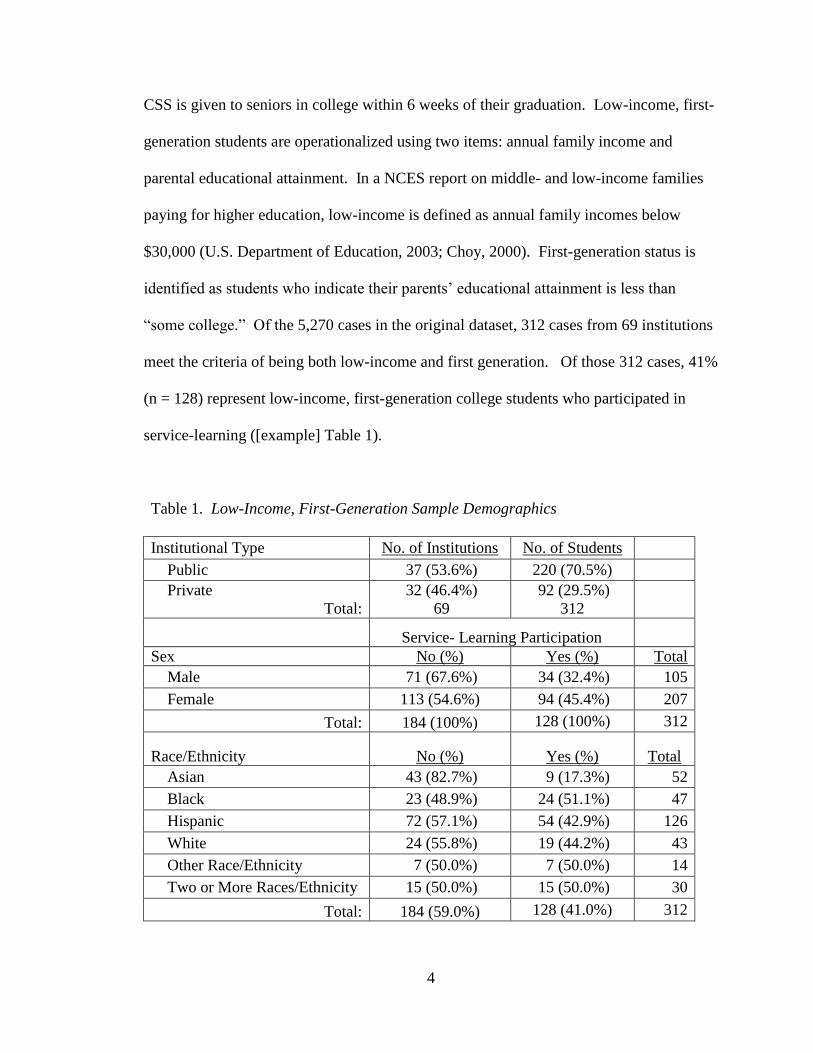
CSS is given to seniors in college within 6 weeks of their graduation. Low-income, first-
generation students are operationalized using two items: annual family income and
parental educational attainment. In a NCES report on middle- and low-income families
paying for higher education, low-income is defined as annual family incomes below
$30,000 (U.S. Department of Education, 2003; Choy, 2000). First-generation status is
identified as students who indicate their parents’ educational attainment is less than
“some college.” Of the 5,270 cases in the original dataset, 312 cases from 69 institutions
meet the criteria of being both low-income and first generation. Of those 312 cases, 41%
(n = 128) represent low-income, first-generation college students who participated in
service-learning ([example] Table 1).
Table 1. Low-Income, First-Generation Sample Demographics
Institutional Type No. of Institutions No. of Students
Public 37 (53.6%) 220 (70.5%)
Private
Total:
32 (46.4%)
69
92 (29.5%)
312
Service- Learning Participation
Sex No (%) Yes (%) Total
Male 71 (67.6%) 34 (32.4%) 105
Female 113 (54.6%) 94 (45.4%) 207
Total: 184 (100%) 128 (100%) 312
Race/Ethnicity No (%) Yes (%) Total
Asian 43 (82.7%) 9 (17.3%) 52
Black 23 (48.9%) 24 (51.1%) 47
Hispanic 72 (57.1%) 54 (42.9%) 126
White 24 (55.8%) 19 (44.2%) 43
Other Race/Ethnicity 7 (50.0%) 7 (50.0%) 14
Two or More Races/Ethnicity 15 (50.0%) 15 (50.0%) 30
Total: 184 (59.0%) 128 (41.0%) 312
5
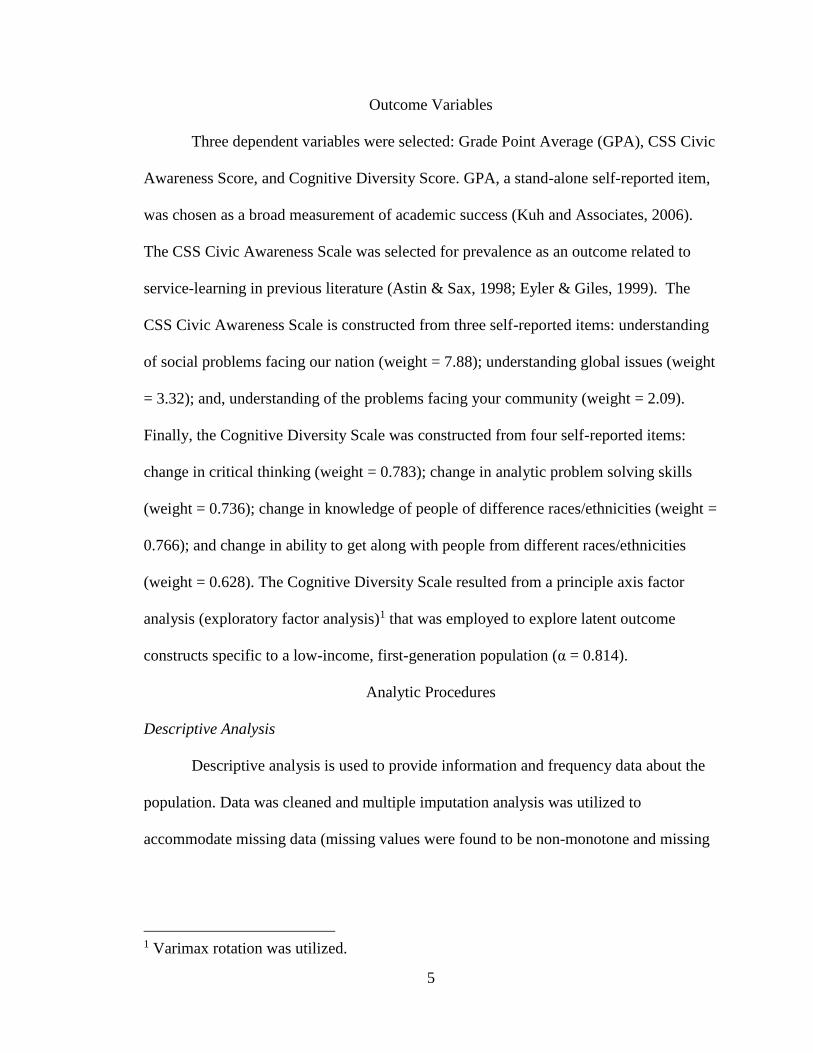
Outcome Variables
Three dependent variables were selected: Grade Point Average (GPA), CSS Civic
Awareness Score, and Cognitive Diversity Score. GPA, a stand-alone self-reported item,
was chosen as a broad measurement of academic success (Kuh and Associates, 2006).
The CSS Civic Awareness Scale was selected for prevalence as an outcome related to
service-learning in previous literature (Astin & Sax, 1998; Eyler & Giles, 1999). The
CSS Civic Awareness Scale is constructed from three self-reported items: understanding
of social problems facing our nation (weight = 7.88); understanding global issues (weight
= 3.32); and, understanding of the problems facing your community (weight = 2.09).
Finally, the Cognitive Diversity Scale was constructed from four self-reported items:
change in critical thinking (weight = 0.783); change in analytic problem solving skills
(weight = 0.736); change in knowledge of people of difference races/ethnicities (weight =
0.766); and change in ability to get along with people from different races/ethnicities
(weight = 0.628). The Cognitive Diversity Scale resulted from a principle axis factor
analysis (exploratory factor analysis)1 that was employed to explore latent outcome
constructs specific to a low-income, first-generation population (α = 0.814).
Analytic Procedures
Descriptive Analysis
Descriptive analysis is used to provide information and frequency data about the
population. Data was cleaned and multiple imputation analysis was utilized to
accommodate missing data (missing values were found to be non-monotone and missing
1 Varimax rotation was utilized.

6
completely at random; 9.7% of cases were missing values for the annual parental income,
all other variables were missing less than 4% of values).
Regression Analysis
Ordinary Least Squares (OLS) blocked regression analysis is then utilized to
examine the direction and significance of the relationship that participation in service-
learning courses has with explored outcomes. Blocked regression was chose for its ability
to parse independent variables such as student demographics, such as race/ethnicity, and
student pre-college experiences, such as attending a High School that required
community service.2 Blocking was organized using the theoretical and conceptual
frameworks previously discussed. For each of these analyses Q-Q plots, and Normal P-P
plots of model residuals were used to check that assumptions were met for the
appropriate use of this analysis. A full list of the variables utilized in this study can be
found in Table 2, Appendix A.
Summary
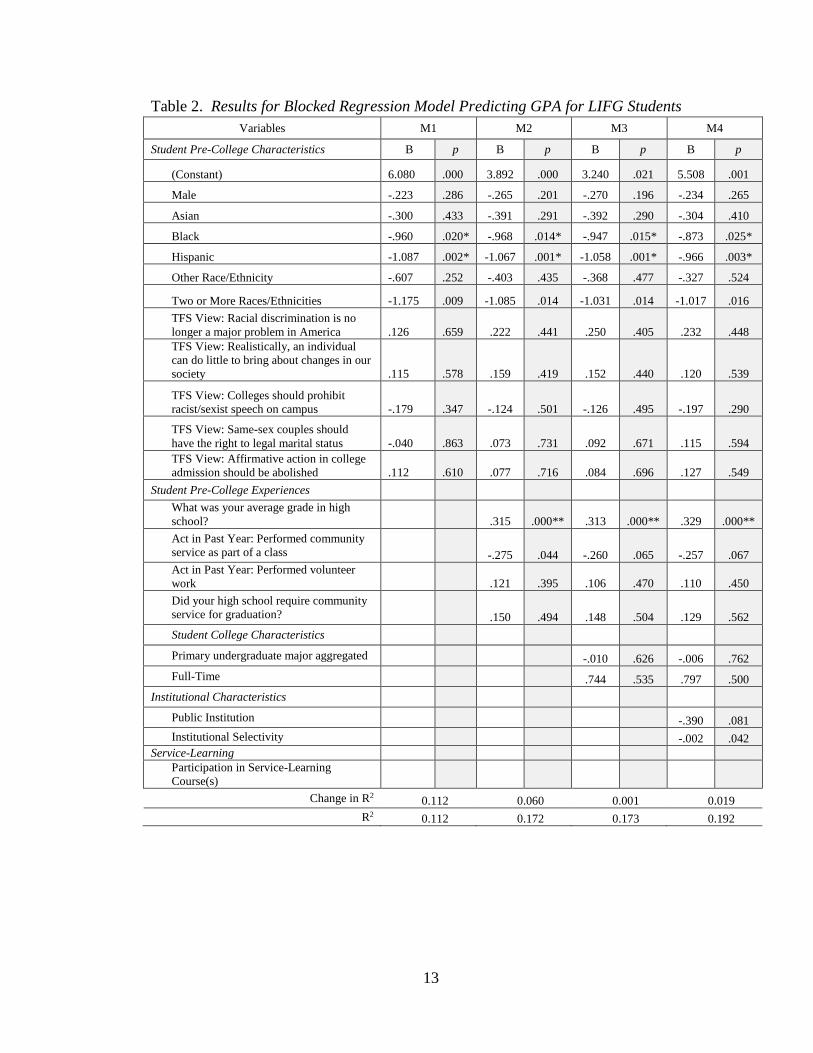
OLS blocked regression was conducted for each of the three outcome variables.
Of the three regression analyses, participation in service-learning is a statistically
significant predictor only for GPA. Table 2 (found in Appendix B) includes the results of
the regression predicting college GPA. As this table shows the participation in service-
learning courses has a positive (β = 0.528) relationship with college GPA. The full model
accounts for 23.2% of the variance in this variable. Because of the blocked nature of this
2 Hierarchical linear modeling was considered as a method to explore the impact of
institutional characteristics; however, due to the narrow specifications of this population
most institutional cell counts were too low to meet the assumptions required for this
analysis.
7
analysis, we see that service-learning, as a single item, increases the model’s overall R2
by 4.0%. It is also interesting to note that of the three outcomes, that college GPA,
though still a self-reported item, is a much less subject measurement. Whereas the other
outcomes ask students to perceive their skills and growth, this item asks students to report
a more objective figure. Consistent with other literature, students’ pre-college
characteristics account for that largest amount of variance in the model (11.2%) and
students’ high school GPA (β = 0.343) is also a significant positive predictor of college
GPA. Finally, it should also be noted that Hispanic (β = -0.928) and Black (β = -0.873)
race/ethnicity descriptors are both significant, negative, predictors of college GPA. This
finding indicates that even when financial (low-income) and cultural (first-generation)
capital are roughly held constant, there appears to be a systemic racial inequity in GPA
attainment for these subpopulations.
While not in the original conceptualization of the study, several ad hoc measures
were taken in response to the initial finding that service-learning is not a significant
predictor for CSS Civic Awareness Scores and Cognitive Diversity Scores. Regression
analyses were run on each of the individual survey items that make up the Cognitive
Diversity Scale. In each of these analyses service-learning was not a significant
predictor. This contrasts with prior research that indicates that service-learning increases
exposure to diversity and the cognitive development (Batchelder & Root, 1994; Eyler &
Giles, 1999; Osborne, Hammerich, Hensley, 1998). Since each of these items are self-
reported by college seniors just prior to graduation, this may simply be a limitation of the
data. Examination of these items shows that most students tend to rate themselves high
on each of these questions; concordantly, there is very little variation present, which

8
explains why almost no independent variables were significant predictors in either of the
regression models. College seniors’ perception that they have grown in critical thinking,
analytical problem solving, knowledge of and ability to get along with people from
different races/ethnicities while in college are an expected outcomes that virtually all
institutions of higher education strive for. Additionally, research indicates that students
may have difficulties self-assessing these subjective measures (Gonyea, 2005; Porter,
2011). Interestingly however, regression analyses of CSS Civic Awareness Scores and of
Cognitive Diversity Scores conducted for the larger overall sample of college students
results in models where service-learning is a very significant ( p < 0.001), positive,
predictor of both of these outcomes.

9
Chapter IV
RESULTS
[Chapter contents: The fourth chapter of a dissertation commonly focuses upon
the findings of the study. Tables and figures are typically used in this chapter, but do not
repeat contents in tables or figures in the narrative – simply summarize the material
before the table or figure is shown.]
10
Chapter V
CONCLUSION
[Chapter contents: The fifth chapter of a dissertation is almost always a
conclusion including a brief overview of the study, limitations, implications, and
recommendations for future research. A student can have more than five chapters as long
as the last chapter concludes the dissertation.]
11
REFERENCES
American Psychological Association (2001). Publication manual of the American
Psychological Association (5th ed.). Washington, DC: American Psychological
Association.
Cresswell, J. (2014). Research Design: Qualitative, Quantitative, and Mixed Methods
Approaches (4th ed.). Thousand Oaks, CA: Sage Publications.
[Note: For VSU Graduate School purposes, cap book titles in text and in references.]
12
APPENDIX A:
Table 2: Results for Blocked Regression Model Predicting GPA for
Low-Income, First-Generation Students
[NOTE: Supplemental material should be placed in appendices. Supplemental material
includes survey questions, permission letters/e-mails, detailed data (results), etc. You
need a separate appendix for each type of material presented. Some style manuals allow
you to place tables, figures, and other graphical representations in an appendix, rather
than dispersed throughout your text. Each appendix should have a cover page that
identifies it. Reference the cover sheet page number in the Table of Contents. Center the
title on the page. A copy of your IRB approval or exemption (if applicable) must be
included here. Be sure to mention the IRB in your “Methodology” chapter.]
13
Table 2. Results for Blocked Regression Model Predicting GPA for LIFG Students
Variables M1 M2 M3 M4
Student Pre-College Characteristics B p B p B p B p
(Constant) 6.080 .000 3.892 .000 3.240 .021 5.508 .001
Male -.223 .286 -.265 .201 -.270 .196 -.234 .265
Asian -.300 .433 -.391 .291 -.392 .290 -.304 .410
Black -.960 .020* -.968 .014* -.947 .015* -.873 .025*
Hispanic -1.087 .002* -1.067 .001* -1.058 .001* -.966 .003*
Other Race/Ethnicity -.607 .252 -.403 .435 -.368 .477 -.327 .524
Two or More Races/Ethnicities -1.175 .009 -1.085 .014 -1.031 .014 -1.017 .016
TFS View: Racial discrimination is no
longer a major problem in America .126 .659 .222 .441 .250 .405 .232 .448
TFS View: Realistically, an individual
can do little to bring about changes in our
society .115 .578 .159 .419 .152 .440 .120 .539
TFS View: Colleges should prohibit
racist/sexist speech on campus -.179 .347 -.124 .501 -.126 .495 -.197 .290
TFS View: Same-sex couples should
have the right to legal marital status -.040 .863 .073 .731 .092 .671 .115 .594
TFS View: Affirmative action in college
admission should be abolished .112 .610 .077 .716 .084 .696 .127 .549
Student Pre-College Experiences
What was your average grade in high
school? .315 .000** .313 .000** .329 .000**
Act in Past Year: Performed community
service as part of a class -.275 .044 -.260 .065 -.257 .067
Act in Past Year: Performed volunteer
work .121 .395 .106 .470 .110 .450
Did your high school require community
service for graduation? .150 .494 .148 .504 .129 .562
Student College Characteristics
Primary undergraduate major aggregated -.010 .626 -.006 .762
Full-Time .744 .535 .797 .500
Institutional Characteristics
Public Institution -.390 .081
Institutional Selectivity -.002 .042
Service-Learning
Participation in Service-Learning
Course(s)
Change in R2 0.112 0.060 0.001 0.019
R2 0.112 0.172 0.173 0.192

14
APPENDIX B:
Institutional Review Board Approval (or Exemption)
[Add a copy of the IRB after this page.]

15
APPENDIX C:
Table 3: Additional Helpful Tips
16
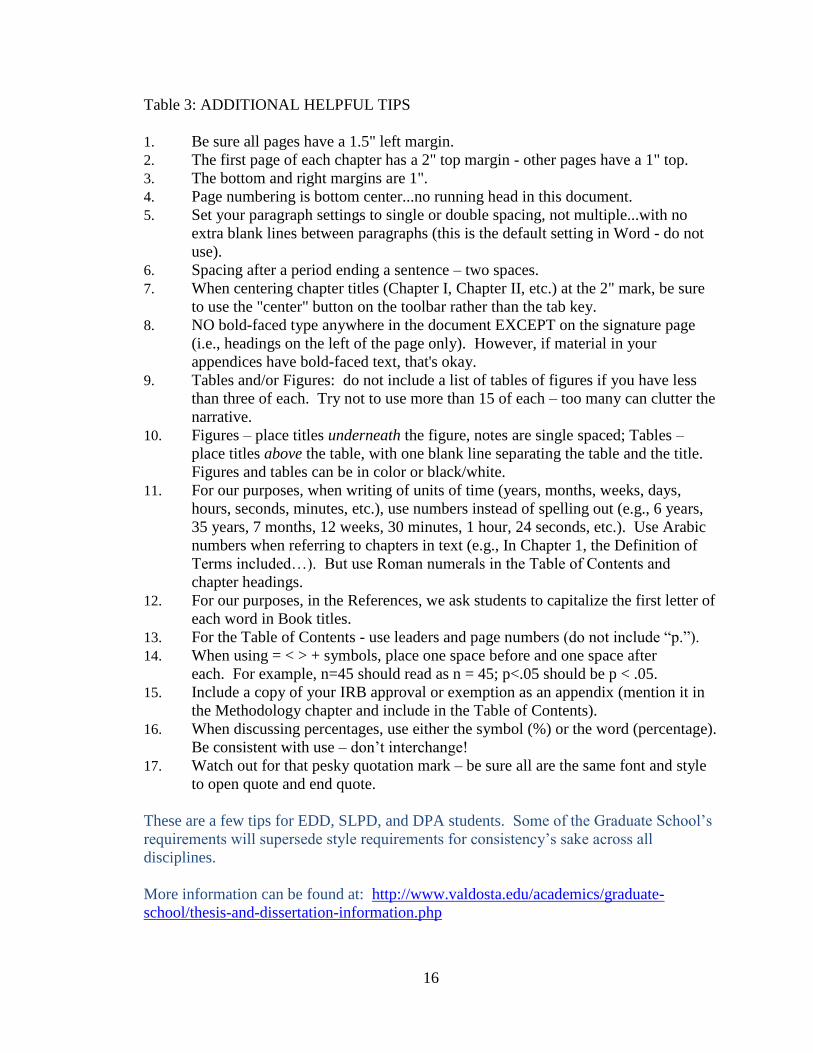
Table 3: ADDITIONAL HELPFUL TIPS
1. Be sure all pages have a 1.5" left margin.
2. The first page of each chapter has a 2" top margin - other pages have a 1" top.
3. The bottom and right margins are 1".
4. Page numbering is bottom center...no running head in this document.
5. Set your paragraph settings to single or double spacing, not multiple...with no
extra blank lines between paragraphs (this is the default setting in Word - do not
use).
6. Spacing after a period ending a sentence – two spaces.
7. When centering chapter titles (Chapter I, Chapter II, etc.) at the 2" mark, be sure
to use the "center" button on the toolbar rather than the tab key.
8. NO bold-faced type anywhere in the document EXCEPT on the signature page
(i.e., headings on the left of the page only). However, if material in your
appendices have bold-faced text, that's okay.
9. Tables and/or Figures: do not include a list of tables of figures if you have less
than three of each. Try not to use more than 15 of each – too many can clutter the
narrative.
10. Figures – place titles underneath the figure, notes are single spaced; Tables –
place titles above the table, with one blank line separating the table and the title.
Figures and tables can be in color or black/white.
11. For our purposes, when writing of units of time (years, months, weeks, days,
hours, seconds, minutes, etc.), use numbers instead of spelling out (e.g., 6 years,
35 years, 7 months, 12 weeks, 30 minutes, 1 hour, 24 seconds, etc.). Use Arabic
numbers when referring to chapters in text (e.g., In Chapter 1, the Definition of
Terms included…). But use Roman numerals in the Table of Contents and
chapter headings.
12. For our purposes, in the References, we ask students to capitalize the first letter of
each word in Book titles.
13. For the Table of Contents - use leaders and page numbers (do not include “p.”).
14. When using = < > + symbols, place one space before and one space after
each. For example, n=45 should read as n = 45; p<.05 should be p < .05.
15. Include a copy of your IRB approval or exemption as an appendix (mention it in
the Methodology chapter and include in the Table of Contents).
16. When discussing percentages, use either the symbol (%) or the word (percentage).
Be consistent with use – don’t interchange!
17. Watch out for that pesky quotation mark – be sure all are the same font and style
to open quote and end quote.
These are a few tips for EDD, SLPD, and DPA students. Some of the Graduate School’s
requirements will supersede style requirements for consistency’s sake across all
disciplines.
More information can be found at: http://www.valdosta.edu/academics/graduate-
school/thesis-and-dissertation-information.php