dissertation hong june 23 - rucore.libraries.rutgers.edu
TRANSCRIPT

ONE SIZE DOES NOT FIT ALL: THE RELATIONS BETWEEN SERVICE
CAPABILITIES AND HUMAN RESOURCE MANAGEMENT
By
YING HONG
A Dissertation submitted to the
Graduate School-New Brunswick
Rutgers, The State University of New Jersey
In partial fulfillment of the requirements
For the degree of
Doctor of Philosophy
Graduate Program in Industrial Relations and Human Resources
Written under the direction of
Hui Liao
And approved by
________________________________
________________________________
________________________________
________________________________ New Brunswick, New Jersey
October 2009

ii
ABSTRACT OF THE DISSERTATION
One Size Does Not Fit All: The Relations between Service Capabilities and
Human Resource Management
By YING HONG
Dissertation Director:
Hui Liao
Previous research in strategic human resource management (HRM) has
generally taken two approaches. The best practices perspective conveys a high
performance philosophy, while the contingency perspective based on generic
market positioning differentiates between high performance and low cost
philosophies. This paper is among the first to draw on the capability-based view
of strategic management to provide HRM with a more accurate anchor of strategic
capabilities. Under the current dynamic environment, the key to sustained
competitive advantages depends on the heterogeneous and inimitable capabilities
of organizations that are aligned with organizations’ strategic focus. The
heterogeneity in turn demands different HRM practices and strategic positions.
Using the hospitality industry, I conducted three studies using both quantitative
and qualitative approaches to examine the extent to which hotels in different
segments aligned their strategic foci, strategic capabilities, strategic positions, and
HRM systems and the subsequent impact on financial performance. Results
showed that there were different capabilities that predicted financial performance:

iii
hotels’ capability to provide tangibles to customers was a threshold capability for
all hotels, while the capability to provide service was a distinctive capability only
for luxury hotels. In addition, an alignment with the recommended HRM profiles
and an emphasis on the strategic positions were helpful for creating the needed
strategic capabilities. Implementing efficiency-oriented and reliability-oriented
HR and emphasizing back-of-the-house positions were critical to hotels that
focused on operational excellence and product leadership, while adopting
flexibility-oriented HR and valuing front-of-the-house positions were important
for hotels that excelled at customer intimacy. This has implication for future
strategic HRM research in that instead of advocating for more best practices, this
study suggests that identifying the right practices and strategic positions according
to needed capabilities is key.

iv
Acknowledgement and Dedication
I am most indebted to the continuous support that my dissertation chair, Dr.
Hui Liao, has offered me throughout the years of my research and in every aspect
of my doctoral study. I am very fortunate to have Hui as my advisor as she is
perhaps the best mentor and most prolific role model I could ever find. Her superb
intelligence and dedication constantly inspires me and influences my work. Her
invaluable advice guides me in every progress of my research, teaching and career
and will certainly continue so in the future.
I am deeply benefited by the opportunity to work with some of the greatest
minds in the field, Dr. Susan Jackson and Dr. Mark Huselid. Their seminal work
and insightful vision of the field deeply inspire me and influence my research
interest. Their constant advice and support are invaluable to this research.
I would like to express my most sincere gratitude to Dr. Michael Sturman and
the Center for Hospitality Research at the School of Hotel Administration at
Cornell University for providing vital resources and collecting quality data.
Special thanks should be addressed to the Joseph M. Juran Center for
Leadership in Quality at University of Minnesota for generously awarding the
Juran Dissertation Fellowship, which was critical to the success of this study.
I also thank Dr. David Lepak, Dr. Patrick McKay, Yuan Jiang, and many
other colleagues who provide priceless help at various point of my research. Last
but not the least, I value the support from my family and friends.

v
Table of Contents
Abstract ii Acknowledgement and Dedication iv Table of Contents v List of Tables vii List of Illustrations viii Introduction 1 Literature Review 8 Universalistic Approach 8
Contingency Perspective 9 Theory Development 11
Resources- and Capabilities-Based Views 11 Heterogeneous Strategic Capabilities (Hypothesis 1) 14 Focusing on the Service Strategies 15 Service Market Positioning Strategies 17 Articulating the Service Capabilities 18 Strategic Capabilities for Operational Excellence (Hypothesis 1a) 20 Strategic Capabilities for Product Leadership (Hypothesis 1b) 21 Strategic Capabilities for Customer Intimacy (Hypothesis 1c) 22 Configurations of Human Resource Management (Hypothesis 2) 25
Efficiency-Oriented HRM (Hypothesis 2a) 31 Reliability-oriented HRM (Hypothesis 2b) 34
Flexibility-Oriented HRM (Hypothesis 2c) 37 Differentiation on Strategic Positions (Hypothesis 3) 42
Pilot Study 1 46 Methods 48 Data Collection 48 Participants 49 Measures 49 Results 51
Discussion 53 Pilot Study 2 55 Methods 55 Results and Discussion 56 Study 3 61
Methods 61 Participants and Procedures 61 Measures 63 Analytic Strategies 71 Results 75

vi
Strategic Capabilities 76 Suggested HRM Profiles 79 Strategic Positions 82 Discussion 85 Research Implications 85 Practical Implications 91 Limitations 93 Conclusion 95 References 96 Tables and Figures 108 Appendix 1. Survey Questions 156 Appendix 2: Suggested Profiles of HRM 160 Curriculum Vita 161

vii
List of Tables
Table 1: Table 2: Table 3: Table 4: Table 5: Table 6: Table 7: Table 8: Table 9: Table 10: Table 11: Table 12: Table 13: Table 14: Table 15: Table 16: Table 17: Table 18:
Mobil Hotel Star Ratings from Mobiltravelguide.com Summary of Research Hypotheses Means, Standard Deviations, Correlations, and Reliabilities of Variables in Pilot Study I Pilot Study I - ANOVA of Different Service Quality Aspects among Star Hotels Pilot Study I - Meeting Customer Expectations on Service Quality in Predicting Satisfaction Pilot Study 2 - Qualitative Interviews with General Managers – Understanding Strategic Foci Pilot Study 2 - Qualitative Interviews with General Managers – Understanding Strategic Capabilities Pilot Study 2 - Qualitative Interviews – Understanding differentiation based on positions Pilot Study 2 - Qualitative Interviews – Understanding Human Resource Management Configurations Factor Analysis of Strategic Positions Ratings Means, Standard Deviations, Reliabilities, and Correlations of Variables Customer Evaluations of Capabilities in Predicting LogREVPAR Customer Evaluations of Capabilities in Predicting LogOccupancyRate Customer Evaluations of Capabilities in Predicting LogGOPPAR Suggested HR Profiles and Strategic Positions in Predicting Customer Evaluations of Value Suggested HR Profiles and Strategic Positions in Predicting Customer Evaluations of Tangibles Suggested HR Profiles and Strategic Positions in Predicting Customer Evaluations of Service Summary of Structural Models
108110111 112 113 114 115 116 118 122123 125 128 129 130 136 140 148

viii
List of Illustrations Figure 1: Figure 2: Figure 3: Figure 4: Figure 5: Figure 6: Figure 7: Figure 8: Figure 9: Figure 10: Figure 11: Figure 12: Figure 13: Figure 14: Figure 15: Figure 16: Figure 17: Figure 18: Figure 19: Figure 20: Figure 21: Figure 22:
Overview of Research Model Service * Hotel Stars Interaction Tangibles * Hotel Stars Interaction HR Efficiency * Hotel Stars Interaction Predicting Value HR Reliability * Hotel Stars Interaction Predicting Value Back Operations * Hotel Stars Interaction Predicting Value Call Center * Hotel Stars Interaction Predicting Value Back Operations * Hotel Stars Interaction Predicting Tangibles Call Center * Hotel Stars Interaction Predicting Tangibles HR Flexibility * Hotel Stars Interaction Administration * Hotel Stars Interaction Front Service * Hotel Stars Interaction Call Center * Hotel Stars Interaction Predicting Service Back Operations * Hotel Stars Interaction Predicting Service Summary of Regression Findings Summary of Structural Model Results Value by Limited Service Hotels Interaction Efficiency HR by Limited Service Hotels Interaction Back Positions by Limited Service Hotels Interaction Tangibles by Full Service Hotels Interaction Reliability HR by Full Service Hotels Interaction Service by Luxury Hotels Interaction
109126127132133134135138139142143144145146147149150151152153154155

1
Introduction
The field of macro human resource management (HRM) research
traditionally adopted a best practices approach, which argued that certain
practices would be universally effective in promoting the performance of human
resources (Pfeffer, 1995). Although this approach garners substantial empirical
support (Cappelli & Neumark, 2001; Combs, Liu, Hall, & Ketchen, 2006; Delery
& Doty, 1996; Guthrie, 2001; Huselid, 1995; Ichniowski, Shaw, & Prennushi,
1997), the best practices perspective only conveys a general high performance
philosophy but does not fully articulate the complex HRM in effect (Pfeffer &
Sutton, 1999). For instance, a philosophy of selective hiring or pay for
performance can be implemented using many different practices, focusing on
different skills and performance aspects. Indeed, organizations vary in their actual
decision to adopt these best practices (Ichniowski, Kochan, Levine, Olson, &
Strauss, 1996). In addition, as these best practices are explicit and uncomplicated,
they alone are not sufficient to sustain competitive advantages of organizations
(Reed & Defillipi, 1990).
The contingency perspective has mostly used the market positioning
typologies developed in the strategic management field almost 30 years ago
(Miles & Snow, 1984; Porter, 1980), considering these typologies as firm- or
industry-level contexts that organizations align HRM with (Arthur, 1992; Datta,
Guthrie, & Wright, 2005; Delery & Doty, 1996; Youndt, Snell, Dean, & Lepak,

2
1996). The argument is that “more is better” only applies to differentiation
strategy, but not cost leadership. These generic typologies are also not articulate
enough with regards to HRM contexts (Becker & Huselid, 2006). Instead,
essentially two sets of philosophies and practices are advocated (Becker, Huselid,
& Beatty, 2009). In addition, this perspective is limited to the comparison of
market positioning between industries or firms, without taking into consideration
the internal contexts, which are increasingly recognized as a critical source of
competitive advantage (Makadok, 2001).
The current paper aims to contribute to the macro HRM field in several ways.
First, it is among the first to use resources- and capabilities-based views to more
clearly articulate the positioning of HRM. Under the increasingly competitive
environment, the secret to success does not rely on the unambiguous best
practices or generic market positioning, but on the idiosyncratic and inimitable
resources and capabilities that organizations possess to implement their strategies
(Becker & Huselid, 2006; Teece, Pisan, & Shuen, 1997). Here resources are
narrowly defined as all acquired and developed assets that can contribute to
strategy implementation, and capabilities refer to the developed abilities to deploy
resources (Amit & Schoemaker, 1993; Dutta, Narasimhan, & Rajiv, 2005). HRM
is responsible for creating business resources and capabilities that have at least
two attributes in order to sustain competitive advantage: first, they have to be
valuable, which means that resources and capabilities should directly contribute to
3
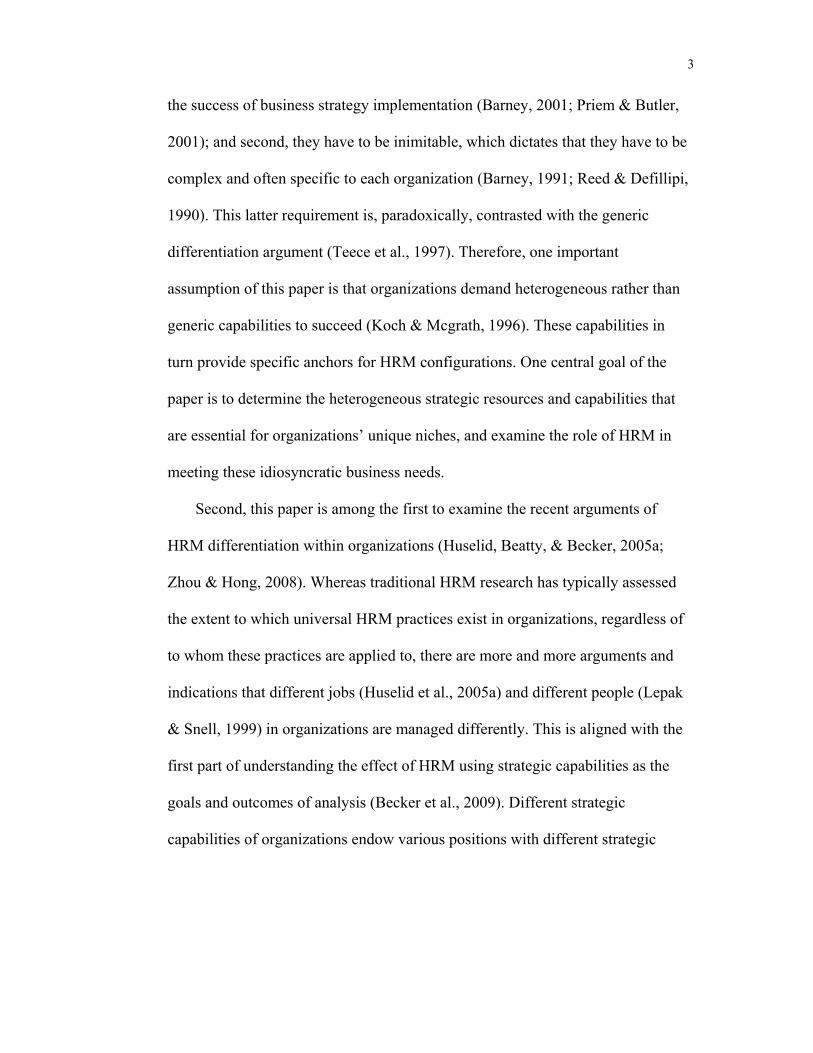
the success of business strategy implementation (Barney, 2001; Priem & Butler,
2001); and second, they have to be inimitable, which dictates that they have to be
complex and often specific to each organization (Barney, 1991; Reed & Defillipi,
1990). This latter requirement is, paradoxically, contrasted with the generic
differentiation argument (Teece et al., 1997). Therefore, one important
assumption of this paper is that organizations demand heterogeneous rather than
generic capabilities to succeed (Koch & Mcgrath, 1996). These capabilities in
turn provide specific anchors for HRM configurations. One central goal of the
paper is to determine the heterogeneous strategic resources and capabilities that
are essential for organizations’ unique niches, and examine the role of HRM in
meeting these idiosyncratic business needs.
Second, this paper is among the first to examine the recent arguments of
HRM differentiation within organizations (Huselid, Beatty, & Becker, 2005a;
Zhou & Hong, 2008). Whereas traditional HRM research has typically assessed
the extent to which universal HRM practices exist in organizations, regardless of
to whom these practices are applied to, there are more and more arguments and
indications that different jobs (Huselid et al., 2005a) and different people (Lepak
& Snell, 1999) in organizations are managed differently. This is aligned with the
first part of understanding the effect of HRM using strategic capabilities as the
goals and outcomes of analysis (Becker et al., 2009). Different strategic
capabilities of organizations endow various positions with different strategic

4
value – some are more central to the strategic capabilities than others (Huselid et
al., 2005a). In order to effectively create strategic capabilities, a disparate rather
than universal investment in certain positions may yield higher returns for
organizations. Therefore, this paper aims at understanding organizations’ ability
to identify the strategic positions that are important for realizing business
strategies and its subsequent impact on creating strategic capabilities.
Third, in order to further unravel the “black box” and to understand
idiosyncratic HRM in practice, there is a growing need to focus on a targeted
context (Lepak, Liao, Chung, & Harden, 2006). A comprehensive understanding
of the specific strategic capabilities needed for organizations and their
corresponding strategic jobs and HRM practices requires a narrowed and targeted
strategic focus. This paper complements the vast body of macro HRM research
conducted in the manufacturing industry by focusing exclusively on service (Batt,
2002) for several reasons. Firstly, the unique attributes of “protypical” service
such as intangibility, simultaneity of production and consumption, labor
intensiveness, and customer participation may render the management of service
different from manufacturing (Bowen, Siehl, & Schneider, 1989; Jackson, Schuler,
& Rivero, 1989; Mills, Hall, Leidecker, & Margulies, 1983). A meta-analysis
showed that high performance work systems had a differential effect on
manufacturing versus service industries (Combs et al., 2006). Hence, recently
researchers configured a high performance work system with a specific objective

5
of service quality (Liao, Toya, Lepak, & Hong, 2009).
Secondly, service has become a significant aspect of peoples’ lives. As such,
many organizations “are beginning to view service quality or service excellence
as a strategic imperative or, at a minimum, a strategic opportunity” (Schneider,
1990; p. 399). Service capabilities have become an essential element for most
organizations (Ray, Barney, & Muhanna, 2004). Despite the significance, there is
scant endeavor in strategic management that focuses on service capabilities, as
well as a missing linkage between marketing and management perspectives
(Schneider, Bowen, Ehrhart, & Holcombe, 2000). On the one hand, strategic
management research most often examines knowledge management and
innovative capabilities (Galunic & Eisenhardt, 2001; Subramaniam & Youndt,
2005; Zahra & George, 2002); very scarce efforts have been placed on service
capabilities. On the other hand, marketing and management researchers focus on
different parts of the service profit chain: marketing researchers often analyze
from the angle of customers to understand their needs and expectations (Bowen &
Schneider, 1988; Szymanski & Henard, 2001); while researchers in the
management field often start with how organizational management can be
translated into customer “delight” (Bowen & Schneider, 1988; Schneider &
Bowen, 1985; Schneider & Bowen, 1999). The current paper, therefore, is aimed
at drawing from all three perspectives and proposing a model delineating
customers’ different expectations for service quality (Parasuraman, Zeithaml, &

6
Berry, 1985) and their implications for strategic capabilities and management
practices.
Thirdly, focusing on service management can help us tackle some remaining
puzzles in HRM research in terms of 1) the variations and 2) the bundling of
HRM practices (Delery, 1998; Delery & Doty, 1996; Lepak et al., 2006). In
previous research on best HRM practices, a high performance culture was
commonly advocated, yet such a culture could be exemplified and conveyed
differently through subtle distinctions in HRM, which were often not articulated.
For instance, extensive training can focus on specialized versus generalized skills;
teamwork can be further exemplified as functional teams or cross-functional
teams; performance appraisal can specifically emphasize behaviors or results;
performance-based pay can be anchored to individual performance versus
collective performance; and so on and so forth. Focusing on a specific context
thus allows the fine-tuning of practice foci to strategic capabilities. In addition,
there has not been a consistent configuration of HRM systems (Delery, 1998). A
targeted system focus for different aspects of service quality provides theoretical
reasons why certain practices need to be bundled together to create desired
strategic capabilities.
In sum, this paper aims to draw from research accumulated in strategic
management, human resource management, and service management in order to
understand the question of how to more accurately differentiate HRM systems to

7
create strategic capabilities and make bottom-line differences for service
organizations. Towards this goal, I develop a model that delineates service
management processes from strategy formulation to implementation, and
highlights the important concept of fit between management architecture and
strategic capabilities.

8
Literature Review
Universalistic Approach
The field of macro HRM has gained its momentum over the past decades
partly due to the increasing recognition of the strategic value of human resources
(HR) in enhancing organizations’ competitive advantage (Pfeffer, 1995). The best
practices perspective first argues for a high performance philosophy - instead of
treating labor as a cost center, organizations should invest in a set of human
resources best practices to enhance employees’ motivation, ability and discretion
to perform (Huselid, 1995; Lepak et al., 2006; Wright & Boswell, 2002).
Selectivity in recruiting and selection, for example, conveys a message that a
company values outstanding employees, which will not only contribute to the
attraction and retention of elite employees, but also motivate the employees to
work harder, thereby will almost always contribute to labor productivity (Koch &
Mcgrath, 1996; Pfeffer, 1995; Terpastra & Rozzel, 1993).
Although the best practices perspective has gained some empirical support,
such as the demonstrated superior performance of various commitment HR
systems (Arthur, 1994), innovative HR practices (Ichniowski et al., 1997), high
performance work systems (Datta et al., 2005; Delery & Doty, 1996; Huselid,
1995), and high involvement HR systems (Batt, 2002; Guthrie, 2001), it also
provides opportunities for future research. First of all, there has not been a
consistent conceptualization of one best practices system (Delery, 1998). Instead,

9
various empirical studies demonstrate that such best practices often depend on the
targeted strategic objective, suggesting a need to further articulate differences in
HRM. Second, a one-size-fits-all solution cannot adequately explain the complex
reality and leads to a “knowing-doing gap” (Pfeffer & Sutton, 1999). The best
practices in their generic form convey a high performance philosophy, but do not
detail different routes to achieve high performance. For example, “pay for
performance” can be implemented in myriad ways depending on the performance
anchors; and “teamwork” can exhibit many different dynamics. Finally and
perhaps most importantly, these generic best practices may yield diminishing
return as more and more organizations implement them (Becker et al., 2009).
According to the resource-based view (Barney, 1991), the definition and
composition of best practices are neither tacit nor complex, thus they may not be
able to sustain competitive advantages of organizations (Reed & Defillipi, 1990).
Contingency Perspective
The contingency perspective introduces more complexities to HRM, in that
certain industrial or organizational contexts such as market positioning strategies
are taken into account (Delery & Doty, 1996). According to the behavioral
perspective of HRM (Jackson & Schuler, 1995), an important task of HRM is to
convey a message of desirable behaviors to employees according to business
needs. Therefore, HRM practices vary according to business strategies.
Empirical evidence for the contingency perspective is meager, perhaps in part

10
due to the limited conceptualizations of strategy. Most studies relied on
derivatives of the traditional industrial organization school of market positioning,
such as using cost leadership and differentiation (Porter, 1980) as a simple
dichotomy for HRM external strategic foci. For instance, comparisons have been
made between “control” and “commitment” HR systems (Arthur, 1994), “high
road” and “low road” strategies (Osterman, 1994), “human-capital-enhancing”
and “administrative” HR systems (Youndt et al., 1996) etc. to examine their
appropriateness under each context.
A simple and generic strategy dichotomy, however, may not be adequate for
future strategic HRM research (Becker & Huselid, 2006). Cost leadership is
sustainable only when organizations possess unparalleled asset massive efficiency
(Barney, 1986). Moreover, as researchers point out, an adherence to generic
market positioning in essence equates to two generic best practices systems
(Becker et al., 2009), which are still not sufficient to articulate variations in HRM
practice. Recent research in strategic management suggests that industrial market
positioning can only illuminate organizations so far; the sustainable competitive
advantage of organizations in the increasingly competitive environment to a larger
extent depends on the internal resources and capabilities to realize strategies
(Makadok, 2001; Reed & Defillipi, 1990), which may provide a more specific
context for configurating HRM.
11
Theory Development
Resources- and Capabilities-Based Views
As discussed above, there lacks an effective strategy schema in the industrial
organization school to fully explicate the applications of HRM. Porter’s market
positioning typology suggests winning competitive advantage through placing a
firm at the right industrial position to effectively gain market rent. The
resource-based view, on the contrary, inherits the Ricardian perspective arguing
that rent accrues from internal idiosyncratic and inimitable resources and
capabilities to implement strategies (Barney, 1991; Barney & Wright, 1998; Reed
& Defillipi, 1990). Although resources have been broadly defined as all factors
that can contribute to firm competitive advantage, which may subsume
capabilities (Barney, 1991), here resources narrowly refer to firms’ acquired
assets, to be differentiated from the Schumpeterian perspective of capabilities,
which is the internal ability to maximize rent with given resources (Dutta et al.,
2005). Being a superior “stock picker” and “architect” (Makadok, 2001), firms
can acquire, develop, and exploit various forms of resources to create competitive
advantages (Eisenhardt & Martin, 2000; Wernerfelt, 1984).
Two main assumptions underlying the resource-based view are that firms are
heterogeneous with respect to the strategic resources (physical, organizational, or
human) that they control and that these resources are not perfectly mobile within
the factor market (Barney, 1991). Resources that are not easily tradable in the
12
factor market but need to be built on a history of accumulation are most critical to
sustain competitive advantage (Dierickx & Cool, 1989). Based on these
assumptions, companies that control valuable, rare, imperfectly imitable and
non-substitutable capabilities are able to generate sustained competitive
advantages (Barney, 1991). An example was Microsoft’s successful acquisition of
the MS-DOS system in 1980 which sustained its competitive advantage over the
next decades. This was in part due to its rare a-priori information about IBM’s
subsequent needs for computer operating systems (Makadok, 2001). For hotels,
one important form of resources is their properties, such as the location and rooms.
Hotels that are able to secure a valuable location (such as at the center of Time
Squares) or a rare property (such as a historic building) should possess either
superior information or massive asset efficiency (Barney, 1986; Dierickx & Cool,
1989), or otherwise, luck (Barney, 1986), and will subsequently possess
competitive advantage.
The capability-based view extends the resource-based view in that it answers
the question of why organizations that possess equivalent resources demonstrate
different performance (Sirmon, Hitt, & Ireland, 2007; Teece et al., 1997). An
analogy would be auto racing: the ultimate performance depends first on the make
of the car that the drivers choose (which is based on the drivers’ information and
asset); when the quality of the cars is equivalent, the ultimate success of the race
depends on the racers’ capabilities to drive the car. The capability-based view is

13
substantiated by the recent failures of many Wall street and Main street
organizations that used to possess valuable resources but were not capable of
deploying the resources wisely at certain points. While certain resources can be
acquired from the factor market, the strategic capabilities to convert given
resources into maximum returns are built within organizations and cannot exist
without the organizations (Makadok, 2001). While “resource-picking” activities
rely on “cognitive and information factors”, “capability-building” activities
happen mostly after resources are acquired and emphasize on “structural factors”.
Take the hotel industry for example, the initial decisions to invest in real estates
or franchise properties may depend on superior information and asset. Later
successful management of the property, however, relies more on the day-to-day
capabilities to maintain and utilize the resources, an important aspect of which is
human resource management.
The resource-based view changes the way how strategy is conceptualized and
leads strategic management researchers to believe that industrial positioning is
sustainable only when it is supported by inimitable internal competencies to
implement the strategies. In other words, it is the resources and capabilities of
organizations that enable the inimitability of strategies (Wright, Mcmahan, &
Mcwilliams, 1994). In addition, it challenges the assumption of universally
effective business strategies - their generic nature dictates that they are not rare
thus cannot sustain competitive advantages of organizations (Barney, 1991).

14
Therefore, sustained competitive advantages do not center on business positioning
strategies, but on building heterogeneous and inimitable strategic capabilities that
are embedded to achieve a given strategy (Brush & Artz, 1999), which can help
further understand the differences in HRM.
Heterogeneous Strategic Capabilities
The idea of “exogenous” strategic contexts determining heterogeneous
capabilities echoes the conceptualization of “contingent resource-based view”
(Aragon-Correa & Sharma, 2003), which argues for the heterogeneous value of
resources and capabilities under different contexts. Although there have been
numerous debates about the parameterization of value and rarity, the central idea
is that if the resources can “exploit opportunities and/or neutralize threats in a
firm’s environment” (Barney, 1991; p. 105), and that if there are less firms that
possess such inimitable resources than would be in a perfect competition market,
then they can create competitive advantages for firms (Barney, 2001; Priem &
Butler, 2001). Research examines strategic capabilities as unique to the industry.
For the money market mutual funds, a distinguished capability to predict
short-term interest rate was shown to be very important for the gross financial
performance of the fund (Makadok & Walker, 2000). Such capability may have a
less direct effect on stock market funds. Strategic capabilities can also vary within
industries depending on the strategic focus and developmental paths of
organizations (Eisenhardt & Martin, 2000). Both as bookstores, Borders pursued a

15
real-time inventory strategy to meet customers’ diversified and immediate
demands and subsequently developed an information system that enabled the
capabilities to do so; Barnes & Nobles’, in contrast, followed a low price strategy
to provide affordable books, thus developed its scale and scope to create such
operational excellence (Raff, 2000). Therefore, different sets of capabilities
enabled these two book stores to succeed on their unique strategic foci, which had
substantial implications for designing and differentiating HRM between the stores.
In what follows I will elaborate on the targeted strategic foci and the needed
capabilities for service organizations.
Hypothesis 1: Depending on the strategic focus, different strategic
capabilities will contribute to firms’ competitive advantage.
Focusing on the Service Strategies
As capabilities that contribute to business successes are heterogeneous and
ambiguous, to comprehensively understand their relationships, there is a need to
focus on a specific context (Brush & Artz, 1999). Most previous research on
strategic and dynamic capabilities examined knowledge-based capabilities such as
R&D and knowledge innovation (Dutta et al., 2005; Leonard-Barton, 1992;
Rothaermel & Hess, 2007). Very scant efforts, however, have been placed on
customer service capabilities, which are becoming increasingly important. In fact,
65% - 75% of the workforce employed in the manufacturing industries in the
United States are performing service tasks (Horwitz & Neville, 1996). Service

16
directly determines customers’ perception of service quality (Bowen et al., 1989)
and organizations’ future shareholder returns (Ogden & Watson, 1999). Customer
service capability is an important focus of organizations and will be targeted in
this paper.
“Protypical” service is often narrowly defined by interpersonal aspects,
emphasizing the unique attributes of intangibility, simultaneity of productions,
sales, purchases, and consumptions, labor intensiveness, and customer
involvement in service delivery (Mills et al., 1983). In fact, service and
production are often inseparable (Shostack, 1977). Service varies along the degree
of intangibility: service can be directed to people (e.g., hairstyling), to intangible
goods (e.g., banking), and to tangible goods (e.g., cleaning) (Kelly, Donnelly, &
Skinner, 1990). When selling products, service is also often involved, which is
considered value-adding to products’ tangible attributes (Horwitz & Neville, 1996)
and can influence customers’ perceptions of product quality (Bowen et al., 1989).
In the hotel industry, the Mobil Travel Guide’s definition (Table 1) of different
hotels demonstrates that hotels of different star levels vary in both service and
tangible aspects. For example, as the star level increases, the tangible
establishments upgrade from “clean, comfortable and reliable”, to “exceptionally
distinctive luxury” and with “expanded amenities”; while services improve from
“limited” to “consistently superlative” with “attention to detail and the
anticipation of guests’ every need” (Mobil-Travel-Guide, 2008). Therefore, in this

17
paper, service is broadly defined as the delivery of all non-goods producing
activities which may include both tangible and intangible aspects.
-------------------------------
Insert Table 1 about here
-------------------------------
Service Market Positioning Strategies. As the generic strategy typologies
cannot capture the uniqueness of service industries’ competitive advantage
(Becker & Huselid, 2006), it is necessary to focus on the service context to
understand its strategies (Brush & Artz, 1999). According to Andrews (1987), the
most fundamental stage of strategic management is to identify the opportunities
and threats in the targeted environment in order to gather valuable input for
strategy formulation. The process through which a strategy is formulated is a
central interest of the industrial organizational school. To conceptualize the
strategies that are most applicable to the service context, it is important to
understand what customers desire in a service transaction.
The uniqueness of the service context determines that customers not only
desire the “instrumentality” of service that is analogous to the utility of products,
but more notably, a unique feature of service “expressiveness” (Gutek, Bhappu,
Liao-Troth, & Cherry, 1999; Swan & Pruden, 1977) which may be less applicable
in a non-service context. This latter customer desire relates to the needs for
“tender loving care” and service customization (Schneider et al., 2000). This gives
18
rise to at least three ways to differentiate: through operational excellence, product
leadership, and customer intimacy (Treacy & Wiersema, 1993). Operational
excellence, by definition, is “providing customers with reliable products or
services at competitive prices and delivered with minimal difficulty or
inconvenience” (p. 84). Product leadership and customer intimacy are two aspects
of differentiation; the former refers to excelling at providing “tangible” aspects of
service, while the latter refers to providing highly personal and expressive service
to customers. Take the retail stores, Nordstrom, Sears, Costco, and Wal-Mart for
examples, they all differentiate their quality through different means (Delery &
Shaw, 2001; Huselid et al., 2005a). At Wal-Mart, the differentiating factor is
neither product nor service leadership, but cost leadership enabled by the efficient
integration of purchasing, distribution, and the “cross-docking” logistic processes
(Stalk, Evans, & Shulman, 1992). Costco distinguishes by its quality and bulk
package products, but has very few sales persons available to assist customers.
Nordstrom and Sears excel at providing customized service by having qualified
sales associates who show understanding and courtesy to assist and communicate
with customers. Therefore, these three aspects can be considered three meaningful
strategy foci of service organizations, each demanding a different set of strategic
capabilities.
Articulating Strategic Capabilities
As argued above, explicit and imitable positioning strategies are not sufficient

19
to create competitive advantages (Wright et al., 1994). The determining factor is
the strategic capabilities to convert organizations’ resources into desirable outputs
(Becker & Huselid, 2006; Sirmon et al., 2007; Wright, Dunford, & Snell, 2001).
The question then is, given a strategic focus, what types of capabilities are
strategic? Researchers argue that organizations with the same strategic focus have
commonalities in their strategic capabilities whereas the details might vary
depending on their contexts and histories (Eisenhardt & Martin, 2000). Integrating
arguments from the marketing field (Agarwal, Erramilli, & Dev, 2003), the
strategic capabilities of service organizations are derived from “determining the
needs and wants of target markets and delivering the desired satisfactions more
effectively and efficiently than competitors” (p. 68). Two implications can be
drawn from this proposition. First, targeted customers have pre-service predictive
expectations of service that they will receive in a given transaction (Ziethaml,
Berry, & Parasuraman, 1993). Organizations that are capable of providing
services that meet or exceed customers’ expectation will have higher customer
and financial outcomes (Day, 1994). Second, besides customers’ expectations, a
horizontal comparison with competitors is essential. Organizations that are able to
surpass competitors in providing desirable services to customers are more likely
to be providers of choice (Sirmon et al., 2007). Therefore, in order to identify
strategic capabilities, organizations first need to understand what customers
expect and what other competitors offer, both of which may be influenced by
20
industrial standards (e.g., Mobil Travel Guide).
Strategic Capabilities for Operational Excellence. For an operational
excellence strategy, the targeted customers are high on instrumental needs (Gutek
et al., 1999; Saparito, Chen, & Sapienza, 2004; Swan & Pruden, 1977).
Instrumentality is defined as the utility or feature of service, such as reliability
(dependability and accuracy) and responsiveness (prompt service) (Parasuraman,
Zeithaml, & Berry, 1994) relative to price. These attributes are also service search
quality, namely, quality that customers can determine prior to receiving service
(Brush & Artz, 1999) based on the hotel’s star rating. This segment of customers
purchase service because there is basic utility or end result of it that satisfies their
immediate needs, such as physiological needs (e.g., a good night sleep) (Chiu &
Lin, 2004). These customers are only willing to pay the minimum amount of
money and time to get the most basic needs met (Treacy & Wiersema, 1993).
Service is considered by customers as a means to an end (Swan & Pruden, 1977),
but not so much as an enjoyment itself. These customers may not expect having
extensive interactions with service providers. For example, customers who go to
one-star hotels expect to find “clean, comfortable, and reliable establishments
with limited services and amenities” (Mobil Travel Guide).
Service organizations that compete for these customers should have the
capabilities to beat the market’s price, as well as to provide higher quality to
customers, such as superior speed, accuracy, and reliability etc. than competitors
21
(Fornell, Johnson, Anderson, Jaesung, & Bryant, 1996), among others. As an
illustration of excellent responsiveness, Ritz Carlton required employees to
address customers’ complaints within 10 minutes and follow up with a phone call
to make sure customers were satisfied within 20 minutes (Henderson, 1992).
Everything being equal, providers that are able to offer cheaper but faster, cleaner,
and more reliable service are more likely to satisfy customers. Therefore, I
hypothesize that being able to deliver value to customers is critical in gaining
competitive advantage among other organizations that focus on operational
excellence.
Hypothesis 1a: For firms that compete on operational excellence, the
capability to deliver instrumentality to customers is strategic to achieving high
financial performance. Such capability does not contribute to higher performance
for other strategic foci.
Strategic Capabilities for Product Leadership. For a product leadership
strategy, the targeted customers are those who expect high quality tangibles
(physical facilities, equipment, the appearance of personnel and communications
materials) (Parasuraman et al., 1994). These product qualities are also experience
quality, which customers can obtain only after transaction (Brush & Artz, 1999).
These customers are willing to pay a price premium not only to get the basic
needs met, but also to enjoy the distinctive tangible aspects of service (Lenox,
Rockart, & Lewin, 2006; Swan & Pruden, 1977). For example, when evaluating a

22
restaurant, the quality of food is often the utmost important criteria for many
customers, thus customers are willing to pay more to enjoy better food, even
when the service may not be the most superlative. Customers who go to three-star
hotels expect to enjoy well-appointed establishments with expanded amenities
such as a pool, a full-service restaurant, and a fitness center etc. (Mobil Travel
Guide). Therefore, in order to succeed in serving customers who value the
tangible aspects of service, organizations need to possess the capabilities to
provide and maintain quality tangibles, among others, in order to satisfy the
customers and receive future patronage.
Hypothesis 1b: For firms that compete on product leadership, the capability
to deliver quality tangibles to customers is strategic to achieving high
performance. Such capability does not contribute to higher performance for other
strategic foci.
Strategic Capabilities for Customer Intimacy. For organizations that focus
on a customer intimacy strategy, the targeted customers look for extensive (Mittal
& Lassar, 1996) and highly personalized service (Skaggs & Youndt, 2004;
Surprenant & Solomon, 1987) that is characterized by assurance (knowledge and
courtesy of employees, and their ability to convey trust and confidence) and
empathy (care and individual attention to and understanding of customer needs)
(Parasuraman et al., 1994). These customers have high social needs such as
belongingness, love, and esteem etc. Expressive service is perceived by these
23
customers as an end or an enjoyment in itself (Swan & Pruden, 1977), and
customers are willing to pay a price premium for the finest service (Lenox et al.,
2006). As such, the interaction between employees and customers during service
constitutes another indispensable component that is valuable to customers and
strategic to organizations. For example, a good restaurant may provide quality
food, but a great restaurant may also provide excellent service that shows care and
respect, satisfying customers’ expressive or relational needs. Likewise, customers
of five-star hotels would expect to enjoy “consistently superlative services”
featured by “attention to details and the anticipation of guests’ every need” (Mobil
Travel Guide).
There are at least two ways to provide customer intimacy: to provide more or
exact choices for customers (outcome personalization), or to serve customers
one-on-one based on their needs (process personalization) (Surprenant &
Solomon, 1987). As an example of the first approach, Ritz Carlton operated a
database for guests who maintained a relationship with the hotel, which provided
front-desk employees across properties nationwide with access to guests’
preferences such as smoking or non-smoking rooms, rose or wine in the evening,
and preferences of pillows etc., such that they could consistently cater service to
guests’ exact needs (Henderson, 1992). As well, providers can personalize service
processes by encouraging “pro forma” courtesy such as small talks and
remembering customers’ names, by helping customers find out what they desire,

24
or by catering service to their unique physical appearance and conditions and
personal preferences (Surprenant & Solomon, 1987). One example was that Ritz
Carlton trained employees to follow three steps of service: to greet guests with
their names, to meet guests’ needs, and to say farewell to guests again using their
names. They also had a philosophy that an employee should not tell guests
directions. Instead, they would personally lead the guests to their desired
destinations (Henderson, 1992). Therefore, organizations that provide service
expressiveness at a level that is superior to competitors, among others, will have a
competitive advantage among organizations that similarly compete on customer
intimacy.
Hypothesis 1c: For firms that compete on customer intimacy, the capability
to deliver expressiveness to customers is strategic to achieving high performance.
Such capability does not contribute to higher performance for other strategic foci.
To sum up, firms that effectively develop the strategic capabilities that are
essential for their strategic focus are more likely to outperform those that are
unsuccessful in creating such capabilities. As discussed above, valuable resources
“enable a firm to conceive of or implement strategies that improve its efficiency
and effectiveness” (Barney, 1991; p. 106). Strategic capabilities, in turn, enable
firms to acquire, accumulate, allocate, combine, deploy, and utilize valuable
resources to achieve business goals (Makadok, 2001; Schreyogg & Kliesch-Eberl,
2007; Sirmon et al., 2007). As such, the possession of strategic capabilities will

25
contribute to firms’ performance. Being able to deliver instrumentality to
customers looking for low cost and efficiency, quality tangibles to customers
looking for physical enjoyment, and expressiveness to customers looking for
tender loving care service, service organizations are more likely to meet and/or
exceed targeted customers’ expectations thus have more favorable perceptions of
service (Gotlieb, Grewal, & Brown, 1994; Szymanski & Henard, 2001) and future
purchase behaviors from customers (Boulding, Kalra, Staelin, & Zeithaml, 1993;
Ziethaml et al., 1993), which in turn, are essential for companies to ensure future
profitability.
Configurations of Human Resource Management
Given different sets of capabilities, the question then is, how can HRM
facilitate building such capabilities? The service profit chain model links
management practices with desired service: namely, organizational practices are
translated into employee service behaviors, which in turn lead to customer
satisfaction and loyalty, and subsequently higher sales and financial performance
of organizations (George & Bettenhausen, 1990; Heskett, Sasser, & Schlesinger,
1997; Schneider, 1990). In this vein, I will focus on how HRM can contribute to
creating strategic capabilities of organizations.
External fit with strategic focus. Contingency or external fit theories (Baird &
Meshoulam, 1988; Delery & Doty, 1996; Mcmahan, Virick, & Wright, 1999)
assert that in order to execute business strategies, organizations have to first

26
envision a workforce that is able to create the strategic capabilities, and then
configure human resource management practices that will create such a workforce
(Huselid, Becker, & Beatty, 2005b). Due to limited resources, it is often difficult
and expensive to create all capabilities of superior performance simultaneously
(Bowen et al., 1989; Cappelli & Neumark, 2001). Instead, there are different
approaches to strategic management (Nag, Hambrick, & Chen, 2007). The
assumption is that companies that adopt a system that aligns with the suggested
profile of the desired strategic capabilities will be more effective (Van De Ven &
Drazin, 1985; Venkatraman, 1989).
Internal fit as a configuration. Aside from the external fit of HRM with
strategic capabilities, researchers also emphasize the configurational or internal fit
among HRM practices (Baird & Meshoulam, 1988; Delery & Doty, 1996), i.e.,
how the practices influence performance as a bundle. This argument is coherent
with the resource-based view which believes that one determinant of ambiguity is
the internal complexity that resides in the relation among multiple practices (Reed
& Defillipi, 1990). It also echoes the strategic capabilities argument which states
that the complementarity among strategic processes is often what constitutes
inimitability (Teece et al., 1997). There have been inconsistencies, however, in
configurating the bundle of high performance work practices (Ichniowski et al.,
1996).
Towards this question, I argue that there is no one best bundle, but different
27
configurations of HRM based on an underlying theory that are effective for
different strategic capabilities. I use the framework of required human capital,
social capital, and the management of employees’ motivation and empowerment
(Batt, 2002; Becker & Huselid, 1998; Combs et al., 2006; Delery & Shaw, 2001;
Huselid, 1995; Lepak et al., 2006; Wright & Boswell, 2002; Youndt,
Subramaniam, & Snell, 2004) to illustrate the configuration of HRM and to
visualize a desirable workforce for the desired service capabilities. This is referred
to as fit as “bundles” approach (Guest, 1997), which assumes that there are
different combinations of practices that can be effective and that it is the
configuration of certain practices that makes a difference.
First of all, employees need the right knowledge, skills, and abilities that are
aligned with the strategic capabilities to create value for the firm (Jackson &
Schuler, 1995; Wright et al., 1994). Certain HR practices bundled together can
create, develop, deploy, and retain desirable human capital that is essential for
organizational success (Lepak & Snell, 1999). For example, recruiting, selection,
and training are useful practices that can attract, acquire, and develop employees’
knowledge, skills, and abilities to serve customers (Liao et al., 2009). Although
the importance of human capital is widely recognized, there has been limited
effort in linking different human capital with different strategic capabilities, such
as differentiating generalized versus specialized skills (Batt, 2002; Bhattacharya,
Gibson, & Doty, 2005; Coff, 1997; Liao, Toya, Lepak, & Hong, 2007; Macduffie,

28
1995; Zacharatos, Barling, & Iverson, 2005). This paper argues that HRM needs
to be specifically designed to create human capital that is most important for the
needed strategic capabilities.
Second, employees are not isolated individuals but are embedded in social
relationships with supervisors, coworkers, subordinates, clients, and partners etc.
(Brass, 1995). The interpersonal dynamics also need to be aligned with the
strategic capabilities of the firm. Social capital theory has advocates for strong
ties and weak ties (Collins & Clark, 2003; Reagans, Zuckerman, & Mcevily,
2004). On the one hand, the private good perspective (Brass, Galaskiewicz, Greve,
& Tsai, 2004) and structural hole theory (Burt, 1997) upholding individuals’
outreaching network ties and private resources may be amenable for companies in
which individuals take full responsibilities for their tasks and individual
contributions are encouraged. On the other hand, a public good and network
closure perspective (Coleman, 1988) supporting collective coherence may be
applicable in situations where a unified culture and a cooperating mechanism are
desired. Therefore, whether to create a collective, cohesive or individualistic,
outreaching social structure depends on the strategic capabilities of the
organization, as well as the makeup of human capital.
The design and configuration of HRM practices, such as teamwork,
information sharing, and rewards, can facilitate the creation of preferred social
capital, i.e., the desired structural, relational, and cognitive interactions among

29
employees, which can then substantially influence work outcomes (Gant,
Ichniowski, & Shaw, 2002). Previous research in HRM, however, has not clearly
employed theories of social capital. For example, researchers generally
conceptualize teamwork as a useful practice to solicit higher performance (Datta
et al., 2005; Guthrie, 2001; Ichniowski et al., 1996). Yet, there is little
differentiation between different types of teams, such as temporary teams and
stable teams, and functional and cross-functional teams. Therefore, there is a need
to align the configuration of social capital with the human capital composition and
the strategic capabilities.
Finally, even for employees who have the right skills and social capital to
perform, they need to be motivated properly to display desirable behaviors to
contribute to the strategic capabilities of the firm (Wright et al., 1994). Expected
behaviors that are matched with strategic needs vary along flexible versus
inflexible (Bhattacharya et al., 2005), independent versus cooperative, concern for
process versus for outcomes, and narrow versus broad skills applications etc.
(Wright & Snell, 1998). Such desirable behaviors enabled by their motivation and
commitment are also managed by various combinations of HR practices (Liao et
al., 2007; Schuler & Jackson, 1987; Zacharatos, Hershcovis, Turner, & Barling,
2007). For instance, practices such as recruiting and selection, socialization,
performance appraisal, rewards and punishment establish expectations for
employees to display desirable behaviors such as knowledge sharing and
30
combination (Collins & Smith, 2006), passion for service (Schneider, Wheeler, &
Cox, 1992) and positive emotions to customers (Sutton & Rafaeli, 1988).
However, previous research often generally asserted that pay for performance was
an effective way to motivate employees (Datta et al., 2005; Delery & Doty, 1996;
Guthrie, 2001; Zacharatos et al., 2005), without taking into account the kind of
performance being paid for, nor the important difference between pay for
individual performance and pay for collective performance (Macduffie, 1995).
Therefore, HRM practices also need to be tailored to the desired motivation and
behaviors of employees.
Taken together, by focusing on targeted strategic capabilities, this paper
adheres to two rationales for configurating HRM to meet strategic needs. First,
according to the strategic capabilities of service organizations, certain workforce
human capital, social capital, and motivation are desired, which are enabled by
different configurations of HRM practices. Second, the horizontal alignment of
HRM practices that serve a common strategic goal will further strengthen the
effects of HRM systems. Therefore, the assumption is that there is an effective
profile of HRM system for each strategic focus; the greater the alignment of HRM
with the effective profile, the more likely the organizations will be able to create
the strategic capabilities desired for their strategic foci. In what follows I will
spell out the rationales of the effective profiles for each strategic focus of service
organizations.
31
Hypothesis 2: An alignment between firms’ strategic focus and HRM is more
likely to create desired strategic capabilities.
Efficiency-Oriented HRM. As defined above, an operational excellence
strategy aims at reducing costs and delivering basic quality services that are
inexpensive, readily available, convenient, and fast (Bowen et al., 1989; Gutek et
al., 1999; Schneider & Bowen, 1999). Organizations in this segment thus have to
balance cost and quality – research showed that no product line adopted both
strategies at the same time (Nayyar, 1993). From customers’ standpoint, research
showed that customer satisfaction was influenced to a greater extent by service
quality than by cost (Fornell et al., 1996) - customers were more sensitive to
variations in service quality than price. As such, effective operational excellence
implies streamlining processes and improving mechanisms to reduce cost without
sacrificing basic quality (Treacy & Wiersema, 1993).
One important factor in considering management structure is the extent of
uncertainty. Given needed strategic capabilities of operational excellence, there
may be less uncertainties associated with serving this customer segment in terms
of their needs and expectations – instrumentality at low cost. Organizational
theories suggest that a typical measure that works in such an environment is a
mechanistic system (Burns & Stalker, 1961). Efficiency is realized through
“aggressive construction of efficient-scale facilities, vigorous pursuit of cost
reductions from experience, tight cost and overhead control, avoidance of

32
marginal customer accounts, and cost minimization in areas like R&D, service,
sales force, advertising, and so on” (Porter, 1980; p. 35).
The human capital component for an operational excellence strategy is likely
to emphasize manual skills (Youndt et al., 1996) and basic demeanors only, due to
the simplified tasks, clear division of labor (Weber, 1924), standardization of
service process, reduced discretion of employees (Huselid et al., 2005a), and in
some situations, substitution of employees by equipment and systems (Horwitz &
Neville, 1996; Thompson, 1967). As turnover rate for such service positions is
often high, investment in human capital is limited. Training usually only includes
company policies and procedures, corrective actions training (Youndt et al., 1996),
and basic on-the-job training (Schlesinger & Heskitt, 1991). Rewards are also tied
to basic skills. In fact, many companies often benchmark the lowest market rate
(Huselid et al., 2005a). In addition, in order to further reduce cost, one effective
way is to hire non-traditional employees such as part-timers and contractors
(Schuler & Jackson, 1987).
The motivational mechanisms under operational excellence are also likely to
focus on quantifiable results. First, there are generally very few opportunities
provided for employees to use their discretion or vary in performance (Schuler &
Jackson, 1987). Employees under this scheme are often rewarded on the quantity
of service they produce, instead of the quality (Schuler & Jackson, 1987).
Therefore, managerial practices need to be in place to standardize and clearly

33
define service delivery processes to ensure that service performance by employees
will meet companies’ requirements (Gutek et al., 1999). Second, in order to
further ensure service consistency when employees serve “encountering”
customers, organizations may use unobtrusive monitoring functions (Bowen et al.,
1989; Gutek et al., 1999) and command and control (Youndt et al., 1996). This
approach is applicable when employees have limited discretion. In fact, many
department stores, grocery stores, and call centers use monitoring to ensure
service quality (Sutton & Rafaeli, 1988). Some companies even invite customers
to help monitor employees’ performance. A store in Hayward, California
provided a five-dollar incentive for customers to report clerks who did not exhibit
welcome greetings and smile (Sutton & Rafaeli, 1988).
Finally, there is a low emphasis on the development of social capital among
employees. There are many reasons for this: employees work on shifts and may
have to work with different people at each shift; many employees have a very
short tenure of working with a particular service company or at a particular
position; they only focus on their particular task function without having to
interact with other employees etc. Therefore, there is very little utility for
employees to develop interpersonal bonds (Lawrence & Lorsch, 1967). Instead,
teamwork is coordinated by the system itself (Schuler & Jackson, 1987; Weber,
1924).
In sum, the efficiency-oriented HRM practices that are suggested for

34
operational excellence are: selection based on basic demeanor, training on rules
and task-specific skills, internal monitoring, evaluations based on error-free
performance, compensation based on lowest market rates, clear division of labor,
specific job description, and basic information sharing systems.
Hypothesis 2a: For firms that focus on operational excellence, implementing
efficiency-oriented HRM is more likely to enable delivering instrumentality to
customers than not implementing such HRM. Efficiency-oriented HRM does not
contribute to strategic capabilities of other strategic foci.
Reliability-Oriented HRM. For organizations competing on product
leadership, which is comparable to the quality strategy in manufacturing (Youndt
et al., 1996), it is important to possess the capability to deliver quality tangibles
(Parasuraman et al., 1985). There are very different demands of human capital,
motivation, discretion, and social capital of employees and subsequently different
HRM focus than an operational excellence strategy. Organizations need to
inculcate a quality-orientated service climate and culture (Bowen et al., 1989;
Schneider et al., 1992) and leadership’s commitment to quality (Schneider,
Ehrhart, Mayer, Saltz, & Niles-Jolly, 2005).
First, these organizations emphasize in-depth and specialized human capital
(Wright & Snell, 1998). As the quality that customers demand is distinguished in
tangible aspects, these targeted customer needs are also mostly predictable and
can be satisfied in given ways. Specialized human capital, according to

35
organizational theorists, is most valuable under such a stable context (Hannan &
Freeman, 1977). HRM practices such as recruiting, selection, training, reward,
and retention of the specialized human capital that fits the company’s strategic
capabilities are particularly important (Youndt et al., 1996). In particular,
selective hiring and in-depth training on the specialized skills to each job may
prove beneficial to developing the needed specialization (Johnson, 1996;
Schneider et al., 1992). Pay for specialized skills that are particular to the
employees’ jobs is also helpful for encouraging the development and retention of
such skills (Wright & Snell, 1998).
Second, a climate for quality is also transmitted to customers through the
way employees interact with each other, i.e., the social capital among employees.
Given the specialized human capital among employees, each employee may not
know everything needed to carry out a task. Thus, an organic structure
characterized by effective teamwork and communication between employees is
key (Burns & Stalker, 1961; Lawrence & Lorsch, 1967). In particular, functional
teamwork among employees is essential for members to develop idiosyncratic
knowledge of the team, trust, and common communication protocols (Nahapiet &
Ghoshal, 1998; Thompson, 1967). Also, a long-term team relationship is desirable
because targeted customer needs are stable, and the development of specialized
knowledge takes time to accumulate. In addition, strong ties among employees
are critical for establishing a pleasant emotional front for serving customers.

36
Employees who are closely tied to each other can develop trust and strong norms
across the company (Nahapiet & Ghoshal, 1998). Under such a work relationship,
employees are more likely to convey “a sense of oneness” to the customers, which
is considered an integral part of quality service. As such, HRM practices aimed to
reduce employees’ status differentials and to have fewer levels in the hierarchy
are important (Pfeffer, 1998; Schuler & Jackson, 1987).
Third, employees’ motivation to improve quality is cultivated by HRM
practices that convey an appreciation of superior quality (Schneider, 1990). For
example, rewarding behaviors that lead to high performance is a useful way of
sending such a message (Horwitz & Neville, 1996). In particular, rewards need to
emphasize collective service performance in order to reinforce the trusting
environment (Heckscher, 2007). Also, it is important to recognize that employees
tend to treat customers the way organizations treat them. Organizations that
provide employees with resources (logistical, administrative, equipment) and
managerial support (Schneider & Bowen, 1985) are more likely to have
reciprocations from employees.
Another component that motivates employees is appropriate discretion
(Delery & Shaw, 2001). As employees have specialized skills and the
coordination among team members is often scripted, it allows a more explicit
description of job responsibilities (Schuler & Jackson, 1987). However, it is
important that employees are endowed with opportunities to make suggestions
37
and receive important information in order to ensure quality (Horwitz & Neville,
1996). Finally, providers place an emphasis on providing feedback of service
quality based on internal evaluations of specific job performance.
To sum up, reliability-oriented HRM practices that are effective for product
leadership include selective hiring and extensive training on task-specific skills,
performance evaluation and compensation based on department performance,
promotion and functional teams within departments, specific job description,
suggestion, information sharing systems, and internal feedback.
Hypothesis 2b: For firms that focus on product leadership, implementing
reliability-oriented HRM is more likely to enable delivering quality tangibles to
customers than not implementing such HRM. Reliability-oriented HRM does not
contribute to strategic capabilities of other strategic foci.
Flexibility-Oriented HRM. The goal of customer intimacy strategy is to offer
expressive services that are varied based on individual customers’ needs (Bowen
et al., 1989; Schneider et al., 2000). It is important for these companies to
personalize services and establish one-on-one service relationships. Typical
measures that are used by customers to evaluate quality are empathy and
assurance (Parasuraman et al., 1985). In these situations, customers’ needs are
addressed case-by-case, which can be interpreted as an uncertain context that
dictates a more organic (Burns & Stalker, 1961), interpersonal-oriented
(Lawrence & Lorsch, 1967), and flexible (Mills et al., 1983; Wright & Snell, 1998;

38
Youndt et al., 1996) system. This requires that employees have discretion to
handle spontaneous situations and have broad knowledge and information to carry
out proper tasks (Batt, 2002; Horwitz & Neville, 1996; Wright & Snell, 1998).
Flexibility here refers to the internal adjustment of employees’ skills, behaviors,
and coordination to meet customers’ idiosyncratic needs (Bhattacharya et al.,
2005), which is distinguishable from the macro conceptualization of dynamic
capabilities (Teece et al., 1997) or the flexibility of HRM systems (Wright &
Snell, 1998).
The capability for expressiveness demands human capital of breath and
integration rather than depth and specialization, because individual employees are
responsible for satisfying a customer on a wide array of service demands. The
type of human capital required should be generalized to cope with request
uncertainties, to solve various problems, and to develop needed skills in the future
(Batt, 2002; Wright & Snell, 1998). As such, practices of selective hiring,
extensive training, and rewards for generalized skills are helpful for acquiring,
developing, and retaining such skills (Batt, 2002; Skaggs & Youndt, 2004;
Youndt et al., 1996). As individuals with desirable broad skills that are specific to
the firm are very valuable to the company, actions such as broad internal career
opportunities should be taken to develop and retain these employees (Batt, 2002;
Lepak & Snell, 1999).
The social capital attribute that is ideal for flexibility is weak ties rich in

39
structural holes (Blyler & Coff, 2003). As customer demands are diverse, even
when employees have very generalized skills, they may not be able to manage all
requests alone but have to seek assistance from other functions internally and
externally. The simultaneity of service production and consumption also demands
prompt responses to problems (Mills et al., 1983). In order to facilitate problem
solving, temporary teams are desired such that different functions can be
integrated to address difficult problems (Batt, 2002; Heckscher, 2007). Ritz
Carlton, for example, solved a customer complaint regarding slow elevators by
creating a cross-functional team, consisting of housekeeping, laundry, and
room-service workers, which found out that the problem originated from poor
management of linens (Henderson, 1992). Employees also have to be able to
locate certain resources when needed. A working environment that is
characterized by weak ties that facilitate a broad reach across a wide range of
employees may be the most appropriate (Granovetter, 1973).
Various management practices can be used to motivate employees to deliver
expressive service. First, personalization of service requires that employees be
empowered with discretion (Burns & Stalker, 1961; Lawrence & Lorsch, 1967) to
cater the service to meet customers’ demands. A key to enhanced flexibility is to
implement “high involvement” practices to empower employees (Batt, 2002;
Horwitz & Neville, 1996). Horwitz and Neville (1996) specified four levels of
involvement: level 1 is a production-line approach as advocated for the

40
efficiency-HRM system; level 2 is called “suggestion involvement”, where formal
channels are provided for employees to make suggestions as mentioned in the
quality-HRM system; level 3 is “job involvement”, where employees are
harnessed with a considerable amount of freedom to carry out their work; and
level 4 is “high involvement”, where practices such as information sharing,
teamwork, problem solving, participation in decision making, profit sharing, and
employee ownership are emphasized (Horwitz & Neville, 1996). These later two
levels are most desirable under this strategic context, so as to allow employees to
maintain a one-on-one service relationship and be responsible for the entire
customer service process (Hartline, Maxham Iii, & Mckee, 2000; Mills et al.,
1983). Employees have opportunities to perform a wide array of service tasks
upon requests of the customer, are able to seek information and resources from
others, are able to continuously learn new knowledge and skills, and are able to
flexibly cater service to meet the customers’ needs (Batt, 2002).
Because both employees and customers have discretion and choices, it is
unrealistic to use control mechanisms to standardize performance. Instead, a
climate should be cultivated to establish a norm of flexibility (Bowen et al., 1989;
Hartline et al., 2000). In addition, it is also difficult to use a precise job
description when employees are facing idiosyncratic customer needs (Wright &
Snell, 1998). Therefore, employees need to decide how to behave according to
customers’ needs and solve problems both “off-line” and “on-line” (Batt, 2002;

41
Hartline et al., 2000).
In order to motivate employees to serve customers in an expressive manner, it
is important to recognize individual performance and tie rewards to
individual-based service excellence. In other words, individuals are held
accountable for one-on-one customer service (Heckscher, 2007). Even though
teamwork is desired, the relationships are temporary problem-solving teams rather
than functional teams, thus the use of individual incentives and rewards can be
effective. In particular, as customers’ requests and subsequent employees’ service
outcomes may vary substantially, it is reasonable to use “behavioral” criteria
rather than using quantifiable outcomes (Schuler & Jackson, 1987).
Behavior-based evaluations can also accurately capture the critical process of
interpersonal interaction and effectively encourage employee discretion (Hartline
et al., 2000).
To ensure that individual customers are well served, customer needs and
expectations need to be responsively attended to (Johnson, 1996; Schneider et al.,
1992). This can be achieved by collecting customer responses regarding their
personal preferences and experiences before, during, and after service (Bowen et
al., 1989). Organizations also benefit from clarifying customers’ roles in the
service processes, and informing customers of the service processes (Bowen et al.,
1989).
In a nutshell, flexibility-oriented HRM practices that are effective for

42
customer intimacy include selective hiring and extensive training on generalized
skills, performance evaluation and compensation based on individual performance,
promotion and problem solving teams across departments, broad job descriptions,
employee involvement, instant information sharing systems, and external
feedback.
Hypothesis 2c: For firms that focus on customer intimacy, implementing
flexibility-oriented HRM is more likely to enable delivering expressiveness to
customers than not implementing such HRM. Flexibility-oriented HRM does not
contribute to strategic capabilities of other strategic foci.
Differentiation on Strategic Positions
So far I have discussed the strategic capabilities for different service foci and
the suggested HRM systems for creating the desired strategic capabilities.
Although HRM researchers often emphasize one set of practices within
organizations, a universal application of HRM practices across the entire
organization is neither practical nor efficient (Becker et al., 2009). Instead, recent
arguments frequently iterate the importance and effectiveness of HRM
differentiation within organizations for two major reasons (Zhou & Hong, 2008).
On the one hand, from a “bottom-up” perspective, different employee human
capital may take on different strategic roles for companies, depending on
employees’ value to the competitive advantage of the firm, and the uniqueness of
employees’ skills (Lepak & Snell, 1999). While it is desirable to invest in both

43
core and non-core employees, the costs of doing so may simply outweigh the
benefits (Cappelli & Neumark, 2001), thus it is more cost-effective to focus on
employees of high strategic value (Delery & Shaw, 2001; Huselid et al., 2005a).
On the other hand, employing a “top-down” perspective, depending on
organizations’ strategic capabilities and key processes, the jobs or positions that
employees hold are afforded with different strategic value (Huselid et al., 2005a).
Strategic positions are those that are 1) critical to the success of organizations’
strategy; and 2) have a potential for performance improvement among the job
holders (Huselid et al., 2005a). For example, Nordstrom excels at providing
expressive service, thus their sales associates are of critical value; whereas Costco
is known for its large scales of tangible products, thus their purchasing and
logistic staff may be the most strategic (Huselid et al., 2005a). Although
differentiation based on jobs widely exists in many organizations (Jackson et al.,
1989), it is important to ensure that strategic positions are properly invested on
and managed to create strategic capabilities.
Managers not only need to implement the right HRM practices, but also
ensure that these practices are applied to the most strategic people (Delery &
Shaw, 2001). According to Wright et al. (2001), “one can hardly conceptualize a
firm capability or competency absent the people who comprise them nor the
systems that maintain them” (p. 711). One important role of HRM, therefore, is to
identify the strategic capabilities and subsequently strategic employee groups, and

44
to effectively acquire, develop, utilize, support, and retain these employees
(Huselid et al., 2005a).
Take the hospitality industry for example, different employee positions
exhibit different levels of importance depending on the hotels’ strategic focus.
Studies found that in mid-scale leisure- and business-class hotels, front desk
accounted for most of the variance in customer perceptions of quality, followed
by housekeeping, while room service, bellmen, and parking did not significantly
influence customers’ quality perceptions (Hartline, Wooldridge, & Jones, 2003).
In a different hotel sample, however, parking staffs were among one of the most
important groups that determined customers’ perceptions of service quality
(Hartline & Jones, 1996). Different employee groups may display different
strategic value because their work means differently to their targeted customers.
For hotels emphasizing operational excellence, the strategic positions include
back-of-the-house employees that maintain hotel efficiency and low cost, such as
operations; likewise, for hotels that focus on product leadership,
back-of-the-house positions are critical for ensuring the quality of tangibles; for
hotels delivering customer intimacy, front-of-the-house positions that are unique
to this segment are most influential in impressing customers with their expressive
service.
Taken together, I propose that the capability to identify strategic positions is a
necessary condition for service organizations to strategically manage their human
45
resources. This is all the more important when businesses start to realize different
values of different types of human capital and apply differential human resource
management configurations towards them (Lepak & Snell, 1999; Lepak & Snell,
2002). In fact, previous HRM studies acknowledged that high performance work
practices were often not applied universally to all employees. Instead, researchers
operationalized the measures as the percentage of employees that were exposed to
a certain practice (Huselid, 1995; Macduffie, 1995). Therefore, it is critical to
ensure that high performance work practices are directed to the most strategic
positions of organizations.
Hypothesis 3: An alignment between firms’ strategic focus and strategic
positions is more likely to create desired strategic capabilities.
Hypothesis 3a: For firms that focus on operational excellence, an emphasis
on back of the house employees is more likely to enable delivering
instrumentality to customers. Strategic back of the house positions do not
contribute to strategic capabilities for customer intimacy.
Hypothesis 3b: For firms that focus on product leadership, an emphasis on
back of the house employees is more likely to enable delivering quality tangibles
to customers. Strategic back of the house positions do not contribute to strategic
capabilities for customer intimacy.
Hypothesis 3c: For firms that focus on customer intimacy, an emphasis on
front of the house employees is more likely to enable delivering expressiveness to

46
customers. Strategic front of the house positions do not contribute to strategic
capabilities for product leadership or operational excellence.
----------------------------------------------
Insert Table 2 and Figure 1 about here
-----------------------------------------------
Pilot Study I
So far I have discussed the strategic foci, strategic capabilities, suggested
HRM systems, and strategic positions for service organizations. Researchers
suggest that it is more appropriate to use a single industry when cross-firm
comparisons on practices and performance are needed (Becker & Gerhart, 1996;
Ichniowski et al., 1997). The hypotheses will be tested using the hospitality
industry in this study. Hospitality industry is a service and labor intensive industry.
It is ideal for studying strategic foci and strategic capabilities as the industry
standards such as Mobil Travel Guide and AAA have established proxies for a
variety of strategic foci, which widely range from 1 to 5 star or diamond levels. It
is also appropriate for studying HRM systems and strategic positions as human
resources are often considered a critical asset for labor intensive service
organizations (Mills et al., 1983; Terpastra & Rozzel, 1993) such as hotels and are
often organized into functions that serve different aspects of customer stays.
Pilot study I is aimed at pre-testing the research hypotheses using customers’
perspectives. According to marketing research, prior to customers receive service,

47
they have a predictive expectation of service quality. Customers from different
market segments or in different situations anticipate different services (Schneider
et al., 2000). Factors contributing to predictive expectations include past and
recent experiences, second-hand experiences from word-of-mouth and advertising,
social economic status, and geographic location etc. (Boulding et al., 1993;
Ziethaml et al., 1993). Predicted service quality was shown to be positively
related to actual service perceptions and satisfaction (Fornell et al., 1996; Hamer,
2006; Voss, Parasuraman, & Grewal, 1998). Also, customers compare the service
they receive to their expectation and form their perception of quality and
satisfaction accordingly (Ziethaml et al., 1993). Customer satisfaction, in turn, is
translated into loyalty, willingness to pay a premium, word-of-mouth, and
subsequently financial profits (Reichheld & Sasser, 1990; Szymanski & Henard,
2001). Therefore, an important capability of hotels is to understand and meet
customers’ expectations better than competitors.
Hypothesis 1 predicts that there are heterogeneous strategic capabilities that
are important for hotels with different strategic foci to succeed. The reason is that
hotels of different segments target different customers who have certain predictive
expectations. As such, the desired service quality to win those customers is
different from one hotel to another. Specifically, hotels that focus on operational
excellence need to be able to deliver instrumentality to customers in order to
succeed (Hypothesis 1a), such as reliability and responsiveness; hotels that focus

48
on product leadership need to be able to provide quality tangibles (Hypothesis 1b);
for hotels that focus on customer intimacy, the ability to deliver expressive
service, such as empathy and assurance, is critical (Hypothesis 1c). Therefore,
Pilot study 1 is designed to understand customer expectations of different hotel
segments, and what distinguishes hotels among their competitors within their
segment in winning customer satisfaction.
Methods
Data collection
Following the sampling strategy used in previous research that examined
customer perceptions (Liao, 2007), forty eight master students enrolled in a
research methods course at a large US university collected data as part of their
course requirements. The students received training on data collection and obtained
certification from the university Institutional Review Board. They were placed into
3 to 4 person groups to collect 20 to 30 surveys per group from random customers
who had a hotel stay in the past year. The respondents were asked to recall a recent
hotel stay experience and indicate their expectations and perceptions of service
quality before and after their stay. Further, to make the sample as representative of
the general population in the U.S. as possible, the students were asked to have
approximately 50% men, 50% women, and around 30% ethnic minorities in their
sample. They were also instructed to reach out to people of different ages but who
were at least 18 years old and to administer the surveys in diverse locations. The

49
respondents were assured of research anonymity. There was no monetary
incentive for the study.
Participants
A total of 416 respondents approached by graduate students of a management
school participated in this study. The response rate was 95%. Respondents’ mean
age was 31 years. Of those who indicated their gender, 162 were men and 251 were
women; the gender ratio of the sample may be due to the fact that students
involved in the management school were predominantly female. The ethnicity of
respondents also roughly corresponded to the general population of the United
States: 47.5% were whites, 9.2% were blacks, 10.1% were Hispanics, 28.8% were
Asians, 3.1% American Indians, and 1.2% others. Only 20.3% of the participants
had a below college degree education; 40.1% had college education; and 37.9% had
post-graduate education. The occupations of participants were predominantly
professional, students, management, and administrative staff.
Measures
Service quality. Customer expectations (worded as “Before arriving at the
hotel, I expected that the hotel would have the following quality”) and actual
experiences (worded as “When staying at the hotel, I experienced that the hotel
had the following quality”) of service quality were measured using 22 items
(repeated for expectations and experiences) from the SERVQUAL instrument
(Parasuraman et al., 1994) and 3 items from service personalization (Mittal &

50
Lassar, 1996), which consisted of 5 sub-dimensions: reliability (5 items; e.g.,
“Dependability in handling customers' service problems”), tangibles (4 items; e.g.,
“Visually appealing facilities”), responsiveness (4 items; e.g., “Prompt service to
customers”), assurance (4 items; e.g., “Employees who have the knowledge to
answer customer questions”), and empathy (8 items; e.g., “Employees who deal
with customers in a caring fashion”; “Employees display personal warmth in their
behavior”). The response format was a 5-point likert type scale ranging from 1 =
very inaccurate to 5 = very accurate. The reliabilities for the five dimensions of
expectations of service quality ranged from .86 to .91; for experiences of service
quality, the reliabilities for the five dimensions ranged from .85 to .93. The
averages of each sub dimension were used as construct scores for customer
expectations and experiences of service quality.
Customer satisfaction. Customer satisfaction with the hotel stay was
measured using two items: “Please tell us your overall satisfaction with the hotel
quality (e.g. room, comfort, facility, value for money etc.)”, and “Please tell us
your overall satisfaction with the hotel service (e.g., experience with the staff and
service)”. The response options ranged from 1 = very dissatisfied to 5 = very
satisfied. The reliability for the two items was .83. The average of the items was
used as an indicator of overall satisfaction.
Strategic focus. Hotel star levels were used as a proxy for strategic foci.
Specifically, according to Mobil Travel Guide, the hotels were categorized into

51
three major segments: limited-service hotels included 1 to 2 star hotels, which
were considered to compete on operational excellence; full-service hotels
included 2.5 to 3.5 star hotels, which focused on product leadership; and luxury
hotels included 4 stars and above, which according to Mobil Travel Guide,
excelled on customer intimacy.
Results
Table 3 presents the descriptive statistics, reliabilities, and correlations of
study variables. ANOVA analyses of expectations and experiences of hotel
service quality across the three hotel segments were conducted as shown in Table
4. Results showed that customers’ expectations of hotel service quality were
consistently high for all hotels, except the expectations of empathy were higher
for full service (M = 4.23) and luxury hotels (M = 4.31) than for limited service
hotels (M = 4.03).
Customers’ actual experiences with hotel service quality, however, varied
substantially across different hotel segments. In general, perceptions of service
quality increased as the hotel stars upgraded. In particular, customers’ actual
experiences on all five aspects of service quality were significantly higher for
full-service hotels (Ms range from 4.14-4.23) than for limited-service hotels (Ms
range from 3.79-3.93). In addition, customers’ perceptions of reliability, tangibles,
responsiveness, and empathy were significantly higher for luxury hotels (Ms
range from 4.17-4.43) than for limited-service hotels.

52
--------------------------------------
Insert Tables 3 and 4 about here
--------------------------------------
Pair-sampled T-tests on the comparisons between customer expectations and
actual experiences of service quality were also presented in Table 4. Although
customers’ expectations were high across all hotel segments, customer actual
experiences of service quality were consistently low, particularly for
limited-service hotels, leading to significant unmet expectations for all five
aspects of service quality (expectations for limited-service hotels ranged from
4.03-4.18; while actual experiences of service quality ranged from 3.79-3.93). For
full-service hotels, customers’ experiences were lower than expectations on
reliability (M = 4.22 vs. M = 4.33), responsiveness (M = 4.20 vs. M = 4.30), and
empathy (M =4.14 vs. M =4.23). For luxury hotels, there were no significant
differences between customer expectations and experiences of hotel service
quality, suggesting general met expectations for all five aspects of service quality.
Hypothesis 1 predicts that strategic capabilities vary according to service
organizations’ strategic foci. Therefore, it is important to understand for each
segment, on which aspects of service do organizations excel in meeting
customers’ expectations is the most important for customer satisfaction. I
regressed customer satisfaction on the difference scores between experiences and
expectations, using reliability and responsiveness in the first step, tangibles in the

53
second step, and assurance and empathy in the third step. Results shown in Table
5 suggested that different strategic capabilities were important for winning
customer satisfaction among different hotels segments. For limited-service hotels,
meeting customers’ expectations on responsiveness significantly predicted
customer satisfaction (b = .29, p < .05), partially supporting hypothesis 1a that the
strategic capability for operational excellence was the ability to deliver
instrumentality (fast service). For full-service hotels, meeting customers’
expectations on tangibles significantly predicted customer satisfaction (b = .21, p
< .05), supporting hypothesis 1b that the strategic capability for product
leadership was the ability to deliver quality tangibles. For luxury hotels, meeting
customers’ expectations on empathy significantly predicted customer satisfaction
(b = .81, p < .05), partially supporting hypothesis 1c that the strategic capability
for customer empathy was the ability to deliver expressive service to customers
(empathy). Therefore, hypothesis 1 was generally supported that different sets of
strategic capabilities that were closest to the strategic foci predicted customer
satisfaction for the three hotel segments.
Discussion
Pilot study 1 provided some support for Hypothesis 1 that different strategic
capabilities were meaningful for different strategic foci. This suggests that there is
no one best way to succeed, but multiple capabilities that service organizations
can compete on given their strategic focus. Customers’ demand diversity has been

54
considered as one influential factor in the service delivery and management
process (Larsson & Bowen, 1989). For the hospitality industry, the industry
standards established by Mobil Travel Guide and AAA have prescribed certain
qualifications that hotels need to have in order to be a star hotel. However,
meeting industry standards or advocating for a generic market positioning strategy
does not automatically lead to competitive advantages, or at least not sustainable
competitive advantages. According to resources- and capabilities-based view,
sustained competitive advantages rest on the assumption of heterogeneity,
rareness, and complexity (Barney, 1991; Reed & Defillipi, 1990), not universality
and standardization. In order to possess the right strategic capabilities that are
essential for service organizations’ strategic focus, organizations need to first
understand what their customers expect, and what competitors provide, and then
exceed competitors on the capabilities that matter most to customers.

55
Pilot Study II
Pilot study I, using customers’ perspectives, provided some support for the
linkage between strategic foci and strategic capabilities. Pilot study II was
conducted using a qualitative approach (interviews with hotel general managers)
to further tailor the model and the measures to the hospitality industry.
Specifically, the purposes of pilot study II were four folds. First, it was intended
to understand the categorization of strategic foci for the hospitality industry. The
research hypotheses for three dimensions of strategic foci were based on literature
review on service and strategic management as well as the definitions by Mobil
Travel Guide. It would be more applicable to the hospitability industry if inputs
from hotel managers were incorporated into the framework. Second, I also wanted
to understand the theoretical linkages between strategic capabilities and strategic
foci using managers’ perspectives. Third, the configurations of suggested human
resource management profiles were based on previous strategic HRM research
and theory. It was necessary to tailor the measures of HRM to reflect industry
practices. Fourth, I also wanted to understand the actual practices in which
different jobs and positions were endowed with different strategic value or
managed differently in order to refine the hypothesis of differentiation based on
strategic positions.
Method
Semi-structured interviews were conducted with three general managers of
56
three and four star hotels in New York City and New Jersey. All hotel mangers
had experience managing multiple hotels. The study was approved by the
Institutional Review Board of the university. The managers’ contact information
was obtained from the New York City and New Jersey hotel associations.
Invitation emails were sent explaining the purpose of the study and inviting them
to participate in the interviews. Ten dollars were donated to Mercy Corp
designated to the China Quake Relief on behalf of each participant as an
incentive.
Five out of ten randomly selected managers responded with an interest to
participate in the study, leading to a response rate of 50%. However, two
managers had schedule conflicts and were not able to finally participate in the
study. The participants were provided with an informed consent form which
ensured research confidentiality. Each interview lasted between 30 minutes to 1
hour, during which participants were asked questions regarding hotel strategies,
customer expectations, human resource management practices, and position
differentiation. One manager was not able to commit to an interview and
completed the open-ended questions in writing.
Results and Discussions
The results of the interviews were summarized in Tables 6-9. Overall, the
interviews reinforced the argument that parallel to the industry standards
established by Mobil Travel Guide and AAA, there was heterogeneity in hotels’
57
strategic focus, which broadly fell into three categories (Table 6). First, some
hotels focused on a lean structure and low price. Second, some hotels competed
on tangibles. For example, as one manager indicated, “our identity is a very good
location, very easy to get to, very good facility, it is the meeting room, the
technology, the layout that is very appealing to corporate meeting customers”.
Third, some hotels competed on superlative service. For example, a manager
described that they provided “a level of service that is relaxed yet refined. Very
down-to-earth staff who attempts to relate to our customers on a very human
level”.
--------------------------------
Insert Tables 6-9 about here
--------------------------------
The general managers indicated heterogeneous strategic capabilities that were
essential for their competitive advantage (Table 7). Such strategic capabilities
often originated from understanding and meeting the customers’ needs and
expectations. Some hotels focused on the instrumentality of a hotel stay. For
example, a manager indicated that their customers looked for “a comfortable bed,
an easy access, maybe …an attractive rate”. There were also customers who look
for high quality tangibles, such as “a good product, maybe a good room, a good
bed”, as one manager indicated. For hotels that competed on customer intimacy,
they needed to deliver expressive service to meet targeted customers’ needs, such

58
as to “address the guest by name”.
There were indications of differentiation between front- and
back-of-the-house positions (Table 8). According to a manager, a
front-of-the-house position is defined as “someone who interfaces directly with
the guests on a one-to-one basis, (such as) a housekeeper, a front desk agent, a
bell person”; a back-of-the-house position is “an area where you wouldn’t see a
guest, (such as) the kitchen, the shipping area”. Due to the difference in job
location, there were different practices that were applied to front- and back- of the
house. For examples, in selecting and training employees, managers indicated that
there was a greater emphasis on “personality and presentation” for
front-of-the-house positions, while for back-of-the-house, attention was directed
to “the ability to interact with co-workers and supervisors” and “technology
awareness”. Performance evaluation was more concrete and objective for
back-of-the-house, while front-of-the-house evaluations relied on “customer
feedback which tends to favor negative responses over positive”. Empowerment
was more important for front than for back office. In addition, front-of-the-house
positions enjoyed broader promotion opportunities because as explained by one
manager, “the interaction with a variety of clients gives front office management
a more nuanced view that equips them to be better managers over the long run”.
In general, the general managers agreed that successful human resource
management was critical for the hospitality industry. As one manager put it: “this

59
type of business in particular, everything is about the people. You have to invest
in the people, you have to hire really good people, you have to educate them well,
give them the right tools to be able to execute. But everything from a human
resource standpoint is all about staff.” This echoes with researchers’ argument
that if manufacturing firms generally manage “things”, service firms mostly
manage “people” (Mills et al., 1983).
The general managers also provided fine distinctions of human resource
management practices which were roughly aligned with the hypothesized
strategic capabilities. For instance, in selecting and training employees, there were
emphases on extensive specialized skills selection and training versus superior
communication skills and extensive service training to all employees.
Empowerment also varied between different strategic capabilities. For some
hotels, empowerment took the form of suggestions, while other hotels empowered
completely. The idea was that “in the end the guest request has to be fulfilled,
irregardless of what that may be… So everybody has to have the feeling that they
can do whatever it takes”. Another example was feedback, which relied on either
internal audit and management evaluations, or external evaluation such as
customers and mysterious guests. Other details of HRM practices for different
strategic capabilities are summarized in Table 9.
In sum, the qualitative data provided general evidence for the research
framework and hypotheses about the heterogeneous strategic foci and associated

60
capabilities, differentiation of human resources management across different
strategic capabilities and also internally between different positions. The input
from general managers was also used to modify the surveys used in study 3.

61
Study 3
Pilot studies 1 and 2 provided some support for the research framework and
substantiated the appropriateness of the hospitality context in understanding the
research questions. Study 3 is an endeavor to formally test the research
hypotheses in a sample of hotels.
Methods
Participants and Procedures
Data were collected from two sources. First, survey data from managers were
collected through the Center for Hospitality Research (CHR) at Cornell
University’s School of Hotel Administration. The CHR is a leading research
institute for hospitality research, which publishes an academic journal, delivers
research reports, and provides industry tools. Individuals can register with the
CHR to gain access to research and related materials. To register, which is free of
charge, individuals are asked to provide email addresses and identify their
companies and positions. Initial invitations were sent via emails to about 1678
registered general managers (GM) of the hospitality industry from all over the
world. Of these, 128 bounced back, resulting in 1550 deliverable addresses. GMs
are the best informants of hotel management and performance. In order to avoid
single respondent bias and ensure reliability, the GMs were also asked to provide
contact information of the human resource manager of their hotels. An invitation
email was then sent to the human resource managers to complete a second survey.

62
Both GM and HR managers completed an online survey regarding their hotel’s
strategic positions, human resource management practices and financial
performance. As incentives for the participating hotels, they were provided with
an access to the study results developed as a research report by the center. For
hotels that had two responses from both the GM and human resource manager,
two t-shirts with the institution’s logo were given as gifts.
To enhance the response rate from hotels, three waves of reminders were sent
to remind the managers to complete the survey approximately three weeks, six
weeks, and nine weeks after the initial invitations were are sent out. A final usable
sample of 227 managers (including both general and HR managers) from 152
hotels located in 38 countries were obtained, leading to a hotel-level response rate
of 9.81%. A comparison of the responding hotels with 50 randomly selected
nonresponding hotels showed that there was no significant difference in hotel
types, stars, geographic locations, and average customer evaluations. Excluding
18 hotels that did not have a designated HR position or had undeliverable
addresses, 70 HR managers responded out of 134, thus the response rate for HR
managers was 52.2% of responding hotels. There was no significant difference
between hotels with single and multiple managers responding in terms of stars,
rooms, geographic locations, hotel types, percentage unionized, and financial
performance. The between-rater agreement of the 70 hotels that had multiple
respondents was described in the measures below.

63
In addition, archival data were retrieved from an online source,
Tripadvisor.com, which according to its online fact sheet, is one of the most
popular and unbiased user websites that collect more than 400,000 hotels’
information, including countries, locations, hotel types, star ratings, sizes of
facilities, price, and more than 20 million customer reviews.
Measures
Strategic focus. Hotel star ratings from Tripadvisor.com were used as a proxy
for strategic foci. Specifically, according to Mobil Travel Guide, the hotels were
categorized into three major segments. Limited service hotels included 1 to 2 star
hotels, which could be considered as competing on operational excellence; full
service hotels included 3 star hotels, which typically focused on product
leadership; and luxury service hotels included 4 stars and above, which according
to Mobil Travel Guide, excelled on customer intimacy. Dummy codes were
created for full service and luxury hotels, and limited service hotels were used as
the comparison group in the following regression analyses. Dummy codes of all
three types of hotels were used in the structural analyses.
Strategic capabilities. According to strategic management and HRM
researchers, strategic capabilities can be measured as the ability to convert given
inputs into desirable outcomes (Dutta et al., 2005; Wright, 1995). On the one hand,
important resources such as hotel properties and human capital should first be
taken into account. Information on resources and capabilities was obtained from
64
Tripadvisor.com. In addition, two items were used to measure the quality of
human capital of hotels (Subramaniam & Youndt, 2005). An example was “Our
employees are widely considered the best in our industry”. Cronbach’s alpha
was .73. The average was used as a control for human capital of hotels.
On the other hand, archival data from Tripadvisor.com were used as a proxy
measure of strategic capabilities of hotels. The strategic capabilities reflecting the
success of different strategic focus were measured by 1821 customers’
evaluations of the various aspects of their hotel stays in the most recent year (i.e.,
dated from January 2008 to February 2009 on TripAdvisor). Specifically,
instrumentality was measured by “value for money”; tangibles was measured by
the average of “rooms” and “cleanliness” (alpha = .94); expressiveness was
measured by the average of “service” and “check-in/front service” (alpha = .92).
Response scales ranged from 1 to 5. In order to aggregate the customers’ ratings
to the hotel level, the Intraclass Correlation Coefficients (ICC) were examined of
each indicator using null models of HLM. Results showed that ICC1s
were .14, .27, .30, .11, and .16, while ICC2s were .60, .74, .77, .52, and .61, for
value, rooms, cleanliness, check-in/front desk, and service, respectively. The
ICC2 values were in general comparable to the suggested cut-off value of .60
(Glick, 1985), indicating sufficient inter-rater consistency for data aggregation;
the low ICC2 for check-in/front desk may be due to the reasonable variation in
individual customers’ experiences in these aspects in the “pseudo” service

65
relationships (Gutek et al., 1999) with different employees. The ICC1 values were
also generally consistent with the reported mean value of .12 (James, 1982),
indicating substantial variance between hotels as compared to within hotels. In
addition, the median rwg(j) (James, Demaree, & Wolf, 1984) of the five items
was .80, indicating sufficient inter-rater agreement among customers. Therefore,
the customers’ ratings were averaged to the hotel level and used in the subsequent
analyses.
Strategic positions. Strategic positions were measured by having mangers
“place each employee group into a category that describes their role in
implementing the hotel’s strategy indicated above”. There were 11 front of the
house positions, such as “Front desk staff”, “Concierges”, and “Maids and room
service staff”; and 9 back of the house positions, examples were “Cashiers and
accounting”, “Purchasing staff”, and “Kitchen staff”. Four response categories
were adapted from Huselid et al. (2005): “N/A” (coded as 0), “Surplus positions
(C positions that do not have a strategic impact but may be needed for running the
hotel; coded as 1)”, “Support positions (B positions that have an indirect impact
on implementing the hotel’s strategy but are essential for running the hotel; coded
as 2)”, and “Strategic positions (A positions that have a direct impact on
implementing the hotel’s strategy; coded as 3)”.
As the list of hospitality front- and back-of-the-house positions were
generated using archival data and from interviews with hotel managers, an

66
exploratory factor analysis was used to identify the groupings of positions that
tended to get the same emphasis in hotels. Using principal component analysis
with Varimax rotation, five components emerged, explaining 61.26% of the
variance in positions (Table 10). Component 1 consisted of doormen, bell
attendants, parking, concierges, entertainment, and security officers, which was
broadly considered as front-of-the-house service staff. Component 2 included
many back-of-the-house operation positions, such as housekeeping, maids and
room service, operation/engineering, and front desk thus was named as such.
Component 3 was called administrative staff and included auditing, clerks,
cashiers and accounting, and purchasing staff. Component 4 was mostly activities
staff, involving kitchen, food and beverage, event planners, and sales persons.
Finally there was also a separate component of call center staff, such as
reservation and customer service. Therefore, the means of each component were
used as indicators of the five types of strategic positions. In particular, in order to
test the hypotheses, I consider back-of-the-house operation staff as strategic to
operational excellence and product leadership, and front-of-the-house service staff
as critical for implementing customer intimacy.
The ICCs and rwg were also examined of general and HR managers’
responses of strategic positions to ensure appropriateness of data aggregation. For
back operation, ICC1 = .10, ICC2 = .12, median rwg(j) = .97. For front service,
ICC1 = .70, ICC2 = .76, median rwg(j) = .92. For call center, ICC1 = .22, ICC 2

67
= .30, median rwg(j) = .97. For administration, ICC1 = .32, ICC 2 = .40, median
rwg(j) = .95. For activity, ICC1 = .62, ICC2 = .70, median rwg(j) = .97. The high rwg
values justified the aggregation of responses of strategic positions to the hotel
level (Kozlowski & Hattrup, 1992). The relatively low ICC2 values for
back-of-the-house operation, call center, and administration positions may be due
to the small number of respondents from each hotel (general and HR managers).
Thus, using the averages of each hotel might underestimate the relationships of
interest (Bliese, 2000).
---------------------------------
Insert Table 10 about Here
---------------------------------
Human resource management practices. HRM practice measures were
adapted from multiple previous studies (Delery & Doty, 1996; Ichniowski et al.,
1997; Macduffie, 1995; Schneider, White, & Paul, 1998; Youndt et al., 1996), as
well as from the interviews with hotel managers to cater to the context of hotel
and service management. The response options were in a 5-point Likert scale
format: 1 = strongly disagree and 5 = strongly agree. Ten practices (selection,
training, performance evaluation, compensation, promotion, teamwork, job
description, participation, information sharing, and feedback) were measured with
27 items which were tailored to reflect a focus on efficiency, reliability, and
flexibility, respectively. For example, selective hiring was measured using four
68
items (e.g., “General service orientation / demeanor are used as important hiring
criteria” reflecting low investment on selection vs. “Previous experience /
professional training on specific tasks are used as important hiring criteria”
reflecting selection based on specialized skills); teamwork was measured with two
items: “Management places a great deal of importance on developing formal work
teams within each department” reflecting a focus on functional work vs.
“Management places a great deal of importance on developing problem-solving
teams across departments” reflecting a focus on cross-functional work);
participation was measured using two items, including “Employees are provided
with the opportunity to suggest improvements in service processes” reflecting a
modest degree of involvement, and “Employees are allowed to make many
decisions on how to provide service” reflecting high involvement.
HRM practices were measured with reference to the strategic positions,
following the previous approach of measuring HRM as applied to the core
employees (Batt, 2002; Delery & Doty, 1996; Osterman, 1994). The focus of this
study is to measure whether organizations with different strategic foci differ in
their HRM practices for the most strategic employees, instead of repeatedly
measuring all HRM systems among all possible positions. The latter is considered
an ideal way to understand differentiation (Zhou & Hong, 2008) but is beyond the
scope of this study.
The profile deviation approach prescribes a recommended score on each

69
HRM practice dimension for each strategic focus. Following procedures
suggested by previous researchers (Venkatraman, 1989), these recommended
scores were obtained by 1) using the hypotheses above to identify the practice
focus for each system, such as set rates for an efficiency HR system, pay for
collective performance for a reliability HR system, and pay for individual
performance in a flexibility HR system, and 2) benchmarking empirical data (the
suggested scores were approximately equivalent to one standard deviation above
the means of the top ten percent performing firms of each segment, such that the
items that had low overall means did not have a disproportional impact on the
overall deviation). A complete list of the items and suggested profiles were
attached in the Appendix. The inverse means of the absolute deviations from
suggested were used as indicators of the suggested profile of each HR system.
HR systems were reported by both general and HR managers, thus inter-rater
reliability (ICC) and agreement (rwg) were calculated to ensure appropriateness of
data aggregation. For efficiency-oriented HR system, ICC1 = .57, ICC2 = .66,
median rwg(j) = .95. For reliability-oriented HR system, ICC1 = .50, ICC2 = .60,
median rwg(j) = .94. For flexibility-oriented HR system, ICC1 = .50, ICC2 = .59,
median rwg(j) = .93. The high rwg(j) values supported the aggregation of reports of
HR systems to the hotel level.
Financial performance. Three indicators that were commonly used in the
hospitality industry to benchmark competitors were used to measure hotels’
70
financial performance: revenue per available room (RevPAR), occupancy rate,
and gross operating profit per available room (GOPPAR). Both general managers
and HR managers were asked to report the financial performance of their hotels.
For RevPAR, ICC1 = .94, ICC2 = .95; for occupancy, ICC1 = .87, ICC2 = .91;
for GOPPAR, ICC1 = .78, ICC 2 = .83, which indicated a high within-group
consistency and high between-group variance. The financial indicators from
managers of each hotel were averaged. Following previous studies (Macduffie,
1995), the 10-base logarithms of three performance indicators were taken as
dependent variables in order to ensure comparable ranges between variables.
Control variables. Following previous studies (Sun, Aryee, & Law, 2007), a
few control variables were included in the measure to account for property
differences between hotels, which included hotels’ resources (location, number of
rooms, number of full-time and part-time employees, property type, and human
capital), ownership, management, and percentage unionized. The interviews with
general managers revealed that unionization played an important role in managing
certain hotels, such as in New York City, where the Trades Council collective
bargaining regulated certain employee management practices across all hotels as
well as sometimes specific to each hotel, including job description, scheduling,
overtime, time off, pay level, disclosure, discipline etc. It also limited flexibility
in adopting new practices as any changes to past practices were automatically
subject to collective bargaining. Therefore, percentage unionized was included as
71
a control variable.
Analysis Strategies
Based on the research hypotheses, the level of analysis was at the hotel level.
Researchers argued that the choice of levels of analysis should be according to the
HRM variables of interest (Becker & Huselid, 1998). HRM measured at a higher
level may be more generalizable while it may be more accurate and reliable at a
lower level (Gerhart, Wright, Mcmahan, & Snell, 2000). In this case, it is
reasonable to believe that there is substantial and meaningful variance of HR
practices, strategic positions, and capabilities across hotels, as previous research
has frequently shown significant between-store/branch differences even within the
same company (Liao & Chuang, 2004; Liao et al., 2009).
The analysis of hypotheses involves multiple alignments: the alignment
between strategic focus and strategic capabilities (Hypothesis 1), between
strategic focus and human resource management configurations (Hypothesis 2),
and between strategic focus and strategic positions (Hypothesis 3). Researchers in
strategic management and HRM research have called for more careful and
accurate conceptualizations and measurements of fit (Chadwick, In Press;
Venkatraman, 1989), which will be used as guidelines for analyses in this study.
First, with regards to the linkage between strategic focus and strategic
capabilities, according to the previous hypotheses development, the success of a
strategic focus is created by building the right strategic capabilities, suggesting

72
that different capabilities may display a different relationship with financial
performance for different strategic foci. This was tested using fit as moderation.
All three capabilities were entered into the prediction of financial performance, as
well as their interactions with hotel stars.
Second, the alignment between human resource management and strategic
foci was tested using both theories of fit as profile deviation and fit as moderation.
Fit as moderation was most commonly used in previous studies to test the fit
between HRM and strategy (Youndt et al., 1996). In this case, fit as profile
deviation was also used because according to the hypotheses development above,
in order to develop desired strategic capabilities, it is important that firms
configure heterogeneous sets of coherent HRM practices that will serve that
purpose, i.e., an emphasis on the system’s perspective. As the systems of HRM
practices that are suggested for different hotel stars are different, not only in terms
of practice focus, but also in terms of magnitude, these are better captured in
specified profiles (Venkatraman & Prescott, 1990). In addition, while traditional
fit as moderation approach often takes an additive approach in which more HRM
practices are considered better (Becker & Huselid, 1998; Delery, 1998), the
suggested profiles here emphasize the “right” amount. A simple additive approach
also implies that the practices are substitutive of each other (there is equifinality
among practices). In my hypotheses, however, the HRM configurations have
internal coherence and one practice will demand that other practices are in place

73
in order to be effective (such as functional teamwork and collective rewards vs.
cross-functional teamwork and individual rewards). Researchers suggested that
profile deviations approach was the most appropriate for testing this type of
configurational hypotheses (Delery & Doty, 1996).
As such, following previous studies (Delery & Doty, 1996; Venkatraman &
Prescott, 1990) and according to the hypotheses developed above, a suggested
profile of each HRM configurations was established first by using hypotheses to
identify the practices that were most relevant for each system, then by assigning
each identified practice a value approximately equivalent to one standard
deviation above the means of the top ten percent performing firms, and then the
inverse means of the absolute deviations from the suggested profile were used to
predict the possession of strategic capabilities, along with their multiplication
with hotel stars. Examples of suggested profiles were attached in the Appendix.
Third, following Huselid (1995) and Lepak and Snell (2002), fit as matching
along with fit as moderation were used to test the alignment between strategic foci
and strategic positions. Fit as matching is most appropriate for testing the
theoretical linkages between variables (i.e., strategic positions for different star
levels) without referent to an external criterion (Delery, 1998). The matching of
back-of-the-house positions for limited-service and full-service hotels, and
front-of-the-house positions for luxury hotels was based on hypotheses stated
above. Then, the interactions between the value of these matched positions and
74
hotel stars were used to predict the creation of strategic capabilities.
In the following analyses all managers’ responses were aggregated to the hotel
level. I used both traditional regression approach as well as structural equation
modeling (SEM) to test the interactions. Specifically, in Tables 12-14, multiple
regressions were used with financial outcomes as dependent variables and service
strategy, strategic capabilities and their interactions as independent variables,
along with control variables. In Tables 15-17, capabilities were entered as
dependent variables and service strategy, HRM, positions, and their interactions
were entered as independent variables, along with control variables.
I also examined the hypotheses using path analysis and the LISREL 8.71
software (Jöreskog & Sörbom, 1993). SEM has its advantage in that it can
simultaneously estimate multiple relationships and take into account measurement
errors (Anderson & Gerbing, 1988). Specifically, I employed the scale scores as
single indicators approach (Mathieu, Tannenbaum, & Salas, 1992), which was
recommended as the most friendly approach for estimating multiple interactions
(Cortina, Chen, & Dunlap, 2001). Due to the relatively large numbers of missing
values of GOPPAR, I did not include it in the analyses to preserve a larger sample
size for modeling. In order to avoid unidentified models, I only included the paths
and interaction terms that were most directly relevant to the research hypotheses,
such that the cross-multiplications of all positions and all star levels were not
included. For the same reason, I separated the interactions of hypothesized

75
variables with each star level, namely limited service (H1a, H2a, and H3a), full
service (H1b, H2b, and H3b), and luxury hotels (H1c, H2c, and H3c) using three
models (Dulac, Coyle-Shapiro, Henderson, & Wayne, 2008), in addition to the
baseline model without the interactions. In each model, the interaction terms
between star level and capability, HR, and positions were entered along with their
main effects. Paths between the manifest and latent variables were set to the
square root of the reliability of the measure; the error variances of the manifest
variables were set to one minus the reliability times the variance of the measure.
For those single item measures of hotel star, LogREVPAR, LogOccupancy, and
Value, the reliability was set at .95.
Results
The means, standard deviations, and reliability of variables, as well as
correlations between variables were presented in Table 11. Overall, the financial
performance indicators were significantly related to the capabilities as rated by
customers. In particular, RevPAR was significantly related to value, tangibles,
and service, and tangibles was also related to Occupancy and GOPPAR. The
strategic focus as indicated by hotel stars, however, generally did not significantly
correlate with financial performance except luxury hotels with RevPAR,
reinforcing the argument that it was not the positioning strategies but the actual
capabilities that determined competitive advantages of organizations. The
capabilities to deliver value, tangibles, and service, in turn, were correlated with

76
the emphasis on certain positions. In addition, hotels’ size, union percentage,
location, country, type, ownership, and management were also related to some
indicators of financial performance and capabilities. In particular, the number of
full-time employees was related to ratings of tangibles. Union was correlated with
RevPAR and tangibles. Hotels in North America were generally lower in ratings
of value and tangibles. Urban hotels were higher in occupancy and GOPPAR,
while suburb hotels were higher in RevPAR as compared to the other locations
including vacation destinations. Hotels were higher in occupancy and GOPAR but
lower in RevPAR as compared to other property types such as resorts. Hotels
owned by franchised companies were lower in RevPAR but higher in occupancy
as compared to other ownership types. Hotels managed by management
companies were lower in ratings of tangibles.
--------------------------------------
Insert Table 11 about Here
--------------------------------------
Strategic Capabilities
Hypothesis 1 predicts that for hotels with different strategic foci, different
strategic capabilities contribute to hotels’ financial performance (H1a: value
creation capability for limited-service hotels; H1b: tangibles delivery capability
for full-service hotels; H1c: service delivery capability for luxury hotels). Tables
12, 13 and 14 present the regression results of the prediction of three indicators of

77
financial performance, respectively. Results in Model 1 (in Table 12) showed that
value significantly predicted RevPAR (b = .09, p < .01), and tangibles (Model 2s)
significantly predicted all three financial indicators (b = .25, p < .001 for RevPAR;
b = .07, p < .01 for occupancy; and b = .27, p < .05 for GOPPAR, respectively).
Service, in contrast, did not have a significant main effect on financial
performance. In addition, as shown in Model 6 of Table 12, the multiplications
between service and hotel stars explained significant additional variance of
RevPAR above all main effects (∆R2 = .04, p < .05), suggesting a significant
interaction.
Figures 2 and 3 illustrates the plotting of interactions (Aiken & West, 1991)
between service and hotel stars. Hypothesis 1c predicts that service is critical for
hotels that aim at delivering customer intimacy (luxury hotels). Results provided
some support for this hypothesis: the interaction plot showed that service had a
positive slope in predicting RevPAR among luxury hotels (b = .12, t = 1.22, p
> .05), but not for full-service (b = -.10, t = -1.03, p > .05) or limited-service
hotels (b = .04, t = .389, p > .05). There was no significant interaction between
hotel stars and value and a marginally significant interaction between stars and
tangibles (p < .10 two-tailed or p < .05 one-tailed). The interaction plot in Figure
2 showed that tangibles had a positive relationship with RevPAR among all three
types of hotels, although the relationship was strongest for luxury hotels (b = .45,
t = 4.12, p < .001), as compared to b = .30, t = 3.43, p < .01 for limited service

78
hotels and b = .23, t = 3.37, p < .01 for full service hotels. This may suggest that
the capability to deliver tangibles is important for all hotel stars to gain
competitive advantage.
---------------------------------------------------------------
Insert Tables 12 - 14 and Figures 2 and 3 about Here
---------------------------------------------------------------
Table 18 presents the tests of hypotheses using SEM. In the first model, I
included all the main effects shown in Figure 16, excluding all interaction terms.
Specifically, this model included paths from value, tangibles, and service to
logRevPAR and logOccupancy, respectively, as well as paths from efficiency HR
and back operation positions to value, from reliability HR and back operation
positions to tangibles, and flexibility HR and front service positions to service.
Also included was covariance among value, tangibles, and service, as suggested
by the initial analysis. As shown in Table 18, this model provided a good fit to the
data (Hu & Bentler, 1999), χ2 = 26.73, df = 20, CFI = .99, RMSEA = .06. Figure
16 summarizes the significant coefficients. Consistent with regression, Tangibles
had a significant and positive relationship with LogRevPAR (β = .57, p < .001)
and LogOccupancy (β = .16, p < .001). When modeled along with Tangibles and
Service, Value had a negative relationship with LogRevPAR (β = -.45, p < .01)
and LogOccupancy (β = -.12, p < .05).

79
Figure 16 also suggested significant interactions between Value and limited
service hotels in predicting LogRevPAR (Hypothesis 1a), Tangibles and full
service hotels in predicting LogRevPAR (Hypothesis 1b), and Service and luxury
hotels in predicting LogOccupancy (Hypothesis 1c). Figure 17 showed that Value
was negatively related to hotel RevPAR for both limited service hotels as well as
other hotels. Figure 20 showed that Tangibles was positive related to hotel
RevPAR for both full service hotels as well as other hotels, which was consistent
with regression results. Figure 22 showed that Service had a negative relationship
with hotel Occupancy among other hotels except luxury hotels.
In sum, Hypothesis 1 was marginally supported in that service was a positive
predictor of financial performance only for luxury hotels, but not among other
hotel segments in the regression analysis. Although not hypothesized, the
capability to provide tangibles was important for all hotels’ financial performance
in both regression and SEM analyses.
--------------------------------------------------------------------
Insert Table 18 and Figures 16, 17, 20 and 22 about Here
--------------------------------------------------------------------
Suggested HRM Profiles
Hypothesis 2 predicts that hotels that adopt the suggested HRM profiles for
their strategy are more likely to create the desired strategic capabilities. The
regression results are demonstrated in Tables 15-17. Hypothesis 2a predicts that

80
operational excellence hotels (limited-service hotels) that adopt
efficiency-oriented HR systems are more likely to create the strategic capabilities.
This received some support. Model 3 of Table 15 showed that the interactions
between efficiency-oriented HR and hotel stars had a marginally significant effect
on ratings of value (p < .10 two-tailed or p < .05 one-tailed). The interaction plot
in Figure 4 showed that efficiency-oriented HR had a positive relationship with
value for limited-service hotels (simple slope b = 1.64, t = 1.85, p < .10 two-tailed
or p < .05 one tailed), but not for full-service or luxury hotels (simple slope b
= .32, t = .56, p > .05 and b = -.24, t = -.31, p > .05, respectively).
Hypothesis 2b posits that hotels competing on product leadership (full-service
hotels) are more effective when they adopt reliability-oriented HRM systems.
Results did not provide support for this hypothesis: reliability-oriented HRM and
hotel star’s multiplication did not predict tangibles (Model 4 of Table 16). Instead,
it marginally predicted (p < .10 two-tailed or p < .05 one-tailed) the capability to
deliver value (Model 4 of Table 15). The plot in Figure 5 showed that the
relationship between reliability-oriented HRM and value was more positive for
limited-service hotels than for full service hotels and luxury hotels.
Hypothesis 2c states that customer intimacy hotels (luxury hotels) need to
implement flexibility-oriented HRM systems to most effectively create strategic
capabilities. Results provided support for this hypothesis. Model 5 in Table 17
showed that the interaction terms between flexibility-oriented HR and hotel stars

81
explained significant additional variance of customer ratings of service above all
main effects (∆R2 = .06, p < .05). The interaction plot in Figure 10 illustrated that
the relationship between flexibility-oriented HR and ratings of service was
particularly positive for luxury hotels (simple slope b = .53, t = 1.73, p < .10) but
not among limited service hotels (b = .19, t = .44, p > .05) or for full service
hotels (b = -.50, t = -1.60, p > .05).
-----------------------------------------------------------------------
Insert Tables 15 - 17 and Figures 4, 5, and 10 about Here
-------------------------------------------------------------------------
Structural models in Figure 16 showed significant interactions between
Efficiency HR and limited service hotels in predicting value (Hypothesis 2a) and
Reliability HR and full service hotels in predicting tangibles (Hypothesis 2b). In
addition, Flexibility HR had a positive relationship with service (β = .27, p < .05).
Consistent with regression results, Figure 18 showed that Efficiency HR had a
particularly positive relationship with Value among limited service hotels but less
so for other hotels, providing support for Hypothesis 2a. Figure 21 showed that
Reliability HR had a significant relationship with tangibles among full service
hotels and in particular, full service hotels with lower Reliability HR had lower
customer evaluations of Tangibles than other hotels. This provided support for
Hypothesis 2b. There was no significant interaction between Flexibility HR and
luxury hotels.
82
Therefore, hypothesis 2 was partially supported in that efficiency-oriented
HR systems positively predicted ratings of value among limited-service hotels in
both regressions and SEM, reliability-oriented HR systems positively related to
ratings of tangibles among full service hotels in SEM, and flexibility-oriented HR
systems positively predicted ratings of service among luxury hotels in regressions.
---------------------------------------------
Insert Figures 18 and 21 about Here
----------------------------------------------
Strategic Positions
Hypothesis 3 posits that organizations also need to invest in the most strategic
positions in order to effectively create strategic capabilities (H3a: back operations
for limited-service hotels; H3b: back operations for full-service hotels; H3c: front
service staff for luxury hotels). Only one main effect in regressions was
significant (Model 3 of Table 15): back-of-the-house operation staff positively
predicted ratings of value among all hotels (b = .48, p < .05), suggesting that the
more hotels valued back of the house positions, the higher the hotels’ capability to
deliver value. In particular, hypothesis 3a posits that back-of-the-house positions
are strategic to the hotels that compete on operational excellence in creating value
for customers. The regression results in Models 6 and 7 of Tables 15 to 17
supported this hypothesis. Back-of-the-house operation staff and hotel star
interactions significantly explained additional variance not only in ratings of value

83
(∆R2 = .06, p < .05), but also in tangibles (∆R2 = .06, p < .05) and service (∆R2
= .06, p < .05). The interaction plots in Figures 6, 8, and 14 showed that
back-of-the-house operation staff consistently and positively predicted ratings of
value (simple b = 1.45, t = 3.34, p < .01), tangibles (simple b = 1.37, t = 3.12, p
< .01), and service (simple b = 1.09, t = 3.09, p < .01) among limited-service
hotels. Therefore, hypothesis 3a was supported. The same results (∆R2 = .05, 05,
and .07, respectively) and plots (Figures 7, 9, and 13) were found for call center
staff among limited-service hotels in predicting value (simple b = .42, t = 1.68, p
< .10), tangibles (simple b = .48, t = 1.93, p < .10), and service (simple b = .37, t =
1.87, p < .10). The interaction plots also revealed that back-of-the-house operation
staff did not positively predict capabilities to provide tangibles among full-service
hotels (b = .03, t = .00, p > .05), not supporting hypothesis 3b, nor did it predict
value (b = .15, t = .52, p > .05) or service (b = -.02, t = -.06, p > .05) in
full-service hotels. Likewise, back-of-the-house operation positions did not
predict capabilities of luxury hotels to provide value (b = .50, t = 1.37, p > .05) or
tangibles (b = .23, t = .62, p > .05).
Hypothesis 3c predicts that front-of-the-house service providers are strategic
to hotels that compete on customer intimacy (luxury hotels). Regression results in
Model 10 of Table 17 showed evidence of support for this hypothesis. The
interaction between front-of-the-house service employees and hotel stars
significantly added to the prediction of customer ratings of service (∆R2 = .06, p

84
< .05). The interaction plot in Figure 12 showed that front-of-the-house staff had a
positive relationship with ratings of service only among luxury hotels (simple
slope b = .39, t = 2.09, p < .05), but not among others (b = -.20, t = -1.10, p > .05
for limited service hotels and b = -.09, t = -.82, p > .05 for full service hotels).
Although not hypothesized, results in Model 8 revealed that administrative staff
also interacted with hotel stars in predicting service (∆R2 = .08, p < .01). Figure 11
showed that administrative staff predicted service ratings only among luxury
hotels as well.
----------------------------------------------------------------------
Insert Figures 6, 7, 8, 9, 11, 12, 13, 14, and 19 about Here
----------------------------------------------------------------------
SEM results in Figure 16 suggested significant interaction between back
operation positions and limited service hotels. In addition, front of the house
service staff had an overall negative relationship with customer evaluations of
service (β = -.10, p < .05). Figure 19 showed that although back of the house
operation positions were positively related to customer evaluations of value
among both limited service hotels and other hotels, customer evaluations of value
were consistently higher for limited service hotels.
Therefore, hypothesis 3 was mostly supported in regression analyses which
showed that back-of-the-house staff was strategic to creating not only value
(hypothesized), but also tangibles, and service capabilities (unhypothesized)
85
among limited-service hotels, and that front-of-the-house service providers were
strategic to delivering service to luxury hotels’ customers (hypothesized). All of
the above results were also summarized in Figure 8.
Discussion
Research Implications
Previous macro HRM research has predominantly employed a best practices
approach or a contingency approach based on generic market strategies. The
complex and heterogeneous practices that enable sustained organizational
competitive advantages (Barney, 1991), however, suggest the insufficiency in
previous generic best system(s) research. More and more researchers point to the
direction of creating and exploiting firm internal resources and capabilities.
Echoing the call for studies to examine the “contingent resource-based view”
(Aragon-Correa & Sharma, 2003), this study provides evidence of service
organizations’ heterogeneous strategic capabilities. According to this perspective,
resources and capabilities not only vary in their attributes such as rareness and
inimitability, but also in their value to different organizations. Instead of arguing
for more of everything, here I argue that having the right capability is most
important.
Results showed that different strategic foci demanded different sets of
strategic capabilities to succeed. The capabilities to deliver tangibles as evaluated
by customers were important for all strategies (had a significant main effect), i.e.,

86
operational excellence, product leadership and customer intimacy strategy,
suggesting that such capability might be a “threshold” capability (Boyatzis, 1982)
for hotels. Borrowing from the definitions of individual threshold competency,
this means that such capabilities are necessary for and fundamental to all hotels’
performance, but alone may not be sufficient to ensure higher performance for
some hotels. According to firm interdependencies, when firms possess equivalent
capabilities and produce products of equal quality, such as when hotels provide
the same tangibles, then firms split the market equally.
On the contrary, when firms vary in their distinctive capabilities, such as the
differential capability to deliver different levels of service among luxury hotels,
then the higher quality firms will have higher customer demands and can charge
higher rates (Lenox et al., 2006). The reverse is true for the possession of
dysfunctional capabilities. For organizations that employed a customer intimacy
strategy in particular, the current regression results showed that the capability to
deliver superior service was essential. Such capability, however, was negatively
related to financial performance in full-service hotels. This suggests that using a
one-size-fits-all criterion to require all organizations to deliver value, tangibles,
and service is neither effective nor efficient. Customers in full-service hotels do
not expect to receive expressive service; they may not be willing to spend an
extensive amount of time interacting with providers; they may not be appreciative
of expressive service when provided. Customers who choose luxury hotels, on the
87
contrary, are willing to pay a price premium to receive personalized service.
Therefore, in identifying their distinctive capabilities and avoiding dysfunctional
capabilities, organizations need to analyze the expectations of their customer
segment, and determine how these specific expectations can be met.
Although this study only presents an initial step in unraveling the
heterogeneous service capabilities, the results have implications that future
research can exploit more in-depth the firm-specific resources and capabilities
that sustain success in their market niche. This research suggests the complexity
in strategic capabilities, not only in identifying capabilities, but also in
determining the nature of capabilities. Future research can further develop the
theorizing of threshold capabilities versus core capabilities (Prahalad & Hamel,
1990) and/or distinctive capabilities (Selznick, 1957), as well as dysfunctional
capabilities, in order to explicate their differences. Future research should also test
these theories in other industries, to further extricate the key to success among
different organizations and under different contexts. This line of research in
contingent resources and capabilities will complement the majority of previous
research that undertakes a generic approach.
This study also endeavored to understand the different configurations of HR
that were specific to service industries in assisting the creation of strategic
capabilities. Results from multiple analyses showed that efficiency-oriented HR
most significantly predicted the creation of value among operational excellence

88
hotels, reliability-oriented HR contributed to the tangibles of product leadership
hotels, while flexibility-oriented HR positively predicted the delivery of service
only among customer intimacy hotels. Efficiency-oriented HR, characterized by
basic selection and training, corrective performance management, market
compensation, functional promotion and teamwork, prescriptive job description,
suggestion, basic information sharing, and internal inspections contributed to the
capability to deliver value with low price for limited service hotels.
Reliability-oriented HR, composed of selection and training for specialized skills,
result-oriented performance evaluation, pay for collective performance, functional
promotion and teamwork, systematic information sharing, and internal feedback
assisted the creation of high quality tangibles for product leadership hotels.
Flexibility-oriented HR was exemplified as selection and training on service skills,
performance and compensation emphasizing service performance,
cross-functional promotion and teamwork, broad job description and decision
making, instant information sharing, and external customer feedback, and was
beneficial to the creation of service capabilities. Although the results provided
partial support for the hypotheses, future research may replicate this research
perhaps using different samples. This approach has implication for future research
in that instead of arguing for more best practices, this urges researchers to
configure the right practices according to strategic needs.

89
This study employed a fit as profile deviation approach (Venkatraman, 1989)
to demonstrate the alignment between HRM configurations and different strategic
focus to create desirable strategic capabilities. Recently HRM researchers have
emphasized the importance of using the right approach to measure the type of
HRM fit that is of interest (Chadwick, In Press). Fit as profile deviation is most
applicable here because instead of assuming more high performance practices are
better, I argue that having the right practice focus with the right amount is most
effective. In addition, fit as profile deviation also takes into account the coherence
between different practices, which is important for creating different strategic
capabilities. I encourage future research to further explicate the different ways of
measuring fit under different theoretical backgrounds. Depending on the theory
and hypotheses, future researchers can employ fit as covariation, addition,
moderation, configuration, and gestalt to examine the various types of fit within
HRM configurations and between HRM and external and internal contexts.
The current research results also demonstrated the importance of aligning
strategic positions with strategic focus. While earlier research assumed a
universality of practices within organizations, recently researchers advocated for
more attention to be placed on internal differentiations based on strategic jobs and
human capital (Huselid et al., 2005a; Lepak & Snell, 1999). Using fit as matching,
the study provided support for the hypothesis that back-of-the-house positions
were strategic to organizations that implemented operational excellence strategy
90
in creating value, and that front-of-the-house positions were critical for
organizations that competed on customer intimacy to deliver service. Although
unhypothesized, back-of-the-house positions were also associated with the
delivery of tangibles and service in limited service hotels in regression results.
This may be due to the fact that back-of-the-house positions dominate limited
service hotels where very few front-of-the-house positions were available.
Likewise, call center staff were associated with the delivery of value, as well as
tangibles and service. In addition, luxury hotels that valued administrative staff
had higher ratings of service. This may be explained by organizations’ need to
integrate multiple processes in order to dynamically adjust to external demands
(Teece et al., 1997), in which administrative staff may play a role. Future research
can further examine this issue in different industries. Although a complete
examination of the HRM configurations among different positions and human
capital categories is beyond the scope of this paper, it is highly encouraged for
future research. For example, future research can compare all positions or human
capital categories and measure HRM configurations repeatedly for different
positions to test the effects of HRM internal differentiation.
Last but not the least, the study echoes the call for research to target a
strategic context for HRM research in order to more fully understand the “black
box” between HRM and firm performance (Lepak et al., 2006). This study
focused on the strategic management of service organizations, which was

91
increasingly important but less frequently examined in previous literature. The
hospitality industry could be broken down into three-segments, each of which
undertaking a different competitive strategy, namely operational excellence,
product leadership, and customer intimacy. Future research, therefore, should also
examine these strategies using different service industries. In addition, future
research should target other strategic contexts as well to comprehensively
examine the different types of strategic capabilities that lead to success.
Practical Implications
The current study has implication for HRM practices in that instead of
imitating the best practices that are deemed universally effective, organizations
need to first of all ask the question of what is the market niche that they aim to
compete in, find out the essential strategic resources and capabilities that they
need to acquire or develop for the strategic focus, and then design their HRM
configurations to target these resources and capabilities. Indeed, although
evidence of effective generic practices exists, questions still remain in whether
they are effective for all organizations, or the most effective for all organizations.
There is an increasing need to understand strategic HRM deeper than a general
high performance HR philosophy, in order to more fully articulate the complex
differences in practice. As organizations have diverse industrial positions,
strategic foci, and resources, it is reasonable to expect that the effective practices
are unique to each organization. Indeed, results from this study showed that not

92
all organizations were comparable in the value creation and management
processes. Instead, organizations fall into three strategic positions, each of which
demands different strategic capabilities and human resource management.
Therefore, a blind-minded replication of others’ practices may not be the most
cost effective for all organizations.
In order to understand what could be the strategic capabilities for
organizations, managers need to first analyze the customer segment that they are
targeting, understand what customers desire and what the organizations can
provide to “delight” them. As shown in this study, providing those customers who
are insensitive to intimacy high levels of service will in fact adversely impact
financial performance. In addition, managers need to keep an eye on what
competitors are providing, and figure out what is the unique value that they can
provide using their inimitable resources and capabilities so as to excel their
competitors. As an example, although it was hypothesized that tangibles would be
the most distinguishing factor for product leadership hotels, results showed that
being able to provide cleaner and more comfortable rooms was necessary for all
hotel stars’ competitive advantages.
In addition, organizations need to understand the mechanisms through which
HRM can contribute to building the essential strategic resources and capabilities.
Among the resources that are predominately tradable in the factor market, human
resources have the potential to be highly specific to each organization and

93
inimitable by others, thus they constitute an important component of firm strategic
resources that enable their sustained competitive advantage (Wright et al., 1994).
Therefore, appropriately configuring the HRM systems that can translate into
desirable human capital, social capital, and employee behaviors, and subsequently
strategic capabilities of organizations is a critical step. The study provides an
example of systematically understanding what types of human capital, social
capital, and motivation are desirable for building needed strategic capabilities, and
how HRM configurations can be tailored to reflect those emphases. For instance,
to deliver superior service, a flexibility-oriented HRM system characterized by
selection and training on general skills, cross-functional teamwork and individual
compensation, and external feedback etc. is important for creating the needed
capabilities.
Limitations
The current study’s findings, although supporting many of this study’s
hypotheses, should be understood in light of several limitations. For example, the
sample of hotel mangers were from hotels located all across the world. Although
hotel location was controlled in the analyses, the between-country market
differences and between-cultural practice differences may have contaminated the
research results and introduced additional errors than should all hotels were
located in one city. For example, the responses showed that the use of Gross
Operating Profit as a financial indicator was not prevalent in all countries. As

94
such, the present study might have under-estimated the relationships between the
study variables. However, this study may have broader generalizability to more
cultural contexts. In addition, not all of the hotels had multiple respondents. As
such, the aggregation of responses to the hotel level may have accounted for only
one manager’s response. An analysis of the responses, however, did not reveal
significant differences between hotels with single respondent or multiple
respondents.
This study endeavored to reduce common-method bias by introducing
multiple sources, including both managers’ responses as well as archival data, to
test a model of creating needed strategic capabilities using human resources
management. The use of archival data from hotel review website, however, may
have its own limitations. For example, voluntary customer reviews may not be the
most representative opinions of all customers. Customers who have extreme
experiences may be prone to input their reviews. An analysis of the inter-rater
consistency and between-hotel variation, however, suggests sufficient evidence of
customers’ shared perception within hotels. In addition, many customers rely on
hotel review websites in determining their purchasing decision, particularly
Tripadvisor.com. Therefore, the customers’ ratings have substantial practical
implications and provide valid indication of hotels’ strategic capabilities in
delivering service.
95
Conclusion
The results of the current study have implications for management theory and
practice. This paper was among the first to draw on the capability-based view of
strategic management to examine the role of strategic HRM in building unique
strategic capabilities that were essential for service organizations’ success. Using
the hospitality industry, I conducted three studies via both quantitative and
qualitative approaches to examine the extent to which hotels in different segments
aligned their strategic focus, strategic capabilities, strategic employees, and HRM
systems and the subsequent impact on financial performance. Results showed that
there were different capabilities that predicted financial performance for different
strategic focus. Service capabilities, for example, were most strategic among
luxury hotels that pursued customer intimacy, but not for other hotels. In addition,
an alignment of the suggested HR profiles and an emphasis on the strategic
positions were helpful for creating the strategic capabilities. Implementing
efficiency-oriented and reliability-oriented HR and emphasizing
back-of-the-house positions were critical for hotels that focused on operational
excellence and product leadership, while adopting flexibility-oriented HR and
valuing front-of-the house positions were important for hotels that excelled at
customer intimacy to deliver superior service. Instead of advocating for more best
practices, this study suggests that identifying the right practices and the strategic
positions according to needed capabilities is key.

96
References
Agarwal, S., Erramilli, M. K., & Dev, C. S. 2003. Market orientation and
performance in service firms: Role of innovation. Journal of Services Marketing, 17(1): 68-82.
Aiken, L. S., & West, S. G. 1991. Multiple regression: Testing and interpreting interactions. Newbury Park, CA: Sage.
Amit, R., & Schoemaker, P. J. H. 1993. Strategic assets and organizational rent. Strategic Management Journal, 14(1): 33-46.
Anderson, J. C., & Gerbing, D. W. 1988. Structural equation modeling in practice: A review and recommended two-step approach. Psychological Bulletin, 103(3): 411-423.
Aragon-Correa, J. A., & Sharma, S. 2003. A contingent resource-based view of proactive corporate environmental strategy. Academy of Management Review, 28(1): 71-88.
Arthur, J. B. 1992. The link between business strategy and industrial relations systems in american steel minimills. Industrial and Labor Relations Review, 45(3): 488-506.
Arthur, J. B. 1994. Effects of human resource systems on manufacturing performance and turnover. Academy of Management Journal, 37(3): 670-687.
Baird, L., & Meshoulam, I. 1988. Managing two fits of strategic human resource management. Academy of Management Review, 13(1): 116-128.
Barney, J. 1991. Firm resources and sustainable competitive advantage. Journal of Management, 17: 99-129.
Barney, J. 2001. Is the resource-based “view” a useful perspective for strategic management research? Yes. Academy of Management Review, 26: 41-57.
Barney, J. B. 1986. Strategic factor markets: Expectations, luck, and business strategy. Management Science, 32(10): 1231-1242.
Barney, J. B., & Wright, P. M. 1998. On becmoming a strategic partner: The role of human resources in gaining competitive advantage. Human Resource Management, 37(1): 31-46.
Batt, R. 2002. Managing customer services: Human resource practices, quit rates, and sales growth. Academy of Management Journal, 45(3): 587-597.
Becker, B., & Gerhart, B. 1996. The impact of human resource management on organizational performance: Progress and prospects. Academy of Management Journal, 39: 779-801.
Becker, B. E., & Huselid, M. A. 1998. High performance work systems and firm performance: A synthesis of research and managerial implications. In G. R. Ferris (Ed.), Research in personnel and human resources management,

97
Vol. 16: 53-101. Greenwich, CT: JAI Press. Becker, B. E., & Huselid, M. A. 2006. Strategic human resources management:
Where do we go from here? Journal of Management, 32(6): 898-925. Becker, B. E., Huselid, M. A., & Beatty, R. W. 2009. The differentiated
workforce: Translating talent into strategic action. Boston: Harvard Business Press.
Bhattacharya, M., Gibson, D. E., & Doty, D. H. 2005. The effects of flexibility in employee skills, employee behaviors, and human resource practices on firm performance. Journal of Management, 31(4): 622-640.
Bliese, P. D. 2000. An introduction to multilevel modeling techniques (book review). Personnel Psychology, 53(4): 1062-1065.
Blyler, M., & Coff, R. W. 2003. Dynamic capabilities, social capital, and rent appropriation: Ties that split pies. Strategic Management Journal, 24(7): 677-686.
Boulding, W., Kalra, A., Staelin, R., & Zeithaml, V. A. 1993. A dynamic process model of service quality: From expectations to behavioral intentions. Journal of Marketing Research (JMR), 30(1): 7-27.
Bowen, D. E., & Schneider, B. 1988. Services marketing and management: Implications for organizational behavior. Research in Organizational Behavior, 10: 43-80.
Bowen, D. E., Siehl, C., & Schneider, B. 1989. A framework for analyzing customer service orientations in manufacturing. Academy of Management Review, 14(1): 75-95.
Boyatzis, R. E. 1982. The competent manager: A model for effective performance. New York: John Wiley & Sons.
Brass, D. J. 1995. A social network perspective on human resources management. In G. R. Ferris (Ed.), Research in personnel and human resources management, Vol. 13: 39-79. Greenwich, CT: JAI Press.
Brass, D. J., Galaskiewicz, J., Greve, J. R., & Tsai, W. 2004. Taking stock of networks and organizations: A multilevel perspective. Academy of Management Journal, 47(6): 795-817.
Brush, T. H., & Artz, K. W. 1999. Toward a contingent resource-based theory: The impact of information asymmetry on the value of capabilities in veterinary medicine. Strategic Management Journal, 20: 223-250.
Burns, T., & Stalker, G. M. 1961. The management of innovation. London: Tavistock Publications.
Burt, R. S. 1997. The contingent value of social capital. Administrative Science Quarterly, 42(2): 339-365.
Cappelli, P., & Neumark, D. 2001. Do “high-performance” work practices improve establishment-level outcomes? Industrial & Labor Relations Review, 54(4): 737-775.

98
Chadwick, C. In Press. Theoretic insights on the nature of performance synergies in human resource systems: Toward greater precision. Human Resource Management Review.
Chiu, H.-C., & Lin, N.-P. 2004. A service quality measurement derived from the theory of needs. Service Industries Journal, 24(1): 187-204.
Coff, R. 1997. Human assets and management dilemmas: Coping with hazard on the road to resource-based theory. Academy of Management Review, 22(2): 374-402.
Coleman, J. S. 1988. Social capital in the creation of human capital. American Journal of Sociology, 94(s): 95-120.
Collins, C. J., & Clark, K. D. 2003. Strategic human resource practices, top management team social networks, and firm performance: The role of human resource practices in creating organizational competitive advantage. Academy of Management Journal, 48(6): 740-751.
Collins, C. J., & Smith, K. G. 2006. Knowledge exchange and combination: The role of human resource practices in the performance of high-technology firms. Academy of Management Journal, 49(3): 544-560.
Combs, J., Liu, Y., Hall, A., & Ketchen, D. 2006. How much do high performance work practices matter? A meta-analysis of their effects on organizational performance. Personnel Psychology, 59(3): 501-528.
Cortina, J. M., Chen, G., & Dunlap, W. P. 2001. Testing interaction effects in lisrel: Examination and illustration of available procedures. Organizational Research Methods, 4(4): 324-360.
Datta, D. K., Guthrie, J. P., & Wright, P. M. 2005. Human resource management and labor productivity: Does industry matter? Academy of Management Journal, 48: 135-145.
Day, G. S. 1994. The capabilities of market-driven organizations. Journal of Marketing, 58(4): 37-52.
Delery, J. E. 1998. Issues of fit in strategic human resource management: Implications for research. Human Resource Management Review, 8(3): 289-309.
Delery, J. E., & Doty, D. H. 1996. Modes of theorizing in strategic human resource management: Tests of universalistic, contingency, and configurational performance predictions. Academy of Management Journal, 39(4): 802-835.
Delery, J. E., & Shaw, J. D. 2001. The strategic management of people in work organizations: Review, synthesis, and extension. In G. R. Ferris (Ed.), Research in personnel and human resources management, Vol. 20: 165-197. Stamford, CT: JAI Press.
Dierickx, I., & Cool, K. 1989. Asset stock accumulation and sustainability of competitive advantage. Management Science, 35(12): 1504-1511.
99
Dulac, T., Coyle-Shapiro, J. A.-M., Henderson, D. J., & Wayne, S. J. 2008. Not all responses to breach are the same: The interconnection of social exchange and psychological contract processes in organizations. Academy of Management Journal, 51(6): 1079-1098.
Dutta, S., Narasimhan, O., & Rajiv, S. 2005. Conceptualizing and measuring capabilities: Methodology and empirical application. Strategic Management Journal, 26(3): 277-285.
Eisenhardt, K. M., & Martin, J. A. 2000. Dynamic capabilities: What are they? Strategic Management Journal, 21: 1105-1121.
Fornell, C., Johnson, M. D., Anderson, E. W., Jaesung, C., & Bryant, B. E. 1996. The american customer satisfaction index: Nature, purpose, and findings. Journal of Marketing, 60(4): 7-18.
Galunic, D. C., & Eisenhardt, K. M. 2001. Architectural innovation and modular corporate forms. Academy of Management Journal, 44(6): 1229-1249.
Gant, J., Ichniowski, C., & Shaw, K. 2002. Social capital and organizational change in high-involvement and traditional work organizations. Journal of Economics and Management Strategy, 11: 289-328.
George, J. M., & Bettenhausen, K. 1990. Understanding prosocial behavior, sales performance, and turnover: A group level analysis in a service context. Journal of Applied Psychology, 75(6): 698-709.
Gerhart, B., Wright, P. M., Mcmahan, G. C., & Snell, S. A. 2000. Measurement error in research on the human resources and firm performance relationship: How much error is there and how does it influence effect size estimates? Personnel Psychology, 53: 803-834.
Glick, W. H. 1985. Conceptualizing and measuring organizational and psychological climate: Pitfalls in multilevel research. Academy of Management Review, 10(3): 601-616.
Gotlieb, J. B., Grewal, D., & Brown, S. W. 1994. Consumer satisfaction and perceived quality: Complementary or divergent constructs. Journal of Applied Psychology, 79(6): 875-885.
Granovetter, M. S. 1973. The strength of weak ties. American Journal of Sociology, 78: 1360-1380.
Guest, D. E. 1997. Human resource management and performance: A review and research agenda. International Journal of Human Resource Management, 8: 263-276.
Gutek, B. A., Bhappu, A. D., Liao-Troth, M. A., & Cherry, B. 1999. Distinguishing between service relationships and encounters. Journal of Applied Psychology, 84(2): 218-233.
Guthrie, J. P. 2001. High-involvement work practices, turnovers, and productivity: Evidence from new zealand. Academy of Management Journal, 44(1): 180-190.

100
Hamer, L. O. 2006. A confirmation perspective on perceived service quality. Journal of Services Marketing, 20(4): 219-232.
Hannan, M. T., & Freeman, J. 1977. The population ecology of organizations. American Journal of Sociology, 82(5): 929-964.
Hartline, M. D., & Jones, K. C. 1996. Employee performance cues in a hotel service environment: Influence on perceived service quality, value, and word-of-mouth intentions. Journal of Business Research, 35(3): 207.
Hartline, M. D., Maxham Iii, J. G., & Mckee, D. O. 2000. Corridors of influence in the dissemination of customer-oriented strategy to customer contact service employees. Journal of Marketing, 64(2): 35-50.
Hartline, M. D., Wooldridge, B. R., & Jones, K. C. 2003. Guest perceptions of hotel quality: Determining which employee groups count most. Cornell Hotel and Restaurant Administration Quarterly, 44(1): 43-52.
Heckscher, C. 2007. The collaborative enterprise: Managing speed and complexity in knowledge-based businesses: Yale University Press.
Henderson, C. 1992. Tuning into ritz philosophy. Managing Service Quality, 3(1): 385-389.
Heskett, J., Sasser, W. E. J., & Schlesinger, L. 1997. The service profit chain: How leading companies link profit and growth to loyalty, satisfaction, and value. New York: Free Press.
Horwitz, F. M., & Neville, M. A. 1996. Organization design for service excellence: A review of the literature. Human Resource Management, 35(4): 471-492.
Hu, L.-T., & Bentler, P. M. 1999. Cutoff criteria for fit indexes in covariance structure analysis: Conventional criteria versus new alternatives. Structural Equation Modeling, 6(1): 1-55.
Huselid, M. A. 1995. The impact of human resource management practices on turnover, productivity, and corporate financial performance. Academy of Management Journal, 38(3): 635-672.
Huselid, M. A., Beatty, R. W., & Becker, B. E. 2005a. "a" players or "a" positions? The strategic logic of workforce management. Harvard Business Review(December): 110-117.
Huselid, M. A., Becker, B. E., & Beatty, R. W. 2005b. The workforce scorecard: Managing human capital to execute strategy. Boston, MA: Harvard Business School Press.
Ichniowski, C., Kochan, T. A., Levine, D., Olson, C., & Strauss, G. 1996. What works at work: Overview and assessment. Industrial Relations, 35(3): 299-333.
Ichniowski, C., Shaw, K., & Prennushi, G. 1997. The effects of human resource management practices on productivity: A study of steel finishing lines. The American Economic Review, 87(3): 219-313.

101
Jackson, S. E., & Schuler, R. S. 1995. Understanding human resource management in the context of organizations and their environments. Annual Review of Psychology, 46: 237-264.
Jackson, S. E., Schuler, R. S., & Rivero, J. C. 1989. Organizational characteristics as predictors of personnel practices. Personnel Psychology, 42: 727-786.
James, L. R. 1982. Aggregation bias in estimates of percep- tual agreement. Journal of Applied Psychology, 67: 219-229.
James, L. R., Demaree, R. G., & Wolf, G. 1984. Estimating within-group interrater reliability with and without response bias. Journal of Applied Psychology, 69: 85-98.
Johnson, J. W. 1996. Linking employee perceptions of service climate to customer satisfaction. Personnel Psychology, 49(4): 831-851.
Jöreskog, K., & Sörbom, D. 1993. Lisrel 8: User's reference guide. Chicago, IL: Scientific Software International.
Kelly, S. W., Donnelly, J. H., Jr., & Skinner, S. J. 1990. Customer participation in service production and delivery. Journal of Retailing, 66(3): 315-335.
Koch, M. J., & Mcgrath, R. G. 1996. Improving labor productivity: Human resource management policies do matter. Strategic Management Journal, 17: 335-354.
Kozlowski, S. W. J., & Hattrup, K. 1992. A disagreement about within-group agreement: Disentangling issues of consistency versus consensus. Journal of Applied Psychology, 77(2): 161-167.
Larsson, R., & Bowen, D. E. 1989. Organization and customer: Managing design and coordination of services. Academy of Management Review, 14(2): 213-233.
Lawrence, P. R., & Lorsch, J. W. 1967. Differentiation and integration in complex organizations. Administrative Science Quarterly, 12: 1-47.
Lenox, M. J., Rockart, S. F., & Lewin, A. Y. 2006. Interdependency, competition, and the distribution of firm and industry profits. Management Science, 52(5): 757-772.
Leonard-Barton, D. 1992. Core capabilities and core rigidities: A paradox in managing new product development. Strategic Management Journal, 13(5): 111-125.
Lepak, D. P., Liao, H., Chung, Y., & Harden, E. 2006. A conceptual review of human resource management systems in strategic human resource management research. In J. Martocchio (Ed.), Research in personnel and human resource management. Stamford, CT: JAI Press.
Lepak, D. P., & Snell, S. A. 1999. The human resource architecture: Toward a theory of human capital allocation and development. Academy of Management Review, 24(1): 31-48.
Lepak, D. P., & Snell, S. A. 2002. Examining the human resource architecture:

102
The relationships among human capital, employment, and human resource configurations. Journal of Management, 28(4): 517-543.
Liao, H. 2007. Do it right this time: The role of employee service recovery performance in customer-perceived justice and customer loyalty after service failures. Journal of Applied Psychology, 92(2): 475-489.
Liao, H., & Chuang, A. 2004. A multilevel investigation of factors influencing employee service performance and customer outcomes. Academy of Management Journal, 47: 41-58.
Liao, H., Toya, K., Lepak, D. P., & Hong, Y. 2007. Strategically-focused and employee-experienced work system: Service quality as an objective. Academy of Management Proceedings: 1-6.
Liao, H., Toya, K., Lepak, D. P., & Hong, Y. 2009. Do they see eye to eye? Management and employee perspectives of high performance work systems and influence processes on service quality. Journal of Applied Psychology, 94(2): 371-391.
Macduffie, J. P. 1995. Human resource bundles and manufacturing performance: Organizational logic and flexible production systems in the world auto industry. Industrial and Labor Relations Review, 48: 197-221.
Makadok, R. 2001. Toward a synthesis of the resource-based and dynamic capability views of rent creation. Strategic Management Journal, 22: 387-401.
Makadok, R., & Walker, G. 2000. Identifying a distinctive competence: Forecasting ability in the money fund industry. Strategic Management Journal, 21: 853-864.
Mathieu, J. E., Tannenbaum, S. I., & Salas, E. 1992. Influences of individual and situational characteristics on measures of training effectiveness. Academy of Management Journal, 35(4): 828-847.
Mcmahan, G. C., Virick, M., & Wright, P. M. 1999. Alternative theoretical perspectives for strategic human resource management revised: Progress, problems, and prospects. In P. Wright, Dyer, L., Boudreau, J., & Milkovich, G. (Ed.), Research in personnel and human resource management. Supplement A. Greenwich, CT: JAI Press.
Miles, R. E., & Snow, C. C. 1984. Designing strategic human resources systems. Organizational Dynamics(Summer): 36-52.
Mills, P. K., Hall, J. L., Leidecker, J. K., & Margulies, N. 1983. Flexiform: A model for professional service organizations. Academy of Management Review, 8(1): 118-131.
Mittal, B., & Lassar, W. M. 1996. The role of personalization in service encounters. Journal of Retailing, 72(1): 95-109.
Mobil-Travel-Guide. 2008. Hotel star rating criteria. http://mobiltravelguide.howstuffworks.com/hotels-channel.htm.

103
September 12 Nag, R., Hambrick, D. C., & Chen, M.-J. 2007. What is strategic management,
really? Inductive derivation of a consensus definition of the field. Strategic Management Journal, 28: 935-955.
Nahapiet, J., & Ghoshal, S. 1998. Social capital, intellectual capital, and the organizational advantage. Academy Of Management Review, 23(2): 242-266.
Nayyar, P. R. 1993. On the measurement of competitive strategy: Evidence from a large multiproduct u.S. Firm. Academy of Management Journal, 36: 1652-1669.
Ogden, S., & Watson, R. 1999. Corporate performance and stakeholder managment: Balancing shareholder and customer interests in the u.K. Privatized water industry. Academy of Management Journal, 42(5): 526-538.
Osterman, P. 1994. How common is workplace transformation and who adopts it? Industrial and Labor Relations Review, 47: 173-188.
Parasuraman, A., Zeithaml, V. A., & Berry, L. L. 1985. A conceptual model of service quality and its implications for future research. Journal of Marketing, 49(4): 41-50.
Parasuraman, A., Zeithaml, V. A., & Berry, L. L. 1994. Alternative scales for measuring service quality: A comparative assessment based on psychometric and diagnostic criteria. Journal of Retailing, 70(3): 201-230.
Pfeffer, J. 1995. Producing sustainable competitive advantage through the effective management of people. Academy of Management Executive, 9(1): 55-72.
Pfeffer, J. 1998. The human equation: Building profits by putting people first. Boston: Harvard Business School Press.
Pfeffer, J., & Sutton, R. I. 1999. Knowing-doing gap: How smart companies turn knowledge into action (hardcover), Harvard business school press books: 1.
Porter, M. E. 1980. Competitive strategy. New York: Free Press. Prahalad, C. K., & Hamel, G. 1990. The core competence of the corporation.
Harvard Business Review, 68(3): 79. Priem, R. L., & Butler, J. E. 2001. Is the resource-based “view” a useful
perspective for strategic management research? Academy of Management Review, 26: 22-40.
Raff, D. M. G. 2000. Superstores and the evolution of firm capabilities in american bookselling. Strategic Management Journal, 21: 1043-1059.
Ray, G., Barney, J. B., & Muhanna, W. A. 2004. Capabilities, business processes, and competitive advantage: Choosing the dependent variable in empirical
104
tests of the resourcebased view. Strategic Management Journal, 25: 23-37.
Reagans, R., Zuckerman, E., & Mcevily, B. 2004. How to make the team: Social networks vs. Demography as criteria for designing effective teams. Administrative Science Quarterly, 49(1): 101-133.
Reed, R., & Defillipi, R. J. 1990. Causal ambiguity, barriers to imitation, and sustainable competitive advantage. Academy of Management Review, 15(1): 88-102.
Reichheld, F. F., & Sasser, W. E. 1990. Zero defections: Quality comes to services. Harvard Business Review, 68: 105-111.
Rothaermel, F. T., & Hess, A. M. 2007. Building dynamic capabilities: Innovation driven by individual, firm, and network level effects. Organization Science.
Saparito, P. A., Chen, C. C., & Sapienza, H. J. 2004. The role of relational trust in bank-small firm relationships. Academy of Management Journal, 47: 400-410.
Schlesinger, L. A., & Heskitt, J. L. 1991. Breaking the cycle of failure in services. Sloan Management Review, 17: 57-68.
Schneider, B. 1990. The climate for service: An application of the climate construct. In B. Schneider (Ed.), Organizational climate and culture: 383-412. San Francisco: Jossey-Bass.
Schneider, B., & Bowen, D. E. 1985. Employee and customer perceptions of service in banks: Replication and extension. Journal of Applied Psychology, 70(3): 423-433.
Schneider, B., & Bowen, D. E. 1999. Understanding customer delight and outrage. Sloan Management Review, 41: 35-46.
Schneider, B., Bowen, D. E., Ehrhart, M. G., & Holcombe, K. M. 2000. The climate for service: Evolution of a construct. In N. M. Ashkanasy, C. P. M. Wilderom, & M. F. Peterson (Eds.), Handbook of organizational culture and climate: 21-36. Thousand Oaks, CA: Sage.
Schneider, B., Ehrhart, M. G., Mayer, D. M., Saltz, J. L., & Niles-Jolly, K. 2005. Understanding organization-customer links in service settings. Academy of Management Journal, 48(6): 1017-1032.
Schneider, B., Wheeler, J. K., & Cox, J. F. 1992. A passion for service: Using content analysis to explicate service climate themes. Journal of Applied Psychology, 77(5): 705-716.
Schneider, B., White, S. S., & Paul, M. C. 1998. Linking service climate and customer perceptions of service quality: Tests of a causal model. Journal of Applied Psychology, 83(2): 150-163.
Schreyogg, G., & Kliesch-Eberl. 2007. How dynamic can organizational capabilities be? Towards a dual-process model of capability dynamization.

105
Strategic Management Journal, 28: 913-933. Schuler, R. S., & Jackson, S. E. 1987. Linking competitive strategies with human
resource management practices. Academy of Management Executive, 1: 207-219.
Selznick, P. 1957. Leadership in administration. New York: Harper & Row. Shostack, G. L. 1977. Breaking free from product marketing. Journal of
Marketing, 41(2): 73-80. Sirmon, D. G., Hitt, M. A., & Ireland, R. D. 2007. Managing firm resources in
dynamic environment to create value: Looking inside the black box. Academy of Management Review, 32: 273-292.
Skaggs, B. C., & Youndt, M. 2004. Strategic positioning, human capital, and performance in service organizations: A customer interaction approach. Strategic Management Journal, 25: 85-99.
Stalk, G., Evans, P., & Shulman, L. E. 1992. Competing on capabilities: The new rules of corporate strategy. Harvard Business Review, 70(2): 54-66.
Subramaniam, M., & Youndt, M. A. 2005. The influence of intellectual capital on the types of innovative capabilities. Academy of Management Journal, 48(3): 450-463.
Sun, L.-Y., Aryee, S., & Law, K. S. 2007. High-performance human resource practices, citizenship behavior, and organizational performance: A relational perspective. Academy of Management Journal, 50: 558-577.
Surprenant, C. F., & Solomon, M. R. 1987. Predictability and personalization in the service encounter. Journal of Marketing, 51(2): 86-96.
Sutton, R. I., & Rafaeli, A. 1988. Untangling the relationships between displayed emotions and organizational sales: The case of convenience stores. Academy of Management Journal, 31(3): 461-487.
Swan, J. E., & Pruden, H. O. 1977. Marketing insights from a classification of services. American Journal of Small Business, 2(1): 38-48.
Szymanski, D. M., & Henard, D. H. 2001. Customer satisfaction: A meta-analysis of the empirical evidence. Journal of the Academy of Marketing Science, 29(1): 16-35.
Teece, D. J., Pisan, G., & Shuen, A. 1997. Dynamic capabilities and strategic management. Strategic Management Journal, 18: 509-533.
Terpastra, D., & Rozzel, E. 1993. The relationship of staffing practices to organizational level measures of performance. Personnel Psychology, 46: 27-48.
Thompson, J. D. 1967. The structure of complex organization. In D. S. Pugh (Ed.), Organization theory: Selected readings: 29-43. London England: Penguin books.
Treacy, M., & Wiersema, F. 1993. Customer intimacy and other value disciplines. Harvard Business Review, January-February: 84-93.
106
Van De Ven, A. H., & Drazin, R. 1985. The concept of fit in contingency theory. Research in Organizational Behavior, 7: 333-365.
Venkatraman, N. 1989. The concept of fit in strategy research: Toward verbal and statistical correspondence. Academy of Management Review, 14(3): 423-444.
Venkatraman, N., & Prescott, J. E. 1990. Environment-strategy coalignment: An empirical test of its performance implications. Strategic Management Journal, 11(1): 1-23.
Voss, G. B., Parasuraman, A., & Grewal, D. 1998. The roles of price, performance, and expectations in determining satisfaction in service exchanges. Journal of Marketing, 62(4): 46-61.
Weber, M. 1924. Legitimate authority and bureaucracy. In D. S. Pugh (Ed.), Organizational theory: Selected readings: 3-15. London England: Penguin books.
Wernerfelt, B. 1984. A resource-based view of the firm. Strategic Management Journal, 5: 171-180.
Wright, P. M., & Boswell, W. R. 2002. Desegrating hrm: A review and synthesis of micro and macro human resource management research. Journal of Management, 24: 247-276.
Wright, P. M., Dunford, B. B., & Snell, S. A. 2001. Human resource and the resource based view of the firm. Journal of Management, 27: 701-721.
Wright, P. M., Mcmahan, G. C., & Mcwilliams, A. 1994. Human resources and sustained competitive advantage: A resource-based perspective. International Journal of Human Resource Management, 5(2): 301-326.
Wright, P. M., Smart, D., & Mcmahan, G. C. 1995. On the integration of strategy and human resources: An investigation of the match between human resources and strategy among ncaa basketball teams. Academy of Management Journal, 38: 1052-1074.
Wright, P. M., & Snell, S. A. 1998. Toward a unifying framework for exploring fit and flexibility in strategic human resource management. Academy of Management Review, 23(4): 756-772.
Youndt, M. A., Snell, S. A., Dean, J. W. J., & Lepak, D. P. 1996. Human resource management, manufacturing strategy, and firm performance. Academy of Management Journal, 39(4): 836-866.
Youndt, M. A., Subramaniam, M., & Snell, S. A. 2004. Intellectual capital profiles: An examination of investments and returns. Journal of Management Studies, 41(2): 335-362.
Zacharatos, A., Barling, J., & Iverson, R. D. 2005. High-performance work systems and occupational safety. Journal of Applied Psychology, 90: 77-93.
Zacharatos, A., Hershcovis, M. S., Turner, N., & Barling, J. 2007. Human

107
resource management in the north american automobile industry: A meta-analysis. Personnel Review, 36: 231-254.
Zahra, S. A., & George, G. 2002. Absorptive capacity: A review, reconceptualization, and extension. Academy of Management Review, 27(2): 185-203.
Zhou, Y., & Hong, Y. 2008. A differentiation perspective of shrm: Strategic capabilities, configurations, and complementarities. Paper presented at the Academy of Management Annual Meeting, Anaheim, CA.
Ziethaml, V. A., Berry, L. L., & Parasuraman, A. 1993. The nature and determinants of customer expectations of service. Journal of the Academy of Marketing Science, 21(1): 1-12.
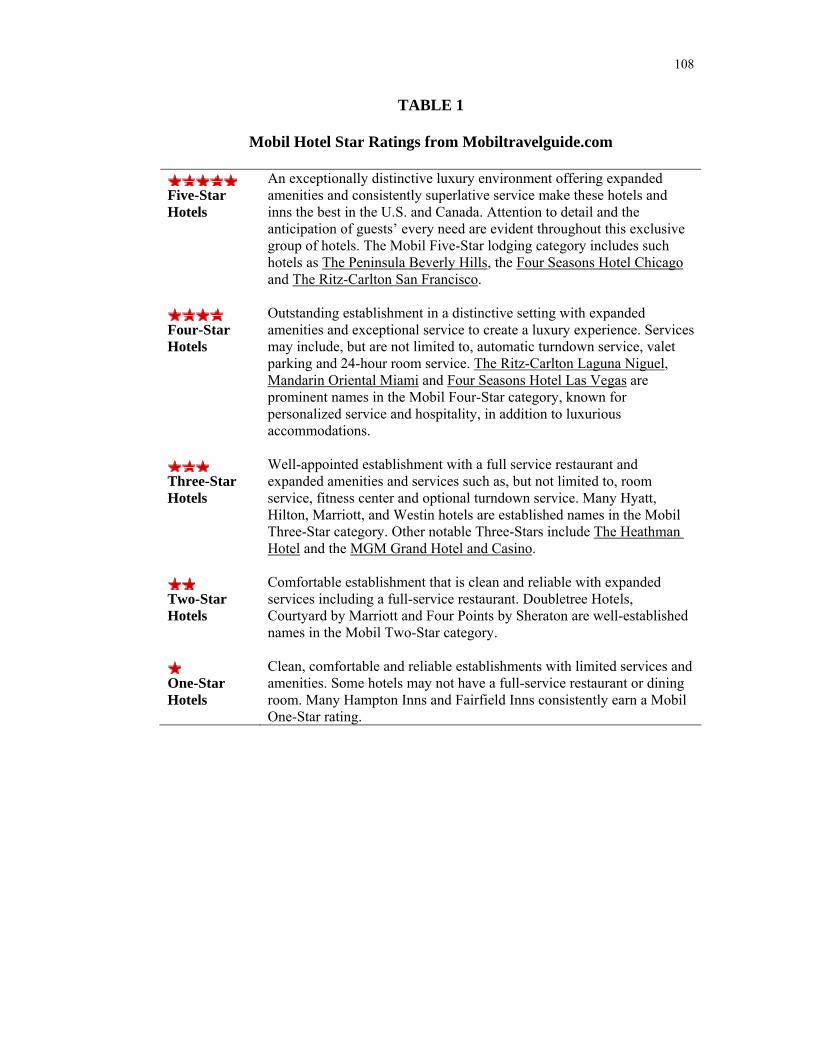
108
TABLE 1
Mobil Hotel Star Ratings from Mobiltravelguide.com
Five-Star Hotels
An exceptionally distinctive luxury environment offering expanded amenities and consistently superlative service make these hotels and inns the best in the U.S. and Canada. Attention to detail and the anticipation of guests’ every need are evident throughout this exclusive group of hotels. The Mobil Five-Star lodging category includes such hotels as The Peninsula Beverly Hills, the Four Seasons Hotel Chicago and The Ritz-Carlton San Francisco.
Four-Star Hotels
Outstanding establishment in a distinctive setting with expanded amenities and exceptional service to create a luxury experience. Services may include, but are not limited to, automatic turndown service, valet parking and 24-hour room service. The Ritz-Carlton Laguna Niguel, Mandarin Oriental Miami and Four Seasons Hotel Las Vegas are prominent names in the Mobil Four-Star category, known for personalized service and hospitality, in addition to luxurious accommodations.
Three-Star Hotels
Well-appointed establishment with a full service restaurant and expanded amenities and services such as, but not limited to, room service, fitness center and optional turndown service. Many Hyatt, Hilton, Marriott, and Westin hotels are established names in the Mobil Three-Star category. Other notable Three-Stars include The Heathman Hotel and the MGM Grand Hotel and Casino.
Two-Star Hotels
Comfortable establishment that is clean and reliable with expanded services including a full-service restaurant. Doubletree Hotels, Courtyard by Marriott and Four Points by Sheraton are well-established names in the Mobil Two-Star category.
One-Star Hotels
Clean, comfortable and reliable establishments with limited services and amenities. Some hotels may not have a full-service restaurant or dining room. Many Hampton Inns and Fairfield Inns consistently earn a Mobil One-Star rating.

109
FIGURE 1
Overview of Research Model
Organizational outcomes
Strategic capabilities
Ideal HRM
Strategic positions
Strategy
Strategy
H1 H2
H3
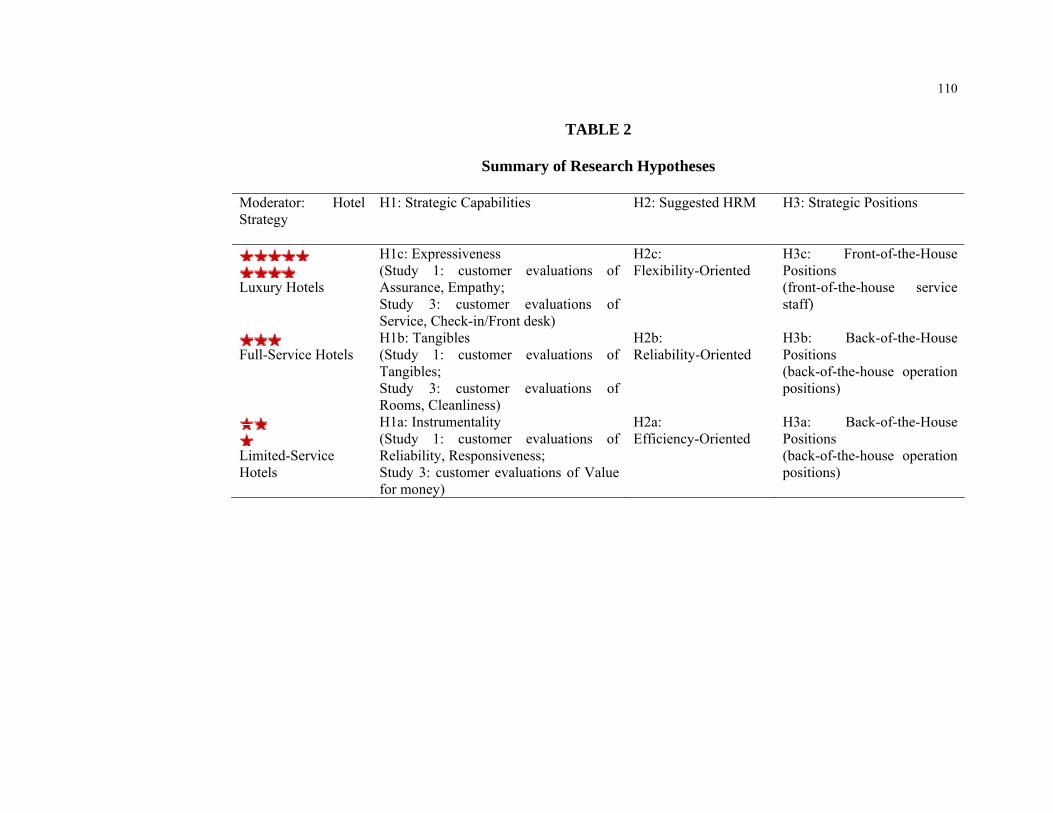
110
TABLE 2
Summary of Research Hypotheses
Moderator: Hotel Strategy
H1: Strategic Capabilities H2: Suggested HRM H3: Strategic Positions
Luxury Hotels
H1c: Expressiveness (Study 1: customer evaluations of Assurance, Empathy; Study 3: customer evaluations of Service, Check-in/Front desk)
H2c: Flexibility-Oriented
H3c: Front-of-the-House Positions (front-of-the-house service staff)
Full-Service Hotels
H1b: Tangibles (Study 1: customer evaluations of Tangibles; Study 3: customer evaluations of Rooms, Cleanliness)
H2b: Reliability-Oriented
H3b: Back-of-the-House Positions (back-of-the-house operation positions)
Limited-Service Hotels
H1a: Instrumentality (Study 1: customer evaluations of Reliability, Responsiveness; Study 3: customer evaluations of Value for money)
H2a: Efficiency-Oriented
H3a: Back-of-the-House Positions (back-of-the-house operation positions)

111
TABLE 3
Means, Standard Deviations, Correlations, and Reliabilities of Variables in Pilot Study 1c
MeanS.D. 1 2 3 4 5 6 7 8 9 10 11 12 13 14 15 16 17 18 1.Satisfaction 4.16 .86 .83 a
2.Star 2.54 1.24.20***3.Price 2.52 1.11.20***.71***4.Urban .38 .49 .09* .16** .12**5.EXb_reliability 4.28 .71 .34*** .09* .09* .10* .89 a
6.EX_tangibles 4.22 .77 .35*** .10* .06 .08 .67*** .87 a
7.EX_responsive 4.27 .75 .34*** .11* .10* .07 .77*** .73*** .86 a
8.EX_assurance 4.26 .74 .38*** .07 .06 .11* .71*** .66*** .75*** .86 a
9.EX_empathy 4.17 .75 .39*** .14** .15** .09* .66*** .69*** .75*** .80*** .91 a
10.ACb_reliability4.13 .80 .65***.17***.18*** .10* .46*** .37*** .43*** .46*** .45*** .88 a
11.AC_tangibles 4.11 .83 .64***.24***.19***.13** .41*** .59*** .45*** .50*** .55***.68*** .87 a
12.AC_responsive4.10 .84 .65***.24***.22*** .11* .38*** .44*** .49*** .50*** .55***.73***.70*** .86 a
13.AC_assurance 4.11 .79 .66***.17*** .12**.14** .44*** .47*** .49*** .61*** .57***.72***.73*** .80* ** .85 a
14.AC_empathy 4.02 .80 .65***.19***.20*** .07 .37*** .42*** .44*** .50*** .60***.67***.72***.76***.79*** .93 a
15.DIb_reliability .09 .34 .35*** .10* .10* .01-.44***-.23***-.26***-.18***-.14***.59***.31***.39***.33***.35***16.DI_tangibles .08 .36 .36*** .16** .15** .06-.24***-.39***-.26*** -.12** -.10*.37***.52***.32***.33***.37***.59***17.DI_responsive .10 .38 .36*** .14** .14** .04-.32***-.22***-.43***-.18*** -.13**.36***.30***.58***.37***.37***.65***.57***18.DI_assurance .08 .36 .35*** .13** .07 .04-.27***-.17***-.24***-.38***-.21***.33***.30***.39***.50***.37***.58***.52***.63***19.DI_empathy .07 .31 .33*** .07 .06 -.02-.28***-.26***-.31***-.29***-.40***.28***.23***.27***.29***.50***.54***.54***.57***.65*** a Numbers in diagonal are Cronbach’s alphas. *** p < .001 (1-tailed). ** p < .01 level (1-tailed). * p < .05 (1-tailed). b EX = Expectations of service quality; AC = Actual experience of service quality; DI = Difference scores between experience and expectations of service quality. c N = 411.

112
TABLE 4
Pilot Study 1 – ANOVA of different service quality aspects among star hotels
Customer Expectations Customer Experiences Hotel star leveld Limited service Full service Luxury Limited service Full service Luxury Reliability 4.18 c 4.33 c 4.33 3.93a, b, c 4.22a, c 4.31b Responsiveness 4.16 c 4.30 c 4.43 3.83a, b, c 4.20 a, c 4.43b Tangibles 4.11 c 4.26 4.34 3.83a, b, c 4.23a 4.37b Assurance 4.19 c 4.29 4.35 3.89a, c 4.23a 4.20 Empathy 4.03a, b, c 4.23a, c 4.31b 3.79a, b, c 4.14a, c 4.17b a, b indicate a significant difference in ANOVA post hoc tests; two hotel segments with the same superscription differ in customer expectations or experiences of service quality; c indicates a significant difference in pair-sample t-tests between customer expectations and experiences of a particular dimension of service quality. d Limited service hotels include 1-2 stars (N = 138); Full service hotels include 2.5-3.5 stars (N = 235); Luxury hotels include 4-5 stars (N = 43).

113
TABLE 5 Pilot Study 1 - Meeting customer expectations on service quality in predicting satisfaction
Hotel star level Limited service hotels Full service hotels Luxury hotels Model 1 Model
2 Model 3
Model 4
Model 5
Model 6
Model 7
Model 8
Model 9
Intercept 4.02*** 4.04*** 4.05*** 3.92*** 3.96*** 3.96*** 4.48*** 4.75*** 4.26 Cost .04 .04 .04 .12 .11 .11 -.05 -.10 .01 Urban location -.04 -.06 -.06 .16 .15 .15 .15 .08 .27 Reliability .26* .20 .18 .21* .12 .09 .22 .16 .15 Responsiveness .36** .32** .29* .11* .06 .01 .26* .55 .07 Tangibles .12 .09 .25** .21* -.46* -.27 Assurance .04 .15 -.19 Empathy .08* .04* .81** F 10.48*** 8.58*** 6.18*** 6.40*** 6.75*** 5.18*** 2.71* 2.76* 6.52** R2 change .24*** .01 .00 .11*** .03** .01 .22* .05 .14* *** p < .001; ** p < .01; * p < .05.

114
TABLE 6 Pilot Study 2 - Qualitative Interviews with General Managers – Understanding Strategic Foci
Operational Excellence
“You can have a 200 room hotel that charges a very low rate, and have a very small employee structure, a very tight strategic plan.”
Product Leadership
“As you increase in price, you add the quality of the product, the rooms become nicer, they become more, better appointed, more amenities, more features, more services, those are the things you will see.” “For us we like to think that our identity is a very good location, very easy to get to, very good facility, it is the meeting room, the technology, the layout is very appealing to corporate meeting customers.” “They have either a 1 king, 1 queen, or 2 double beds. And they have a pull-out couch, a queen-size sleeper sofa in the living room, as well as a wet bar, a refrigerator, a microwave, a coffee maker and what not…we have the highest number of square foot per room.” “We have in-room safes, we have signature bedding…We have a 5-piece bathroom amenity set. Things like robes in the room, bath rugs, slippers we have only for our VIP customers.”
Universality of industry standards “There are standards of AAA and Mobil, they have guidelines as to what you need to have in order to be a 4 and 5 stars hotel. From a product standpoint, the physical product as well as the service levels.” “As you look at individual categories, you are going to see some similarities in the categories, 4, 5 stars, 3 star, they are all going to kind of act the same. Have the same level of service, have the same level of product. And price is about the same.” Heterogeneity of strategic foci “Every hotel is different. You can have hotels that essentially are right next to each other, and they can be run very very different.” “Hotels are all structured different depending on their size, their complexity, the market that they serve… So it is different between a business that makes a million dollars and a business that makes 40 million dollars. A 40 million dollar business is going to be much more complex and strategic than a million dollar business.”
Customer Intimacy
“I think as you add price, you add an increased level of service, which generally is more staff, better trained staff.” (We have) “a very high level of service. This is how we try to differentiate ourselves from our competitors.” (We have) “a level of service that is relaxed yet refined. Very down-to-the-earth staff who attempts to relate to our customers on a very human level.”
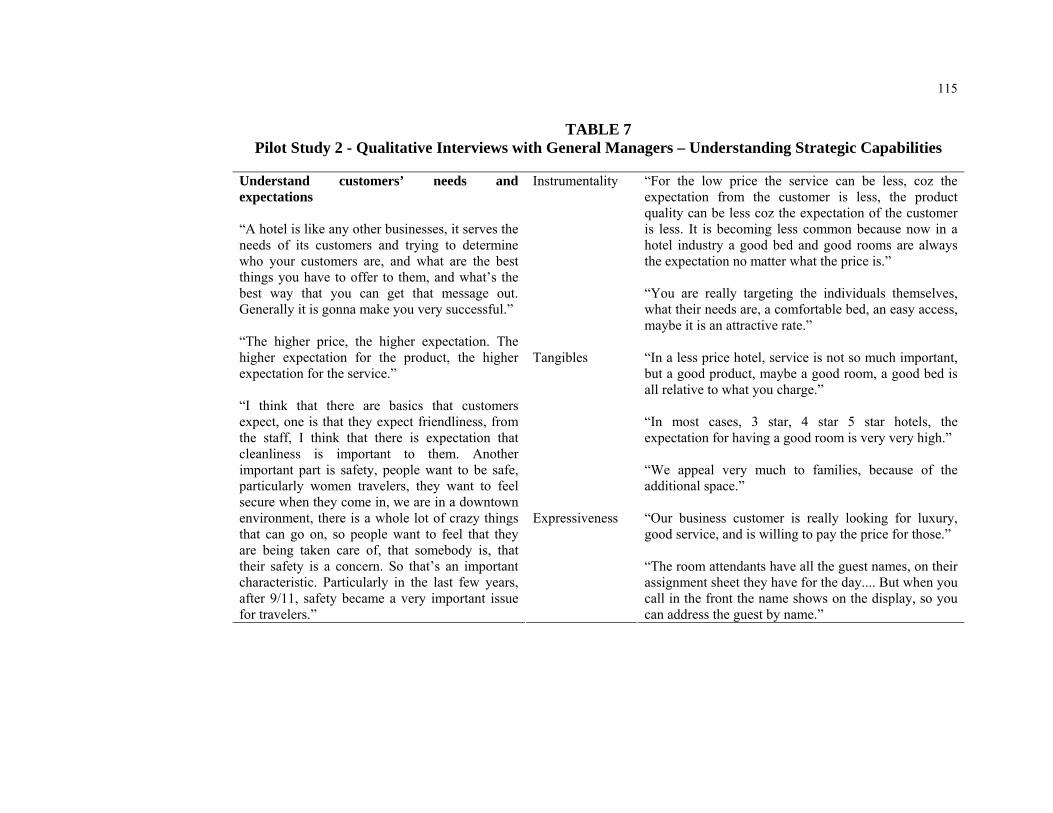
115
TABLE 7 Pilot Study 2 - Qualitative Interviews with General Managers – Understanding Strategic Capabilities
Instrumentality “For the low price the service can be less, coz the
expectation from the customer is less, the product quality can be less coz the expectation of the customer is less. It is becoming less common because now in a hotel industry a good bed and good rooms are always the expectation no matter what the price is.” “You are really targeting the individuals themselves, what their needs are, a comfortable bed, an easy access, maybe it is an attractive rate.”
Tangibles “In a less price hotel, service is not so much important, but a good product, maybe a good room, a good bed is all relative to what you charge.” “In most cases, 3 star, 4 star 5 star hotels, the expectation for having a good room is very very high.” “We appeal very much to families, because of the additional space.”
Understand customers’ needs and expectations “A hotel is like any other businesses, it serves the needs of its customers and trying to determine who your customers are, and what are the best things you have to offer to them, and what’s the best way that you can get that message out. Generally it is gonna make you very successful.” “The higher price, the higher expectation. The higher expectation for the product, the higher expectation for the service.” “I think that there are basics that customers expect, one is that they expect friendliness, from the staff, I think that there is expectation that cleanliness is important to them. Another important part is safety, people want to be safe, particularly women travelers, they want to feel secure when they come in, we are in a downtown environment, there is a whole lot of crazy things that can go on, so people want to feel that they are being taken care of, that somebody is, that their safety is a concern. So that’s an important characteristic. Particularly in the last few years, after 9/11, safety became a very important issue for travelers.”
Expressiveness “Our business customer is really looking for luxury, good service, and is willing to pay the price for those.” “The room attendants have all the guest names, on their assignment sheet they have for the day.... But when you call in the front the name shows on the display, so you can address the guest by name.”

116
TABLE 8 Pilot Study 2 - Qualitative Interviews – Understanding differentiation based on positions
Front of the house
Definition “A front-of-the-house activity is someone who interfaces directly with the guests on a one-to-one basis, a housekeeper, a front desk agent, a bell person, people who generally in areas where guests operate.” “Front desk is probably the most important, it is the location.” HRM differentiation based on positions [selection] “Front of the house requires more personality and presentation.” [training] “There is a greater emphasis on service.” [performance evaluation] “Measures of performance tend to be somewhat subjective and more difficult to gage particularly as it is reliant on customer feedback which tends to favor negative responses over positive - customers tend to write in more so when they have a problem than without.” [promotion] “Generally in the industry those from the front of the house have a greater shot at promotion to the very top… The interaction with a variety of clients gives front office management a more nuanced world view that equips them to be better managers over the long run.” [empowerment] “More discretion for the front.”
Division based on processes/positions “Hotels are really driven by function of the building so you have a department center that focus on ensuring the quality of the service is proper for the guest rooms, the sleeping areas, and you have the food/beverage department which does the same only for restaurants, and room service, and banquets, so the strategic direction in a hotel is driven more by the area of the hotel.” “The employees are separatedin departments. For example, housekeeping is an operating department. Property operation is an operating department, front office is an operating department, front service, door staff, bell and concierges is an operating department. Separatethem into different operating departments based on the functions they perform. ” Differentiation on strategic importance
Back of the house
Definition “Back of the house generally is an area where you wouldn’t see a guest, the kitchen, the shipping area, those types of areas, you are not going to see a guest walking through the kitchen, those people don’t need those areas where guests are generally present.”

117
“When you break it down, there are certainly people who are more strategic in their roles than others. People who their sole job is to focus on the day-to-day function of what’s going on, and there are others who certainly look much longer term, much more so.”
HRM differentiation based on positions [selection] “The ability to interact with co-workers and supervisors is of greater importance for the back.” “The need for “technology awareness”.” [training] “Service training is more focused for the individuals who have direct contact with the customers. For example, a dish washer, who doesn’t necessarily get to see the customers as frequently, or a laundry attendant who doesn’t have the opportunity to see a customer. They don’t have an as intensive customer service training as would have a bell person, or a front desk agent.” [performance evaluation] “Work output can be more easily measured.” [teamwork] “Greater tendency to have friction from inter-employee interaction in the back of the house.” [empowerment] “Back line employees doesn’t encounter customers as much so it is not an issue for them.”
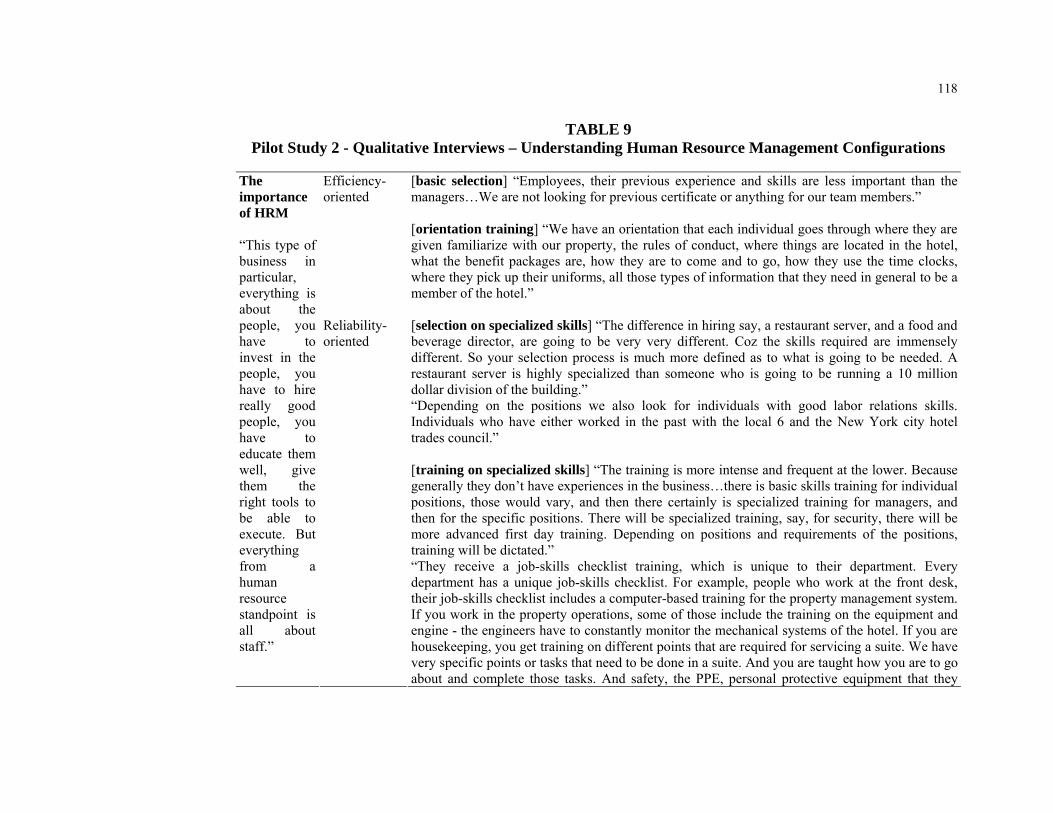
118
TABLE 9 Pilot Study 2 - Qualitative Interviews – Understanding Human Resource Management Configurations
Efficiency- oriented
[basic selection] “Employees, their previous experience and skills are less important than the managers…We are not looking for previous certificate or anything for our team members.” [orientation training] “We have an orientation that each individual goes through where they are given familiarize with our property, the rules of conduct, where things are located in the hotel, what the benefit packages are, how they are to come and to go, how they use the time clocks, where they pick up their uniforms, all those types of information that they need in general to be a member of the hotel.”
The importance of HRM “This type of business in particular, everything is about the people, you have to invest in the people, you have to hire really good people, you have to educate them well, give them the right tools to be able to execute. But everything from a human resource standpoint is all about staff.”
Reliability- oriented
[selection on specialized skills] “The difference in hiring say, a restaurant server, and a food and beverage director, are going to be very very different. Coz the skills required are immensely different. So your selection process is much more defined as to what is going to be needed. Arestaurant server is highly specialized than someone who is going to be running a 10 million dollar division of the building.” “Depending on the positions we also look for individuals with good labor relations skills. Individuals who have either worked in the past with the local 6 and the New York city hotel trades council.” [training on specialized skills] “The training is more intense and frequent at the lower. Because generally they don’t have experiences in the business…there is basic skills training for individual positions, those would vary, and then there certainly is specialized training for managers, and then for the specific positions. There will be specialized training, say, for security, there will be more advanced first day training. Depending on positions and requirements of the positions, training will be dictated.” “They receive a job-skills checklist training, which is unique to their department. Every department has a unique job-skills checklist. For example, people who work at the front desk, their job-skills checklist includes a computer-based training for the property management system. If you work in the property operations, some of those include the training on the equipment and engine - the engineers have to constantly monitor the mechanical systems of the hotel. If you are housekeeping, you get training on different points that are required for servicing a suite. We have very specific points or tasks that need to be done in a suite. And you are taught how you are to goabout and complete those tasks. And safety, the PPE, personal protective equipment that they

119
need to use, how they use the mechanicals that they clean the suites with. So forth and so on.” [performance evaluation based on results] “Every position has a skills outline and a performance outline, so all the key factors for that particular position are written in the evaluation. So it is pretty specialized for each position. And each individual is evaluated on how well they do on those particular special skills.” [suggestion] “There is a “bright ideas” program at the hotel, where there are suggestion boxes, where individuals have an idea for improvement on hotel operations they can write it down, human resources department takes them out, and then they review it once in a month, there is a care committee in the hotel, which is a committee that is made up of team members and management…But this “bright ideas” program goes to the committee, those individual that has an idea that is actually taken and put into practices, receives a gift card as a reward. They may give a gift card to Macy’s, or to divergent records, give a gift card to AMC movies, or give a gift card to redeem different types of prizes that people enjoy.” [information sharing system] “There is a hierarchy, there is a reporting hierarchy. There is process of how information flows, and is received, and who receives it. And how it is communicated. Ensure that whenever the communication is there is an action needed, the action is executed.” “We have a dispatching system that we have in place in the hotel, that we have the operation reports that a light bulb is out, the person puts it into the computer, sends it over the radio, or depending on the ability to send a text message to… It is how we keep track of all the things that we need to address. Same thing for the guest calls. As a matter of fact, we have time limits in which we want an answer for the guest calls. If a guest needs an extra pillow, we have a system to ensure that they receive the extra pillow within 15 minutes of call.” [internal feedback] “We give our feedback on a regular basis based on inspections of their work. We give them feedback based upon information we receive from our customers. And information we get from audits in every department. For example, we inspect the guest rooms, the suite maintenance, and give them feedback on a level of cleanliness. That’s done everyday. Different days we have managers assigned to do that, we have managers on duty program, plus executive participates in the inspection three days a week. Housekeeping managers do inspections. Same thing for the property operations team members to do suite care, as it is called here. Maintenance and Touch up or what not in a suite and do several rooms per day and cycle

120
through the hotel. On a minimum they do it six times a year. The front desk is provided with feedback as well based upon observations they perform their duties in check in and check out.”
Flexibility- oriented
[selection on communication skills] “are obviously important for folks, staff that interact with our guests on a daily basis. So there is some consideration when you are selecting for those positions.” “We are looking for individuals that have a very warm and engaging demeanor, personality, people who have a nice energy and nice smiles that will make our customers feel at ease, and feel welcome. Individuals that are not shy to engage the guests and make them feel at home.” [service training]“Just because a person doesn’t interact with a guest, doesn’t mean that it is not important for them to know what good service is. So everybody goes through customer servicetraining, no matter what position. Because one of the things that within our hotel, there is a philosophy that even though maybe I am a dishwasher, I am a cook, I do have customers too, they are my coworkers, so how you deal with a guest should be the same as you deal with a coworker. They are also trained communication skills.” “And there are service training, modules that we go through as well. So individuals are provided training on how to handle different situations with customers, how to approach them, and what is included in the service training is…culture philosophy on how to deal with customers and what not.” [cross promotion] “People could be promoted to other departments. There is always a possibility. If a restaurant server wants to apply to be a front desk agent, or if they want to apply to maybe become a manager, or a supervisor. Those who are specialized can be cross promoted, but generally they don’t because their skills are so specialized. But every promotion or every transfer is based on the person’s qualification, whether they can do the job, it is not they have to do it because they want to do it, they have to be qualified to do it.” “Promotion is based upon their performance, they can be promoted to any positions that they are interested in.” [empowerment] “One is that you have to give them the permission to do it, and the freedom to make decisions on their own. So that is philosophical, a point that you have to make clear that in the end the guest request has to be fulfilled, irregardless of what that may be. It is important that we can make sure that the guests feel like they are being taken care of. So everybody has to have the feeling that they can do whatever it takes.”

121
“They are empowered 100%. They make decisions that they need to make in order to take care of a customer. Our servers in the restaurant, if the customers aren’t happy with their meals, they are empowered to comp the bills, or to take the charges off the bill. Our team members here are empowered to discount the price of the room, or to give a free room, or to give a feature certificate for a free night. There are comp amenities to be sent to a room, to give them complimentary breakfasts or complimentary cocktail at the bar. They are all able to do what they want.” [pay on individual performance] “On an individual basis.” [cross-functional teamwork] “There is a big emphasis on teamwork, you have to work as a team in a hotel, every department depends on each other. One department doesn’t perform well, the business doesn’t perform well. You can have great rooms, you can be very very clean, but therestaurant is not so good, the hotel is not so good. Everything has to be equal, or it affects the perception of the customer.” “When you bring in a large group, a large company meeting, the needs of that meeting are going to demand certain things, certain levels of performance from each department, so the departments will have to collaborate, to make sure that those needs are being met. There is a lot of information that flows throughout the building, that goes individual to individual, department to department. And there has to be a very collaborative kind of environment in order to make that work.” [external feedback] “We have mystery shoppers, or secret shoppers, that come in to the hotel, that provide feedback. They disguise themselves as a regular guest, and they evaluate the performance at various departments…a company that provides this service, we pay them and they come in and provide details. Very detailed, on every aspect of the hotel, so they inspect our business center, the laundry, the room service, the restaurant, the front desk, the bell staff, and customer care line, property operation, housekeeping, everybody, concierges.”

122
TABLE 10 Factor Analysis of Strategic Positions Ratingsa
Component
Front of the house
service staff Back of the house
operation staff Administrative
staff Extended
activity staffCall centerservice staff
6. Doormen .84 .00 .10 .14 .205. Bell attendants .79 .09 .10 .15 .249. Parking staff .77 .11 .09 .08 -.034. Concierges .74 -.07 .07 .19 .2211. Entertainment servers .58 .05 .19 .27 -.018. Security officers .58 .27 .30 .13 -.1117. Housekeeping staff .09 .85 .17 .15 .0310. Maids and room service staff .12 .84 -.02 -.04 .011. Front desk staff .04 .63 -.09 .11 .4816. Operation/engineering staff -.01 .62 .27 .13 .1413. Auditing clerks .29 .15 .73 -.08 -.0914. Administrative clerks .03 .06 .72 .19 .1512. Cashiers and accounting .08 .14 .62 .13 .0215. Purchasing staff .28 -.08 .60 .22 .2619. Kitchen staff .28 .10 .13 .80 -.007. Food and beverage servers .41 .22 -.04 .72 .0018. Event/activity/planners .23 -.03 .25 .68 .1020. Sales persons -.06 .16 .22 .50 .432. Reservation staff .14 .02 .04 .07 .723. Customer service staff .24 .33 .18 -.02 .61 aExtraction Method: Principal Component Analysis. Rotation Method: Varimax with Kaiser Normalization. Variance explained: 61.26%.

123
TABLE 11 Means, Standard Deviations, Reliabilities, and Correlations of Variables
Mean S.D. 1 2 3 4 5 6 7 8 9 10 11 12 13 1.LogREVPARb 2.00 .28 2.LogOccupancy 1.83 .09 .34***3.LogGOPPAR 1.71 .36 .59***.37***4.Capability:Value 3.73 .74 .28** .10 .165.Capability:Tangible 3.92 .76 .45*** .24**.27**.87*** .94 a
6.Capability:Service 4.01 .61 .30*** .06 .16.83***.79***.92 a
7.HR:Flexibility -.82 .39 .01 .00 .17* .07 .10 .13 .82 a
8.HR:Reliability -.64 .24 -.11 -.08 -.00 .07 .08 .09.62*** .77 a
9.HR:Efficiency -.63 .27 -.05 -.07 -.00 .06 .08 .12.53***.77*** .74 a
10.Position:Service 1.41 .86 .19* .15* .14 .13 .21** .09 .16* -.02 -.07 .87 a
11.Position:Operation 2.59 .43 .01 -.01 .09 .09 .06 .10 .06 .02 -.05 .24** .78 a
12.Position:Administration 3.17 .92 .28*** .04 .03 .18* .25**.14* .25** .03 -.00 .59*** .06 .68 a
13.Position:Activity 2.31 .67 .14 -.03 .04 .01 .07 .05 .09 -.11 -.08 .57***.30*** .34*** .77 a
14.Position:Hotline 2.55 .59 .10 -.10 .10 .10 .07 .09 .10 -.04 -.07 .34***.42*** .28*** .28***15.Star:Full Service .46 .50 -.11 .02 .09 -.15* -.23** -.14 -.02 .01 .04 -.11 .16* -.16* -.1016:Star:Luxury .33 .47 .30*** .12 .01 .20*.34***.19* .08 .01 .02 .29*** -.09 .25** .22**17.# of Full-time EEs 163.09251.32 .12 .12 .08 .07 .15* -.01 -.07 -.17*-.28*** .36*** .05 .21** .18*18.# of Part-time EEs 49.43 166.85 .07 .05 .04 .02 .03 -.04 -.08 -.12 -.20** .14* .03 .07 .0719.% Unionized 18.57 31.09 .23** .05 .00 .14 .17* .06 -.06 -.04 -.07 .18* -.16* .23** .0820.# of Rooms 200.33196.65 .03 .12 -.01 -.02 .08 -.05 .02 .03 .02 .33*** .02 .18* .20***21.North America .50 .50 -.09 .02 .08 -.17* -.17* -.07 -.07 .14* .22**-.27*** .23**-.36***-.29***22.Location:Urban .42 .50 .05 .15* .16* .13 .12 .04 -.15* -.06 -.06 .17* -.10 .04 -.0523.Location:Suburb .20 .40 .22** -.07 -.03 .05 .04 .02 -.02 -.02 -.07 .08 .13 .01 .1024.Type:Hotel .78 .42 -.22** .17* .16* .04 .05 -.06 .13 .04 .08 .08 .03 -.01 -.0825.Owned by brand .32 .47 .03 .09 -.04 -.01 .08 -.08 -.12 -.18* -.09 .28*** .04 .17* .23**26.Owned by franchised .28 .45 -.21** .16* -.03 -.08 -.13 -.04 .14* .06 .05-.31*** .23**-.27*** -.16*27.Managed by brand .20 .40 .01 .13 -.09 .05 .10 .00 -.09 -.12 -.12 .24** .01 .12 .16*28.Managed by mgt co. .25 .43 .04 .00 .17 -.13 -.15* -.09 .15* .06 .14* -.10 .16* -.03 .0229.Human capital 3.65 .68 -.01 .07 .11 .09 .09 .10.32*** .23** .17* .20** .06 .24** .19*

124
14 15 16 17 18 19 20 21 22 23 24 25 26 27 28 14.Position:Hotline .46 a
15.Star:Full Service .0116:Star:Luxury -.00-.65***17.# of Full-time EEs .12 -.05 .21**18.# of Part-time EEs .07 .09 -.01 .82***19.% Unionized .02 -.05 .20** .10 .0120.# of Rooms -.01 -.12 .32*** .43*** .16*.24**21.North America -.14* .29***-.34***-.28*** -.11 -.16* -.0322.Location:Urban -.07 -.04 .17* .01 -.13 .12 .18* -.1123.Location:Suburb .15* -.09 .15* .13 .16* -.10 -.09 -.03-.42***24.Type:Hotel -.03 .18* -.06 .02 -.12 .01 .16* .10 .27***-.37***25.Owned by brand .08 -.21** .33*** .31*** .10 .00.43*** -.24** .10 .01 .0326.Owned by franchised -.08 .27***-.32*** -.17* -.12 -.01 -.05 .34*** -.18* -.20**.23**-.43***
27.Managed by brand .07 -.16* .29*** .33*** .12 .13.41***-.26*** .08 .00 .03 .58*** -.20**28.Managed by mgt .03 .11 -.05 -.09 -.10 -.02 .02 .18* -.03 -.13 .13 -.07.31***-.29***29.Human capital .12 .06 -.02 -.07-.16* .00 .14* -.04 .02 -.02 .12 .07 .04 .14*-.02.73a
a numbers in diagonal are Cronbach’s alphas. bLogREVPAR = logarithm of Revenue per available room; LogOccupancy = logarithm of Occupancy; LogGOPPAR = logarithm of Gross operating profit per available room; Star: Full Service is dummy coded (1 = full service hotels and 0 = others); Star: Luxury is dummy coded (1 = luxury hotels and 0 = others), North America is dummy coded as 1 = located in North America and 0 = located in elsewhere; Location: Urban is dummy coded (1 = urban location and 0 = other locations); Location: Suburb is dummy coded (1 = suburb location and 0 = other locations); Type: Hotel is dummy coded as 1 = Hotel and 0 = others (such as resorts); Owned by brand is dummy coded as 1 = owned by hotel brand and 0 = other ownership; Owned by franchised is dummy coded as 1 = owned by franchised company and 0 = other ownership; Managed by brand is dummy coded as 1 = managed by hotel brand and 0 = other management; Managed by mgt is dummy coded as 1 = managed by management company and 0 = other management. * p < .05 (1-tailed). ** p < .01 level (1-tailed). *** p < .001 (1-tailed).N = 152.

125
TABLE 12 Customer Evaluations of Capabilities in Predicting LogREVPAR (Hypothesis 1)
Model 1 Model 2 Model 3 Model 4 Model 5 Model 6(Constant) 1.42*** 1.30*** 1.28 1.23*** 1.26*** 1.11** Fulltime Employees .00 .00 .00 .00 -.00 .00 Parttime Employees .00 -.00 -.00 -.00 .00 .00 UNION % .00 .00 .00 .00 .00 .00 ROOMS # .00 .00 .00 .00 .00 .00 Owned by brand co._dmy -.02 -.02 -.02 -.01 .00 .01 Owned by franchised co._dmy -.02 -.02 -.02 -.02 -.01 -.02 Mgt by brand co._dmy -.05 -.03 -.03 -.02 .00 -.03 Mgt by mgt co._dmy .07 .07 .07 .06 .06 .04 North America_dmy .04 .01 .01 .02 .02 .02 Loc Urban _dmy .03 .07 .07 .07 .07 .07 Loc Suburb _dmy .14 .15* .15* .16* .16* .17* Type: Hotel_dmy -.06 -.05 -.05 -.06 -.05 -.05 Human Capital .02 .01 .01 .01 .01 .01 Star: Full service_dmy .14* .13* .13* .42 .40 .69 Star: Luxury_dmy .27** .18* .18* -.16 -.49 -.25 Capability: Value .09** -.13* -.14 -.11 -.14 -.15 Capability: Tangibles .25*** .25*** .28*** .30*** .27*** Capability: Service .02 -.02 -.03 .04 Value*Full service_dmy -.08 Value*Luxury_dmy .08 Tangibles*Full service_dmy -.08 Tangibles*Luxury_dmy .15 Service*Full service_dmy -.14 Service*Luxury_dmy .10 R2 change .05** .09*** .00 .02 .03+ .04* R2 .33*** .42*** .42*** .45*** .45*** .47*** F (16,99)
= 3.08 (17,98) = 4.20
(18,97) = 3.92
(20,95) = 3.81
(20,95) = 3.95
(20,95) = 4.04
*** p < .001; ** p < .01; * p < .05.

126
FIGURE 2
Ser vi ce * Hot el St ar s I nt er act i on
1
1. 1
1. 2
1. 3
1. 4
1. 5
1. 6
l ow hi ghCust omer Eval uat i ons of Ser vi ce
LogR
EVPA
R
Li mi t ed- ser vi ceFul l - ser vi ceLuxur y
$85
$129

127
FIGURE 3
Tangi bl es * Hot el St ar s I nt er eact i on
1. 8
2
2. 2
2. 4
2. 6
2. 8
3
l ow hi ghCust omer Eval uat i ons of Tangi bl es
LogR
EVPA
R
Li mi t ed- ser vi ceFul l - ser vi ceLuxur y

128
TABLE 13 Customer Evaluations of Capabilities in Predicting LogOccupancy (Hypothesis 1)
Model 1 Model 2 Model 3 Model 4 Model 5 Model 6 (Constant) 1.73*** 1.70*** 1.75*** 1.83*** 1.85*** 1.79*** Fulltime EEs .00 -.00 -.00 -.00 -.00 -.00 Parttime EEs -.00 .00 .00 .00 .00 .00 UNION % .00 .00 .00 .00 .00 .00 ROOMS # .00 .00 .00 .00 .00 .00 Owned by brand co._dmy -.02 -.02 -.02 -.02 -.02 -.02 Owned by franchised co._dmy .04 .04 .04 .05 .04 .04 Mgt by brand co._dmy .01 .01 .02 .02 .02 .02 Mgt by mgt co._dmy .01 .02 .02 .02 .02 .02 North America_dmy -.01 -.02 -.02 -.02 -.02 -.02 Loc Urban _dmy .01 .02 .02 .02 .02 .02 Loc Suburb _dmy -.02 -.01 -.02 -.02 -.01 -.02 Type: Hotel_dmy .00 .00 -.00 .00 .00 -.00 Human Capital .01 .01 .01 .01 .01 .01 Star: Full service_dmy .02 .02 .01 -.11 -.14 -.07 Star: Luxury_dmy .05 .03 .03 -.06 -.04 .03 Capability: Value .01 -.05* -.03 -.06 -.03 -.03 Capability: Tangibles .07** .07** .07** .04 .07** Capability: Service -.03 -.03 -.03 -.04 Value*Full service_dmy .03 Value*Luxury_dmy .02 Tangibles*Full service_dmy .04 Tangibles*Luxury_dmy .02 Service*Full service_dmy .02 Service*Luxury_dmy .00 R2 change .01 .06** .01 .01 .02 .01 R2 .13 .19 .20 .21 .22 .20 F (16,105)
= .95 (17,104) = 1.42
(18,103) = 1.41
(20,101) = 1.34
(20,101) = 1.39
(20,101) = 1.28
*** p < .001; ** p < .01; * p < .05.
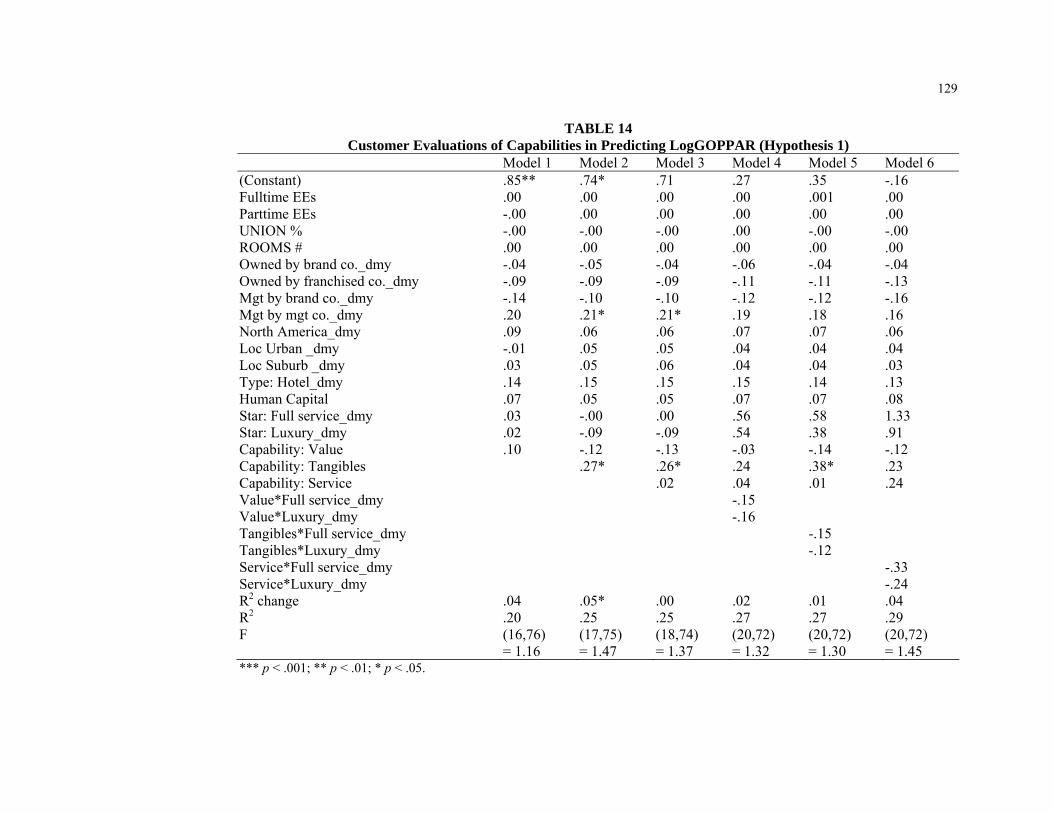
129
TABLE 14 Customer Evaluations of Capabilities in Predicting LogGOPPAR (Hypothesis 1)
Model 1 Model 2 Model 3 Model 4 Model 5 Model 6 (Constant) .85** .74* .71 .27 .35 -.16 Fulltime EEs .00 .00 .00 .00 .001 .00 Parttime EEs -.00 .00 .00 .00 .00 .00 UNION % -.00 -.00 -.00 .00 -.00 -.00 ROOMS # .00 .00 .00 .00 .00 .00 Owned by brand co._dmy -.04 -.05 -.04 -.06 -.04 -.04 Owned by franchised co._dmy -.09 -.09 -.09 -.11 -.11 -.13 Mgt by brand co._dmy -.14 -.10 -.10 -.12 -.12 -.16 Mgt by mgt co._dmy .20 .21* .21* .19 .18 .16 North America_dmy .09 .06 .06 .07 .07 .06 Loc Urban _dmy -.01 .05 .05 .04 .04 .04 Loc Suburb _dmy .03 .05 .06 .04 .04 .03 Type: Hotel_dmy .14 .15 .15 .15 .14 .13 Human Capital .07 .05 .05 .07 .07 .08 Star: Full service_dmy .03 -.00 .00 .56 .58 1.33 Star: Luxury_dmy .02 -.09 -.09 .54 .38 .91 Capability: Value .10 -.12 -.13 -.03 -.14 -.12 Capability: Tangibles .27* .26* .24 .38* .23 Capability: Service .02 .04 .01 .24 Value*Full service_dmy -.15 Value*Luxury_dmy -.16 Tangibles*Full service_dmy -.15 Tangibles*Luxury_dmy -.12 Service*Full service_dmy -.33 Service*Luxury_dmy -.24 R2 change .04 .05* .00 .02 .01 .04 R2 .20 .25 .25 .27 .27 .29 F (16,76)
= 1.16 (17,75) = 1.47
(18,74) = 1.37
(20,72) = 1.32
(20,72) = 1.30
(20,72) = 1.45
*** p < .001; ** p < .01; * p < .05.

130
TABLE 15 Suggested HR Profiles and Strategic Positions in Predicting Customer Evaluations of Value (Hypotheses 2 & 3) a
Model 1 Model 2 Model 3 Model 4 Model 5 Model 6 Model 7 Model 8
Model 9 Model 10
(Constant) 3.60*** 2.37** 3.30** 3.83** 2.54** .06 1.71 2.60** 2.41** 2.56** Fulltime EEs .00 .00 -.00 -.00 -.00 -.00 -.00 -.00 .00 -.00 Parttime EEs .00 .00 .00 .00 .00 .00 .00 .00 .00 .00 UNION % .00 .00 .00 .00 .00 .00 .00 .00 .00 .00 ROOMS # .00 .00 -.00 -.00 .00 .00 .00 .00 -.00 -.00 Owned by brand co._dmy -.09 -.15 -.10 -.09 -.15 -.19 -.18 -.16 -.13 -.11 Owned by franchised co._dmy .07 -.04 .02 .02 -.02 -.08 -.08 -.06 -.05 -.09 Mgt by brand co._dmy .07 .07 .09 .07 .04 .05 -.02 .08 .04 .02 Mgt by mgt co._dmy -.24 -.26 -.24 -.24 -.29 -.25 -.29 -.30 -.26 -.30 North America_dmy -.14 -.26 -.23 -.26 -.31 -.24 -.30 -.30 -.24 -.31 Loc Urban _dmy .28 .23 .26 .27 .19 .19 .17 .19 .22 .20 Loc Suburb _dmy .21 .13 .16 .16 .10 .10 .06 .11 .11 .10 Type: Hotel_dmy .13 .18 .20 .22 .17 .25 .19 .19 .19 .22 Human Capital .07 .08 .10 .11 .03 .11 .07 .06 .07 .06 Star: Full service_dmy -.16 -.17 -.99 -1.44 -.48 3.19* 1.55 .08 .16 -.12 Star: Luxury_dmy .12 .10 -1.12 -1.44 .52 2.46 .57 -.89 -.46 -.53 HR: Efficiency .29 .55 1.64 .40 .80 .36 .58 .59 .55 .55 HR: Reliability -.03 -.23 -.03 1.86 -.29 -.24 -.31 -.08 -.18 -.15 HR: Flexibility .05 -.09 -.06 -.04 -.15 -.03 -.13 -.18 -.09 -.14 Position: Front service -.01 -.00 .01 .02 .06 .08 -.00 .00 -.08 Position: Back operation .48* .36 .38 .58* 1.45** .44 .49* .46 .48* Position: Administration .07 .08 .05 .08 .05 .05 .05 .07 .07 Position: Activity -.14 -.10 -.14 -.15 -.22 -.24 -.1 -.06 -.12 Position: Call center .02 .03 .03 -.03 -.07 .42+ .01 .00 .02 HR Efficiency * Full service_dmy
-1.26
HR Efficiency * Luxury_dmy -1.89+ HR Reliability * Full service_dmy
-1.96
HR Reliability * Luxury_dmy -2.37+

131
HR Flexibility * Full Service_dmy
-.38
HR Flexibility * Luxury_dmy .54 Back operation * Full service_dmy
-1.30**
Back operation * Luxurry_dmy -.91 Call center * Full service_dmy -.66* Call center * Luxury_dmy -.17 Administration * Full service_dmy
-.08
Administration * Luxury_dmy .29 Activity * Full service_dmy -.16 Activity * Luxury_dmy .20 Front service * Full service_dmy
.00
Front service * Full service_dmy
.40
R2 change .01 .05 .02 .02 .03 .06* .05 .03 .01 .02 R2 .13 .18 .21 .21 .21 .24 .23 .21 .19 .21 F (18,107)
= .80 (23,102) = 1.00
(25,100) = 1.04
(25,100) = 1.04
(25,100) = 1.07
(25,100) = 1.27
(25,100) = 1.19
(25, 100) = 1.06
(25,100) = .95
(25,100) = 1.05
*** p < .001; ** p < .01; * p < .05; + p < .10. a Variables in Italic are hypothesized

132
FIGURE 4
HR Ef f i ci ency * Hot el s I nt er act i on
0
0. 5
1
1. 5
2
2. 5
3
l ow hi ghEf f i ci ency Or i ent ed HR syst em
Cust
omer
Eva
luat
ions
of
Valu
e
Li mi t ed- ser vi ceFul l - ser vi ceLuxur y

133
FIGURE 5
HR Rel i abi l i t y * Hot el s I nt er act i on
0. 5
1
1. 5
2
2. 5
3
3. 5
l ow hi ghRel i abi l i t y Or i ent ed HR syst em
Cust
omer
Eva
luat
ions
of
Valu
e
Li mi t ed- ser vi ceFul l - ser vi ceLuxur y

134
FIGURE 6
Back Oper at i ons * Hot el I nt er act i on
2
2. 5
3
3. 5
4
4. 5
5
l ow hi ghSt r at egi c Back Oper at i ons St af f
Cust
omer
Eva
luat
ions
of
Valu
e
Li mi t ed- ser vi ceFul l - ser vi ceLuxur y

135
FIGURE 7
Cal l Cent er * Hot el I nt er act i on
0. 5
1
1. 5
2
2. 5
3
3. 5
l ow hi ghSt r at egi c Cal l Cent er St af f
Cust
omer
Eva
luat
ions
of
Valu
e
Li mi t ed- ser vi ceFul l - ser vi ceLuxur y
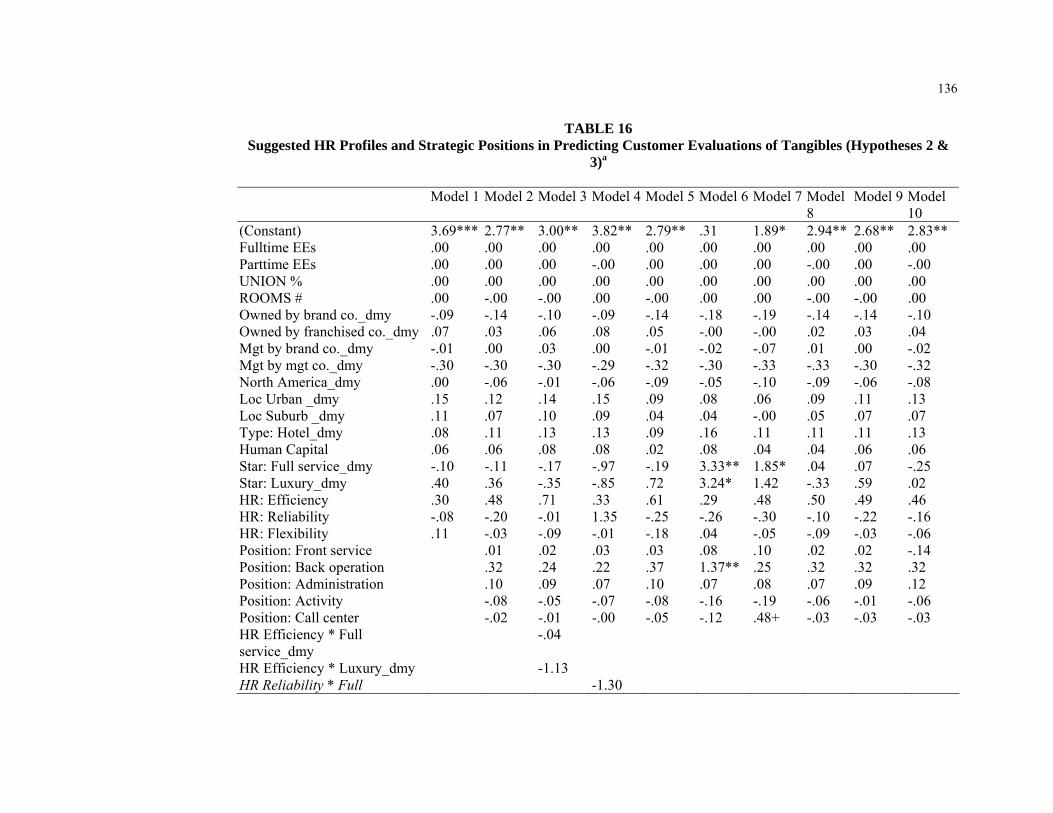
136
TABLE 16 Suggested HR Profiles and Strategic Positions in Predicting Customer Evaluations of Tangibles (Hypotheses 2 &
3)a Model 1 Model 2 Model 3 Model 4 Model 5 Model 6 Model 7 Model
8 Model 9 Model
10 (Constant) 3.69*** 2.77** 3.00** 3.82** 2.79** .31 1.89* 2.94** 2.68** 2.83** Fulltime EEs .00 .00 .00 .00 .00 .00 .00 .00 .00 .00 Parttime EEs .00 .00 .00 -.00 .00 .00 .00 -.00 .00 -.00 UNION % .00 .00 .00 .00 .00 .00 .00 .00 .00 .00 ROOMS # .00 -.00 -.00 .00 -.00 .00 .00 -.00 -.00 .00 Owned by brand co._dmy -.09 -.14 -.10 -.09 -.14 -.18 -.19 -.14 -.14 -.10 Owned by franchised co._dmy .07 .03 .06 .08 .05 -.00 -.00 .02 .03 .04 Mgt by brand co._dmy -.01 .00 .03 .00 -.01 -.02 -.07 .01 .00 -.02 Mgt by mgt co._dmy -.30 -.30 -.30 -.29 -.32 -.30 -.33 -.33 -.30 -.32 North America_dmy .00 -.06 -.01 -.06 -.09 -.05 -.10 -.09 -.06 -.08 Loc Urban _dmy .15 .12 .14 .15 .09 .08 .06 .09 .11 .13 Loc Suburb _dmy .11 .07 .10 .09 .04 .04 -.00 .05 .07 .07 Type: Hotel_dmy .08 .11 .13 .13 .09 .16 .11 .11 .11 .13 Human Capital .06 .06 .08 .08 .02 .08 .04 .04 .06 .06 Star: Full service_dmy -.10 -.11 -.17 -.97 -.19 3.33** 1.85* .04 .07 -.25 Star: Luxury_dmy .40 .36 -.35 -.85 .72 3.24* 1.42 -.33 .59 .02 HR: Efficiency .30 .48 .71 .33 .61 .29 .48 .50 .49 .46 HR: Reliability -.08 -.20 -.01 1.35 -.25 -.26 -.30 -.10 -.22 -.16 HR: Flexibility .11 -.03 -.09 -.01 -.18 .04 -.05 -.09 -.03 -.06 Position: Front service .01 .02 .03 .03 .08 .10 .02 .02 -.14 Position: Back operation .32 .24 .22 .37 1.37** .25 .32 .32 .32 Position: Administration .10 .09 .07 .10 .07 .08 .07 .09 .12 Position: Activity -.08 -.05 -.07 -.08 -.16 -.19 -.06 -.01 -.06 Position: Call center -.02 -.01 -.00 -.05 -.12 .48+ -.03 -.03 -.03 HR Efficiency * Full service_dmy
-.04
HR Efficiency * Luxury_dmy -1.13 HR Reliability * Full -1.30
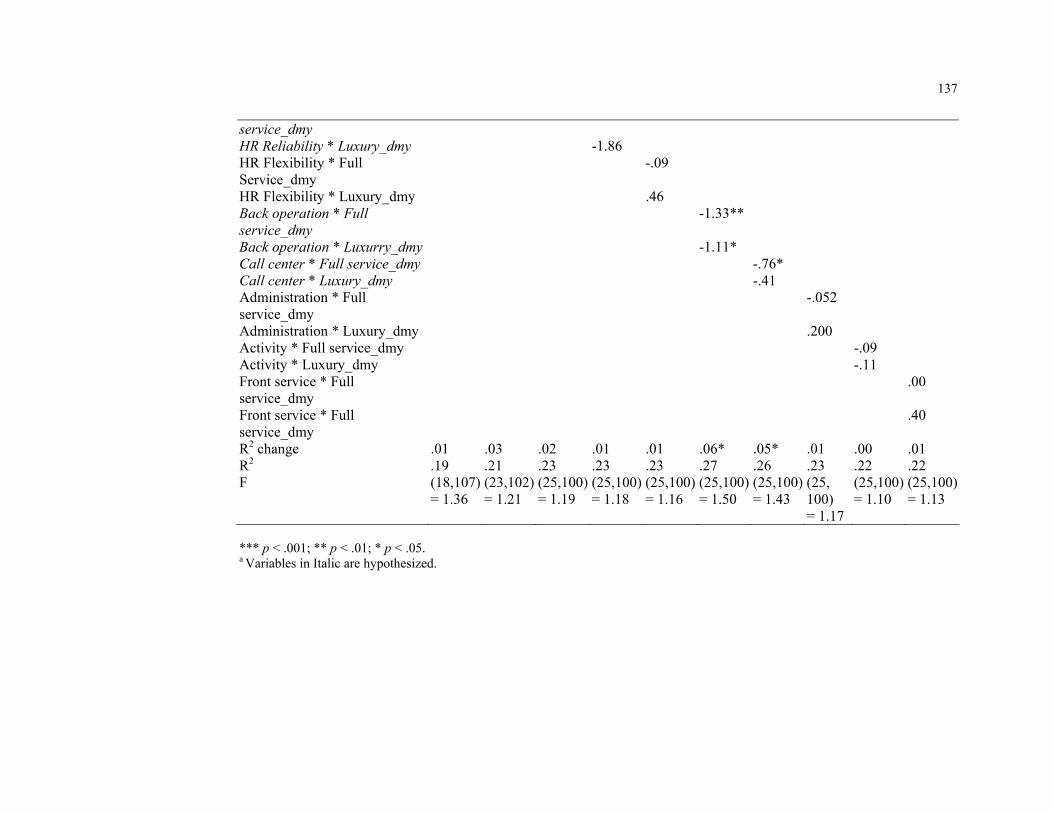
137
service_dmy HR Reliability * Luxury_dmy -1.86 HR Flexibility * Full Service_dmy
-.09
HR Flexibility * Luxury_dmy .46 Back operation * Full service_dmy
-1.33**
Back operation * Luxurry_dmy -1.11* Call center * Full service_dmy -.76* Call center * Luxury_dmy -.41 Administration * Full service_dmy
-.052
Administration * Luxury_dmy .200 Activity * Full service_dmy -.09 Activity * Luxury_dmy -.11 Front service * Full service_dmy
.00
Front service * Full service_dmy
.40
R2 change .01 .03 .02 .01 .01 .06* .05* .01 .00 .01 R2 .19 .21 .23 .23 .23 .27 .26 .23 .22 .22 F (18,107)
= 1.36 (23,102) = 1.21
(25,100) = 1.19
(25,100) = 1.18
(25,100) = 1.16
(25,100) = 1.50
(25,100) = 1.43
(25, 100) = 1.17
(25,100) = 1.10
(25,100) = 1.13
*** p < .001; ** p < .01; * p < .05. a Variables in Italic are hypothesized.

138
FIGURE 8
Back Oper at i on * Hot el s I nt er act i on
2
2. 5
3
3. 5
4
4. 5
5
l ow hi ghSt r at egi c Back Oper at i on St af f
Cust
omer
Eva
luat
ions
of
Tang
ible
s
Li mi t ed- ser vi ceFul l - ser vi ceLuxur y
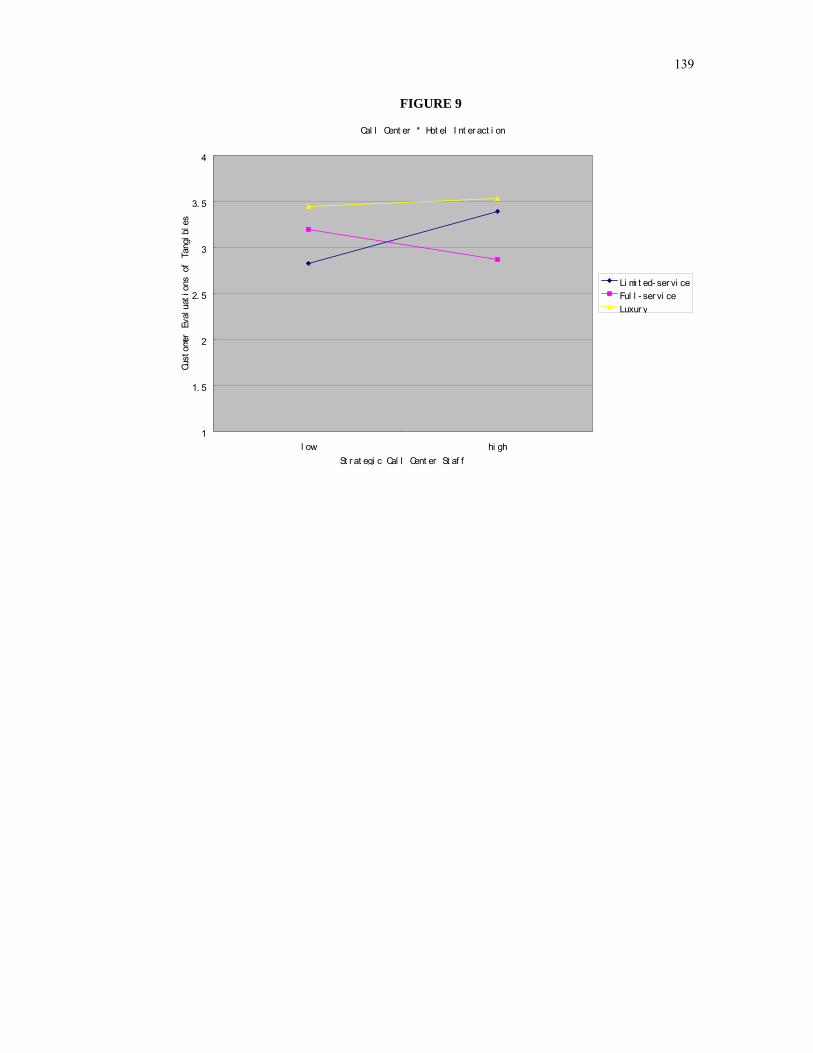
139
FIGURE 9
Cal l Cent er * Hot el I nt er act i on
1
1. 5
2
2. 5
3
3. 5
4
l ow hi ghSt r at egi c Cal l Cent er St af f
Cust
omer
Eva
luat
ions
of
Tang
ible
s
Li mi t ed- ser vi ceFul l - ser vi ceLuxur y

140
TABLE 17
Suggested HR Profiles and Strategic Positions in Predicting Customer Evaluations of Service (Hypotheses 2 & 3)a Model 1 Model 2 Model
3 Model 4 Model 5 Model 6 Model 7 Model 8 Model 9 Model
10 (Constant) 4.16*** 3.43*** 3.67*** 3.90*** 3.79*** 1.50 2.85*** 3.93*** 3.49*** 3.65***Fulltime EEs .00 -.00 .00 -.00 .00 .00 .00 .00 -.00 .00 Parttime EEs -.00 .00 .00 .00 .00 .00 .00 .00 .00 .00 UNION % .00 .00 .00 .00 .00 .00 .00 .00 .00 .00 ROOMS # -.00 -.00 -.00 -.00 .00 .00 .00 .00 -.00 .00 Owned by brand co._dmy -.21 -.25 -.23 -.23 -.25 -.28 -.28 -.25 -.24 -.19 Owned by franchised co._dmy .03 -.05 -.02 -.03 -.03 -.08 -.09 -.06 -.05 -.09 Mgt by brand co._dmy .11 .12 .13 .12 .07 .10 .03 .14 .10 .06 Mgt by mgt co._dmy -.19 -.21 -.20 -.20 -.25 -.20 -.24 -.27 -.21 -.26 North America_dmy .01 -.04 -.01 -.03 -.10 -.02 -.07 -.10 -.02 -.10 Loc Urban _dmy .09 .07 .09 .09 .03 .04 .02 .04 .07 .05 Loc Suburb _dmy .01 -.04 -.01 -.02 -.06 -.06 -.10 -.05 -.05 -.07 Type: Hotel_dmy -.13 -.09 -.07 -.08 -.09 -.03 -.08 -.08 -.09 -.05 Human Capital .05 .05 .06 .06 -.01 .07 .03 .01 .04 .03 Star: Full service_dmy -.18 -.22 -.34 -.59 -.77 2.62* 1.38* -.18 -.07 -.27 Star: Luxury_dmy .14 .10 -.47 -.46 .37 2.01 .39 -1.57* -.35 -.76* HR: Efficiency .30 .47 .74 .40 .78 .31 .51 .49 .46 .46 HR: Reliability -.26 -.35 -.21 .35 -.40 -.35 -.42 -.12 -.31 -.24 HR: Flexibility .12 .06 .03 .06 .19 .10 .01 -.08 .05 -.02 Position: Front service -.01 -.01 -.01 .02 .04 .07 -.00 -.01 -.20 Position: Back operation .28 .22 .23 .40* 1.09** .24 .29 .26 .28 Position: Administration .01 .01 -.00 .01 -.01 -.01 -.11 .01 .02 Position: Activity .01 .03 .02 .00 -.05 -.08 .06 .04 .05 Position: Call center .01 .02 .02 -.04 -.06 .37+ -.01 .01 .01 HR Efficiency * Full service_dmy
-.17
HR Efficiency * Luxury_dmy -.90 HR Reliability * Full -.57

141
service_dmy HR Reliability * Luxury_dmy -.86 HR Flexibility * Full Service_dmy
-.69
HR Flexibility * Luxury_dmy .35 Back operation * Full service_dmy
-1.10**
Back operation * Luxurry_dmy
-.73
Call center * Full service_dmy -.62* Call center * Luxury_dmy -.10 Administration * Full service_dmy
-.01
Administration * Luxury_dmy .49** Activity * Full service_dmy -.07 Activity * Luxury_dmy .17 Front service * Full service_dmy
.11
Front service * Full service_dmy
.58*
R2 change .01 .03 .01 .01 .06* .07* .07* .08** .01 .06* R2 .12 .15 .16 .15 .20 .21 .21 .23 .15 .21 F (18,107)
= .79 (23,102)= .76
(25, 100) = .75
(25,100) = .71
(25,100) = 1.01
(25,100) = 1.07
(25,100) = 1.08
(25,100) = 1.19
(25,100)= .71
(25,100) = 1.05
*** p < .001; ** p < .01; * p < .05. a Variables in Italic are hypothesized.

142
FIGURE 10
HR Fl exi bi l i t y * Hot el s I nt er act i on
1. 5
2
2. 5
3
3. 5
4
4. 5
l ow hi ghFl exi bi l i t y- Or i ent ed HR syst em
Cust
omer
Eva
luat
ions
of
Serv
ice
Li mi t ed- ser vi ceFul l - ser vi ceLuxur y

143
FIGURE 11
Admi ni st r at i on * Hot el s I nt er act i on
1. 5
2
2. 5
3
3. 5
4
4. 5
l ow hi ghSt r at egi c Admi ni st r at i on St af f
Cust
omer
Eva
luat
ions
of
Serv
ice
Li mi t ed- ser vi ceFul l - ser vi ceLuxur y

144
FIGURE 12
Fr ont Ser vi ce * Hot el s I nt er act i on
1
1. 5
2
2. 5
3
3. 5
4
l ow hi ghSt r at egi c Fr ont Ser vi ce St af f
Cust
omer
Eva
luat
ions
of
Serv
ice
Li mi t ed- ser vi ceFul l - ser vi ceLuxur y

145
FIGURE 13
Cal l Cent er * Hot el s I nt er act i on
3
3. 2
3. 4
3. 6
3. 8
4
4. 2
l ow hi ghSt r at egi c Cal l Cent er St af f
Cust
omer
Eva
luat
ions
of
Serv
ice
Li mi t ed- ser vi ceFul l - ser vi ceLuxur y

146
FIGURE 14
Back Oper at i on * Hot el s I nt er act i on
2. 5
3
3. 5
4
4. 5
5
5. 5
l ow hi ghSt r at egi c Back Oper at i on St af f
Cust
omer
Eva
luat
ions
of
Serv
ice
Li mi t ed- ser vi ceFul l - ser vi ceLuxur y

147
FIGURE 15 A Summary of Regression Findingsa
aSolid lines indicate a main effect; Dashed lines represent a moderated effect with hotel stars
Tangibles
GOPPAR
Service
Value
Occupancy
RevPAR
Administrative
Front Service
Call Center
Back Operation
Flexibility HR
Reliability HR
Efficiency HR
Activity

148
TABLE 18 Summary of structural models
Models χ2 df CFI RMSEA
Baseline model, not including interactions 26.73 20 .99 .06 Interaction models (tested at one star level at a time) Model 1 Limited service hotels interactions 62.37** 33 .97 ..08 Model 2 Full service hotels interactions 148.73** 33 .90 .14 Model 3 Luxury hotels interactions 84.80** 33 .96 .11 ** p < .01

149
FIGURE 16 Summary of Structural Model Results a
aThe results were obtained from four analyses: (1) the solid lines and significant coefficients were from the baseline model without interactions, (2) the dashed lines to and from Value represented significant interactions between Limited service hotels and Value, Efficiency HR, and Back of the house positions, (3) the dashed lines to and from Tangibles represented significant interactions between Full service hotels and Reliability HR and Tangibles, and (4) the dashed lines from Service represented significant interaction between Luxury hotels and Service. *** p < .001; ** p < .01; * p < .05
LgREVPAR
LgOccupancy
Value
Tangibles
Service
Efficiency HR
Back Operations
Reliability HR
Front Service
Flexibility HR
-.45**
.57***
-.12*
.16***
.27*
-.10*

150
FIGURE 17
Val ue by Li mi t ed Ser vi ce Hot el s I nt er act i on
l ow hi ghCapabi l i t y: Val ue
LogR
EVPA
R
Ot her hot el sLi mi t ed ser vi ce hot el s

151
FIGURE 18
Ef f i ci ency HR by Li mi t ed Ser vi ce Hot el s I nt er act i on
l ow hi ghEf f i ci ency Or i ent ed HR
Capa
bili
ty:
Valu
e
Ot her hot el sLi mi t ed ser vi ce hot el s

152
FIGURE 19
Back Posi t i ons by Li mi t ed Ser vi ce Hot el s I nt er act i on
l ow hi ghBack of t he house posi t i ons
Capa
bili
ty:
Valu
e
Ot her hot el sLi mi t ed ser vi ce hot el s
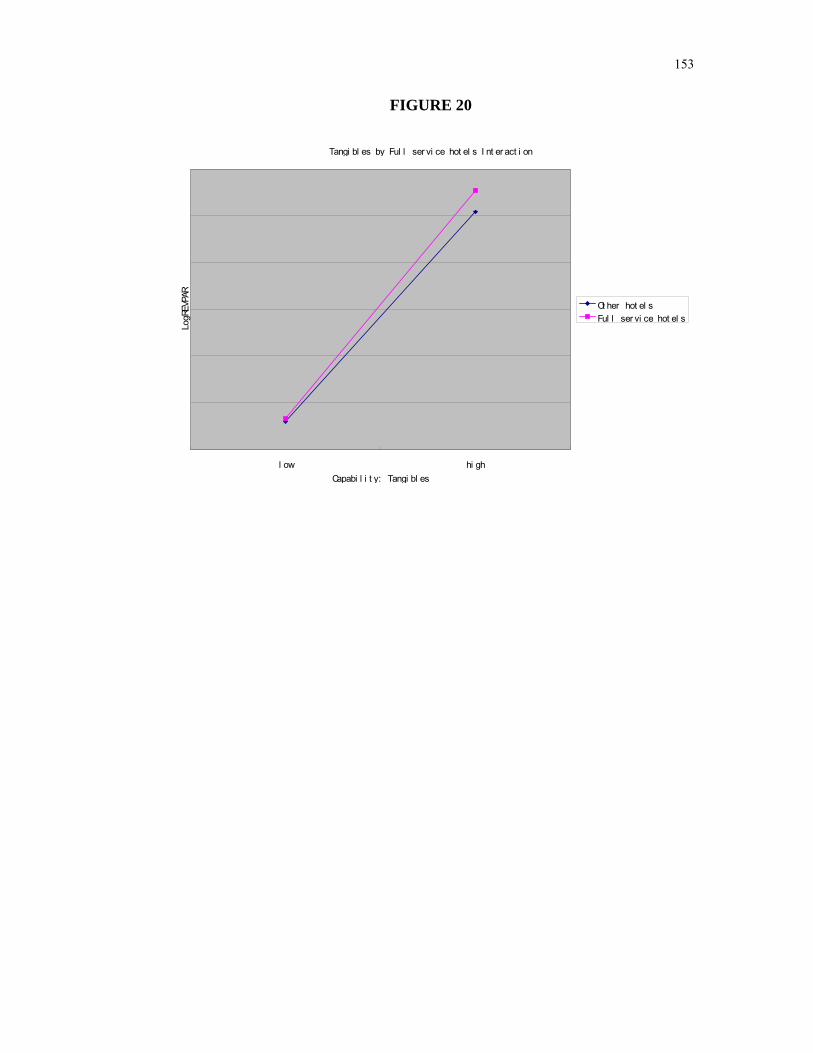
153
FIGURE 20
Tangi bl es by Ful l ser vi ce hot el s I nt er act i on
l ow hi ghCapabi l i t y: Tangi bl es
LogR
EVPA
R
Ot her hot el sFul l ser vi ce hot el s

154
FIGURE 21
Rel i abi l i t y HR by Ful l Ser vi ce Hot el s I nt er act i on
l ow hi ghRel i abi l i t y or i ent ed HR
Capa
bili
ty:
Tang
ible
s
Ot her hot el sFul l ser vi ce hot el s

155
FIGURE 22
Ser vi ce by Luxur y hot el i nt er act i on
l ow hi ghCapabi l i t y: Ser vi ce
LogO
ccup
ancy
Ot her hot el sLuxur y hot el s

156
APPENDIX 1
SURVEY QUESTIONS
Section I: Strategic Focus To what extent do you think your hotel focuses on distinguishing from competitors on each of the following processes?
0 N/A
1 Substantially
below average
2 Somewhat
below average
3 Equivalent
to competitors
4 Somewhat
above average
5 Substantially
above average
Cost leadership: 1. Offering value at low price 2. Running the hotel efficiently with few labor Product leadership: 3. Offering prime location 4. Ensuring security for guests and belongings 5. Maintaining bedroom (e.g., comfort of bed, bedroom amenities and cleanliness) 6. Providing access (e.g., non-smoking rooms, convenient parking) 7. Offering leisure facilities (e.g., exercise equipment, entertainment facility) 8. Providing full service restaurant/bar 9. Operating business center facilities Service leadership: 10. Room service (e.g., food and beverage, laundry) 11. Turndown service (e.g., preparing bed linens for sleeping) 12. Front desk service (e.g., wake-up call, telephone service) 13. Front services (e.g., valet parking, doormen, bell persons, concierges) 14. Other services (e.g., spa, massage, face/body treatments) 15. The service employees are available to assist guests in a personal manner 16. The service employees customize how service is offered for each guest Section II: Strategic Positions Please place each employee group into a category that describes their role in implementing the hotel’s strategy indicated above: Front of the house: 1. Front desk staff 2. Reservation staff 3. Customer service staff 4. Concierges 5. Bell attendants 6. Doormen 7. Food and beverage servers 8. Security officers
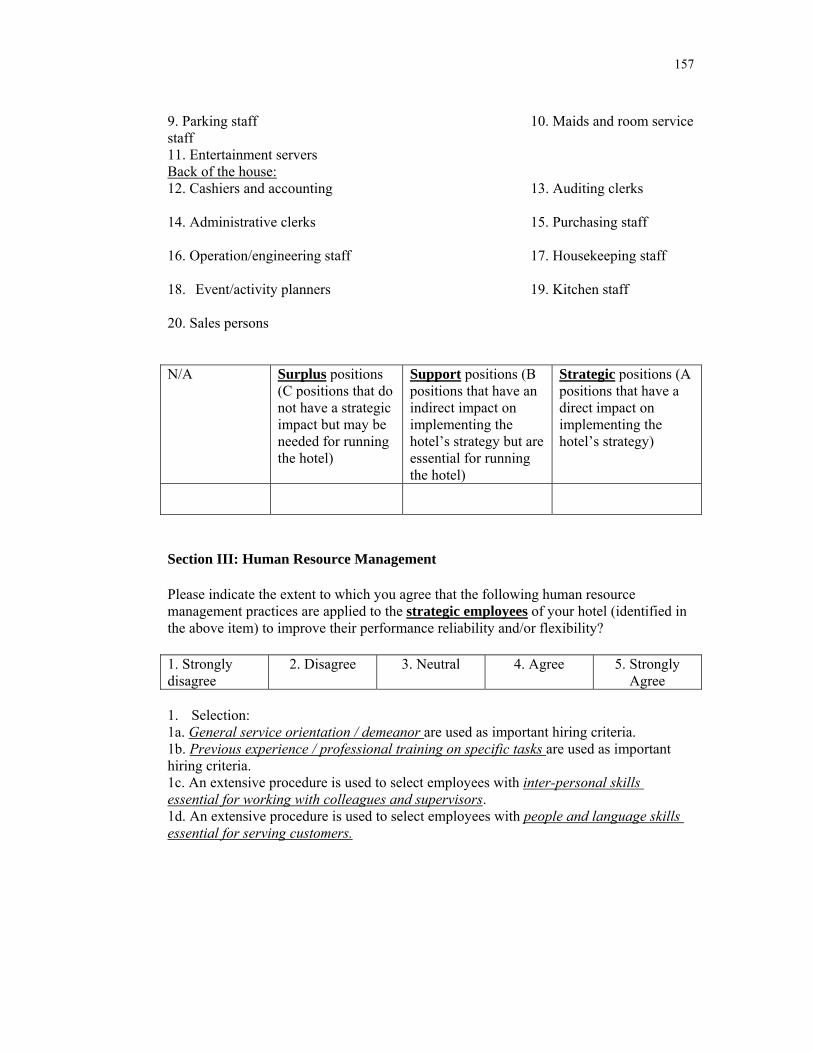
157
9. Parking staff 10. Maids and room service staff 11. Entertainment servers Back of the house: 12. Cashiers and accounting 13. Auditing clerks 14. Administrative clerks 15. Purchasing staff 16. Operation/engineering staff 17. Housekeeping staff 18. Event/activity planners 19. Kitchen staff 20. Sales persons N/A Surplus positions
(C positions that do not have a strategic impact but may be needed for running the hotel)
Support positions (B positions that have an indirect impact on implementing the hotel’s strategy but are essential for running the hotel)
Strategic positions (A positions that have a direct impact on implementing the hotel’s strategy)
Section III: Human Resource Management
Please indicate the extent to which you agree that the following human resource management practices are applied to the strategic employees of your hotel (identified in the above item) to improve their performance reliability and/or flexibility?
1. Strongly disagree
2. Disagree 3. Neutral 4. Agree 5. Strongly Agree
1. Selection: 1a. General service orientation / demeanor are used as important hiring criteria. 1b. Previous experience / professional training on specific tasks are used as important hiring criteria. 1c. An extensive procedure is used to select employees with inter-personal skills essential for working with colleagues and supervisors. 1d. An extensive procedure is used to select employees with people and language skills essential for serving customers.

158
2. Training: 2a. Extensive orientation programs are provided to teach new employees property rules and information. 2b. Extensive training programs are provided to teach employees task-specific skills to each job. 2c. Extensive training programs are provided to teach employees customer service orientation and skills. 3. Performance evaluation: 3a. Employee appraisals emphasize error-free performance and other objective outputs. 3b. Employee appraisals emphasize adaptive behaviors to satisfy customers and other evaluations. 4. Compensation: 4a. Employees are rewarded based on a set rate instead of performance. 4b. Employees are rewarded extensively on the overall performance of their department. 4c. Employees are rewarded extensively on individual performance in satisfying customers. 5. Promotion: 5a. Superior employees have potential career paths within their functional area. 5b. Superior employees have potential career paths across functional areas and perhaps to the top. 6. Teamwork: 6a. Management places a great deal of importance on developing formal work teams within each department. 6b. Management places a great deal of importance on developing problem-solving teams across departments. 7. Job description: 7a. Specific job duties are prescribed by the management for the employees. 7b. The actual job duties are shaped more by the employees and customers than by a specific description. 8. Participation: 8a. Employees are provided with the opportunity to suggest improvements in service processes. 8b. Employees are allowed to make many decisions on how to provide service. 9. Information sharing: 9a. Employees have the service policy / guideline information they need to do their work. 9b. Employees have a dispatching / tracking system of work orders from different departments to do their work.

159
9c. Employees have instant information sharing about customer preferences from different departments to do their work. 10. Feedback: 10a. Employees are provided internal audits / inspections of service quality. 10b. Employees are provided management / peer evaluations of service quality. 10c. Employees are provided customer evaluations of service quality. 10d. Employees are provided external mystery guests evaluations of service quality. Section IV: Hotel Information (Individual hotel’s information will be kept confidentially and will only be reported in an aggregated format) 1a. Our employees are widely considered the best in our industry. 1b. Our employees are experts in their particular jobs and functions.
1 Strongly disagree
2 Disagree
3 Neutral
4 Agree
5 Strongly agree
2. What is your hotel’s name? _________________________ 3. What is your hotel’s location? _____________________________ 4. What is your hotel’s ownership? Company owned Franchised 5. What is your hotel’s management?
Managed by branded company, please specify name of branded company ________________________
Independently managed, please specify name of independent company ________________________ 6. Is your hotel unionized? Yes No 7. What was your RevPAR (revenue per available room) ___________________$ in the most recent year? 8. What was your occupancy rate _____________________% in the most recent year? 9. What was GOPPAR (gross operating profit per available room) __________________$ in the most recent year?

160
APPENDIX 2 Suggested profiles of HRM (Fit as profile deviation)
Items Labels Efficiency Oriented HR
Reliability Oriented HR
Flexibility Oriented HR
Selection 1 General service orientation / demeanor 4.8 Selection 2 Previous experience / professional training on specific tasks 3.5 Selection 3 inter-personal skills essential for working with colleagues and
supervisors 3.5
Selection 4 people and language skills essential for serving customers 4.1 Training 1 property rules and information 4.0 Training 2 task-specific skills to each job 4.0 Training 3 general customer service skills 4.8 Performance Appraisal 1
error-free performance 3.8 4.1
Performance Appraisal 2
adaptive behaviors to satisfy customers 4.3
Compensation 1 a set rate instead of performance 3.5 Compensation 2 the overall performance of their department 3.5 Compensation 3 individual performance in satisfying customers 4.5 Promotion 1 within their functional area 4.0 4.2 Promotion 2 across functional areas and perhaps to the top 4.0 Teamwork 1 formal work teams within each department 3.5 4.0 Teamwork 2 problem-solving teams across departments 4.8 Job Description 1 prescribed by the management 4.0 4.0 Job Description 2 shaped more by the employees and customers 3.5 Participation 1 suggest improvements 4.7 4.8 Participation 2 make many decisions 4.0 Information Sharing 1 service policy / guideline information 4.3 Information Sharing 2 dispatching / tracking system of work orders 3.5 Information Sharing 3 instant information sharing about customer preferences 4 Feedback 1 internal audits / inspections 4.0 Feedback 2 management / peer evaluations 4.0 Feedback 3 customer evaluations 4.8 Feedback 4 external mystery guests evaluations 4.8�

161
Curriculum Vita Ying Hong
EDUCATION 2009 Ph.D. in Industrial Relations and Human Resources
School of Management and Labor Relations, Rutgers University
2005 M.Sc. in Industrial/Organizational Psychology Department of Psychology, Saint Mary’s University
2003 BAs in Business Administration & English Literature
Department of Management & Foreign Language, Zhejiang University WORK EXPERIENCE 2005 Department of Human Resources Management, Rutgers University -2009 Teaching Assistant Summer Sirota Survey Intelligence, New York 2007 Research Intern
2003 Saint Mary’s University -2005 Research Assistant/Teaching Assistant
JOURNAL ARTICLES Liao, H., Toya, K., Lepak, D. P., & Hong, Y. (2009). Do they see eye to eye? Management and employee perspectives of High Performance Work Systems and influence processes on service quality. Journal of Applied Psychology, 94, 371-391. Colakoglu, S., Lepak, D. P., & Hong, Y. (2006). Measuring HR’s effectiveness: Considering multiple stakeholders in a global context. Human Resource Management Review, 16, 209-218. BOOK CHAPTERS Jackson, S. E., & Hong, Y. (2008). Knowledge work. In J. Barling & C. Cooper (ed.). The SAGE Handbook of Organizational Behavior (vol 1; pp. 372-392). Sage. Colakoglu, S., Hong, Y, & Lepak, D. P. (Forthcomimg). Models of strategic human resources management. To appear in A. Wilkinson, T. Redman, S. Snell, & N. Becon (ed.), The SAGE Handbook of Human Resource Management. Sage.

162
Hong, Y., Castellano, W., & Lepak, D. P. (2007). Employee loyalty and engagement. In P. Thoms & M. Walden (ed.). Battleground Business Series (vol 1; pp. 149-156). Greenwood.