dissecting eukaryotic translation and its control by - cmgm stanford
TRANSCRIPT

Dissecting eukaryotic translation and its control byribosome density mappingYoav Arava, F. Edward Boas1, Patrick O. Brown and Daniel Herschlag1,*
Howard Hughes Medical Institute, Stanford, CA 94305-5428, USA and 1Department of Biochemistry,Stanford University, Stanford, CA 94305-5307, USA
Received October 26, 2004; Revised February 15, 2005; Accepted March 11, 2005
ABSTRACT
Translation of an mRNA is generally divided into threestages: initiation, elongation and termination. The rel-ative rates of these steps determine both the numberand position of ribosomes along the mRNA, but tra-ditional velocity sedimentation assays for the trans-lational status of mRNA determine only the number ofbound ribosomes. We developed a procedure, termedRibosome Density Mapping (RDM), that uses site-specific cleavage of polysomal mRNA followed byseparation on a sucrose gradient and northern ana-lysis, to determine the number of ribosomes associ-ated with specified portions of a particular mRNA.This procedure allows us to test models for transla-tion and its control, and to examine properties ofindividual steps of translation in vivo. We testedspecific predictions from the current model for trans-lational control of GCN4 expression in yeast andfound that ribosomes were differentially associatedwith the uORFs elements and coding region underdifferent growth conditions, consistent with thismodel. We also mapped ribosome density along theORF of several mRNAs, to probe basic kinetic prop-erties of translational steps in yeast. We found nodetectable decline in ribosome density betweenthe 50 and 30 ends of the ORFs, suggesting that theaverage processivity of elongation is very high.Conversely, there was no queue of ribosomes at thetermination site, suggesting that termination is notvery slow relative to elongation and initiation.Finally, the RDM results suggest that less frequentinitiation of translation on mRNAs with longer ORFsis responsible for the inverse correlation betweenORF length and ribosomal density that we observed
in a global analysis of translation. These results pro-vide new insights into eukaryotic translation in vivo.
INTRODUCTION
The eukaryotic gene expression program is composed of manysteps, from pre-mRNA transcription, processing and exportout of the nucleus, to subcellular localization, translationand mRNA decay. Dissection of this program into each ofits component steps and analysis of each of these steps isessential for complete understanding.
For translation, the most obvious and tractable parameter tomeasure is the number of ribosomes associated with themRNA. The traditional method to determine the overall num-ber of ribosomes on an mRNA involves separation of largecomplexes by velocity sedimentation through a sucrose gra-dient. The sedimentation position of an mRNA within thegradient is directly related to the number of ribosomesbound to it, as the mass of the ribosome dominates thesedimentation behavior of the complex [see (1) for technicaldetails]. By this method, the existence of polysomes wasidentified (2) and changes in ribosomal association ofmRNAs upon changes in conditions or in the genetic back-ground have routinely been tested (3–6). Most recently, weand others have used polysome profiling in combination withDNA microarrays to obtain a global view of the translationalstatus of mRNAs (7–14).
The translation of mRNA into protein is mechanisticallydivided into three successive stages: initiation, elongationand termination (Figure 1), with each of these stages furthermade up of multiple steps that use distinct sets of factors(15,16). In eukaryotes, initiation encompasses assembly ofthe 43S complex onto the mRNA, scanning toward and recog-nition of the start codon, and assembly of the active ribosomeat this site; elongation includes codon by codon transloca-tion of the ribosome along the mRNA in conjunction with
*To whom correspondence should be addressed. Tel: +1 650 723 9442; Fax: +1 650 723 6783; Email: [email protected] may also be addressed to Patrick O. Brown. Tel: +1 650 723 0005; Fax: +1 650 725 7811; Email: [email protected] address:Y. Arava, Department of Biology, Technion, Haifa 32000, Israel
ª The Author 2005. Published by Oxford University Press. All rights reserved.
The online version of this article has been published under an open access model. Users are entitled to use, reproduce, disseminate, or display the open accessversion of this article for non-commercial purposes provided that: the original authorship is properly and fully attributed; the Journal and Oxford University Pressare attributed as the original place of publication with the correct citation details given; if an article is subsequently reproduced or disseminated not in its entirety butonly in part or as a derivative work this must be clearly indicated. For commercial re-use, please contact [email protected]
Nucleic Acids Research, 2005, Vol. 33, No. 8 2421–2432doi:10.1093/nar/gki331

amino-acyl tRNA selection and peptide bond formation; andtermination involves the release of the ribosomal subunits andthe mature protein from the mRNA. The relationship amongthe rates of these steps determines the rate of protein synthesisand the number and distribution of ribosomes on an mRNA.For example, slow initiation relative to elongation and ter-mination will lead to a low density of ribosomes on themRNA (Figure 1A); faster initiation relative to the scenarioin Figure 1A will lead to an increase in the number ofribosomes on the mRNA (Figure 1B). Slower elongation rel-ative to the scenario in Figure 1A will also lead to an increasein the number of ribosomes (Figure 1C).
Although some changes in rates of initiation, elongation andtermination lead to changes in the number of associatedribosomes, as in Figure 1, there are many scenarios inwhich different underlying rates of initiation, elongationand termination give the same number of bound ribosomes.For example, Figure 1B and C both have higher number ofbound ribosomes relative to Figure 1A, yet Figure 1B repres-ents the outcome of increased initiation, and Figure 1C rep-resents the outcome of slower elongation. Figure 2 providesadditional examples. An mRNA with a slow elongation rateand one with fast elongation but with a strong pause site canhave the same overall number of ribosomes (Figure 2A and B,respectively). Similarly, faster elongation than in Figure 2Abut slower termination (Figure 2C) can lead to the same over-all number of ribosomes as in Figure 2A. Finally, an mRNAwith slow initiation could have the same overall number ofribosomes as an mRNA with fast initiation but with limitedprocessivity [i.e. frequent dissociation of ribosomes duringelongation (Figure 2D)].
Although the same number of ribosomes is bound to themRNA in each of the scenarios in Figure 2, the distribution ofribosomes along the mRNAs is different: a strong pause sitewould result in increased density of ribosomes immediately 50
to the pause site (Figure 2B), slow termination would result inan increase in ribosomal density upstream of the terminationsite (Figure 2C), and ribosomal dissociation during elongationwould decrease the ribosomal density towards the 30 end of themRNA (Figure 2D). Thus, an ability to assess the distributionof ribosomes along an mRNA would provide incisive informa-tion about the individual stages of translation and their vari-ation among different mRNA and under different conditions.
In vitro, ribosomes accumulating at the initiation ortermination sites can be detected by a ‘toeprinting’ procedurein which a radiolabeled primer is used to synthesize cDNAuntil the bound ribosome blocks the extension process (17,18).Pause sites along the mRNA can be detected by micrococcaldigestion of mRNA associated with ribosomes followed byannealing to cDNA and primer extension reaction that will ter-minate at the position of the pause site (19); this assay relies onaccumulation of ribosomes at a specific position on the mRNAand was used to identify pause sites in vitro on preprolactinmRNA induced by the signal recognition particle (20). Finally,ribosomal position can sometimes be inferred indirectly fromthe results of mutagenesis experiments (21–25).
We present here a general and direct method to identify theribosomes in different regions along mRNAs isolated fromtranslating cells. We have applied this method to severalyeast mRNAs to test the highly developed model for transla-tion control of GCN4 via uORFs and to provide insight intoindividual steps in translation.
MATERIALS AND METHODS
Yeast strains and growth conditions
To assay GCN4 ribosomal association under non-starvationconditions, S288c cells were grown to OD600 0.6–0.9 at 30�Cin YPD medium (1% yeast extract/2% peptone/2% dextrose).Starvation conditions were imposed by growing cells inminimal medium (0.2% yeast nitrogen base, 0.5% ammoniumsulfate and 2% dextrose) and adding the histidine analog3-aminotriazole to a final concentration of 40 mM for 30 min.For analyses of all other mRNAs, BY4741 cells were grown toOD600 0.6–0.9 at 30�C in YPD.
RNase H treatment
mRNA associated with ribosomes was isolated from 100 ml ofcells. Cells were treated with cycloheximide, immediatelycooled and lysed, and resolved on a sucrose gradient as
Figure 2. The position of ribosomes along an mRNA provides additionalinformation about initiation, elongation and termination. Models for mRNAswith similar number of ribosomes but different distributions of ribosomesalong the mRNA are presented. As in Figure 1, the arrow thicknessrepresents the relative rate constant for steps. In (D), the downward arrowsrepresent ribosomes dissociation due to limited processivity.
Figure 1. The number of ribosomes bound to an mRNA reflects the interplaybetween initiation, elongation and termination. The arrow thickness representsthe relative rate constants for initiation (concave arrowheads), elongation(closed arrowheads) and termination (open arrowheads). Note the differentnumber of bound ribosomes in (A–C).
2422 Nucleic Acids Research, 2005, Vol. 33, No. 8

described previously (7), except that heparin was excludedfrom the sucrose gradient. Gradient fractions were collectedinto tubes containing DTT and RNasin (Promega) (final con-centration: 15 mM and 500 U/ml, respectively) and selectedfractions were immediately subjected to reaction with RNaseH. To accomplish this, an aliquot of the polysomal fraction(400 ml) was mixed with 15 ml of 5 mM antisense oligodeoxy-nucleotide (ODN); annealing was performed at 37�C withslow cooling to room temperature over 20 min. RNase H(GibcoBRL) (5 U) and 100 ml 5· RNase H buffer (5· bufferis 0.1 M Tris–HCl, pH 7.5, 0.5 M KCl, 0.1 M MgCl2, 0.5 mMDTT and 2.5 mg/ml cycloheximide) were added and the mix-ture was incubated at 37�C. After 20 min, the volumes wereincreased to 1 ml with ice-cold LMD buffer (initial LMDbuffer concentration: 20 mM Tris–HCl, pH 7.4, 140 mMKCl, 1.5 mM MgCl2, 0.5 mM DTT, 0.1 mg/ml cycloheximideand 1 mg/ml heparin) and loaded on a sucrose gradient.Gradients and sedimentation were as described previously,including the presence of heparin (7). Eighteen fractionswere collected into tubes containing 1 ml of 8 M guanidiniumchloride, and RNA was precipitated by adding 2 ml ethanoland incubating overnight at �20�C. The precipitate was spundown and washed with 1 ml of 80% ethanol. Pellets wereresuspended in 400 ml TE (10 mM Tris–HCl, pH 7.4, 1 mMNa�EDTA), and precipitated again by adding 0.1 vol of 3 Msodium acetate, pH 5.3, and 2.5 vol of ethanol. The final pelletswere resuspended in 4.5 ml TE, pH 7.4, and the entire samplewas analyzed by northern blot (11). Radioactive probes wereprepared by random incorporation of 32P-labeled nucleotidesinto a PCR fragment homologous to the tested mRNA. Dif-ferences in the radioactive signals between the two cleavageproducts (Figure 4) are probably due to differences in theirlength, sequence or structure that lead to different hybridiza-tion efficiency.
Sensitivity of RDM
Two factors determine the sensitivity of the procedure. Onerelates to the level of detection of a transcript, and the other tothe precision with which we could determine the number ofribosomes bound to an RNA fragment. The northern protocolwe used in this work (11) can successfully detect transcriptspresent at five or more copies per cell (26). Less abundanttranscripts could potentially be detected via RT–PCR, but thisassay was not used in the current experiments.
The precision with which we could determine the number ofribosomes bound to an mRNA fragment was determined bythe resolution of the sucrose gradients (Figure 3B, upperpanel). We could unambiguously determine if mRNA frag-ments contained either zero or one bound ribosome (GCN4experiments, Figure 3B). The resolution decreases withincreasing the numbers of bound ribosomes. For example,for mRNAs with �7 ribosomes bound, we estimate that theuncertainty is approximately –1 ribosome. This estimate isbased on the difference between the sum of the estimatednumber of ribosomes on the cleaved fragments and the estim-ated number of ribosomes on their corresponding full-lengthmRNA.
In general, maximal sensitivity of RDM is achieved whenabundant transcripts are analyzed and cleaved into fragmentswith three or fewer bound ribosomes.
Antisense oligodeoxynucleotides (ODNs)
The following antisense ODN were used in the RNase Hcleavage reactions. The gene name and distance (in nt)from the initiation AUG to the center of the ODN:mRNAduplex is listed; negative numbers refer to positions 50 ofthis AUG and positive numbers to position 30 of it:
GCN4-(-)36, CTTGAGCAGACAAATTGGTAAACA;PDC1-681, TCAGCCTTGACGTCGTGTCT;PDC1-1109, TGGTTCCACATCCATTCTTGC;YEF3-197, TTAGCAGCGGTCTTCTTGTCCT;YEF3-1167, TTCGTGCAAGAAGATAGTCATGTATG;YEF3-1510, CGGAAGTGTCAGAGTGAGTACCATC;YEF3-2032, CAGTGATTTGTGGCTTAGAGGTACC;YEF3-2757, TCAAGTGAGGTCTTTGCCATGT;ADH1-312, CGTTACCCAATTCACAGTATTCACA;
Figure 3. Controls for RDM. (A) Specificity of the RNase H reactions.Antisense ODNs complementary to various positions of ADH1 or YEF3were annealed to polysomal mRNA. The expected lengths (in nt) of thecleavage products are shown schematically at the top of each panel.Following annealing, RNase H was added and reactions proceeded for 20min. Samples were then subjected to northern analysis using radiolabeledfull-length DNA probe. Size markers are shown at the left and white asterisksindicate cleavage products. (�) No oligo added and the letters correspond to theschematic above. (B) No detectable ribosome dissociation during processingsteps. The upper panel (first gradient) is an OD254 trace of a sucrose gradientfrom which two different polysomal fractions were collected. One fraction(mRNAs associated with 3–5 ribosomes) was resolved on a second gradientfollowing incubation for 1 h at 37�C (second gradient,�RNase H panel) and theother fraction (mRNAs associated with 5–10 ribosomes) was annealed with anantisense ODN complementary to ADH1 around position 462, subjected toRNase H reaction, and then separated on a sucrose gradient (second gradient,+RNase H). The sedimentation positions of the 40S, 60S, 80S and polysomesare indicated.
Nucleic Acids Research, 2005, Vol. 33, No. 8 2423

ADH1-462, CGGTGATACCAGCACACAAGATGGG;ADH1-612, CTTCCTTACCTTCACCACCGTCAAT;ADH1-712, GTGAGCACCACCGTCAGTGGCCT;HSP82-824, CTAGTCCACAAAGGCTTAGTCTTG;HSP82-971, GGTGCTCTCTTTGGAATGAATAAG;HSP82-1362, GTAACAACTTAGCCAAAGCAGCCC;PDA1-648, CCTAAAGGAACCTGGGCACCCACGA; andEF-2-1232, TGGACTTACCATGATCGACGTGA.
RESULTS AND DISCUSSION
The number of ribosomes on a particular mRNA is tradition-ally determined by separation of polysomal complexes on asucrose gradient, followed by northern blot analysis of frac-tions through the gradient. As elaborated in the Introduction,incisive information about the individual steps of translationcan be obtained from ribosome positions along an mRNA’sopen reading frame (ORF) (Figure 2). We therefore designed aprocedure to determine the ribosome density of differentregions of a particular mRNA. This procedure, termed Ribo-some Density Mapping (RDM), is described in the first sectionbelow. We then apply RDM in subsequent sections to assesstranslational control of GCN4 expression and the rates andproperties of translational steps.
Experimental procedure for RDM
The overall protocol for RDM is outlined in Scheme 1. We firstuse the standard technique of velocity sedimentation in a
sucrose gradient to separate mRNAs based on the numberof bound ribosomes (Scheme 1, step i). Cycloheximide addi-tion and lysis on ice directly prior to sedimentation has beenutilized in numerous investigations of in vivo translationalstatus as this treatment is generally assumed to freeze trans-lation and fix in place translating ribosomes. There is con-siderable circumstantial and correlative evidence that thisprotocol effectively halts translation and fixes translatingribosomes, thereby providing a snapshot of translationin vivo. Nevertheless, this evidence does not prove that theapproach provides a direct readout of in vivo translationalstatus. It particular, the effects of cycloheximide on the scan-ning 40S subunits or on the formation of initiating 80S com-plex are not clear. Techniques such as RDM that offer morehighly refined and quantitative information in conjunctionwith mutagenesis and analysis of effects in vivo will providenew opportunities to test this basic assumption.
Following translation arrest, fractions corresponding to aparticular number of bound ribosomes, typically the mostabundant fractions for the mRNA to be analyzed, are pooled(step ii). An antisense ODN complementary to a particularposition within the target mRNA is then added togetherwith RNase H to give specific cleavage of the targetmRNA (step iii). The sample, which includes the cleavedmRNA along with all other mRNAs present in the pooledfraction, is then loaded onto a second sucrose gradient toseparate the mRNA cleavage products based on the numberof ribosomes bound to each (step iv). The expectation is thatall mRNAs will sediment as they did in the first gradient with
Scheme 1. Outline of Ribosome Density Mapping Protocol.
2424 Nucleic Acids Research, 2005, Vol. 33, No. 8

the exception of the single mRNA that was cleaved; the 50- and30-fragments of this mRNA will migrate in the gradient atpositions reflecting the number of ribosomes bound to eachfragment. The position of the mRNA fragments in the gradientcan then be determined by northern blot analysis (step v), andthe number of bound ribosomes can be assigned with referenceto control gradients in which the polysome peaks can be coun-ted. Information about the ribosome distribution can also beobtained by direct comparison of the migration of the 50- and30-fragments, avoiding any potential error due to uncertainty indetermination of the number of ribosomes on each fragment.For example, cleavage in the middle of an mRNA will lead tothree possible outcomes (Scheme 1, step v) depending on theribosome density on each half.
Several controls were required to establish this procedure:(i) RNase H cleavage must be specific to the mRNA and thehybridization site specified by the antisense ODN; (ii) thecleaved fragments, which lack either the 30-polyA tail orthe 50-cap structure, must be stable through the subsequentanalysis; and (iii) ribosomes must remain bound to the cleavedfragments throughout the procedure. These controls, describedbelow (Figure 3), and subsequent data confirm the reliabilityof the RDM procedure.
To establish the specificity of the RNase H cleavage, mRNAassociated with 5–10 ribosomes was isolated following suc-rose gradient sedimentation, and antisense ODNs comple-mentary to different positions along various mRNAs wereadded together with RNase H (corresponding to Scheme 1,
step iii). Reactions were subjected to northern blot analysis todetect the cleavage products. No cleavage products wereobserved in the absence of antisense ODNs for either YEF3or ADH1 [Figure 3A, (�) lane in each panel]. In contrast,addition of ODNs complementary to YEF3 positions 197,1180, 2045 or 2752 nt from the start codon (lanes a, b, cand d, respectively) or to ADH1 positions 312, 462 or 712 ntfrom the start codon (lanes a, b and d, respectively) yieldedtwo prominent cleavage products of the expected sizes in eachcase. We tested 28 different ODNs for 9 different mRNAs, andall except one yielded accurate cleavage (Figures 4–6, and datanot shown). Only the antisense ODN to ADH1 at position 612gave additional bands of unexpected size (Figure 3A; ADH1,lane c) and therefore was not used further.
To inhibit possible degradation of the cleavage products, anRNase inhibitor was added immediately upon collection of thefractions (Scheme 1, step ii). In no case was there a significantloss in hybridization signal (relative to uncut controls), or weremultiple shorter fragments or substantial smears observed(Figures 3–6, and data not shown), as would be expectedif the RNAs were subject to non-specific degradation. Thus,site-specific cleavage occurred with minimal non-specificdegradation.
We next tested whether ribosomes dissociate from themRNA during the procedure. The absorbance profiles(OD254) of sedimentation gradients after the RNase H reactionwere compared with the corresponding profiles beforethe cleavage reaction (Figure 3B). mRNAs associated with
Figure 4. Testing the scanning and reinitiation model for GCN4 translation control by RDM. (A) Schematic structure of GCN4 mRNA. The four uORFs located onthe 50-leader are depicted as open boxes, and the GCN4 coding ORF is depicted as a hatched box. Numbers indicate distances (in nt) from the AUG and the arrowpoints to the cleavage position. (B and C) Polysomal RNA was isolated from cells grown in rich medium (B) or in minimal medium supplemented with3-aminotriazole for 30 min (C). The GCN4 mRNA was cleaved with an antisense ODN complementary to sequence upstream of the AUG codon (the ODN isexpected to cut at position �36). Cleavage reactions were separated on a sucrose gradient into 18 fractions, and the indicated fractions were analyzed by northernanalysis. Gel migration distance of size markers is shown to the left and sedimentation positions of the 40S, 60S and ribosome–mRNA complexes are indicated at thebottom of each panel. Migration position of the cleaved fragments is shown to the right of each panel.
Nucleic Acids Research, 2005, Vol. 33, No. 8 2425

3–5 ribosomes were collected from a sucrose gradient,incubated for 1 h at 37�C without addition of antisenseODN, RNase H and LMD buffer, and resolved on a secondsucrose gradient. The absorbance profile following this treat-ment (Figure 3B, middle panel) includes a single peak at thesame position as in the first gradient. (Single ribosome res-olution is not observed in the absorbance profile following themock reaction. This may be due to the relatively high amountof sucrose in the sample leading to mixing during loading ofthe sample onto the gradient.) No absorbance peaks wereobserved at the positions corresponding to the size of ribo-somal subunits or single ribosomes, as would be expected ifribosomes dissociated from the mRNA during the extendedincubation at high temperature. We also collected mRNAsassociated with ribosomes and subjected these samples toRNase H reaction using specific antisense ODNs. The lowerpanel of Figure 3B shows an example in which mRNA asso-ciated with more ribosomes (5–10 ribosomes) was collectedand treated with RNase H and an antisense ODN complement-ary to ADH1 at position 462. The reaction products were thenseparated on a second sucrose gradient, and 18 fractions werecollected across the gradient. The OD254 trace of theRNase H-treated sample showed one prominent peak at theexpected position and no peaks at the sedimentation positionsof 40S, 60S or 80S complexes. The ribosomes associated with
the cleaved ADH1 fragments comprise a negligible fraction ofthe total polysomal pool so that no additional peak is detectedby absorbance at 254 nm at their sedimentation position. Thepeak in the slowest migrating region, which was not observedin mock reactions (Figure 3B, middle panel), presumablyarises from the added heparin, ODNs and enzyme. Theabsence of 40S, 60S or monosome complexes and the prom-inent polysomal peak at the same position as before the RNaseH reaction demonstrate that there was no extensive ribosomaldissociation or association during the enzymatic reaction andsubsequent separation.
The data also exclude the more drastic model in which theribosomes dissociate during ODN annealing and RNase Htreatment and then rebind randomly to the mRNA. Thiswould lead to a substantial spreading of the OD254 in thesubsequent sucrose gradient, which was not observed. Further,the ability to see asymmetric and highly specific ribosomepositioning with GCN4 argues strongly against rearrangementduring processing (following section and Figure 4).
Translational control of GCN4 expression via uORFs
Relative to the wealth of information available about regula-tion at the level of transcription, few examples of translationalcontrol have been identified, and much less is known about the
13 14 15 16 17
2.5
1.0
5 74 10
20%
40%
25291232 1297
10 11 12 13 14 15 16 17
2 3 4 5 7 10
20%
40%
2.0
1.0
2130971 1159
-
20%
-1.0
0.5
5 7432
1410 139 1211 158 16
1332648 684
1 2 3 4 5 7 1040S 60S
8 9 10 11 12 13 14 15 16 17 181 2 3 4 5 6 7-
20%
40%
0.1
1.0
0.5
1047462 585
C YEF3
A ADH1
B HSP82
12 13 14 15 16 17
31351522 1613
3.0
1.0
2.0
74 103 5
20%
40%
E EF-2D PDA1
overlap5' fragment 3' fragment
Figure 5. Comparison of the ribosomal density on two halves of individual mRNAs. Polysomal mRNA was isolated from yeast cells and cleaved with ODNscomplementary to the positions near the center of each ORF (see text). Schematic representation of the coding region and the expected sizes of the cleavage productsare shown for each mRNA (assuming cleavage in the center of the ODN:mRNA duplex). Samples were separated on sucrose gradients and, in all cases, 18 fractionswere collected. The fractions indicated in each panel were subjected to northern analysis and hybridized with radiolabeled probes recognizing ADH1 (A), HSP82 (B),YEF3 (C), PDA1 (D) and EF-2 (E). On each northern blot, the open arrowheads indicate the full-length mRNA and the closed arrowheads indicate the two cleavageproducts. The assignment of the cleavage products as a 50- or a 30-fragment was based on the expected migration distance for an mRNA species corresponding to thelength of the coding region and the untranslated regions (40). Labeling of the northern blots is as in Figure 4. The number of ribosomes associated with the full-lengthmRNA corresponds to the number of ribosomes in the fraction pooled from the first sucrose gradient for RNase H treatment. The graph in each panel shows thePhosphorimager quantifications of the 50-cleavage product (blue) and the 30-cleavage product (red), expressed as percent of total signal in the probed fractions. Theoverlap in the signal is shown in purple.
2426 Nucleic Acids Research, 2005, Vol. 33, No. 8

underlying mechanisms. Perhaps the best-studied model fortranslation regulation in eukaryotes is GCN4, which has beenthe target of extensive genetic and biochemical studies byHinnebusch and others (27–30). This work has led to a detailedmodel for translational control of GCN4 expression, involvingupstream open reading frames (uORFs). Below, we brieflydescribe this model and tests, via RDM, of specific predictionsarising from it.
GCN4 mRNA contains four short uORFs in its 50-leader anda coding region of 281 amino acids (Figure 4A). According tothe model for translational regulation of GCN4, when cells aregrowing in rich media small ribosomal subunits bind to the50 end of the mRNA, scan the 50-leader and initiate translation
at the first encountered ORF, uORF1 (Figure 4A). Followingtranslation of uORF1, about half of the ribosomes dissociatewhile the other half remain bound and resume scanning, reini-tiating at one of the next uORFs. These ribosomes have a highprobability of dissociating after translating these uORFs, sothat a negligible fraction of ribosomes reach the coding regionand there is virtually no synthesis of GCN4 protein. Whencells experience starvation conditions, some of the ribosomesthat resume scanning after translating uORF1 skip the sub-sequent uORFs and reinitiate at the coding region. Reinitiationat the coding ORF is thought to be enhanced due to decrease inreinitiation and subsequent dissociation at uORFs 2, 3 and4, with the decreased reinitiation at these uORFs resulting
1047712 335(ii) 20%
40%
8 9 10 11 12 13 14 15 16 17 181 2 3 4 5 6 7
1 2 3 4 5 7 1040S 60S
1.0
0.5
0.1
-
8 9 10 11 12 13 14 15 16 17 181 2 3 4 5 6 7
1047312 735
1 2 3 4 5 7 1040S 60S
0.1
1.0
0.5
-
overlap5' fragment 3' fragment
(iii)1047
312 335
(i)
20%
40%
20%
40%
8 9 10 11 12 13 14 15 16 17 181 2 3 4 5 6 7
A ADH1
2 3 4 57 10
8 9 10 11 12 13 14 15 16 17 18-2.0
1.0
2130824 1306(i) 20%
40%
20%
40%
8 9 10 11 12 13 14 1516 17 18 -
2 3 4 57 10
2.0
1.0
21301362 768(ii)
(iii)2130
824 768 20%
40%
8 9 10 11 12 13 14 15 16 17 18
B HSP82
8 9 10 11 12 13 14 15 16 17 186 7
20%
20%
40%
-1692
5831109
1 2 3 4 5 7 10
1.5
1.0
1 2 3 4 5 7 10
1.5
1.0
681 10111692
(i)
(ii)
8 9 10 11 12 13 14 15 16 17 186 7
20%
40%
1692583681(iii)
8 9 10 11 12 13 14 15 16 17 186 7
D PDC1
3.0
2.0
1.0
1 2 3 4 5 7 1040S 60S
- 8 9 10 11 12 13 14 15 16 17 181 2 3 4 5 6 7
20%
40%
3.0
2.0
1.0
-
1 2 3 4 5 7 1040S 60S
8 9 10 11 12 13 14 15 16 17 181 2 3 4 5 6 7
20%
40%
(ii)3135
2045 1090
(iii) 11803135
1090
8 9 10 11 12 13 14 15 16 17 181 2 3 4 5 6 7
20%
40%
31351180 1955(i)
C YEF3
Figure 6. Comparison of the ribosomal density at the ends of individual mRNAs. Polysomal mRNA was isolated from yeast cells and RNase H-cleaved in thepresence of antisense ODNs complementary to positions at the 30 end of the first third [(i) in each panel] and the second third [(ii) in each panel] of the coding region.Schematic representations of the coding region and the expected sizes of the cleavage products are shown for each mRNA. Samples were separated on sucrosegradients and, in all cases, 18 fractions were collected. The fractions indicated in each panel were subjected to northern analysis and hybridized with radiolabeledprobes recognizing ADH1 (A), HSP82 (B), YEF3 (C) and PDC1 (D). Labeling is as in Figure 4. The graphs in (i) and (ii) of each panel show the phosphorimagerquantification results of the 50-cleavage product (blue) and the 30-cleavage product (red), expressed as percent of total signal in the probed fractions. The graph in (iii)presents the signals of the short fragments from (i) (blue) and (ii) (red) with the overlap shown in purple.
Nucleic Acids Research, 2005, Vol. 33, No. 8 2427

ultimately from phosphorylation of translation factor eIF2a(29–31). It is therefore predicted that ribosomes will be asso-ciated only with the 50-leader when translation is repressed,and with the 50-leader and the GCN4 coding ORF when trans-lation is induced. As described below, we tested these andother predictions of this model.
When yeast cells are growing in rich media, the majority ofpolysomal GCN4 mRNA is associated with a single ribosome(�60%) and there are almost no mRNAs with three or moreribosomes (6,7). We therefore first determined the positionof the single ribosome that is associated with GCN4 mRNAunder growth in rich media; the scanning model predicts anear-exclusive association with the uORFs. We isolated thefraction of mRNAs associated with a single ribosome byvelocity sedimentation in a sucrose gradient, which, as expec-ted, which, as expected, contained the majority of GCN4mRNA (data not shown). The GCN4 mRNA was cleavedimmediately upstream of the GCN4 ORF using an antisenseODN (ODN, �36) (Figure 4A). Cleavage products were thenseparated on a second sucrose gradient, 18 fractions werecollected across the gradient, and the indicated fractionswere analyzed by northern analysis (Figure 4B). Two bands areobserved, corresponding in length to the two cleavage pro-ducts. The cleavage product that corresponds to the GCN4ORF sediments mainly free of assembled ribosomes (fractions1–6), whereas the signal for 50-leader fragment is almostexclusively ribosome-associated (fractions 7–9): <10% ofGCN4 ORF fragments sediment with a ribosome, while>90% of the 50-leader fragments are ribosome-associated.This result was confirmed using a different antisense ODNcomplementary to a nearby sequence (ODN, �6, data notshown); thus, the ribosome associated with GCN4 mRNAunder growth in rich media is bound to the 50-leader and notto the coding region of the mRNA on nearly all GCN4 mRNAs.
We next tested the ribosomal position under translationallyderepressed conditions. Under these growth conditions, thereis a sharp increase in the number of ribosomes associated withGCN4 mRNA; >70% of GCN4 mRNAs are associated with3–7 ribosomes, and GCN4 mRNA with a single ribosome werebarely detectable (data not shown).The scanning and reiniti-ation model predict that there should be ribosome occupancyof both the GCN4 ORF and the region containing the uORFs.The fractions of the sucrose gradient corresponding to 3–7ribosomes were pooled, GCN4 mRNA was cleaved betweenthe 50-leader and the GCN4 ORF with the �36 antisense ODN,and the ribosomal association of the cleavage products wasdetermined as before (Figure 4C). RDM analysis reveals thatunder starvation conditions, >80% of the coding fragments and>90% of the 50-leader fragments are associated with ribosomes(fraction 7 and higher), and, moreover, that individual mRNAmolecules have ribosomes associated with both the 50-leaderand the coding region.
The scanning and reinitiation model predicts ribosomeassociation with uORF1 and also with uORFs 3 and 4(22,32). Thus, ribosomes are expected on multiple uORFsalong the GCN4 mRNA under repressed and derepressedgrowth conditions. To test this prediction, we isolated poly-somes from cells grown under derepressed conditions andcleaved the GCN4 mRNA at two sites in the 50-leader simul-taneously (positions �214 and �36). Derepressed conditionswere used because under these conditions, there are higher
levels of GCN4 mRNA, thereby allowing the detection of themultiple fragments obtained from the double cleavage. Thismultiple cleavage scheme yields multiple fragments from thesame mRNA, each sedimenting according to its ribosomalassociation, and thus allows finer mapping of the ribosomeson the 50-leader. Almost all fragments that include uORFs 1and 2, and a substantial fraction of the fragments that includeuORFs 3 and 4 sediment as associated with ribosomes (datanot shown). These data indicate that ribosomes are associatedwith uORFs 1 or 2 and uORFs 3 or 4 for a substantial fractionof GCN4 mRNAs. The association with multiple uORFs onthe same mRNA is consistent with the scanning and reinitiationmodel. We attempted to test the prediction that the associationof ribosomes with uORFs 3 and 4 is higher in cells grownunder repressed conditions. Although we were able to deter-mine that multiple ribosomes are associated with the uORFsregion, however, we could not unequivocally determinewhether the association at uORFs 3 and 4 is increased relativeto derepressed conditions due to lower GCN4 mRNA levelsunder repressed growth conditions (data not shown).
In summary, our results demonstrate that RDM canefficiently detect changes in ribosomal association along aparticular mRNA, and they confirm and extend several specificpredictions from the scanning and reinitiation modeldeveloped from genetic studies and supported by prior invitro translational toe-printing assays (27).
Exploring the stages of translation of yeast mRNAsby RDM
We used RDM to probe aspects of translation initiation,elongation and termination for yeast mRNAs with varyingORF lengths: ADH1 (1047 nt), PDA1 (1332 nt), PDC1(1692 nt), HSP82 (2130 nt), EF-2 (2529 nt) and YEF3(3135 nt). As described above (Scheme 1), polysomes corres-ponding to the predominant species for each mRNA wereisolated from yeast cells through a sucrose gradient, andeach target mRNA was cleaved independently at a singleposition within its coding region. Cleavage products werethen separated on a second sucrose gradient, 18 fractionswere collected across the gradient, and the indicated fractionswere analyzed by northern blot (Figures 5 and 6).
For each mRNA probed, three bands were observed in thenorthern blots, corresponding to the two cleavage products anda small amount of uncut mRNA. The full-length mRNA sedi-mented faster in the sucrose gradient than the cleavage pro-ducts in all cases, as is expected for a species with more boundribosomes, and this species serves as a useful control andmarker. In all cases, the uncut mRNA migrated at the positionexpected based on determination of the number of boundribosomes from northern and microarray analysis of the initialgradient [(7), and data not shown] and the number ofribosomes bound to the cleaved fragments summed, withinerror, to that for the uncut fragment.
Initially, the cleavage position was chosen close to the cen-ter of the ORF for each mRNA to provide the most sensitivereadout for any 50 or 30 bias in ribosome density, i.e. a uniformdensity would give equivalent sedimentation of the 50- and30-fragments, whereas a density difference would give differ-ent migration, as depicted in part v of Scheme 1. For eachmRNA probed, cleavage near the center gave two products
2428 Nucleic Acids Research, 2005, Vol. 33, No. 8
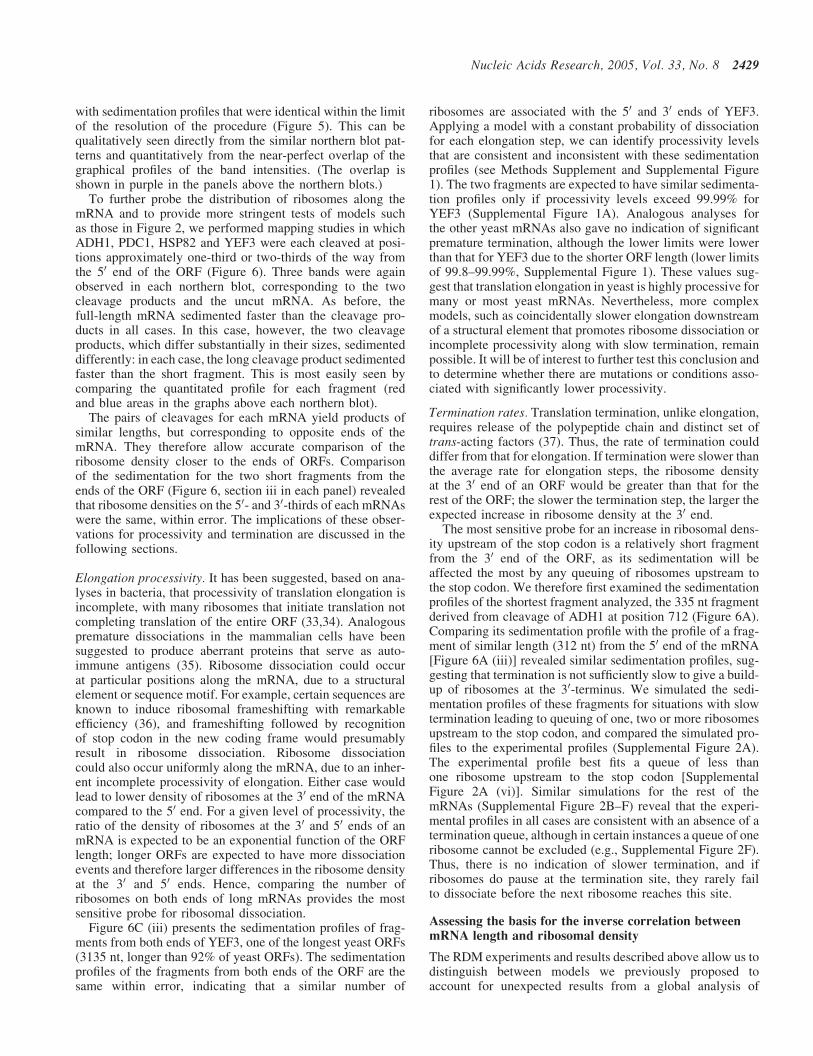
with sedimentation profiles that were identical within the limitof the resolution of the procedure (Figure 5). This can bequalitatively seen directly from the similar northern blot pat-terns and quantitatively from the near-perfect overlap of thegraphical profiles of the band intensities. (The overlap isshown in purple in the panels above the northern blots.)
To further probe the distribution of ribosomes along themRNA and to provide more stringent tests of models suchas those in Figure 2, we performed mapping studies in whichADH1, PDC1, HSP82 and YEF3 were each cleaved at posi-tions approximately one-third or two-thirds of the way fromthe 50 end of the ORF (Figure 6). Three bands were againobserved in each northern blot, corresponding to the twocleavage products and the uncut mRNA. As before, thefull-length mRNA sedimented faster than the cleavage pro-ducts in all cases. In this case, however, the two cleavageproducts, which differ substantially in their sizes, sedimenteddifferently: in each case, the long cleavage product sedimentedfaster than the short fragment. This is most easily seen bycomparing the quantitated profile for each fragment (redand blue areas in the graphs above each northern blot).
The pairs of cleavages for each mRNA yield products ofsimilar lengths, but corresponding to opposite ends of themRNA. They therefore allow accurate comparison of theribosome density closer to the ends of ORFs. Comparisonof the sedimentation for the two short fragments from theends of the ORF (Figure 6, section iii in each panel) revealedthat ribosome densities on the 50- and 30-thirds of each mRNAswere the same, within error. The implications of these obser-vations for processivity and termination are discussed in thefollowing sections.
Elongation processivity. It has been suggested, based on ana-lyses in bacteria, that processivity of translation elongation isincomplete, with many ribosomes that initiate translation notcompleting translation of the entire ORF (33,34). Analogouspremature dissociations in the mammalian cells have beensuggested to produce aberrant proteins that serve as auto-immune antigens (35). Ribosome dissociation could occurat particular positions along the mRNA, due to a structuralelement or sequence motif. For example, certain sequences areknown to induce ribosomal frameshifting with remarkableefficiency (36), and frameshifting followed by recognitionof stop codon in the new coding frame would presumablyresult in ribosome dissociation. Ribosome dissociationcould also occur uniformly along the mRNA, due to an inher-ent incomplete processivity of elongation. Either case wouldlead to lower density of ribosomes at the 30 end of the mRNAcompared to the 50 end. For a given level of processivity, theratio of the density of ribosomes at the 30 and 50 ends of anmRNA is expected to be an exponential function of the ORFlength; longer ORFs are expected to have more dissociationevents and therefore larger differences in the ribosome densityat the 30 and 50 ends. Hence, comparing the number ofribosomes on both ends of long mRNAs provides the mostsensitive probe for ribosomal dissociation.
Figure 6C (iii) presents the sedimentation profiles of frag-ments from both ends of YEF3, one of the longest yeast ORFs(3135 nt, longer than 92% of yeast ORFs). The sedimentationprofiles of the fragments from both ends of the ORF are thesame within error, indicating that a similar number of
ribosomes are associated with the 50 and 30 ends of YEF3.Applying a model with a constant probability of dissociationfor each elongation step, we can identify processivity levelsthat are consistent and inconsistent with these sedimentationprofiles (see Methods Supplement and Supplemental Figure1). The two fragments are expected to have similar sedimenta-tion profiles only if processivity levels exceed 99.99% forYEF3 (Supplemental Figure 1A). Analogous analyses forthe other yeast mRNAs also gave no indication of significantpremature termination, although the lower limits were lowerthan that for YEF3 due to the shorter ORF length (lower limitsof 99.8–99.99%, Supplemental Figure 1). These values sug-gest that translation elongation in yeast is highly processive formany or most yeast mRNAs. Nevertheless, more complexmodels, such as coincidentally slower elongation downstreamof a structural element that promotes ribosome dissociation orincomplete processivity along with slow termination, remainpossible. It will be of interest to further test this conclusion andto determine whether there are mutations or conditions asso-ciated with significantly lower processivity.
Termination rates. Translation termination, unlike elongation,requires release of the polypeptide chain and distinct set oftrans-acting factors (37). Thus, the rate of termination coulddiffer from that for elongation. If termination were slower thanthe average rate for elongation steps, the ribosome densityat the 30 end of an ORF would be greater than that for therest of the ORF; the slower the termination step, the larger theexpected increase in ribosome density at the 30 end.
The most sensitive probe for an increase in ribosomal dens-ity upstream of the stop codon is a relatively short fragmentfrom the 30 end of the ORF, as its sedimentation will beaffected the most by any queuing of ribosomes upstream tothe stop codon. We therefore first examined the sedimentationprofiles of the shortest fragment analyzed, the 335 nt fragmentderived from cleavage of ADH1 at position 712 (Figure 6A).Comparing its sedimentation profile with the profile of a frag-ment of similar length (312 nt) from the 50 end of the mRNA[Figure 6A (iii)] revealed similar sedimentation profiles, sug-gesting that termination is not sufficiently slow to give a build-up of ribosomes at the 30-terminus. We simulated the sedi-mentation profiles of these fragments for situations with slowtermination leading to queuing of one, two or more ribosomesupstream to the stop codon, and compared the simulated pro-files to the experimental profiles (Supplemental Figure 2A).The experimental profile best fits a queue of less thanone ribosome upstream to the stop codon [SupplementalFigure 2A (vi)]. Similar simulations for the rest of themRNAs (Supplemental Figure 2B–F) reveal that the experi-mental profiles in all cases are consistent with an absence of atermination queue, although in certain instances a queue of oneribosome cannot be excluded (e.g., Supplemental Figure 2F).Thus, there is no indication of slower termination, and ifribosomes do pause at the termination site, they rarely failto dissociate before the next ribosome reaches this site.
Assessing the basis for the inverse correlation betweenmRNA length and ribosomal density
The RDM experiments and results described above allow us todistinguish between models we previously proposed toaccount for unexpected results from a global analysis of
Nucleic Acids Research, 2005, Vol. 33, No. 8 2429

translation (7). We observed that longer ORFs have lowerribosome density and proposed three mechanistic models toexplain this inverse correlation: (i) Processivity is incomplete,because longer ORFs have more elongation steps and thusmore opportunities for ribosome dissociation, their overallribosome density would be lower. (ii) Slow terminationrates relative to elongation leading to accumulation ofribosomes at the termination site. The additional ribosomespresent at the 30 end of mRNA of all lengths would increase theoverall ribosome density of mRNAs with short ORF relative tothese with long ORFs. (iii) Initiation is slower for longermRNAs whereas elongation and termination rates are not cor-related with length. This would lead to a general trend of largerspacing between ribosomes on longer mRNAs.
A different distribution of ribosomes along an mRNA ispredicted for each of the above models. Models 1 and 2both predict uneven distributions: a higher density ofribosomes at the 50 end for model 1 (incomplete processivity)or a higher density at the 30 end for model 2 (slow termination).Model 3 predicts an even distribution of ribosomes (seeSupplemental Methods).
We fit each of these models to the observed inversecorrelation between ribosome density and coding sequencelength to provide quantitative constraints that could then becompared with the results from RDM (Figure 7). Model 1gives a best fit to the correlation with a processivity of99.3% per elongation step (Figure 7A). This is below thelower limit of 99.8% obtained for any mRNA from RDMdescribed above and far below the limit of 99.99% forYEF3 (Supplemental Figure 1). Model 2 is also eliminatedby the RDM data. Although accumulation of three ribosomescould account for the observed correlation in the slow termina-tion model (Figure 7B, solid line), the RDM data suggestsinstead an accumulation of at most one ribosome, as describedabove (Supplemental Figure 2). For model 3, no specific math-ematical form is necessitated; Figure 7C shows a simple expo-nential decrease in initiation rate with ORF length todemonstrate the magnitude of the trend required to accountfor the observed effect: the best fit corresponds to 2-folddecrease in initiation rate with each 1200 nt increase inORF length (Figure 7C). The observed uniform distributionof ribosomes across the mRNA is predicted by this model,although the data do not provide direct information aboutvariation in initiation rates with length. The origin of theapparently slower initiation of translation for longermRNAs is not clear. It could arise as a result of the moredistal polyA tail from the cap in longer mRNAs, as thepolyA tail enhances translation initiation through interactionwith initiation complex (38). Alternatively, or in addition,stable structures can inhibit translation initiation (39), andlonger mRNAs might be more prone to self-structure thanshort mRNAs.
PERSPECTIVE
We have developed an efficient and general method to mapribosomal densities along individual mRNAs. Mapping thedistribution of ribosomes along several yeast mRNAs hasrevealed properties of basic steps of translation in vivo andallowed tests of the mechanisms of GCN4 translational con-trol. RDM will allow investigation of the features, factors and
conditions that affect ribosome binding, dissociation andmovement along the mRNA. In addition to general properties,the behavior of specific mRNAs that undergo translationalregulation via upstream ORFs, frameshifting and other
Figure 7. Comparison of experimentally measured ribosomal densities topredictions from incomplete processivity, slow termination and slow initi-ation models. Ribosomal densities measured for 739 mRNAs by microarrayanalysis of polysomal fractions (7) are plotted versus ORF length (blackcircles). Each circle represents the average density for ORF lengths binnedin 100 nt intervals (up to 4400 nt). Lines represent predicted density values byeach model (the details of density calculations for each model are described inthe Methods Supplement). (A) Incomplete processivity (model 1). Solid linerepresents the best fit to the experimentally measured densities with aprocessivity level of 99.30% per elongation step. Predicted values for higherprocessivity levels, corresponding to limits obtained from RDM of99.8% processivity (short-dashes) and 99.99% processivity (long-dashes)are shown for comparison. (B) Slow termination (model 2). The solid linerepresents the best fit for the experimentally measured densities, which corre-sponding to a queue of three ribosomes at the 30 end of the ORF. An example ofthe predicted density with queue of one ribosome is also shown (long dashesline). (C) Slow initiation (model 3). The line represents the best fit to theexperimentally measured densities for a model in which initiation ratesdecrease exponentially with increase in mRNA length.
2430 Nucleic Acids Research, 2005, Vol. 33, No. 8

means can be probed. It should now be possible to investigatewhether the relative rates of the three stages of translation aredifferent under alternative growth conditions and in variousmutant strains. These additional data should facilitate devel-opment and evaluation of quantitative models for translationand its control.
SUPPLEMENTARY MATERIAL
Supplementary Material is available at NAR Online.
ACKNOWLEDGEMENTS
We thank A. Hinnebusch, J. Lorsch, P. Sarnow and members ofthe Herschlag laboratory for comments on the manuscript.This work was supported by grants from the American HeartAssociation (to D.H.) and the Howard Hughes Medical Institute(HHMI). P.O.B. is an HHMI investigator and Y.A. was anHHMI research associate. Funding to pay the OpenAccess publication charges for this article was provided byHHMI.
Conflict of interest statement. None declared.
REFERENCES
1. Rickwood,D. (1992) Preparative Centrifugation. A Practical Approach,2nd edn. Oxford, New York.
2. Warner,J.R., Knopf,P.M. and Rich,A. (1963) A multiple ribosomalstructure in protein synthesis. Proc. Natl Acad. Sci. USA, 49,122–129.
3. Ashe,M.P., De Long,S.K. and Sachs,A.B. (2000) Glucose depletionrapidly inhibits translation initiation in yeast. Mol. Biol. Cell, 11,833–848.
4. Dickson,L.M. and Brown,A.J. (1998) mRNA translation in yeast duringentry into stationary phase. Mol. Gen. Genet., 259, 282–293.
5. Proweller,A. and Butler,J.S. (1996) Ribosomal association of poly(A)-binding protein in poly(A)-deficient Saccharomyces cerevisiae. J. Biol.Chem., 271, 10859–10865.
6. Tzamarias,D., Roussou,I. and Thireos,G. (1989) Coupling of GCN4mRNA translational activation with decreased rates of polypeptide chaininitiation. Cell, 57, 947–954.
7. Arava,Y., Wang,Y., Storey,J.D., Liu,C.L., Brown,P.O. and Herschlag,D.(2003) Genome-wide analysis of mRNA translation profiles inSaccharomyces cerevisiae. Proc. Natl Acad. Sci. USA, 100, 3889–3894.
8. Zong,Q., Schummer,M., Hood,L. and Morris,D.R. (1999) MessengerRNA translation state: the second dimension of high-throughputexpression screening. Proc. Natl Acad. Sci. USA, 96, 10632–10636.
9. Mikulits,W., Pradet-Balade,B., Habermann,B., Beug,H.,Garcia-Sanz,J.A. and Mullner,E.W. (2000) Isolation of translationallycontrolled mRNAs by differential screening. FASEB J., 14, 1641–1652.
10. Brown,V., Jin,P., Ceman,S., Darnell,J.C., O’Donnell,W.T.,Tenenbaum,S.A., Jin,X., Feng,Y., Wilkinson,K.D., Keene,J.D. et al.(2001) Microarray identification of FMRP-associated brain mRNAs andaltered mRNA translational profiles in fragile X syndrome. Cell, 107,477–487.
11. Kuhn,K.M., DeRisi,J.L., Brown,P.O. and Sarnow,P. (2001) Global andspecific translational regulation in the genomic response ofSaccharomyces cerevisiae to a rapid transfer from a fermentable to anonfermentable carbon source. Mol. Cell. Biol., 21, 916–927.
12. Johannes,G., Carter,M.S., Eisen,M.B., Brown,P.O. and Sarnow,P. (1999)Identification of eukaryotic mRNAs that are translated at reduced capbinding complex eIF4F concentrations using a cDNA microarray. Proc.Natl Acad. Sci. USA, 96, 13118–13123.
13. Rajasekhar,V.K., Viale,A., Socci,N.D., Wiedmann,M., Hu,X. andHolland,E.C. (2003) Oncogenic Ras and Akt signaling contribute to
glioblastoma formation by differential recruitment of existing mRNAs topolysomes. Mol. Cell, 12, 889–901.
14. MacKay,V.L., Li,X., Flory,M.R., Turcott,E., Law,G.L., Serikawa,K.A.,Xu,X.L., Lee,H., Goodlett,D.R., Aebersold,R. et al. (2004) Geneexpression analyzed by high-resolution state array analysis andquantitative proteomics: response of yeast to mating pheromone.Mol. Cell Proteomics, 3, 478–489.
15. Ramakrishnan,V. (2002) Ribosome structure and the mechanism oftranslation. Cell, 108, 557–572.
16. Kapp,L.D. and Lorsch,J.R. (2004) The molecular mechanics ofeukaryotic translation. Annu. Rev. Biochem., 73, 657–704.
17. Hartz,D., McPheeters,D.S., Traut,R. and Gold,L. (1988) Extensioninhibitionanalysisof translation initiationcomplexes.MethodsEnzymol.,164, 419–425.
18. Sachs,M.S., Wang,Z., Gaba,A., Fang,P., Belk,J., Ganesan,R., Amrani,N.and Jacobson,A. (2002) Toeprint analysis of the positioning of translationapparatus components at initiation and termination codons of fungalmRNAs. Methods, 26, 105–114.
19. Wolin,S.L. and Walter,P. (1988) Ribosome pausing and stacking duringtranslation of a eukaryotic mRNA. EMBO J., 7, 3559–3569.
20. Wolin,S.L. and Walter,P. (1989) Signal recognition particle mediates atransient elongation arrest of preprolactin in reticulocyte lysate.J. Cell Biol., 109, 2617–2622.
21. Mueller,P.P. and Hinnebusch,A.G. (1986) Multiple upstream AUGcodons mediate translational control of GCN4. Cell, 45,201–207.
22. Abastado,J.P., Miller,P.F., Jackson,B.M. and Hinnebusch,A.G. (1991)Suppression of ribosomal reinitiation at upstream open reading frames inamino acid-starved cells forms the basis for GCN4 translational control.Mol. Cell. Biol., 11, 486–496.
23. Werner,M., Feller,A., Messenguy,F. and Pierard,A. (1987) The leaderpeptide of yeast gene CPA1 is essential for the translational repression ofits expression. Cell, 49, 805–813.
24. Sagliocco,F.A., Vega Laso,M.R., Zhu,D., Tuite,M.F., McCarthy,J.E. andBrown,A.J. (1993) The influence of 50-secondary structures uponribosome binding to mRNA during translation in yeast. J. Biol. Chem.,268, 26522–26530.
25. Yaman,I., Fernandez,J., Liu,H., Caprara,M., Komar,A.A.,Koromilas,A.E., Zhou,L., Snider,M.D., Scheuner,D., Kaufman,R.J. et al.(2003) The zipper model of translational control: a small upstream ORFis the switch that controls structural remodeling of an mRNA leader. Cell,113, 519–531.
26. Wang,Y., Liu,C.L., Storey,J.D., Tibshirani,R.J., Herschlag,D. andBrown,P.O. (2002) Precision and functional specificity in mRNA decay.Proc. Natl Acad. Sci. USA, 99, 5860–5865.
27. Gaba,A., Wang,Z., Krishnamoorthy,T., Hinnebusch,A.G. andSachs,M.S. (2001) Physical evidence for distinct mechanisms oftranslational control by upstream open reading frames. EMBO J., 20,6453–6463.
28. Albrecht,G., Mosch,H.U., Hoffmann,B., Reusser,U. and Braus,G.H.(1998) Monitoring the Gcn4 protein-mediated response in theyeast Saccharomyces cerevisiae. J. Biol. Chem., 273,12696–12702.
29. Hinnebusch,A.G. (1997) Translational regulation of yeast GCN4.A window on factors that control initiator-tRNA binding to the ribosome.J. Biol. Chem., 272, 21661–21664.
30. Dever,T.E. (2002) Gene-specific regulation by general translationfactors. Cell, 108, 545–556.
31. Geballe,A.P. and Sachs,M.S. (2000) Translational control by upstreamopen reading frame.. In Sonenberg,N., Hershey,J.W.B. andMathews,M.B. (eds), Translational Control of Gene Expression. CSHLPress, Cold Spring Harbor.
32. Abastado,J.P., Miller,P.F. and Hinnebusch,A.G. (1991) A quantitativemodel for translational control of the GCN4 gene of Saccharomycescerevisiae. New Biol., 3, 511–524.
33. Jorgensen,F. and Kurland,C.G. (1990) Processivity errors of geneexpression in Escherichia coli. J. Mol. Biol., 215, 511–521.
34. Tsung,K., Inouye,S. and Inouye,M. (1989) Factors affecting theefficiency of protein synthesis in Escherichia coli. Production of apolypeptide of more than 6000 amino acid residues. J. Biol. Chem., 264,4428–4433.
35. Yewdell,J.W., Anton,L.C. and Bennink,J.R. (1996) Defective ribosomalproducts (DRiPs): a major source of antigenic peptides for MHCclass I molecules? J. Immunol., 157, 1823–1826.
Nucleic Acids Research, 2005, Vol. 33, No. 8 2431
36. Farabaugh,P.J., Qian,Q. and Stahl,G. (2000) Programmed translationalframeshifting, hopping and readthrough of termination codons.In Sonenberg,N., Hershey,J.W.B. and Mathews,M.B. (eds),Translational Control of Gene Expression. CSHL Press, Cold SpringHarbor.
37. Kisselev,L., Ehrenberg,M. and Frolova,L. (2003) Termination oftranslation: interplay of mRNA, rRNAs and release factors? EMBO J.,22, 175–182.
38. Sachs,A.B. (2000) Physical and functional interactions between themRNA cap structure and the polyA tail. In Sonenberg,N., Hershey,J.W.B.and Mathews,M.B. (eds), Translational Control of Gene Expression.CSHL Press, Cold Spring Harbor.
39. McCarthy,J.E.G. (1998) Posttranscriptional control of gene expression inyeast. Microbiol. Mol. Biol. Rev., 62, 1492–1553.
40. Hurowitz,E.H. and Brown,P.O. (2003) Genome-wide analysis of mRNAlengths in Saccharomyces cerevisiae. Genome Biol., 5, R2.
2432 Nucleic Acids Research, 2005, Vol. 33, No. 8