discussion: paolo pinotti (bocconi) - frdb · summary •great recession (gr) unemployment, by...
TRANSCRIPT

Poverty, the Social Safety Net and the Great Recession
Hilary Hoynes (UC Berkeley)
Discussion: Paolo Pinotti (Bocconi)
October 15, 2014

Summary
• Great Recession (GR) unemployment, by group– stronger effect on black males, low-skilled, youth
• the safety net in the US1. 1996 reform from ‘out-of-work’ to ‘in-work’ assistance
• incentives to labor market participation and employmentduring expansionary periods
• holes during recessions?
2. policy adjustments during GR: extendedunemployment benefits, food stamps
• the GR compared to previous recessions– stronger increase in extreme poverty (because of 1.)
– weaker increase in poverty (because of 2.)

Outline of discussion
• GR unemployment– the evidence from the US: age or education effects?
– comparison US vs. Italy/Europe
• GR poverty in Italy and Europe– differential effects by age and education
• the safety net across countries– the «holes» in (some) European countries: dualism
and the generation gap

GR unemploymentage effects in the US
Age or education effects?

GR unemploymentage effects in Italy vs. US
01
23
15-19 20-24 25-29 30-34 35-39 40-44 45-49 50-54 55-59Age category
United States Italy
Notes: data from harmonized OECD-LFS, methodology as in Hoynes et al. (2012)

GR unemploymentage effects across countries
0.5
11
.52
15-19 20-24 25-29 30-34 35-39 40-44 45-49 50-54 55-59
Anglo-Saxon countries (USA, UK, AUS, CAN)
0.5
11
.52
15-19 20-24 25-29 30-34 35-39 40-44 45-49 50-54 55-59
Continental Europe (DEU, FRA, BEL, NLD)0
.51
1.5
2
15-19 20-24 25-29 30-34 35-39 40-44 45-49 50-54 55-59
Southern Europe (POR, ITA, ESP, GRE)
0.5
11
.52
15-19 20-24 25-29 30-34 35-39 40-44 45-49 50-54 55-59
Scandinavian countries (SWE, DNK, NOR, FIN)
Notes: data from harmonized OECD-LFS, methodology as in Hoynes et al. (2012)

Unemployment ratescross country evidence, 2001-2013
0.1
.2.3
2001 2003 2005 2007 2009 2011 2013
15-34 35-44 45-54 55-64
Anglo-Saxon countries
0.1
.2.3
2001 2003 2005 2007 2009 2011 2013
15-34 35-44 45-54 55-64
Continental Europe
0.1
.2.3
2001 2003 2005 2007 2009 2011 2013
15-34 35-44 45-54 55-64
Southern Europe
0.1
.2.3
2001 2003 2005 2007 2009 2011 2013
15-34 35-44 45-54 55-64
Scandinavian countries
Notes: data from harmonized OECD-LFS

The safety net in OECD countriesbefore GR (2005)
Notes: data from OECD Social Expenditure Database (SOCX)
0
5
10
15
20
25
30
35
Social Expenditure in OECD countries (%GDP)
social security health active labor market policies unemployment benefits other programs

The safety net in OECD countriesduring GR (change 2005-2009)
-1
-0,5
0
0,5
1
1,5
2
2,5
Change in Social Expenditure in OECD countries (% GDP), period 2005-2009
unemployment + active labour market programmes pensions
Notes: data from OECD Social Expenditure Database (SOCX)
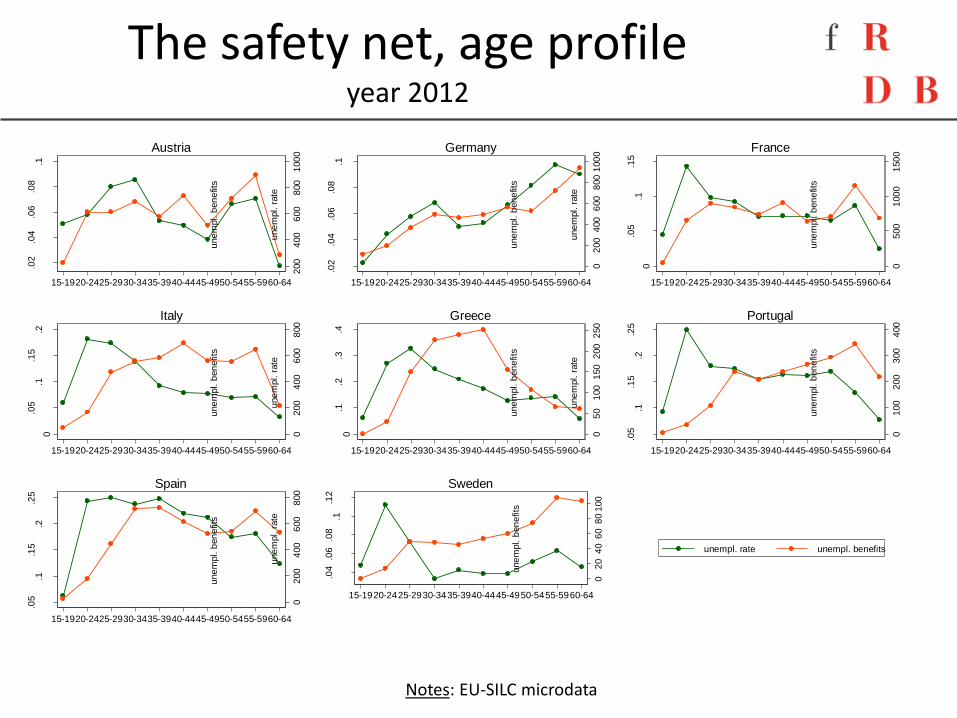
The safety net, age profileyear 2012
Notes: EU-SILC microdata
200
400
600
800
100
0
une
mpl. b
en
efits
.02
.04
.06
.08
.1
une
mpl. r
ate
15-1920-2425-2930-3435-3940-4445-4950-5455-5960-64
Austria
02
00
400
600
800
100
0
une
mpl. b
en
efits
.02
.04
.06
.08
.1
une
mpl. r
ate
15-1920-2425-2930-3435-3940-4445-4950-5455-5960-64
Germany
05
00
100
01
50
0
une
mpl. b
en
efits
0
.05
.1.1
5
une
mpl. r
ate
15-1920-2425-2930-3435-3940-4445-4950-5455-5960-64
France
02
00
400
600
800
une
mpl. b
en
efits
0
.05
.1.1
5.2
une
mpl. r
ate
15-1920-2425-2930-3435-3940-4445-4950-5455-5960-64
Italy
05
01
00
150
200
250
une
mpl. b
en
efits
0.1
.2.3
.4
une
mpl. r
ate
15-1920-2425-2930-3435-3940-4445-4950-5455-5960-64
Greece
01
00
200
300
400
une
mpl. b
en
efits
.05
.1.1
5.2
.25
une
mpl. r
ate
15-1920-2425-2930-3435-3940-4445-4950-5455-5960-64
Portugal
02
00
400
600
800
une
mpl. b
en
efits
.05
.1.1
5.2
.25
une
mpl. r
ate
15-1920-2425-2930-3435-3940-4445-4950-5455-5960-64
Spain
02
04
06
08
01
00
une
mpl. b
en
efits
.04
.06
.08
.1.1
2
une
mpl. r
ate
15-1920-2425-2930-3435-3940-4445-4950-5455-5960-64
unempl. rate unempl. benefits
Sweden

The safety net, age profilechange 2005-2012
Notes: EU-SILC microdata
0
10
00
20
00
30
00
15-19 20-24 25-29 30-34 35-39 40-44 45-49 50-54 55-59 60-64
Continental, 2005 Continental, 2012
Southern, 2005 Southern, 2012

GR absolute povertythe Italian case
Notes: official (absolute) poverty rate, as computed by the Italian National Statistical Institute (ISTAT)
0
1
2
3
4
5
6
7
8
9
10
2005 2006 2007 2008 2009 2010 2011 2012 2013
Absolute poverty in Italy, by age of the head of household
under 35 35-44 years 45-54 years 55-64 years 65 years

GR poverty (unmet needs)cross country evidence, 2005-2012
Notes: EU-SIL microdata, % people unable to afford a complete meal every second day and/or unexpected expenses (=1 in 2007)
.6.8
11.2
1.4
1.6
2005 2006 2007 2008 2009 2010 2011 2012
under 35 35-44 45-54 55-64 over 65
United Kingdom
.6.8
11.2
1.4
1.6
2005 2006 2007 2008 2009 2010 2011 2012
under 35 35-44 45-54 55-64 over 65
Continental Europe (AUT,DEU,FRA,NLD)
.6.8
11.2
1.4
1.6
2005 2006 2007 2008 2009 2010 2011 2012
under 35 35-44 45-54 55-64 over 65
Southern Europe (ESP,PRT,ITA,GRC)
.6.8
11.2
1.4
1.6
2005 2006 2007 2008 2009 2010 2011 2012
under 35 35-44 45-54 55-64 over 65
Scandinavian countries (SWE,NOR,DNK,FIN)

Conclusions
• dualism systematic holes in the safety net of many European countries
– combined effect of lower employmentprotection and lesser access to social benefits
• scars of GR on younger generations?
– health?
– family formation?
– fertility?