discussion - orbi.uliege.be sname 2005 am... · paik's formula for a slight level of initial...
TRANSCRIPT
1
Trans. SNAME, Vol.113, 2005. Ultimate limit state design technology for aluminum multi-hull
ship structures’ authored by J K Paik et al
Discussion
Matthew Collette, Member
I would like to congratulate the authors on presenting a paper which is both timely and
extremely interesting. As the application of high-speed aluminum vessels expands to include
larger vessels and more severe operating environments, using limit-state design techniques
becomes increasingly important. At the present time, such limit state techniques are not as
refined for aluminum structures as they are for steel structures in the marine world, which makes
a paper such as this one even more valuable. The authors have contributed new information on
many key aspects of the ultimate compressive limit states for aluminum, including residual
stresses and shakedown effects, panel behavior, numerical panel analysis, and hull-girder
ultimate strength analysis.
There have been relatively few experimental collapse tests of aluminum panels built out of
marine alloys with marine construction techniques; so I was very interested to see some of the
first results from the test program carried out by the authors. The comprehensive work on
measuring initial deflections and residual stresses undertaken as part of this study is also very
valuable. The computed ultimate strength and shape of the panel’s load-shortening curve is
influenced by these imperfections, as shown by the finite element results presented by the
authors. While the residuals stresses do affect the ultimate strength, they will also affect the
fatigue strength of welded details which have proved particularly troublesome for aluminum
craft. One of the common questions in fatigue analysis is how the residual stresses affect the
mean stress, and whether inducing compressive residual stresses at a fatigue-prone location
provides for lasting fatigue resistance. In the present study, shakedown under relatively high
loading and a few load cycles was shown to significantly reduce the level of residual stress. Do
the authors have any comments on the expected amount of shakedown reduction that might be
experienced under a typical service load spectrum with many more cycles but at a lower stress
level? Are any more experiments planned in this area?
As noted by the authors, assuming that aluminum follows the traditional elastic-perfectly-
plastic stress-strain curve may not always yield conservative results. For un-stiffened plate
components in compression, the experimental test programs to date have made it clear that the
fully heat-treated temper should be considered separately from alloys without this heat treatment
because of differences in the shape of the material stress-strain curve. For the marine world, this
means that un-stiffened plates made from 5000-series aluminum alloys should be treated
differently from plates made from 6000-series alloys in the T6 temper. This separation is
reflected in both the U.S. and European civil engineering design codes for these alloys. For
stiffened panels the influence of temper is not always so clear-cut; especially as the plating and
stiffeners may not be made out of the same temper. It seems logical that influence of temper on
ultimate compressive strength might vary along with the relative slenderness of the panel, the
boundary conditions, and how rapid the panel failure mode is (e.g. tripping vs. plate failure). In
this regard, I would be very interested to learn if the authors have been able to identify if temper
difference are more significant for panels with certain properties in their experimental analysis.
In the numerical analysis presented here, I noted that the same minimum value for the “knee”

2
factor in the stress-strain curve was assumed for the –H116 and –T6 tempers (Table 6 of the
paper). While this should be a conservative approach for the -T6 alloy, taking such an approach
may hide some interesting alloy-dependent behavior differences. In closing, I would like to
congratulate the authors again on a most interesting paper and look forward to reading more on
the current experimental test program as it progresses.
Bart Boon, Visitor, Bart Boon Consultancy, The Netherlands
The authors are to be complimented on a very interesting and timely paper. Ultimate strength is
rapidly gaining ground as basis for assessing structures of ships of many different types. Novel
ship types, such as multi-hull ships, can rely upon experience to a far lesser extent than more
traditional mono-hull ships. The relevance of ultimate strength analysis for multi-hull ships thus
is even greater than it already is for conventional ships.
The authors in this paper extend their earlier work for mono-hull ship structures. Basically they
consider the hull as a (long, slender) beam where in bending originally plane cross-sections
remain plane and where progressive collapse is concentrated in one, relatively short, cross-
section of the hull. For many conventional ship hulls these assumptions may well be valid. For
other ship hulls this may be less true. Multi-hull vessel structures in general are characterized by
being less slender (at least for the complete hull) and by a much more 3-dimensionnal character.
This may result in important shear lag effects and local deformations of the cross-section leading
to a non-linear stress and strain distribution. As an example the figure below taken from
Heggelund and Moan (2002) shows a limited effectiveness of the superstructure in longitudinal
bending.
Fig.A.1 Longitudinal bending stress distribution
The way in which longitudinal stresses are transferred from the hull into the upper deck is
important. Structures remote from the cross-section under consideration may play an important
role. It is possible that such remote structures under an increasing overall bending moment fail
much earlier (or possibly later) than the cross-sectional structure considered for the collapse.
Such remote failure will then influence the failure at the location of the final total collapse.
Similarly, in the cross-section of a catamaran some longitudinal bulkheads or other structural
members may not stay at the same relative vertical height because of insufficient vertical support
3
of that structure. This would lead to changes in the shape of the cross-section when subjected to
an increase in load. Such situation would be in conflict with some of the assumptions made for
the progressive collapse analysis as presented. What recommendations do the authors have for
such 3-dimensional structural behavior and what is the influence upon the situation where
progressive collapse is assumed to take place in only one cross-section?
A different question arises with regard to the collapse behavior of the structure itself. In a beam
with an open U-cross-section after failure of one of the sides under longitudinal bending
(tripping of the side walls) the axis around which bending takes place, may get a different
orientation (minimum energy needed for collapse). The progressive collapse suddenly may be in
a different direction from what it was initially. This may be the result of small non-symmetrical
characteristics of the structure or the loads. Maybe even a collapse involving torsion is possible
in such later stage. The method presented by the authors assumes only orientation for the
bending axis in failure. How important may such interaction between various failure modes
(orientation) for the overall structure be?
Reference
Heggelund, S.E. and Moan, T. (2002). Analysis of global load effects in catamarans, Journal of
Ship Research, 46, 2002.
Philippe Rigo and Thomas Richir, Visitors, University of Liege, Belgium
First we would like to congratulate the authors for the quality of their paper. This one is very
useful for ULS based design and strength assessment of aluminum multi-hull ship structures. We
read it with great interest and we would like to make some comments, particularly in regard to
the closed-form ULS formula (Eq.(3) in the discussed paper).
In the paper entitled Effect of Welding on Ultimate Compressive Strength of Aluminum
Stiffened Panels presented at HIPER’04, Richir et al. (2004) investigate the ultimate compressive
strength characteristics of a welded aluminum stiffened panel with varying welding related
parameters such as weld type, width of HAZ (heat-affected zone) and reduction of yield stress
due to HAZ softening. Non linear finite element analyses and the ULS formula were used for the
sensitivity analyses on the parameters.
The sensitivity on weld type was analyzed by considering the following weld zones in the
mesh modeling (Fig.A.2):
- five longitudinal welds at the junction between the transverse plate and the five stiffeners,
- four longitudinal welds at the intersection between the five extruded elements,
- two transverse welds between plates.
The ultimate strength obtained through the ULS formula for welds A (stiffeners welded on the
plate) was quite similar to that for welds B (extruded elements) while the ultimate strength
calculated by finite element analyses was higher for welds B than for welds A. Indeed welds B
are only taken into account in the ULS formula through the sP expression which becomes:
sP = (b-2 'pb ) t Yp + 2 '
pb t 'Yp + wh wt Ys + fb ft Ys

4
Is it correct that the ULS formula is only valid for welds A or can we use it also for welds B?
Can we consider the effect of welding along transverse frames, i.e., Welds C?
L/4
L/4
L/4
L/4
Welds A
Longitudinal welds
at the junction
plate-stiffeners
5 welds
Welds B
Longitudinal welds
at the junction between
extruded elements
4 welds
Weld C1
Weld at ½ span
Weld C2
Weld at ¼ span
C2
C1
L
L
L
Fig.A.2 Considered weld locations
Figure A.3 shows the effect of yield stress in HAZ on the panel ultimate compressive strength.
The ULS formula gives a very small sensitivity of the panel ultimate strength on the yield stress
in the HAZ, while a reduction of 10% yield stress in the HAZ results in an ultimate strength
reduction varying from 2% to 5% in the finite element analyses. Do you have an explanation?
We would like to thank again the authors for their remarkable paper.
0
40
80
120
160
200
105 115 125 135 145 155 165 175
Yield s tres s in the HAZ (N/mm²)
Ult. s trength
(N/mm²)
Benchmark ISSC'2003
Paik's fo rmula fo r a s light level o f init ial deflect ion
Paik's fo rmula fo r an average level o f init ial deflect ion
Paik's fo rmula fo r a severe level o f init ial deflect ion
Fig.A.3 Sensitivity on yield stress in the HAZ

5
References
Richir, T., Toderan, C., Paik, J.K. and Rigo, Rigo (2004). Effect of welding on ultimate
compressive strength of aluminium stiffened panels, HIPER’2004, High Performances
Marine Vehicules, Rome, September, pp.129-1
Rigo, P. et al. (2003). Sensitivity analysis on ultimate strength of aluminium stiffened panels,
Marine Structures, Vol. 16, pp.437–468
Magnus Arason, Visitor, QinetiQ, UK
In summary, the paper provides a basis for ultimate limit state assessment of ship structures
that can be applied to aluminium multihulls. The presented computer modelling and analysis
system appears appropriate for supplementing the limit state design procedure. A few points for
discussion are noted below:
It is difficult to argue that multi-hulls have advantages over conventional mono-hulls in terms
of strength and durability, although problems relating to these attributes may not be currently
evident.
Whilst the comparative Table 3 suggests good performance of the laser welded aluminum
panels in terms of welding induced initial distortions, it should be noted that the distortion values
quoted for steel apply to arc welded structures. Material type is therefore not the only varying
parameter in the comparison. Laser welding generally induces less initial distortion than
conventional arc welding. The same applies to comparison of welding induced residual stresses
between the aluminum panels of the study and the observations of Smith et al.
It would have been of interest to include a quantification of the effect of reduced yield stress
for the HAZ in the FEA modelling, particularly when modelled jointly with the actual residual
stress distribution.
Inclusion of structural imperfections (initial distortions and residual stresses) in the
ALPS/HULL assessment of the two steel hull girder sections is not outlined specifically, but the
good correlation with the measured data indicates that exact match between test conditions and
the computer model has been achieved.
Limit state approaches continue to replace allowable stress methods in new and revised codes
of practice, as is noted in the paper. In practice, limit state design is executed using partial safety
factors of design standards that account for uncertainties associated with the design conditions.
To establish a basis for a comprehensive capacity prediction for a limit state based procedure for
aluminum ship structures, a few more parameters than those presented in the paper need to be
estimated, with the panel- and hull girders strength predictions in the paper effectively presented
as deterministic.
These parameters would feed assignment of partial safety factors accounting for
- variability in material properties,
- variability in geometrical dimensions of aluminum structural components and
- modelling uncertainties, although data is presented that indicates that this is very significant.
In calibration of a limit state based methodology for design of aluminium multi-hulls, random
variables for the above parameters need to be identified. Load derivations would also be subject
to the same type of uncertainty assessment.

6
Ton Bos, Visitor, Hydrographic and Marine Consultants BV, The Netherlands
With great interest I read to the present paper. I am of the opinion that the research described is
comprehensive and takes into account many important issues such as the shakedown of welding
residual stresses under cyclic loading. As fatigue and fatigue life assessment is more and more
becoming an important issue we do wonder in how far fatigue and fatigue life assessment can
be improved using the knowledge obtained with the research described in the publication. Like
to learn the views of the authors on the fatigue issues and whether to authors are of the opinion
that practical calculation methods can be developed to obtain more and accurate assessments on
fatigue and fatigue life.
Strength and fatigue issues will be come more and more important in our works pertaining the
preparation of transport manuals. This relates to the transport on semi submersible barges and
heavy lift vessels such bulky and sensitive cargoes. Would like to learn the views of the authors
on the possibility to use the ULS approach for this kind of projects.
Dracos vassalos and Yunlong Zheng, Visitors, Universities of Glasgow and Stratheclyde, UK
The authors are to be congratulated for the excellent piece of research work presented in this
paper, certainly of theoretical and practical importance, offering methodologies and program
systems that can be used for aluminium and steel ships. The following are some specific
comments and suggestions for a response to which will be gratefully appreciated.
In page 10, in the residual stress relief tests 3 and 5 load cycles are applied to aluminium 5083
and 5383, respectively. To this end, different cycles should be applied to the same material to
examine the relaxation characteristics whereas the characteristics of the two materials should be
compared using the same number of cycles.
In pages 5 and 14, although engineering stress-strain relations may be sufficient in some
plasticity analyses, in ULS analysis one may wish to use true stress-strain relationships if the
strain is found to be not small. Therefore, it would be clearer to give the definition of strain and
stress in Figs.6 and 21 and provide pertinent data if available.
In page 14, it is important to have pointed out and explained that an elastic-perfectly plastic
material model does not always yield conservative results for aluminium alloy. It may be
relevant to describe how the yield point is defined in Fig.21.
In page 17, it is seen that the 2-bay FEA always gives a larger ULS than 1-bay FEA. However,
in Fig.22(b) the 2-bay FEA does not seem to give larger ULS (mode III/CIP), (4)<(2) and (8)
similar to (6). The 2-bay model with free sides will cut the transverse frames off the
neighbouring structure. Therefore, discontinuous transverse frames provide some rotational
constraint on the one hand (open-web beams are torsionally weak) and loss most of vertical
constraints on the other.
In page 20, it is pointed out in the discussion that different finite element modelling can lead to
very different or even wrong results. In the light of this, closed-form formulae derived from the
fitting of FEA results might be biased if the same mesh scheme is utilised for the same geometry
with varying parameters. Further description in this respect will be more informative.
In Figs.27(d) and 28(d), the agreements of ALPS/HULL predictions with test measurements by
UK Royal Navy and by US Navy are very good. ALPS/HULL uses sliced models comprising
only longitudinal members. Transverse members, however, would have an effect on the ULS.
They provide non-rigid support and the buckling of plate panels may be symmetrical or

7
unsymmetrical w.r.t. supports, which would give rise to a difference in ULS. Some description
on the effects of transverse members would be appreciated.
Chan Ho Shin, Visitor, Korean Register of Shipping, Korea
In this paper, the influence of wave pressure loads on the ultimate hull girder strength has not
been considered. However, it is known that the ultimate strength is reduced by 5-10% due to the
local loads. It would be better to explain the reason why the local load effects were neglected in
the calculation.
For frigate and catamaran fast ship the hull between two transverse frames was taken as the
extent of analysis. However, for double skin tanker the hull between two transverse bulkheads
was taken as the analysis extent even though the hull between two transverse web frames could
be taken as the extent. Could you explain the reason?
The three ships given as application examples take the longitudinally framing systems.
However, it would be more helpful to show the calculation results for a ship with a transversely
framing system like a bulk carrier, if any.
In 3rd line from the top of the right side at page 14, it would be better to insert ‘always’, i.e.,
does not always provide , since the stress-strain curve depends on how to approximate the real
material stress-strain relationship including the proportional limit.
Authors’ Closure
First of all, the authors are grateful for all the discussers who provided very constructive and
valuable discussions. The following are the authors’ reply to the discussions.
Our reply begins with the discussions of Dr. Collette regarding shakedown test of welding
residual stresses. While the research team under the responsibility of the first author is now in the
middle of the testing under lower loading with higher load cycles as well as under high loading
with fewer load cycles, some pieces of the latter being presented in the present paper, and we
will be pleased to present more detailed results in near future. We would expect that somewhat
different features of welding residual stress release depending on loading cycles may be seen.
Dr. Collete also raises a very important issue related to the effect of tempers. We would fully
agree with him that the effect of tempers in aluminum alloys is important in buckling collapse
behavior of aluminum structures as well as fatigue and fracture, and thus temper differences
must be accounted for in the strength assessment. For marine applications, H116 tempers are
usually taken for aluminum plates and sheets and T6 or H112 tempers are taken for stiffeners. In
the present paper, the effect of such temper differences were not taken into account in detail but
the stress-strain relations of material were developed by the Ramberg-Osgood formula with the
same knee factor with three parameters (i.e., yield stress, ultimate tensile stress and fracture
strain) known. We believe that this modeling technique is reasonable enough to represent the
material behavior with different tempers, but we would certainly agree that more detailed study
to clarify the effect of temper differences is recommended.
The first issue that Prof. Boon raised is of great importance. Even under pure vertical bending
moments, individual structural components can be subject to combined stresses such as
longitudinal stresses, transverse stresses and shear stresses which can of course affect the
progressive hull girder collapse behavior. This is more important for multi-hull ship structures
than mono-hull ship structures. This is a reason to be said why strength analysis of multi-hull
8
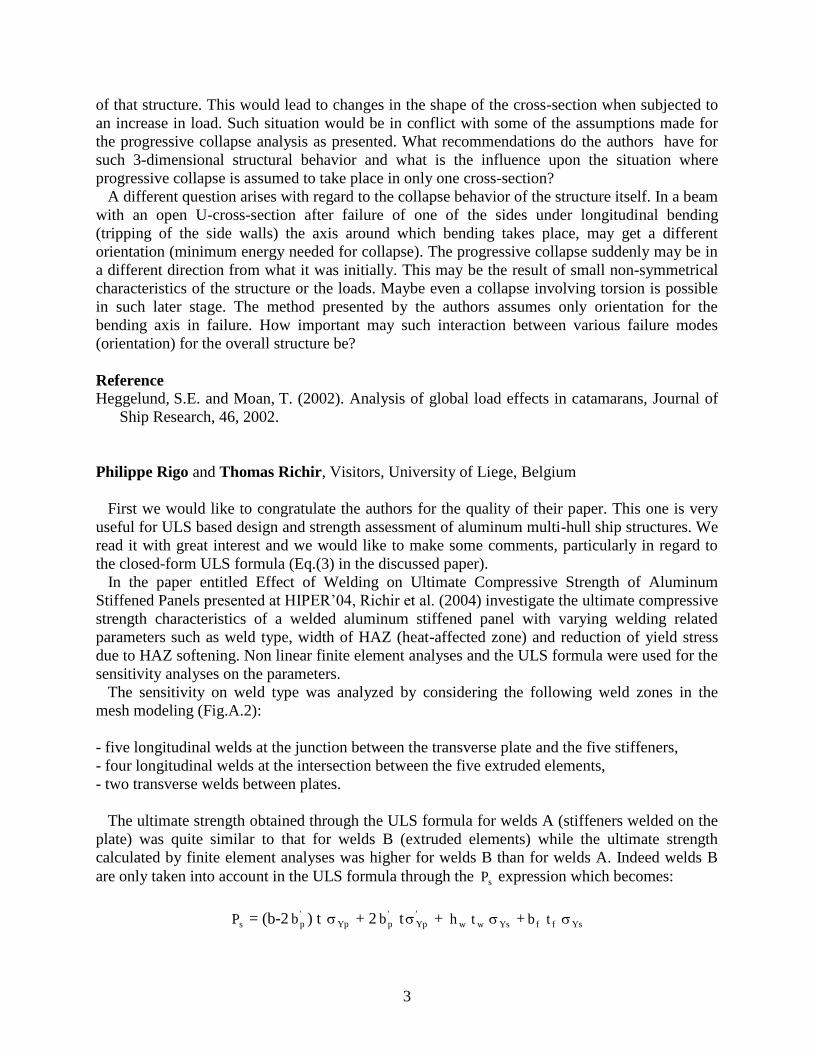
ship structures must be done in a three dimensional problem. In this regard, at least one cargo
hold between two transverse bulkheads or the full hull must be taken as the extent of the
progressive hull girder collapse analysis instead of one single segment model between two
transverse frames. Moreover, when combined hull girder actions including horizontal bending
and torsional moments as well as vertical bending are applied, the effect of combined stresses
will become much more complex and must be important so that the single hull section model
may not be acceptable. The research team under the responsibility of the first author is now in
the middle of developing such advanced approach which will eventually be implemented to
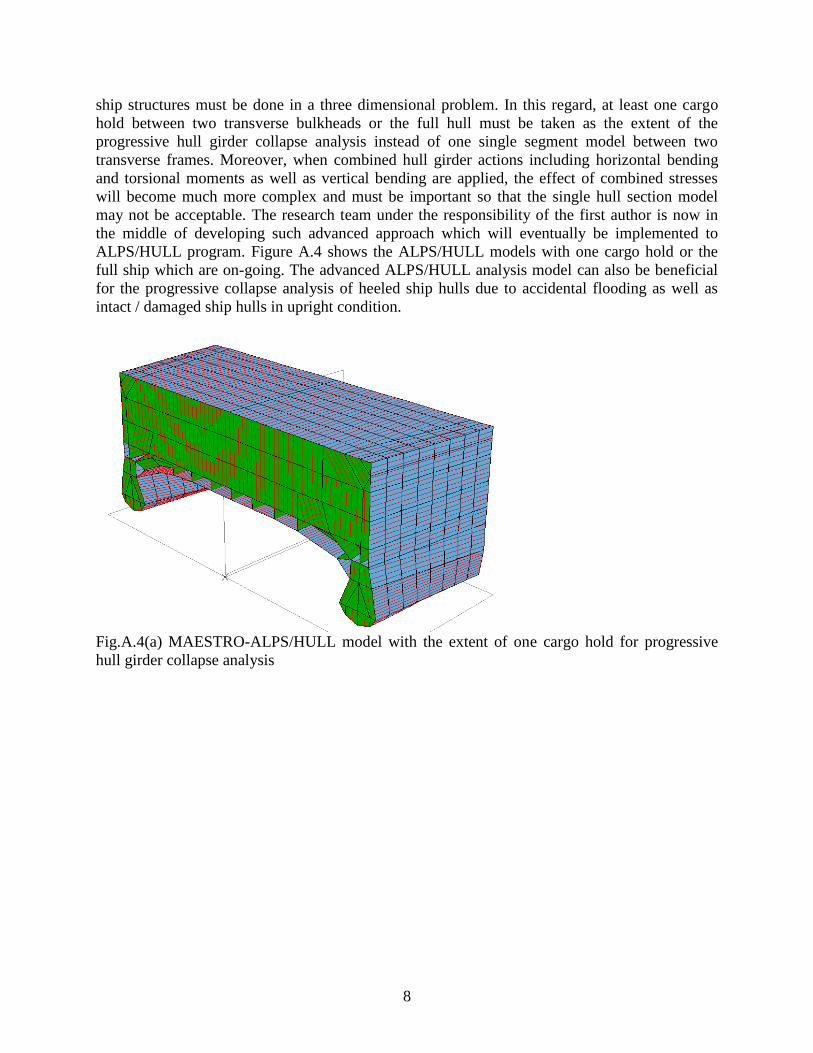
ALPS/HULL program. Figure A.4 shows the ALPS/HULL models with one cargo hold or the
full ship which are on-going. The advanced ALPS/HULL analysis model can also be beneficial
for the progressive collapse analysis of heeled ship hulls due to accidental flooding as well as
intact / damaged ship hulls in upright condition.
Fig.A.4(a) MAESTRO-ALPS/HULL model with the extent of one cargo hold for progressive
hull girder collapse analysis
9
Fig.A.4(b) MAESTRO-ALPS/HULL model with the full ship for progressive hull girder
collapse analysis
The second question of Prof. Boon is about non-symmetric failure patterns which can result in
non-symmetric cross section neutral axis with respect to the applied bending. The failure pattern
with regard to the center line of the vessel can be symmetric under pure vertical bending.
However, if other hull girder components such as horizontal bending or torsion are involved
and/or when non-symmetric damage exists, this hypothesis will not be valid any more. In some
scenarios, vessels can be heeled by unintended flooding due to structural damage. The failure
patterns and the related cross section neutral axis can again be non-symmetric. ALPS/HULL
program checks the failures of individual structural components at each incremental loading step,
and then both the horizontal cross section neutral axis for vertical bending moment component
and the vertical cross section neutral axis for horizontal bending moment component are updated
separately at each loading step. For a heeled vessel due to accidental flooding, ALPS/HULL
models the ship at the heeled condition so that the non-symmetric failure patterns under applied
hull girder actions can be accounted for automatically.
Regarding the first question of Prof. Rigo and Dr. Richir, the Paik ULS formula used in the
paper of Richir et al. (2004) or in the present paper adopts the concept of equivalent yield stress
which represents the effect of softening in the heat affected zones (HAZ) and/or the difference of
yield stresses in plate and stiffeners. Upon using simplified ULS formulations, the concept of
equivalent yield stress must be useful, as indicated in Eq.(3) together with Figs.23 and 24 in the
present paper or as follows
ffww
sYseq
tbthbt
P
In the above equation, the value of sP can be determined based on the HAZ locations and/or the
different yield stresses in plate and stiffener. The sP value presented in Eq.(3) of the present paper is
applicable for the Weld A type noted by the discussers, where fillet welding was applied along the
10
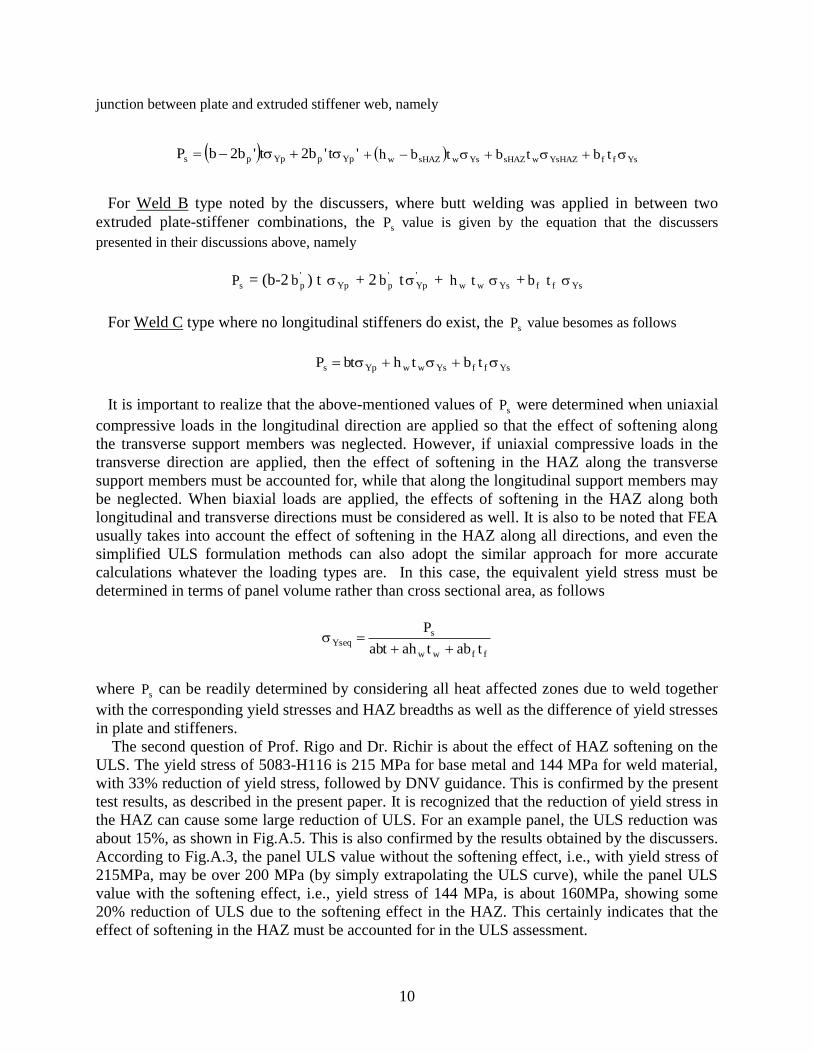
junction between plate and extruded stiffener web, namely
't'b2t'b2bP YppYpps YsffYsHAZwsHAZYswsHAZw tbtbtbh
For Weld B type noted by the discussers, where butt welding was applied in between two
extruded plate-stiffener combinations, the sP value is given by the equation that the discussers
presented in their discussions above, namely
sP = (b-2 'pb ) t Yp + 2 '
pb t 'Yp + wh wt Ys + fb ft Ys
For Weld C type where no longitudinal stiffeners do exist, the sP value besomes as follows
YsffYswwYps tbthbtP
It is important to realize that the above-mentioned values of sP were determined when uniaxial
compressive loads in the longitudinal direction are applied so that the effect of softening along
the transverse support members was neglected. However, if uniaxial compressive loads in the
transverse direction are applied, then the effect of softening in the HAZ along the transverse
support members must be accounted for, while that along the longitudinal support members may
be neglected. When biaxial loads are applied, the effects of softening in the HAZ along both
longitudinal and transverse directions must be considered as well. It is also to be noted that FEA
usually takes into account the effect of softening in the HAZ along all directions, and even the
simplified ULS formulation methods can also adopt the similar approach for more accurate
calculations whatever the loading types are. In this case, the equivalent yield stress must be
determined in terms of panel volume rather than cross sectional area, as follows
ffww
sYseq
tabtahabt
P
where sP can be readily determined by considering all heat affected zones due to weld together
with the corresponding yield stresses and HAZ breadths as well as the difference of yield stresses
in plate and stiffeners.
The second question of Prof. Rigo and Dr. Richir is about the effect of HAZ softening on the
ULS. The yield stress of 5083-H116 is 215 MPa for base metal and 144 MPa for weld material,
with 33% reduction of yield stress, followed by DNV guidance. This is confirmed by the present
test results, as described in the present paper. It is recognized that the reduction of yield stress in
the HAZ can cause some large reduction of ULS. For an example panel, the ULS reduction was
about 15%, as shown in Fig.A.5. This is also confirmed by the results obtained by the discussers.
According to Fig.A.3, the panel ULS value without the softening effect, i.e., with yield stress of
215MPa, may be over 200 MPa (by simply extrapolating the ULS curve), while the panel ULS
value with the softening effect, i.e., yield stress of 144 MPa, is about 160MPa, showing some
20% reduction of ULS due to the softening effect in the HAZ. This certainly indicates that the
effect of softening in the HAZ must be accounted for in the ULS assessment.

11
One important thing that must be pointed out is that the results quoted as Paik’s formula in
Fig.A.3 must have been obtained only for the Weld B type, because the sP value used by the
discussers for their ULS calculations was obtained by the equation of sP for the Weld B type as
noted above.
ID37ID37
xav/Y
xa
v/
Ye
q
5mm5mm
ThicknessThickness
50835083 60mm60mm
MaterialMaterial Web heightWeb height
5mm5mm
ThicknessThickness
50835083 60mm60mm
MaterialMaterial Web heightWeb height
1 bay PSC (Plate1 bay PSC (Plate--stiffener combination)stiffener combination)--model model
1 bay PSC (Plate1 bay PSC (Plate--stiffener combination)stiffener combination)--model considering HAZ softening model considering HAZ softening
1
2
0 0.2 0.4 0.6 0.8
0
0.1
0.2
0.3
0.4
1
2
Fig.A.5 Effect of HAZ softening on the ultimate strength behavior of aluminum stiffened panel
(yield stress of 5083-116 material in the HAZ is considered to 67% of the yield stress in its base
metal)
Regarding the discussion contributed by Mr. Arason, multi-hull ships are more beneficial than
mono-hulls in terms of larger deck areas specifically for military purpose. In terms of strength
and durability, the former may also be more appropriate than the latter when wave-induced loads
are considered. The wetted areas in the former are smaller than those in the latter. Transverse
bending actions in the former are usually smaller than those in the latter. It is to be noted that the
present test structures have been constructed by MIG welding, not by laser welding. For steel
structures, unlike aluminum structures, there is a large database for fabrication related initial
imperfections. While our test program is still on-going, our first insights with some limited test
results are that the average level of fabrication related initial imperfections (distortions and
welding residual stresses) for aluminum plate structures are in between slight and average level
of those for steel plated structures. In our FEA modeling, the effect of softening in the HAZ has
been included. The detailed information of initial imperfections applied for ALPS/HULL
progressive hull girder collapse analysis of the two steel hull sections has been presented in
separate publications as referred to in the list of references of the present paper. But we would
say that the effect of initial imperfections on the progressive hull girder collapse is significant.
For probabilistic design approach, we would agree that the uncertainties of various parameters
must be identified.
12
As Mr. Ton mentioned, aluminum structures are susceptible to fatigue cracking and the
knowledge of this issue is insufficient compared to steel structures, and further investigation of
fatigue and fracture of aluminum structures is much needed.
Regarding the first question by Prof. Vassalos and Dr. Zheng, our primary aim for the residual
stress shakedown test was to investigate the characteristics of welding residual stress release by
external loads rather than the difference of the two materials. We expected that the release
amount of welding residual stress with more load cycles may be more, but with the present
limited amount of test data, we were not able to reach any clear conclusion. As we discussed
above, we are continuing the shakedown test for various load levels and also more variety of
loading cycles. As far as the static or quasi-static limit state analysis is concerned, the
engineering stress-strain relation approach will be reasonable enough. This is because the limit
states are mostly reached when the strains are relatively small. However, when accidental actions
such as impact pressure, collisions or grounding are concerned, the strains can approach the
fracture strain of the material, and in this case the true stress-strain relations must be considered.
The present paper shows that the elastic-perfectly plastic model does not always provide
conservative results in terms of ULS predictions. This is in contrast to steel structures. The
reason may be due to the fact that the elastic-plastic behavior of material around the material
yield stress plays a role, while the elastic-perfectly plastic model neglects this. Therefore, it is
recommended that the real stress-strain relation of material must be applied for more refined
nonlinear analysis of aluminum structures. On the other hand, it is noted that the effect of
material modeling noted above is not significant in terms of ULS predictions, and thus the
elastic-perfectly plastic model can be adopted for practical design purposes even for aluminum
structures. The yield point of material can be taken at 0.2% offset point strain.
The 2-bay structure FEA model automatically accounts for the effect of rotational restraints
along the transverse frames. It is true that the 2-bay FEA model with free unloaded edges will
reflect less stiff configuration, while unloaded edges of most test structures are considered to be
simply supported and kept straight as actual continuous structures. It is important to realize that
different FEA modeling may lead to quite different or even wrong results. The closed-form ULS
formula presented in the paper is based on the FEA solutions, where more pessimistic conditions
are considered in terms of geometric properties and boundary conditions but using 2-bay plate-
stiffener combination models, and the effect of rotational restraints along the transverse frames is
taken into account. The last question by Prof. Vassalos and Dr. Zheng has been answered in the
reply to Prof. Boon. When the transverse frames are strong enough so that they do not fail prior
to longitudinal strength members, one sliced section model may give good enough solutions for
progressive hull girder collapse analysis. It is considered that this hypothesis can be adopted for
the two test hulls. In general, however, this hypothesis cannot be accepted. Also, when combined
hull girder loads together with local pressure actions are applied, at least one cargo hold must be
taken as the extent of progressive hull girder collapse analysis. ALPS/HULL can do this.
Regarding the question by Dr. Shin, the effect of lateral pressure loads on progressive hull
girder collapse analysis cannot be neglected in general and thus must be considered for the
analysis. While ALPS/HULL can deal with the effect of lateral pressure loads, the present paper
did not consider it because lateral pressure loads applied in the present catamaran ship hull is
small and it is thought that the effect of lateral pressure on the hull girder collapse is small. The
US Navy test hull has a unidirectional girder system, where no transverse frames exist in
between two transverse bulkheads. This is the reason why one cargo hold was taken as the extent

13
of the analysis. Various ALPS/HULL analysis examples for ship hulls with transverse framing
system have been published in separate publications by the first author and his students.
Finally, the authors again thank all discussers for their valuable contributions to the present
paper.

270
Trans. SNAME, Vol.113, The Society of Naval Architects and Marine Engineers, New Jersey, pp.270-305, 2005.
Ultimate Limit State Design Technology for Aluminum Multi-
Hull Ship Structures*
Jeom Kee Paik (M), Pusan National University, Korea, Owen F. Hughes (M), Virginia Tech, Blacksburg,
VA, Paul E. Hess III (M), Naval Surface Warfare Center, Carderock, MD, and Celine Renaud (V), Alcan
Marine, France
* Disclaimer: The opinions expressed herein are the views of the authors and are not necessarily those of the
Naval Surface Warfare Center or the Department of the U.S. Navy.
- A photo of an aluminum fast catamaran ship -
The present paper is a summary of recent research and developments related to some core ultimate
limit state (ULS) technologies for design and strength assessment of aluminum multi-hull ship
structures, jointly undertaken by Pusan National University, Virginia Tech, U.S. Naval Surface
Warfare Center and Alcan Marine. An extensive study on the subject has been undertaken by the
authors theoretically, numerically and experimentally. Methods to analyze hull girder loads / load
effects, stiffened panel ultimate strength and hull girder ultimate strength of aluminum multi-hull ship
structures are developed in the present study. Application examples of the methodologies for the ULS
structural design and strength assessment of a hypothetical 120m long all aluminum catamaran fast
ship structure are presented. Important insights and conclusions developed from the present study are
summarized. Some of the comparisons have shown that 5383 called Sealium (a patented Alcan Marine
alloy) is superior to the standard aluminum alloy 5083 in terms of material properties, ULS
characteristics and welding performance. It is our hope that the methods developed from the present
study will be useful for ULS design and strength assessment of aluminum multi-hull ship structures.

271
INTRODUCTION
The use of aluminum alloys in marine construction
has certainly obtained many benefits, particularly for
building weight-critical vessels such as fast ferries
and also for military purposes, as may be surmised
from Fig.1. This trend has in fact been more
increased by recent advances in materials science
which make it possible to produce higher strength
aluminum alloys for marine applications such as
5383 called Sealium (a patented Alcan Marine alloy)
in addition to the standard alloys such as 5083, 5456
and 5086.
Speed Speed
KnotsKnots
4040
3535
3030
2525
2020
25%25% 50%50% 75%75% 100%100%
Fast FerryFast Ferry CruiseCruise
FerryFerry
Fast Fast RoRoRoRo
LNG CarrierLNG Carrier
RoRoRoRo
ContainerContainer
Bulk CarrierBulk Carrier
TankerTanker
Deadweight/Deadweight/
DisplacementDisplacement00
Irrelevant AreaIrrelevant Area
AluminumAluminum
EHT SteelEHT Steel
HT SteelHT Steel
Material selection for different ship typesMaterial selection for different ship types
Fig.1 Material selection for different ship types, after
Moan (2004)
Multi-hull ships have advantages in terms of lower
resistance, excellent strength and durability and
greater deck space than monohull alternatives. In
smaller ships adequate deck area is difficult to obtain,
while in multi-hull ships the deck area is usually 1.25
- 2 times that of mono-hull ships. This is a great
advantage for military purposes.
The concept of catamaran-hull ships has now
dominated the commercial fast ferry market and is
making inroads into military applications. There is
also a trend that the size of multi-hull vessels is
increasing. The length of very recently developed
aluminum multi-hull ships is over 130m.
It is now well recognized that ultimate limit state
(ULS) approach is a much better basis for design and
strength assessment of structures than the allowable
working stress approach (Paik & Thayamballi 2003).
It is important to realize that the design procedure
for multi-hull ships is different from that for
monohull ships. For instance, designing multi-hull
ships is a totally 3-D problem, while 2-D
approximation is often adopted for design of
monohull ships. At present there is no method
available for the overall ULS analysis of multi-hull
ships. Since the Navy wants fast ships they will have
to be lightweight, meaning that local and overall
ultimate strength will be a crucial issue.
The aims of the present study are to develop
sophisticated technologies for ULS design and
strength assessment of aluminum large multi-hull
ships. For this purpose, some core technologies to
analyze hull girder loads / load effects, aluminum
stiffened panel ultimate strength and aluminum hull
girder ultimate strength of multi-hull ships are
developed.
It is commonly accepted that the collapse
characteristics of aluminum structures are similar to
those of steel structures until and after the ultimate
strength is reached, regardless of the differences
between them in terms of material properties.
However, it is also recognized that the ultimate
strength design formulae available for steel panels
may not be directly applied to aluminum panels even
though the corresponding material properties are
properly accounted for.
This is partly due to the fact that the stress versus
strain relationship of aluminum alloys is different
from that of structural steel. That is, the elastic-
plastic regime of material after the proportional limit
and the strain hardening plays a role in the collapse
behavior of aluminum structures, in contrast to steel
structures where the elastic-perfectly plastic material
model is well adopted. Also, the softening in the
heat-affected zone (HAZ) significantly affects the
ultimate strength behavior of aluminum structures,
whereas it can normally be neglected in steel
structures.
In the present study, refined methodologies and
related computer programs (installed in MAESTRO
and ALPS) for ULS assessment of aluminum multi-
hull ship structures are developed.
The MAESTRO program (2005) allows the
relatively quick creation of a whole-ship structural
model, in which the dimensions and structural
properties can be easily altered. The program
performs finite element stress analysis and ULS
based structural optimization. MAESTRO provides
a physics-based model, where all of the structural
members are automatically checked for structural
failure, for all load cases.
ALPS/ULSAP (2005) performs ULS assessment of
steel and aluminum stiffened panels and
ALPS/HULL (2005) performs the progressive
collapse analysis of steel or aluminum hulls under
any combination of hull girder loads such as vertical
bending, horizontal bending, shearing force and
torsion.
A series of physical model testing on collapse of
welded aluminum stiffened panels under axial
272
compressive loads was carried out with varying
geometrical dimensions (e.g., stiffener web height),
and aluminum alloy types (5083 and 5383). Initial
imperfections of the tested panels in the form of
initial deflection and welding residual stresses are
measured after fabrication and their characteristics
are reported. Based on the test results, the collapse
strength characteristics of welded aluminum
stiffened panels are investigated.
The ultimate strength characteristics of aluminum
plates and stiffened panels under a primary load
component, i.e., axial compressive loads, are
investigated through ANSYS elastic-plastic large
deflection finite element analyses with varying
geometric panel properties. A variety of different
FEA modeling techniques are compared in terms of
the resulting accuracy. Closed-form ultimate
compressive strength formulae for aluminum plates
and stiffened panels are derived by regression
analysis of the computed results as well as test data.
This paper also develops methods for the overall
ultimate strength analysis of multi-hull ships.
ALPS/HULL program based on ISUM (Idealized
Structural Unit Method) (Paik & Thayamballi 2003)
is employed for the progressive collapse analysis of
the ship hull.
The developed technologies are then applied to the
ULS assessment of high speed aluminum catamaran
ship structures. It is concluded that the developed
technologies are very useful for ULS based design
and strength assessment of aluminum multi-hull ship
structures.
ALLOWABLE WORKING STRESS DESIGN
VS ULTIMATE LIMIT STATE DESIGN
In design, any structure is required to have an
adequate margin of safety against demands, the
safety factor being necessary to account for various
uncertainties due to natural variability, inaccuracy in
procedures used for the evaluation and control of
loads or load effects (e.g., stress, deformation),
similar uncertainties in structural resistance
(capacity) and its determination, and also variations
in building procedures.
The structure should then satisfy the following
criterion, namely (Paik & Thayamballi 2003)
dd CD or safety measure = Cd / Dd > 1 (1)
where Dd = design demand, Cd = design capacity. A
‘demand’ is analogous to load, and a ‘capacity’ is
analogous to strength necessary to resist that load.
In the allowable working stress design approach,
the focus is on keeping the working stresses resulting
from the design loads under a certain working stress
level which is usually based on successful similar
past experience.
In the maritime industry, the value of the allowable
working stress is usually specified by regulatory
bodies or classification societies as some fraction of
the mechanical properties of materials (e.g., yield or
ultimate tensile strength).
For the allowable working stress design, Cd in
Eq.(1) is then determined based on the allowable
stress, while Dd is the working stress which can be
obtained by structural analysis under design loading
conditions.
In contrast to the allowable working stress design
approach, the ULS design is based on the explicit
consideration of the various conditions under which
the structure may cease to fulfill its intended function.
For the ULS design, Cd in Eq.(1) is now the ultimate
strength of the structure, while Dd is again the
working stresses or loads.
It is now well recognized that the ULS is a much
more rational basis than the allowable working stress,
because it can consider the various relevant modes of
failure directly until the ULS is reached.
The primary aim of the present study is to develop
sophisticated core technologies to determine Dd and
Cd in Eq.(1) to make ULS design and strength
assessment of aluminum multi-hull ship structures
possible.
A HYPOTHETICAL ALUMINUM
CATAMARAN FAST SHIP
A hypothetical all-aluminum catamaran ship has
been designed for use in the present study. Similar
ships are in use as fast commercial ferries and are
proposed for use as U.S. Navy’s Littoral Combat
Ships (LCS).
The principal dimensions of the ship are: LOA =
120 m, breadth = 32.8 m, overall depth =15.4 m,
depth of cross structure = 8.1 m. The displacement is
3500 tons and the design speed is about 35 knots.
The ship hull is made of 5383 aluminum alloy. The
scantling of structural components of this ship
including the plate panels and support members has
been determined by the criterion, Eq.(1) in terms of
design loads or load effects and the ultimate strength
calculated using the methods described in the present
study. The progressive collapse analysis of this ship
was performed by the ALPS/HULL program.

273
ANALYSIS OF HULL GIRDER LOADS AND
LOAD EFFECTS
The hull girder loads and load effects were
calculated using MAESTRO.
For this ship the twin hulls are wider than for a
SWATH, and the “cross deck structure” is very boxy
and rigid. Therefore the “prying” and “squeezing” of
the lower hulls is not a major load as it is in a
SWATH. Instead the major hull girder load is
longitudinal bending, the same as for a mono-hull.
The DNV High Speed and Light Craft (HSLC)
Rules (ship type: Patrol, unrestricted service) (DNV
2003) were used to define a worst possible loading
for longitudinal bending. Figure 2 shows the worst
sagging case, among others.
The wave is of maximum steepness in order to
position a crest at bow and stern, and there is a
simultaneous bow slam that causes a large dynamic
pressure on the sloping bow plating and the forward
end of the wet deck.
For any wave encounter, MAESTRO automatically
calculates the wave (Froude-Krylov) pressure
distribution on the hull. Then, for any specified
slamming pressure distribution, ship mass
distribution and ship heave and pitch accelerations, it
calculates an instantaneous dynamic equilibrium
position for the ship.
In this process the inertia force at any point (node)
in the model is the product of the local mass and the
total local acceleration due to heave and pitch. To
meet the HSLC Rule requirement we specified an
upwards vertical acceleration of 1.85 g (g =
acceleration of gravity) and a “bow down” pitching
acceleration of 0.3183 rad/sec2. This combination
caused the acceleration at the bow to be 2.95 g.
Figure 2 indicates the instantaneous dynamic
equilibrium position for the ship which has heaved
upwards 0.15 m above its (still-water) design
waterline and trimmed down by the bow 1.765
degrees. In this condition the sagging bending
moment is 532 MNm. The maximum hogging
bending moment is only 445 MNm because there is
no simultaneous slamming impact.
Fig.2 The worst sagging condition of the catamaran
ship considered
Fig.3 MAESTRO model for the starboard half of the
catamaran ship considered, together with the total
pressure applied
Fig.4 MAESTRO finite element model for analysis of
load effects (stresses) on the catamaran ship structure
In comparison, the DNV HSLC Rules, Part 3,
Chap.1, Sec.3, page 12, paragraph A503 (DNV
2003) gives 596 MNm for the maximum sagging
bending moment and 438 MNm for the maximum
hogging bending moment. These values are from the
1996 edition of the Rules. The formulas in paragraph
A503 are intended only for early stage design. In
paragraph A502 DNV recommends that the bending
moments should be calculated “based on a predicted
phasing between pitch/heave and the passage of a
meeting design wave, and is to include the pitch
angle and the inertia forces to be expected in the
hogging and sagging conditions.” This is exactly
how the present method using MAESTRO does the
calculation.
On the other hand, the hollow landing bending
moment from paragraph A303 is 863 MNm.
However, for large vessels the hollow landing and
crest landing scenarios are highly artificial and have
been shown (Hughes 1998) to give excessively large
predictions.
A “fish eye” view of the total pressure (slamming
plus Froude-Krylov) acting on the starboard half of
the model is shown in Fig.3. The slamming pressure
274
acts on the sloping bow plating (forward of the wet
deck) and has a maximum value of 0.06 MN/m2.
Figure 4 shows the MAESTRO finite element
model for analysis of load effects under the design
loading condition.
PHYSICAL MODEL TESTING ON COLLAPSE
OF WELDED ALUMINUM STIFFENED
PANELS
Test Panel Configuration
Extensive mechanical collapse testing on a total of
over 70 welded aluminum stiffened panels with
various types of stiffeners (flat bar, Tee bar, extruded
INCAT Tee bar), different geometries (plate/web
thickness, stiffener web height), and different
materials (5083, 5383) of plate and stiffeners are still
ongoing by the research group of the first author
with the support from some separate sponsors (Alcan
Marine, France, U.S. Office of Naval Research, and
Ship Structure Committee, USA) and will be
reported at a later time.
The present paper presents some preliminary test
results on a total of 10 welded aluminum panels
(with flat bar stiffeners) under axial compressive
loads, where the unloaded edges of the test panels
are free, while the other panels under testing are
simply supported at all edges which are kept straight.
The loaded edges are simply supported.
Figure 5 shows a schematic of the typical panels
being tested. The overall dimension of the panel is
1208 mm in length and 1000 mm in breadth. The
panel has four stiffeners, two at the unloaded edges
(sides) and two evenly spaced within the panel.
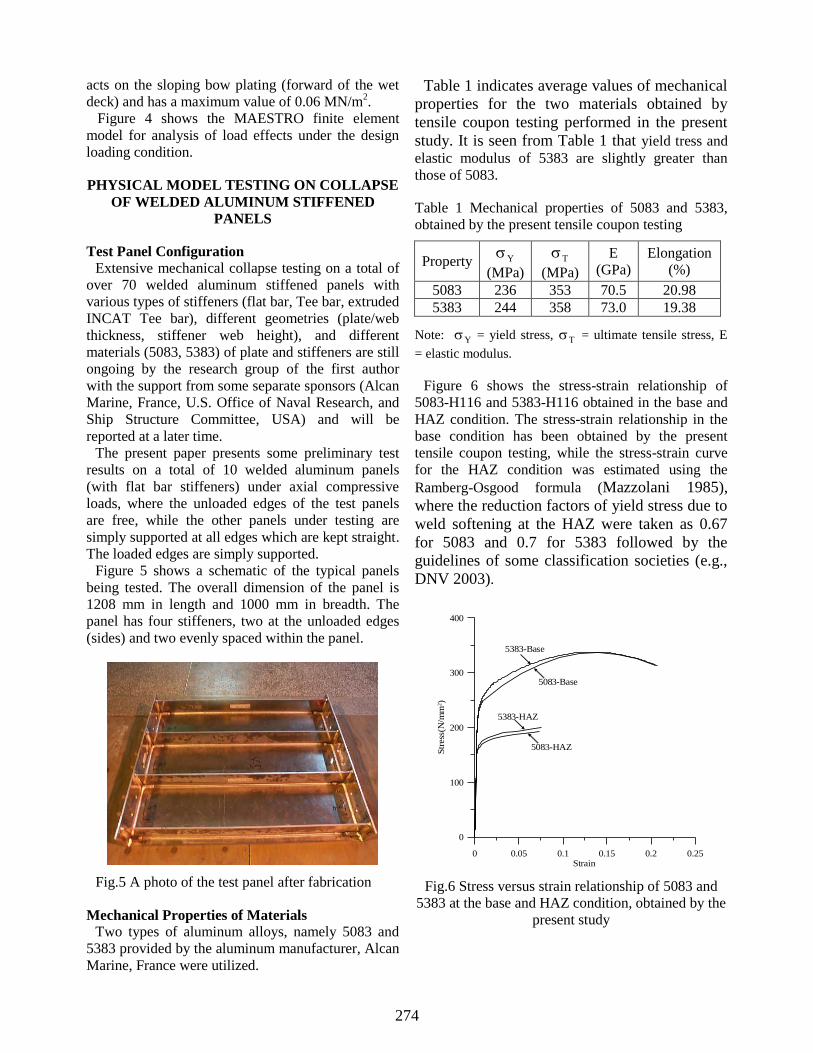
Fig.5 A photo of the test panel after fabrication
Mechanical Properties of Materials
Two types of aluminum alloys, namely 5083 and
5383 provided by the aluminum manufacturer, Alcan
Marine, France were utilized.
Table 1 indicates average values of mechanical
properties for the two materials obtained by
tensile coupon testing performed in the present
study. It is seen from Table 1 that yield tress and
elastic modulus of 5383 are slightly greater than
those of 5083.
Table 1 Mechanical properties of 5083 and 5383,
obtained by the present tensile coupon testing
Property Y
(MPa) T
(MPa)
E
(GPa)
Elongation
(%)
5083 236 353 70.5 20.98
5383 244 358 73.0 19.38
Note: Y = yield stress, T = ultimate tensile stress, E
= elastic modulus.
Figure 6 shows the stress-strain relationship of
5083-H116 and 5383-H116 obtained in the base and
HAZ condition. The stress-strain relationship in the
base condition has been obtained by the present
tensile coupon testing, while the stress-strain curve
for the HAZ condition was estimated using the
Ramberg-Osgood formula (Mazzolani 1985),
where the reduction factors of yield stress due to
weld softening at the HAZ were taken as 0.67
for 5083 and 0.7 for 5383 followed by the
guidelines of some classification societies (e.g.,
DNV 2003).
0 0.05 0.1 0.15 0.2 0.25Strain
0
100
200
300
400
Str
ess
(N/m
m2)
5383-Base
5083-Base
5383-HAZ
5083-HAZ
Fig.6 Stress versus strain relationship of 5083 and
5383 at the base and HAZ condition, obtained by the
present study
275
Vic
kers
hard
ness
Vic
kers
hard
ness
6565
7575
8585
9595
105105
2200 6644 101088 14141212 1616 1818 2020
Distance (mm)Distance (mm)
53835383
50835083
weldweld
Hardness Measurements Across Welds of 5083 and 5383Hardness Measurements Across Welds of 5083 and 5383
Vic
kers
hard
ness
Vic
kers
hard
ness
6565
7575
8585
9595
105105
2200 6644 101088 14141212 1616 1818 2020
Distance (mm)Distance (mm)
53835383
50835083
weldweld
Hardness Measurements Across Welds of 5083 and 5383Hardness Measurements Across Welds of 5083 and 5383
Fig.7 Vickers hardness of 5083 and 5383 at the weld
and base location, after Raynaud (1995)
Weig
ht
loss (
g/c
mW
eig
ht
loss (
g/c
m22))
0.50.5
3030
Exposure time at 100Exposure time at 100ººCC in daysin days
25252020151510105500
1.01.0
1.51.5
2.02.0
2.52.5
3.03.0
53835383
50835083
Weight Losses After Acid AttackWeight Losses After Acid Attack
Weig
ht
loss (
g/c
mW
eig
ht
loss (
g/c
m22))
0.50.5
3030
Exposure time at 100Exposure time at 100ººCC in daysin days
25252020151510105500
1.01.0
1.51.5
2.02.0
2.52.5
3.03.0
53835383
50835083
Weight Losses After Acid AttackWeight Losses After Acid Attack
Fig.8 Weight loss of 5083 and 5383 exposed to acid
attack, after Raynaud (1995)
It is to be noted that the minimum mechanical
properties of the aluminum base metal specified by
European Standard (EN 13195-1 2002) is Y (yield
stress) = 215 N/mm2 for 5083-H116 and 220 N/mm
2
for 5383-H116. Also, the reduced yield stress 'Y in
the heat-affected zone (HAZ) is defined by some
classification societies (e.g., DNV 2003) as 'Y =
144 N/mm2 for 5083-H116 and '
Y =154 N/mm2 for
5383-H116.
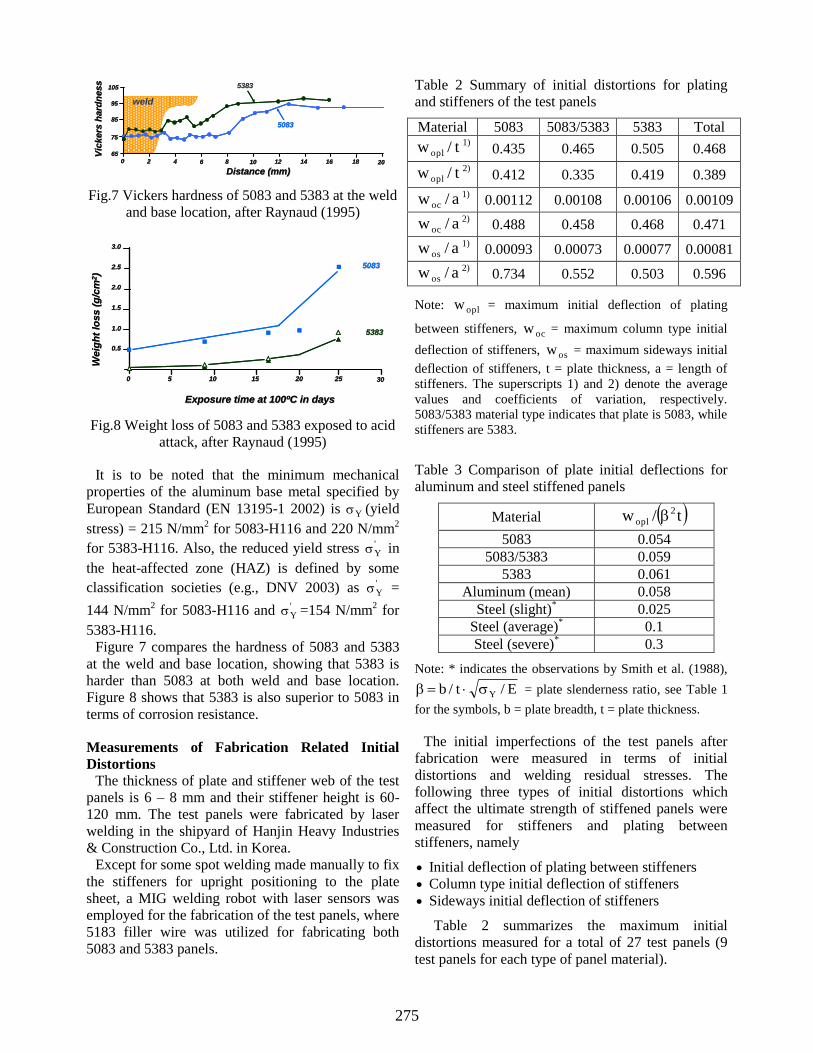
Figure 7 compares the hardness of 5083 and 5383
at the weld and base location, showing that 5383 is
harder than 5083 at both weld and base location.
Figure 8 shows that 5383 is also superior to 5083 in
terms of corrosion resistance.
Measurements of Fabrication Related Initial
Distortions
The thickness of plate and stiffener web of the test
panels is 6 – 8 mm and their stiffener height is 60-
120 mm. The test panels were fabricated by laser
welding in the shipyard of Hanjin Heavy Industries
& Construction Co., Ltd. in Korea.
Except for some spot welding made manually to fix
the stiffeners for upright positioning to the plate
sheet, a MIG welding robot with laser sensors was
employed for the fabrication of the test panels, where
5183 filler wire was utilized for fabricating both
5083 and 5383 panels.
Table 2 Summary of initial distortions for plating
and stiffeners of the test panels
Material 5083 5083/5383 5383 Total
t/w opl
1) 0.435 0.465 0.505 0.468
t/w opl
2) 0.412 0.335 0.419 0.389
a/w oc
1) 0.00112 0.00108 0.00106 0.00109
a/w oc
2) 0.488 0.458 0.468 0.471
a/w os
1) 0.00093 0.00073 0.00077 0.00081
a/w os
2) 0.734 0.552 0.503 0.596
Note: oplw = maximum initial deflection of plating
between stiffeners, ocw = maximum column type initial
deflection of stiffeners, osw = maximum sideways initial
deflection of stiffeners, t = plate thickness, a = length of
stiffeners. The superscripts 1) and 2) denote the average
values and coefficients of variation, respectively.
5083/5383 material type indicates that plate is 5083, while
stiffeners are 5383.
Table 3 Comparison of plate initial deflections for
aluminum and steel stiffened panels
Material t/w 2
opl
5083 0.054
5083/5383 0.059
5383 0.061
Aluminum (mean) 0.058
Steel (slight)* 0.025
Steel (average)* 0.1
Steel (severe)* 0.3
Note: * indicates the observations by Smith et al. (1988),
E/t/b Y = plate slenderness ratio, see Table 1
for the symbols, b = plate breadth, t = plate thickness.
The initial imperfections of the test panels after
fabrication were measured in terms of initial
distortions and welding residual stresses. The
following three types of initial distortions which
affect the ultimate strength of stiffened panels were
measured for stiffeners and plating between
stiffeners, namely
Initial deflection of plating between stiffeners Column type initial deflection of stiffeners
Sideways initial deflection of stiffeners
Table 2 summarizes the maximum initial
distortions measured for a total of 27 test panels (9
test panels for each type of panel material).

276
Table 3 compares the maximum initial deflection
of plating for aluminum alloy and steel panels, the
latter being based on the insights developed by Smith
et al. (1988). It is observed that the plate initial
deflection of aluminum panel is in between slight
and average level of steel plate initial deflection.
Further study results observed for all of the test
panels (76 panels) will be reported at a later time.
While the column type initial deflection of
stiffeners shall be an important parameter in the
column type collapse mode of the stiffened panel,
while the sideways initial deflection of stiffeners
more likely affects the lateral-torsional buckling or
tripping failure mode of the stiffened panel.
Figure 9 shows selected measurements of initial
deflections of plating and stiffeners. Figure 10 shows
some other types of plate initial deflection shape
between stiffeners observed from the present test
panels. It is seen from Fig.10 that the plate initial
deflection shape resembles the so-called “hungry
horse” which is typical in plating of steel ship
structures.
Fig.9(a) A typical pattern of overall initial
deflections (multiplied by 30 times)
0
1
0
1
0
1
wo/w
opl
wo/w
opl
wo/w
opl
(a) y = 750mm, wopl/t = 0.359
(c) y = 150mm, wopl/t = 0.294
(b) y = 450mm, wopl/t = 0.425
1200mm
xx
1200mm
xx
1200mm
xx
Fig.9(b) Plate initial deflection pattern
0
1
0
1
0
1
0
1
wo/w
oc
wo/w
oc
wo/w
oc
wo/w
oc
1200mm
1200mm
1200mm
1200mm
(a) y = 900mm, woc/a =0.00159
(b) y = 600mm, woc/a = 0.00128
(c) y = 300mm, woc/a = 0.00122
(d) y = 0mm, woc/a = 0.00102
xx
xx
xx
xx
Fig.9(c) Column type initial deflection pattern of
stiffeners
0
1
0
1
0
1
wo/
wos
wo/
wos
wo/
wos
wo/
wos
(a) y = 900mm, wos/a =0.00042
(b) y = 600mm, wos/a = 0.00077
(c) y = 300mm, wos/a = 0.00109
(d) y = 0mm, wos/a = 0.00043
1200mm
1200mm
1200mm
1200mm
xx
xx
xx
xx
0
1
Fig.9(d) Sideways initial deflection pattern of
stiffeners
Some typical initial deflection patterns in aluminum plating Some typical initial deflection patterns in aluminum plating
between stiffeners in the long (plate length) directionbetween stiffeners in the long (plate length) direction
1
0a/2a/2 aa
1
0a/2a/2 aa
(a) Initial deflection shape #1(a) Initial deflection shape #1
(b) Initial deflection shape #2(b) Initial deflection shape #2
1
0a/2a/2 aa
(d) Initial deflection shape #4(d) Initial deflection shape #4
WW0
0
//WW
0p
l0
pl
WW0
0
//WW
0p
l0
pl
WW0
0
//WW
0p
l0
pl
1
0a/2a/2 aa
(c) Initial deflection shape #3(c) Initial deflection shape #3
WW0
0
//WW
0p
l0
pl
1
0a/2a/2 aa
1
0a/2a/2 aa
(a) Initial deflection shape #1(a) Initial deflection shape #1
(b) Initial deflection shape #2(b) Initial deflection shape #2
1
0a/2a/2 aa
(d) Initial deflection shape #4(d) Initial deflection shape #4
WW0
0
//WW
0p
l0
pl
WW0
0
//WW
0p
l0
pl
WW0
0
//WW
0p
l0
pl
1
0a/2a/2 aa
(c) Initial deflection shape #3(c) Initial deflection shape #3
WW0
0
//WW
0p
l0
pl
Fig.10 Some selected shapes of plate initial
deflection between stiffeners

277
-100 0 100 200 300 400
-50
0
50
100
150
200
b (mm)
Str
ess
(Mp
a)
rcx = -28.44N/mm2
rtx = 158.12Mpa
: Idealized
: Measured
: Compressive stress
b = 300mm
t = 8mm
hw = 120mm
tw = 8mm
bt = 22.87mm
Material : Al.5083
: Tensile stress
bt
Y = 236MPa
bt bt bt
Fig.11(a) Welding residual stress distribution at plating between stiffeners for 5083 aluminum alloy panel
measured after fabrication
0 30 60 90 120
-50
0
50
100
150
200
hw (mm)
rcx = -19.31N/mm2
rtx = 158.12N/mm2
: Idealized
: Measured
: Compressive stress
b = 300mm
t = 8mm
hw = 120mm
tw = 8mm
bt = 13.06mm
Material : Al.5083
: Tensile stress
bt
Y = 236N/mm2
Str
ess
(N/m
m2)
Fig.11(b) Welding residual stress distribution at stiffener web for 5083 aluminum alloy panel measured after
fabrication
278
-100 0 100 200 300 400
-50
0
50
100
150
200
b (mm)
Str
ess
(Mpa)
rcx = -29.65N/mm2
rtx = 170.8N/mm2
: Idealized
: Measured
: Compressive stress
b = 300mm
t = 8mm
hw = 120mm
tw = 8mm
bt = 22.19mm
Material : Al.5383
: Tensile stress
bt
Y = 244MPa
bt bt bt
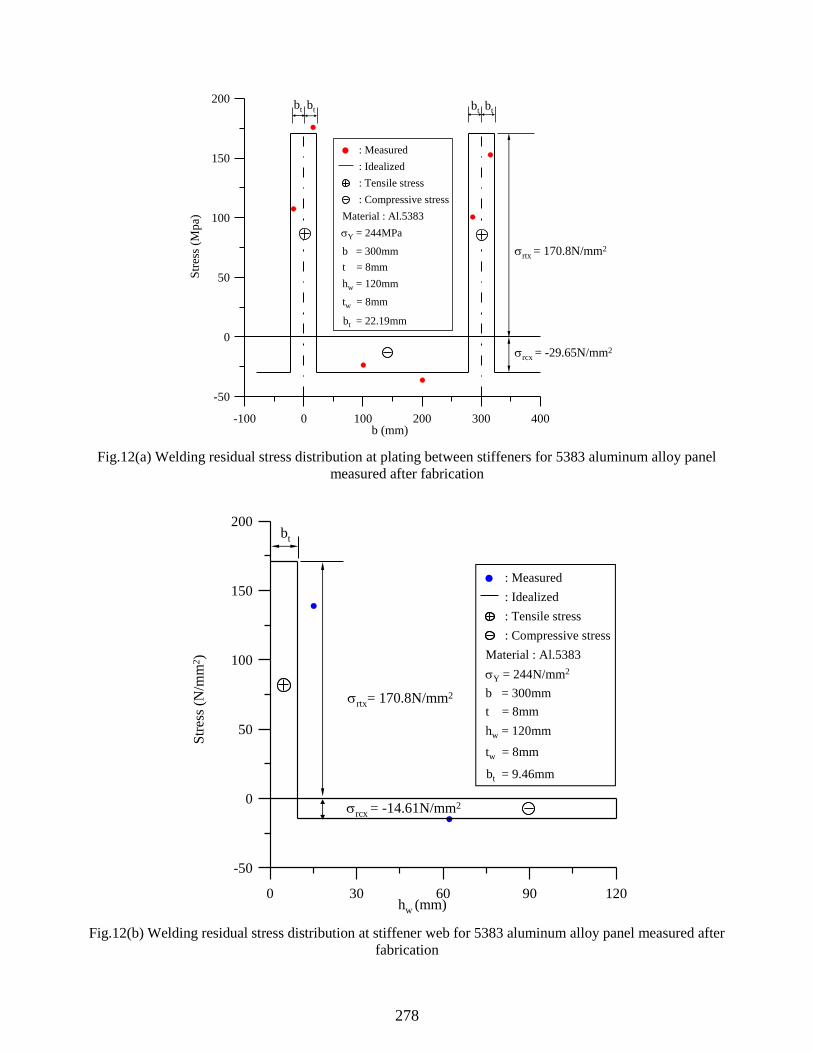
Fig.12(a) Welding residual stress distribution at plating between stiffeners for 5383 aluminum alloy panel
measured after fabrication
0 30 60 90 120
-50
0
50
100
150
200
rcx = -14.61N/mm2
rtx= 170.8N/mm2
: Idealized
: Measured
: Compressive stress
Y = 244N/mm2
b = 300mm
t = 8mm
hw = 120mm
tw = 8mm
bt = 9.46mm
Material : Al.5383
: Tensile stress
bt
hw (mm)
Str
ess
(N/m
m2)
Fig.12(b) Welding residual stress distribution at stiffener web for 5383 aluminum alloy panel measured after
fabrication

279
Measurements of Fabrication Related Residual
Stresses
The residual stress distribution and magnitude in
both plating (between stiffeners) and stiffener web
were measured by the technique of drilling a hole.
Figures 11 and 12 show selected measurements of
welding residual stress distribution for 5083 and
5383 panels, respectively. Table 4 is a summary of
welding residual stress measurements at plating and
stiffener web for 5083 and 5383 panels. The
compressive residual stresses at aluminum plating
were 12% of the material yield stress. It is worth
noting that this is similar to an average level (15% of
yield stress) of welding residual stresses in steel
plates (Smith et al. 1988).
It is usually considered that the welding residual
stress distribution of aluminum stiffened panels can
be idealized like that of steel stiffened panels, where
the residual stress distribution is composed of tensile
residual stress block and compressive residual stress
block.
Table 4 Summary of welding residual stress
measurements for 5083 and 5383 panels (with 8mm-
thick plate and 120mm-web height)
Residual
stress
5083 5383
Plate Web Plate Web
Yrtx / 0.67 0.67 0.7 0.7
Yrcx / 0.12 0.08 0.12 0.06
HAZb (mm) 22.87 13.06 22.19 9.46
Note: rtx = tensile residual stress (positive), rcx =
compressive residual stress (negative), HAZb = breadth of
the tensile residual stress block equivalent to the HAZ.
The tensile residual stress block with the breadth
tb is considered to be equivalent to the softening
area in the HAZ. Table 4 confirms that the extent of
the weld softening zone typically taken from the
popular “1-in.” rule (Kontoleon et al. 2000) is
available for the plate between stiffeners.
Shakedown of Welding Residual Stresses Under
Cyclic Loading
It has been said that welding induced residual
stresses may be released to some extent after cyclic
loading of the structures while in service. To
examine this phenomenon quantitatively, some
physical model tests were performed in the present
study.
Two butt-welded 8mm-thick aluminum plate strips
as shown in Fig.13, one for 5083 and the other for
5383 are tested. The test strip was also fabricated by
the same welding machine of Hanjin Heavy
Industries & Construction, Co., Ltd. Filler wire for
welding is 5183 aluminum alloy.
A 3-point cyclic bending test was undertaken; a
line load at the plate strip center was cyclically
applied to generate sagging and hogging in the plate
strip, as shown in Fig.14.
The maximum deflection of the plate strip after
loading was about 9mm, which is equivalent to the
maximum bending stress of about 208.4 N/mm2 at
the strip surface, meaning that the strip behaves
within the elastic regime.
For the 5083 test strip, a total of 3 cyclic loads (i.e.,
3 times for sagging and 3 times for hogging) was
applied by turn, while a total of 5 cyclic loads was
applied for the 5383 test strip.
Application of different loading cycles was
considered to examine possible relaxation
characteristics of welding residual stresses due to the
number of loading cycles.
600mm
b =
30
0m
m
Fig.13 A butt-welded 8mm-thick plate strip
Cyclic Load
400mm 100mm100mm
Cyclic Load
400mm 100mm100mm
t
Fig.14 A 3-point cyclic bending test set-up on the
butt-welded plate strip
The welding residual stresses were measured
before and after the bending cycles using the same
method noted in the previous section. Figure 15
shows the measurements of the residual stresses
before and after the bending cycles.

280
The welding residual stresses have indeed been
noticeably reduced after the load cycles. For
compressive residual stresses which affect the plate
buckling, the reduction ratio was by about 36% for
the 5083 plate with 3 load cycles and by about 33%
for the 5383 plate with 5 load cycles. For the tensile
residual stresses, the reduction ratio was smaller than
that for the compressive residual stresses, i.e., 21%
for the 5083 plate and 7.6% for the 5383 plate.
While pending further study, it is confirmed that
in-service cyclic loading can result in some distinct
reduction in welding induced residual stresses.
Measured:
Before loading
After loading
Idealized:
Before loading
After loading
32.8 mm
27.2 mm
150 mm 150 mm
15
6.8
N/m
m2
Al. 5083 Y = 236 N/mm2
15
.6 N
/mm
2
19
8.6
N/m
m2
24
.4 N
/mm
2
Fig.15(a) Welding residual stress distribution of the 5083 butt-welded plate strip before and after 3 cycles of
3-point bending
Measured :
Before loading
After loading
Idealized :
Before loading
After loading
33.6 mm
25.2 mm
150 mm 150 mm
18
8.2
N/m
m2
Al. 5383 Y = 244 N/mm2
17
.2 N
/mm
2
20
3.5
N/m
m2
25
.6 N
/mm
2
Fig.15(b) Welding residual stress distribution of the 5383 butt-welded plate strip before and after 5 cycles of
3-point bending
281
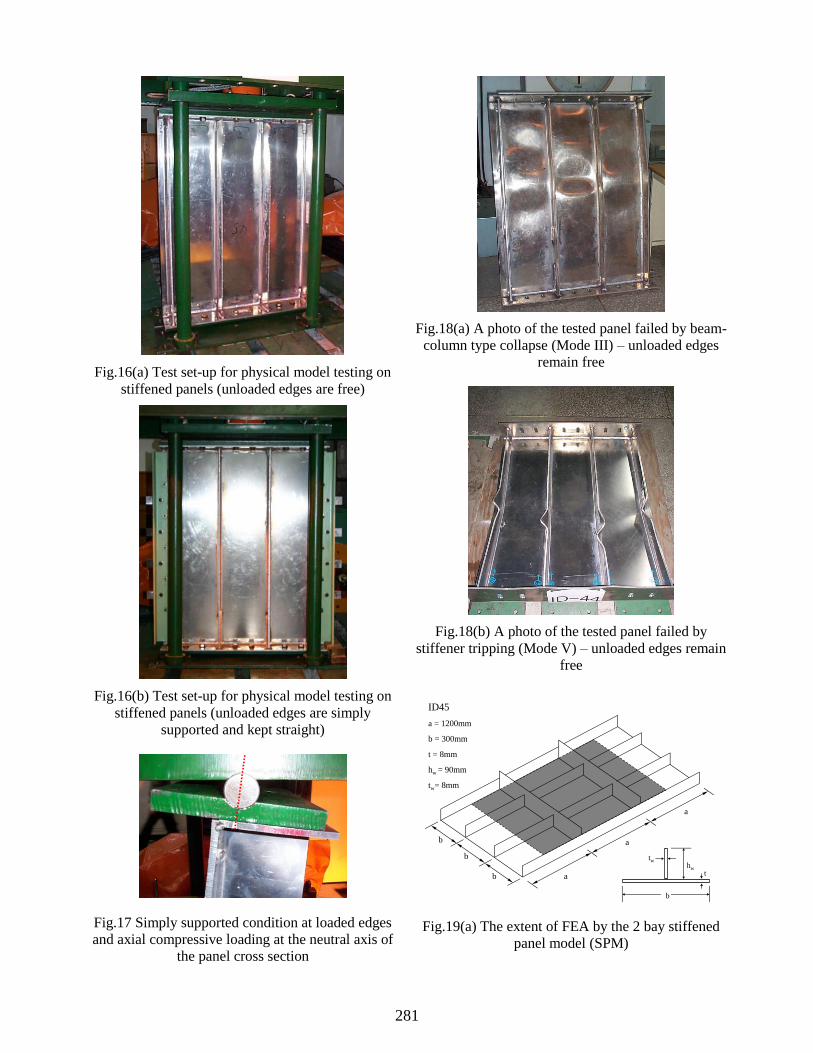
Fig.16(a) Test set-up for physical model testing on
stiffened panels (unloaded edges are free)
Fig.16(b) Test set-up for physical model testing on
stiffened panels (unloaded edges are simply
supported and kept straight)
Fig.17 Simply supported condition at loaded edges
and axial compressive loading at the neutral axis of
the panel cross section
Fig.18(a) A photo of the tested panel failed by beam-
column type collapse (Mode III) – unloaded edges
remain free
Fig.18(b) A photo of the tested panel failed by
stiffener tripping (Mode V) – unloaded edges remain
free
b
hwt
tw
ID45
a = 1200mm
b = 300mm
t = 8mm
hw = 90mm
tw= 8mm
a
a
a
b
b
b
Fig.19(a) The extent of FEA by the 2 bay stiffened
panel model (SPM)
282
a
a
a
b
b
b
b
hwt
tw
ID45
a = 1200mm
b = 300mm
t = 8mm
hw = 90mm
tw= 8mm
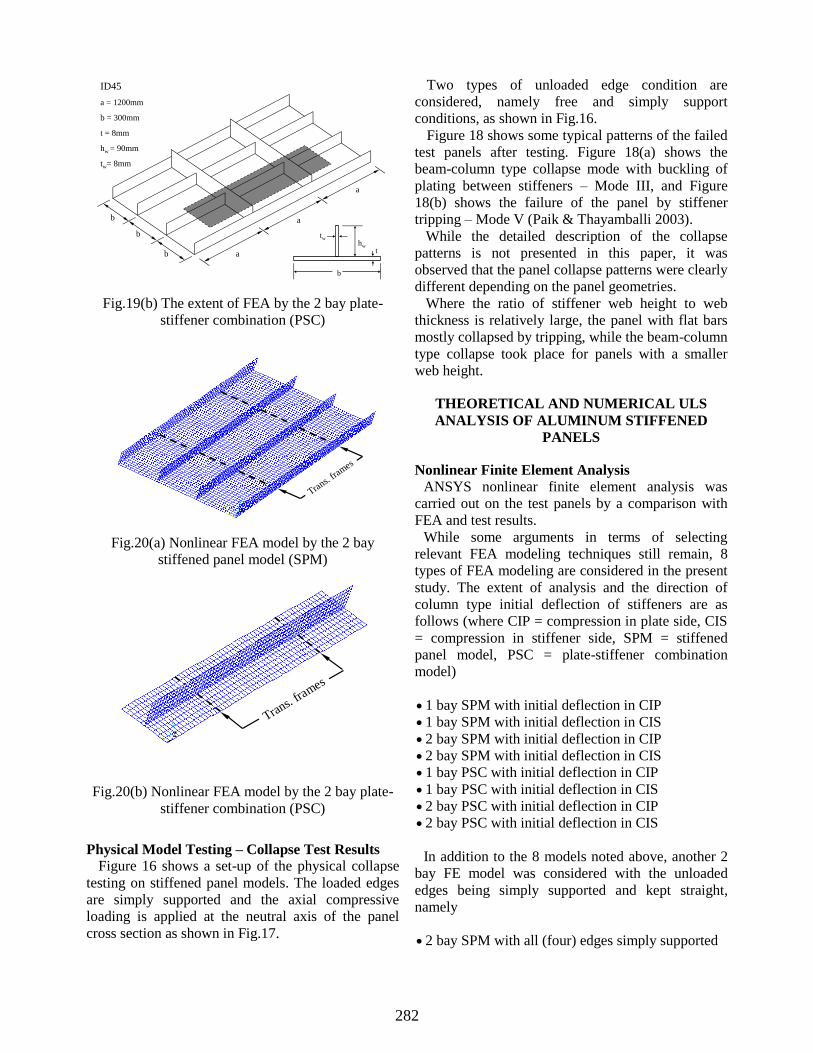
Fig.19(b) The extent of FEA by the 2 bay plate-
stiffener combination (PSC)
Trans.
frames
Fig.20(a) Nonlinear FEA model by the 2 bay
stiffened panel model (SPM)
Trans.
frames
Fig.20(b) Nonlinear FEA model by the 2 bay plate-
stiffener combination (PSC)
Physical Model Testing – Collapse Test Results
Figure 16 shows a set-up of the physical collapse
testing on stiffened panel models. The loaded edges
are simply supported and the axial compressive
loading is applied at the neutral axis of the panel
cross section as shown in Fig.17.
Two types of unloaded edge condition are
considered, namely free and simply support
conditions, as shown in Fig.16.
Figure 18 shows some typical patterns of the failed
test panels after testing. Figure 18(a) shows the
beam-column type collapse mode with buckling of
plating between stiffeners – Mode III, and Figure
18(b) shows the failure of the panel by stiffener
tripping – Mode V (Paik & Thayamballi 2003).
While the detailed description of the collapse
patterns is not presented in this paper, it was
observed that the panel collapse patterns were clearly
different depending on the panel geometries.
Where the ratio of stiffener web height to web
thickness is relatively large, the panel with flat bars
mostly collapsed by tripping, while the beam-column
type collapse took place for panels with a smaller
web height.
THEORETICAL AND NUMERICAL ULS
ANALYSIS OF ALUMINUM STIFFENED
PANELS
Nonlinear Finite Element Analysis
ANSYS nonlinear finite element analysis was
carried out on the test panels by a comparison with
FEA and test results.
While some arguments in terms of selecting
relevant FEA modeling techniques still remain, 8
types of FEA modeling are considered in the present
study. The extent of analysis and the direction of
column type initial deflection of stiffeners are as
follows (where CIP = compression in plate side, CIS
= compression in stiffener side, SPM = stiffened
panel model, PSC = plate-stiffener combination
model)
1 bay SPM with initial deflection in CIP
1 bay SPM with initial deflection in CIS
2 bay SPM with initial deflection in CIP 2 bay SPM with initial deflection in CIS 1 bay PSC with initial deflection in CIP
1 bay PSC with initial deflection in CIS
2 bay PSC with initial deflection in CIP
2 bay PSC with initial deflection in CIS
In addition to the 8 models noted above, another 2
bay FE model was considered with the unloaded
edges being simply supported and kept straight,
namely
2 bay SPM with all (four) edges simply supported

283
While the test panels are primarily a 1 bay system,
i.e., considering the longitudinally stiffened panels
between two transverse frames, a 2 bay system
including transverse frames as shown in Fig.19 is
also considered in the present FEA to reflect the
continuity support condition along the transverse
frames in a continuous plate structure.
All of the 1 bay models are analyzed using load
control, while the 2 bay models are loaded using
displacement control, because of easier application
of the load with regard to the neutral axis at the panel
cross section.
After some convergence studies, the FE mesh size
adopted has one plate-shell element representing the
HAZ at plating and at the stiffener web, ten plate-
shell elements represent the plating between
stiffeners, and six elements model stiffener web,
including the elements at the HAZ. Figure 20 shows
nonlinear FEA models by the 2 bay SPM or PSC.
The softening in the HAZ is considered in the FEA,
where the reduced yield stress ratio in the HAZ is set
by the guidance of classification societies, i.e., 0.67
for 5083 and 0.7 for 5383. The welding induced
residual stresses are also considered in the FEA with
the measured values.
0 0.02 0.04 0.06 0.08 0.1
0
100
200
300
400
Real stress-strain curve
Bilinear approximation with Eh/E = 0.0
Bilinear approximation with Eh/E = 0.05
Str
ess
(N/m
m2)
strain
1
3
2
1
2
3
Fig.21(a) Three types of material stress-strain
relation modeling
While some details of the nonlinear FEA in terms
of FE meshing and material stress-strain relation
idealization may be found from Paik & Duran (2004),
Figure 21 shows the modeling effects of material
stress-strain relationship on the aluminum panel
ultimate strength behavior, where three different
models including real stress-strain curve usage. The
same characteristics of HAZ softening were
considered in this comparison.
It is seen from Figs.21(b) and 21(c) that the elastic-
perfectly plastic material model neglecting the strain-
hardening effect does not provide more conservative
results than the case of the real material properties.
0 0.001 0.002 0.003 0.004 0.005
0
50
100
150
200 ID63
Str
ess
(N/m
m2)
strain
8mm
thickness
5383 120mm
material web height
8mm
thickness
5383 120mm
material web height
123
Real stress-strain curve
Bilinear approximation with Eh/E = 0.0
Bilinear approximation with Eh/E = 0.05
12
3
Fig.21(b) Effect of material stress-strain relation
models on the aluminum panel ultimate strength
behavior obtained by 1 bay PSC FEA with stiffener
column type initial deflection in CIP
0 0.001 0.002 0.003 0.004
0
40
80
120
160
200
1
Str
ess
(N/m
m2)
strain
ID63
8mm
thickness
5383 120mm
material web height
8mm
thickness
5383 120mm
material web height
3
2
Real stress-strain curve
Bilinear approximation with Eh/E = 0.0
Bilinear approximation with Eh/E = 0.05
1
2
3
Fig.21(c) Effect of material stress-strain relation
models on the aluminum panel ultimate strength
behavior obtained by 2 bay SPM FEA with stiffener
column type initial deflection in CIS
This is in contrast to steel plated structures where
the elastic-perfectly plastic material approximation
always gives lower ultimate strength estimates than
the case with real material stress-strain relationship.
This is because the elastic-plastic regime of material
after the proportional limit (before the yield point)
plays a role in the collapse behavior of aluminum
structures unlike steel structures where it can be
neglected.

284
For practical fast ULS calculations of aluminum
structures, however, it is considered that the elastic-
perfectly plastic material approximation neglecting
the elastic-plastic effect after the proportional limit
(before the yield point) and also the strain-hardening
effect (after the yield point) may be acceptable as for
steel structures as long as the softening effect in the
HAZ is accounted for, i.e., by considering the
reduced yield stress in the HAZ.
Figure 22 compares FEA solutions obtained by the
9 types of FE modeling noted above together with
test data for two selected test panels.
It is to be noted in Fig.22 that all FEA except for
No. 10 were undertaken considering that the
unloaded edges are free as in the actual testing, while
No.10 considers the unloaded edges (as well as the
loaded edges) as simply supported and kept straight.
The reason why the in-plane stiffness of the panel
obtained by the test is slightly greater than that by
the FEA is due that the former involves the real
pattern of initial distortions with the so-called hungry
horse shape, while the latter presumes the buckling
mode initial deflection of plating for convenience of
FE modeling. The buckling mode initial deflection
shape reduces in-plane stiffness compared to the
hungry horse shape (Paik et al. 2004a).
In the testing, the test panel ID 40 collapsed by
column type collapse (Mode III) and ID 63 collapsed
by stiffener tripping (Mode V).
As would be expected, it is evident that the
direction of column type initial deflection of the
stiffener significantly affects the FE solutions.
It is seen that the 2 bay FEA always gives a larger
ULS than 1 bay FEA. This is because the 2 bay FEA
involves the rotational restraint effects along the
transverse frames in the continuous plate structures.
It is to be noted that the different FE modeling
approaches give quite different solutions. It is of
vital importance to correctly reflect all of the
influential parameters in the FE modeling in this
regard.
It is important to recognize that the direction of
column type initial deflections of stiffeners, among
other factors, may significantly affect the ultimate
strength behavior when the magnitude of initial
deflections is substantially large.
It is evident that the type and extent of model in the
FE analysis must be determined carefully. The
elastic-perfectly plastic material approximation for
the analysis of welded aluminum structures may not
always give conservative results unlike for steel
structures.
Since softening in the HAZ plays a significant role
on the welded aluminum plate structures, it must be
carefully dealt with as well. These aspects definitely
make the aluminum panel ULS evaluation works
cumbersome. ALPS/ULSAP and closed-form
formulations will be useful alternatives for quick
ULS estimates of aluminum stiffened panels as well
as steel panels in this regard.
ALPS/ULSAP Program
ALPS/ULSAP program (ALPS/ULSAP 2005)
performs ULS assessment of steel or aluminum
stiffened panels using a semi-analytical method. The
detailed theory of ALPS/ULSAP may be found from
Paik & Thayamballi (2003).
The main features of the ALPS/ULSAP program
include (Paik & Seo 2005):
ULS assessment of unstiffened plates, uni-axially
stiffened panels and cross-stiffened panels.
Six types of collapse modes, namely overall
collapse (Mode I), biaxially compressive collapse
(Mode II), beam-column type collapse (Mode III),
stiffener web buckling (Mode IV), stiffener
tripping (Mode V) and gross yielding (Mode VI).
Any combination of load components, namely
longitudinal axial compression or tension,
transverse axial compression or tension, edge
shear, longitudinal in-plane bending, transverse in-
plane bending and lateral pressure can be applied.
Either steel or aluminum alloy material can be
dealt with, considering the softening effect in the
heat affected zone (HAZ) caused by welding.
Initial imperfections in the form of initial
deflections and welding residual stresses are dealt
with as parameters of influence.
Elastic-perfectly plastic material model is applied.
Various types of structural degradation such as
corrosion wastage (general or pitting), fatigue
cracking and local denting are dealt with as
parameters of influence.
Impact pressure action arising from sloshing,
slamming and green water can be analyzed for
providing permanent set in terms of panel
deflection.
ALPS/ULSAP can be used in three ways: within
MAESTRO to automatically evaluate ULS of all of
the panels in a MAESTRO ship model, within
MAESTRO to evaluate ULS of a single panel that is
defined through MAESTRO’s graphical menus, and
as a standalone program to evaluate ULS of a single
panel that is defined through a set of Visual Basic
graphical menus.

285
0 0.4 0.8 1.2
0
0.1
0.2
0.3
0.4
0.5ID40
xav/Y
x
av/
Yse
q6mm
thickness
5083 60mm
material web height
6mm
thickness
5083 60mm
material web height
Experiment, collapse mode III (CIP)
1 bay FEA(SPM), collapse mode III (CIP), column type initial deflection with CIP
1 bay FEA(SPM), collapse mode III (CIP), column type initial deflection with CIS
2 bay FEA(SPM), collapse mode III (CIP), column type initial deflection with CIP
2 bay FEA(SPM), collapse mode V (CIS), column type initial deflection with CIS
1 bay FEA(PSC), collapse mode III (CIP), column type initial deflection with CIP
1 bay FEA(PSC), collapse mode III (CIP), column type initial deflection with CIS
2 bay FEA(PSC), collapse mode III (CIP), column type initial deflection with CIP
2 bay FEA(PSC), collapse mode V (CIS), column type initial deflection with CIS
2 bay FEA(SPM), collapse mode III (CIP), column type initial deflection with CIP
(All edges simply supported keeping them straight)
Note: CIP = compression in plate side, CIS = compression in stiffener side
1
2
3
4
5
1
2
3
4
5
6
7
8
9
6
8
9
7
10
10
Fig.22(a) Comparison of FEA solutions as those obtained by 9 types of FE modeling together with test data
for a 5083 panel with 6mm-thick and 60mm-web height ( xav = average axial stress, Yseq = yield stress,
xav = average axial strain, Y = Yseq /E, E = elastic modulus)

286
0 0.4 0.8 1.2 1.6
0
0.2
0.4
0.6
0.8ID63
8mm
thickness
5383 120mm
material web height
8mm
thickness
5383 120mm
material web height
1
2
3
4
5
8
7
9
6 10
xav/Y
Experiment, collapse mode V (CIS)
1 bay FEA(SPM), collapse mode III (CIP), column type initial deflection with CIP
1 bay FEA(SPM), collapse mode V (CIS), column type initial deflection with CIS
2 bay FEA(SPM), collapse mode III (CIP), column type initial deflection with CIP
2 bay FEA(SPM), collapse mode V (CIS), column type initial deflection with CIS
1 bay FEA(PSC), collapse mode III (CIP), column type initial deflection with CIP
1 bay FEA(PSC), collapse mode V (CIS), column type initial deflection with CIS
2 bay FEA(PSC), collapse mode III (CIP), column type initial deflection with CIP
2 bay FEA(PSC), collapse mode V (CIS), column type initial deflection with CIS
2 bay FEA(SPM), collapse mode V (CIS), column type initial deflection with CIS
(All edges simply supported keeping them straight)
Note: CIP = compression in plate side, CIS = compression in stiffener side
1
2
3
4
5
6
7
8
9
10
x
av/
Yse
q
Fig.22(b) Comparison of FEA solutions as those obtained by 9 types of FE modeling together with test data
for a 5383 panel with 8mm-thick and 120mm-web height ( xav = average axial stress, Yseq = yield stress,
xav = average axial strain, Y = Yseq /E, E = elastic modulus)

287
Closed-form ULS Design Formulations
Closed-form design formulations are often very
useful for a first cut estimate of the panel ULS and
also they are needed to do risk or reliability
assessment which requires repetitive calculations to
identify the uncertain characteristics of the problem.
In the present study, empirical formulae were
developed by curve-fitting of the ANSYS
computations and available test data (Paik & Duran
2004, Paik et al. 2004b).
b
a
bp'
t~
bp'
Fig.23 Softening zones inside a welded aluminum
plate
b
bs'
bf
tf
hw
t
tw
bp' bp'
Fig.24 Cross section of the plate-stiffener
combination with softening zones
For welded aluminum plates simply supported at
all (four) edges and under axial compressive loads,
the ultimate strength formula developed by the
authors is as follows
2.2'for81.0'083.0
2.2'46.0for1.1'215.0
46.0'for0.1
'Yp
xu (2)
where E
'
t
b'
Yp ,
ab
P'
p
Yp ,
Ypppp 'b2b'b2aP
''b'b2b'ab2 Yppp ,
a = plate length, b = plate breadth, b'P = breadth of
softening in HAZ (heat affected zone), see Fig.23,
σ'Y = yield stress in HAZ, σYp = yield stress of the
plate in base metal.
In Equation (2), β' takes into account the effect of
softening in the HAZ in terms of the plate volume or
surface.
Equation (2) implicitly considers an average level
of initial deflection (e.g., wopl = 0.009b), while the
effect of welding residual stress is not accounted for.
For aluminum stiffened panels simply supported at
all (four) edges and under axial compressive loads
when they are modeled by a plate-stiffener
combination as representing the panel, the following
ultimate strength formula was derived by the authors
for three levels of initial deflections [For symbols not
defined below, see Eq.(2)].
45
2
4
2
3
2
21
Yseq
xu
'C'C'C'CC
'
2
Yseq
'
'
(3)
where, E
'
r
a'
Yseq
,
ffww
sYseq
tbthbt
P
,
't'b2t'b2bP YppYpps
YsffYsHAZwsHAZYswsHAZw tbtbtbh ,
σYs = yield stress of stiffener,
b'P, b'S, = breadths of HAZ softening in plating and
stiffener web, see Fig.24, bf = breadth of stiffener
flange, tf = thickness of stiffener flange, hw = height
of stiffener web, tw = thickness of stiffener web, r =
√(I / A) = radius of gyration, I = moment of inertia of
stiffener with attached plating, A = cross-sectional
area of stiffener with attached plating.
In Eq.(3), the coefficients C1 – C5 are defined
depending on the level of initial deflections of
plating and stiffeners, as indicated in Table 5.
It is noted that Eqs.(2) and (3) do not account for
welding residual stress effect, while the effects of
initial deflections and softening in HAZ are taken
into account.
When the welding residual stresses exist in the
panel, the formulations must then be corrected to
account for their effect. A knock-down factor
approach may be applied, by multiplying rR defined
by
Yeq
req
r 1R
(4)
where req = equivalent compressive residual stress,
Yeq = equivalent yield stress.
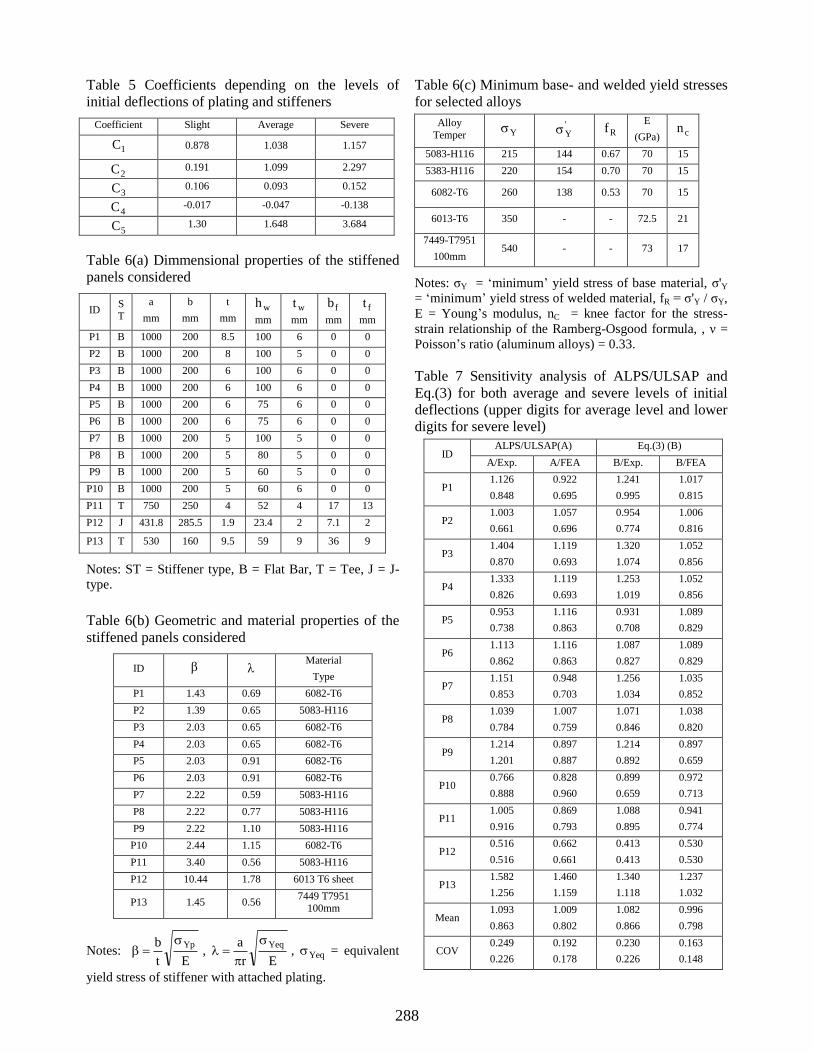
288
Table 5 Coefficients depending on the levels of
initial deflections of plating and stiffeners
Coefficient Slight Average Severe
1C 0.878 1.038 1.157
2C 0.191 1.099 2.297
3C 0.106 0.093 0.152
4C -0.017 -0.047 -0.138
5C 1.30 1.648 3.684
Table 6(a) Dimmensional properties of the stiffened
panels considered
ID S
T
a
mm
b
mm
t
mm wh
mm
wt
mm
fb
mm
ft
mm
P1 B 1000 200 8.5 100 6 0 0
P2 B 1000 200 8 100 5 0 0
P3 B 1000 200 6 100 6 0 0
P4 B 1000 200 6 100 6 0 0
P5 B 1000 200 6 75 6 0 0
P6 B 1000 200 6 75 6 0 0
P7 B 1000 200 5 100 5 0 0
P8 B 1000 200 5 80 5 0 0
P9 B 1000 200 5 60 5 0 0
P10 B 1000 200 5 60 6 0 0
P11 T 750 250 4 52 4 17 13
P12 J 431.8 285.5 1.9 23.4 2 7.1 2
P13 T 530 160 9.5 59 9 36 9
Notes: ST = Stiffener type, B = Flat Bar, T = Tee, J = J-
type.
Table 6(b) Geometric and material properties of the
stiffened panels considered
ID Material
Type
P1 1.43 0.69 6082-T6
P2 1.39 0.65 5083-H116
P3 2.03 0.65 6082-T6
P4 2.03 0.65 6082-T6
P5 2.03 0.91 6082-T6
P6 2.03 0.91 6082-T6
P7 2.22 0.59 5083-H116
P8 2.22 0.77 5083-H116
P9 2.22 1.10 5083-H116
P10 2.44 1.15 6082-T6
P11 3.40 0.56 5083-H116
P12 10.44 1.78 6013 T6 sheet
P13 1.45 0.56 7449 T7951
100mm
Notes: Et
b Yp ,
Er
a Yeq
, Yeq = equivalent
yield stress of stiffener with attached plating.
Table 6(c) Minimum base- and welded yield stresses
for selected alloys
Alloy
Temper Y 'Y Rf
E
(GPa) cn
5083-H116 215 144 0.67 70 15
5383-H116 220 154 0.70 70 15
6082-T6 260 138 0.53 70 15
6013-T6 350 - - 72.5 21
7449-T7951
100mm 540 - - 73 17
Notes: σY = ‘minimum’ yield stress of base material, σ'Y
= ‘minimum’ yield stress of welded material, fR = σ'Y / σY,
E = Young’s modulus, nC = knee factor for the stress-
strain relationship of the Ramberg-Osgood formula, , ν =
Poisson’s ratio (aluminum alloys) = 0.33.
Table 7 Sensitivity analysis of ALPS/ULSAP and
Eq.(3) for both average and severe levels of initial
deflections (upper digits for average level and lower
digits for severe level)
ID ALPS/ULSAP(A) Eq.(3) (B)
A/Exp. A/FEA B/Exp. B/FEA
P1 1.126
0.848
0.922
0.695
1.241
0.995
1.017
0.815
P2 1.003
0.661
1.057
0.696
0.954
0.774
1.006
0.816
P3 1.404
0.870
1.119
0.693
1.320
1.074
1.052
0.856
P4 1.333
0.826
1.119
0.693
1.253
1.019
1.052
0.856
P5 0.953
0.738
1.116
0.863
0.931
0.708
1.089
0.829
P6 1.113
0.862
1.116
0.863
1.087
0.827
1.089
0.829
P7 1.151
0.853
0.948
0.703
1.256
1.034
1.035
0.852
P8 1.039
0.784
1.007
0.759
1.071
0.846
1.038
0.820
P9 1.214
1.201
0.897
0.887
1.214
0.892
0.897
0.659
P10 0.766
0.888
0.828
0.960
0.899
0.659
0.972
0.713
P11 1.005
0.916
0.869
0.793
1.088
0.895
0.941
0.774
P12 0.516
0.516
0.662
0.661
0.413
0.413
0.530
0.530
P13 1.582
1.256
1.460
1.159
1.340
1.118
1.237
1.032
Mean 1.093
0.863
1.009
0.802
1.082
0.866
0.996
0.798
COV 0.249
0.226
0.192
0.178
0.230
0.226
0.163
0.148

289
b
bb
bB a
a
a
L
Fig.25 Nomenclature: a stiffened panel
As previously discussed, the residual stresses in
aluminum structures can be released to some extent
after time in service.
A comparison of Eq.(3) with ALPS/ULSAP, FEA
and existing test data was undertaken for a number
of 13 aluminum stiffened panels under axial
compressive loads as indicated in Fig.25 and Table 6
(Paik et al. 2004b). Table 7 shows the results of the
present sensitivity analysis.
Discussions
Based on some observations obtained from the
present study on ULS of aluminum stiffened panels,
the following conclusions can be drawn:
It is evident that the nonlinear elastic-plastic large
deflection FEA can give quite different ULS
solutions depending on the difference of structural
modeling as would be expected. If FE structural
modeling does not properly reflect in terms of
reflecting the reality in association with boundary
conditions and initial imperfections as well as
geometric / material properties and loading
application, then the FEA may give wrong results for
the ultimate strength behavior, and thus one should
be careful in this regard.
FEA solutions are significantly affected by the
direction of column type initial deflections of
stiffeners as well as their amplitude, among other
factors. For instance, the direction of column type
initial deflection of stiffeners, e.g., compression in
plate side (CIP) or compression in stiffener side
(CIS) can govern the direction of panel buckling
deflection, leading to a different collapse pattern. By considering the continuity of stiffened panels
in a continuous plate structure and the related
rotational restraints along transverse frames, 2 bay
FEA modeling is recommended.
It is seen that the elastic-perfectly plastic material
model may not give conservative ULS solutions but
its effect is small. For practical purposes, therefore,
the stress-strain relationship of aluminum alloy can
be approximated by the elastic-perfectly plastic
model.
The effect of softening in the HAZ is very
significant on the ultimate strength behavior of
aluminum panels. Therefore, the reduced yield stress
in the HAZ must be considered for FEA or other
analytical approaches.
The ULS solutions obtained by ALPS/ULSAP
which apply the elastic-perfectly plastic material
model together with the softening effect in the HAZ
are in reasonably good agreement with nonlinear
FEA and experimental results.
PROGRESSIVE COLLAPSE ANALYSIS OF
THE ALUMINUM CATAMARAN FAST SHIP
HULL
ALPS/HULL Program
The ALPS/HULL program (ALPS/HULL 2005)
performs the progressive collapse analysis of ship
hulls until and after the ultimate strength is reached.
The main features of the program include (Paik &
Thayamballi 2003, Paik 2004, Paik & Seo 2005):
Progressive collapse analysis of ship hulls until
and after the ultimate limit state is reached,
using simplified nonlinear finite element method
(idealized structural unit method).
Any combination of hull girder load components,
namely vertical bending, horizontal bending,
sectional shear and torsion can be applied.
All possible failure modes of structural
components such as overall buckling collapse,
column type collapse, stiffener web buckling,
tripping (lateral-torsional buckling) and gross
yielding are considered.
Either steel or aluminum alloy ship hulls can be
dealt with, considering the softening effect
in the heat affected zone caused by welding.
Initial deflections and welding residual stresses are
dealt with as parameters of influence. Various types of structural degradation, e.g.,
corrosion wastage (general or pitting), fatigue
cracking
and local denting are dealt with as parameters of
influence.
Structural modeling is undertaken using the
MAESTRO modeler. In addition to numerical results the stress
distribution, failure mode and vertical bending
versus curvature curve can be displayed
graphically.

290
ALPS/HULL employs ALPS/ULSAP as a major
module for the ULS evaluation of plate panels or
support members.
While a ship hull can be idealized as an assembly
of various types of structural units such as plates,
stiffened panels, support members or plate-stiffener
combinations for ALPS/HULL application, as those
shown in Fig.26, it is recognized that it is better to
model the ship hull as an assembly of plate-stiffener
separation units rather than plate-stiffener
combination units or stiffened panel units.
It is to be noted that ALPS/HULL progressively
evaluates the ULS of individual structural
components as functions of combined stresses
applied by hull girder actions. Under pure vertical
bending, for instance, side shell panels or bottom
girder plates are subjected to edge shear stresses or
inner bottom panels are subjected to transverse axial
stress, although they may be predominantly
subjected to longitudinal bending stresses.
ALPS/HULL accounts for the effects of all stress
components in the failure and stiffness assessment of
individual structural components.
Applicability of ALPS/HULL Program – Frigate
Hull Tested by UK Royal Navy
While experimental results on aluminum ship hulls
are not found in the literature, several existing
mechanical collapse test data for steel ship hulls
under vertical bending moments have been adopted
by the authors for the validation of ALPS/HULL
progressive collapse analysis program (ALPS/HULL
2005). The U.K. Royal Navy performed the collapse
testing on a 1/3 scale steel frigate hull model under
sagging bending moment (Dow 1991). The test
results for the frigate hull model are now compared
with ALPS/HULL solutions.
For the frigate test hull, a slice of the hull section
between two transverse frames was taken as the
extent of analysis. All hull sections are located at
maximum applied bending moment.
Figures 27(a) to 27(c) show the distributions of
axial stresses, von Mises stresses and collapse modes
of structural components at ULS of the frigate test
hull under sagging or hogging condition, obtained by
ALPS/HULL. The computing time required by a
laptop computer with Pentium (M) processor was
about 5 sec.
It is evident from Fig.27(b) that the plate elements
of the hull are subjected to transverse axial stress and
shear stress as well as longitudinal stress even under
vertical bending alone. It is observed from Fig.27(c)
that buckling collapse took place at the deck panels
and gross yielding occurred at bottom panels until
the ULS is reached, while the mid-height part of the
hull still remains intact. It is confirmed from
Fig.27(d) that ALPS/HULL progressive analysis is
in very good agreement with the experimental results
for the frigate test ship hull.
Applicability of ALPS/HULL Program – Double
Skin Tanker Hull Tested by NSWCCD
The Naval Surface Warfare Center, Carderock
Division (NSWCCD), USA (Bruchman 2000)
performed collapse testing on a steel double-skin
tanker model with a uni-directional girder system
under both sagging and hogging conditions. The
progressive collapse analysis results by ULTSTR
program (Bruchman 2000) were also compared with
the test data.
For ALPS/HULL progressive collapse analysis, the
test hull is modeled as an assembly of plate units.
The full hull between two transverse bulkheads is
taken as the extent of ALPS/HULL analysis.
Figures 28(a) to 28(c) show the distributions of
axial stresses, von Mises stresses and collapse modes
of structural components for the double-skin tanker
test hull under sagging or hogging.
Again, it is apparent from Fig.28(b) that the plate
elements of the hull are subjected to transverse axial
stress and shear stress as well as longitudinal axial
stress even under vertical bending alone. It is seen
from Fig.28(c) that until ULS is reached under the
sagging condition buckling collapse took place at the
upper part, while gross yielding occurred at the
lower part. No elements remain intact, in contrast to
typical ship hulls which are composed of stiffened
panels together with support members. It is
interesting to note that this type of unique hull girder
system is very efficient and advantageous in terms of
expecting a full contribution of all plate elements
against the hull girder collapse process.
It is confirmed from Fig.28(d) that ALPS/HULL
and ULTSTR analyses are in reasonably good
agreement with the experimental results.
Progressive Collapse Analysis of the Aluminum
Catamaran Fast Ship Hull under Vertical
Bending
Based on the verification examples noted above, it
is considered that the ALPS/HULL program is useful
for the progressive collapse analysis of aluminum
ship hulls as well as steel ship hulls; ALPS/ULSAP
is employed as a main module of ALPS/HULL for
ULS assessment of aluminum or steel structural
components considering possible softening effect in
the HAZ, and its applicability has been verified.
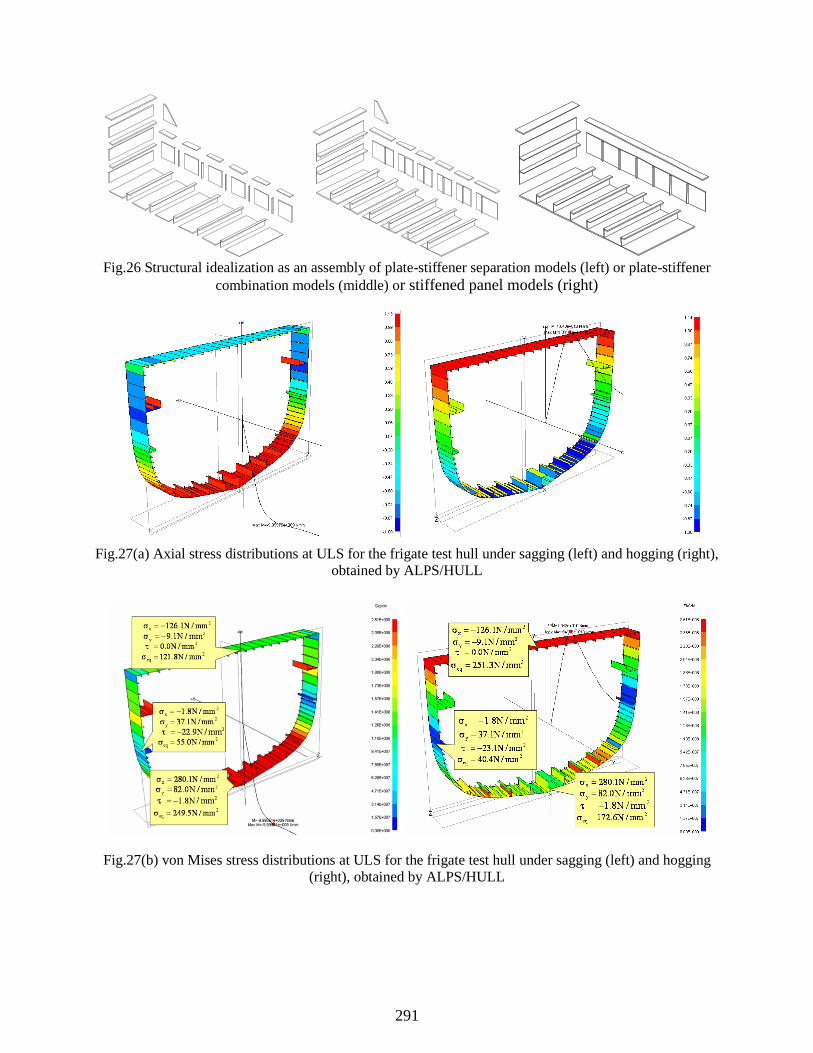
291
Fig.26 Structural idealization as an assembly of plate-stiffener separation models (left) or plate-stiffener
combination models (middle) or stiffened panel models (right)
Fig.27(a) Axial stress distributions at ULS for the frigate test hull under sagging (left) and hogging (right),
obtained by ALPS/HULL
Fig.27(b) von Mises stress distributions at ULS for the frigate test hull under sagging (left) and hogging
(right), obtained by ALPS/HULL
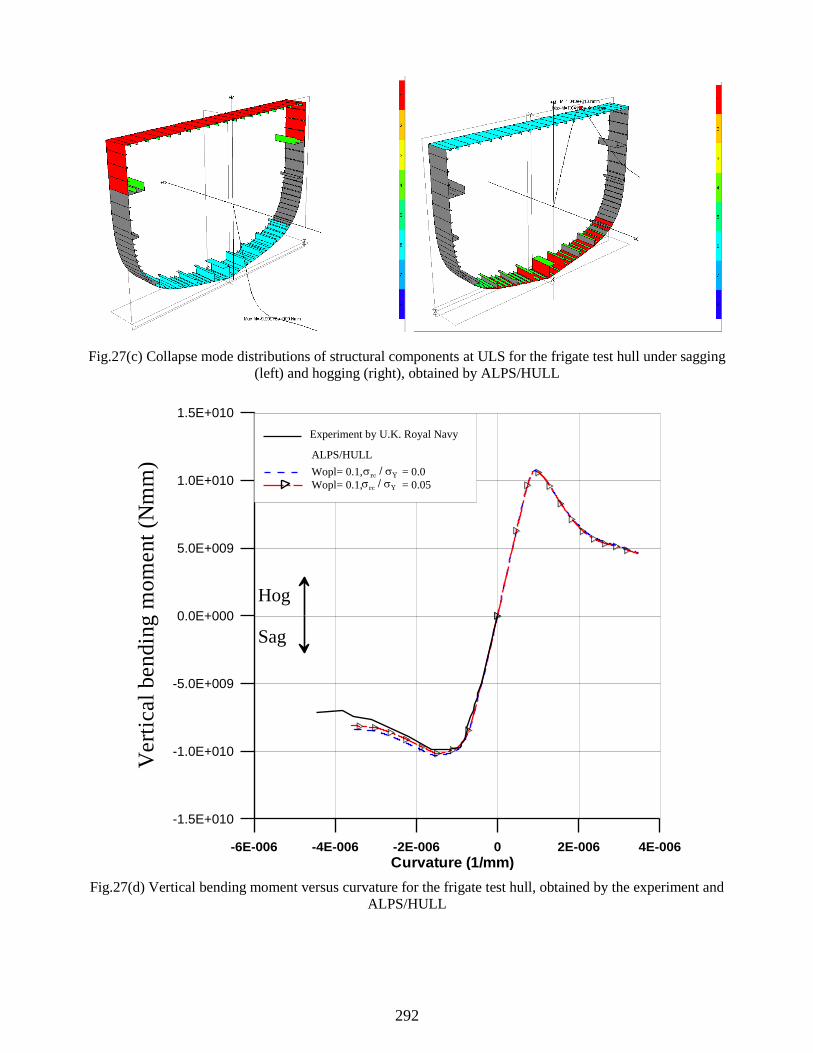
292
Fig.27(c) Collapse mode distributions of structural components at ULS for the frigate test hull under sagging
(left) and hogging (right), obtained by ALPS/HULL
-6E-006 -4E-006 -2E-006 0 2E-006 4E-006
Curvature (1/mm)
-1.5E+010
-1.0E+010
-5.0E+009
0.0E+000
5.0E+009
1.0E+010
1.5E+010
Vert
ical
ben
din
g m
om
ent
(Nm
m)
Experiment by U.K. Royal Navy
ALPS/HULL
Wopl= 0.1, = 0.0
Wopl= 0.1, = 0.05
rc / Y
rc
/ Y
Hog
Sag
Fig.27(d) Vertical bending moment versus curvature for the frigate test hull, obtained by the experiment and
ALPS/HULL
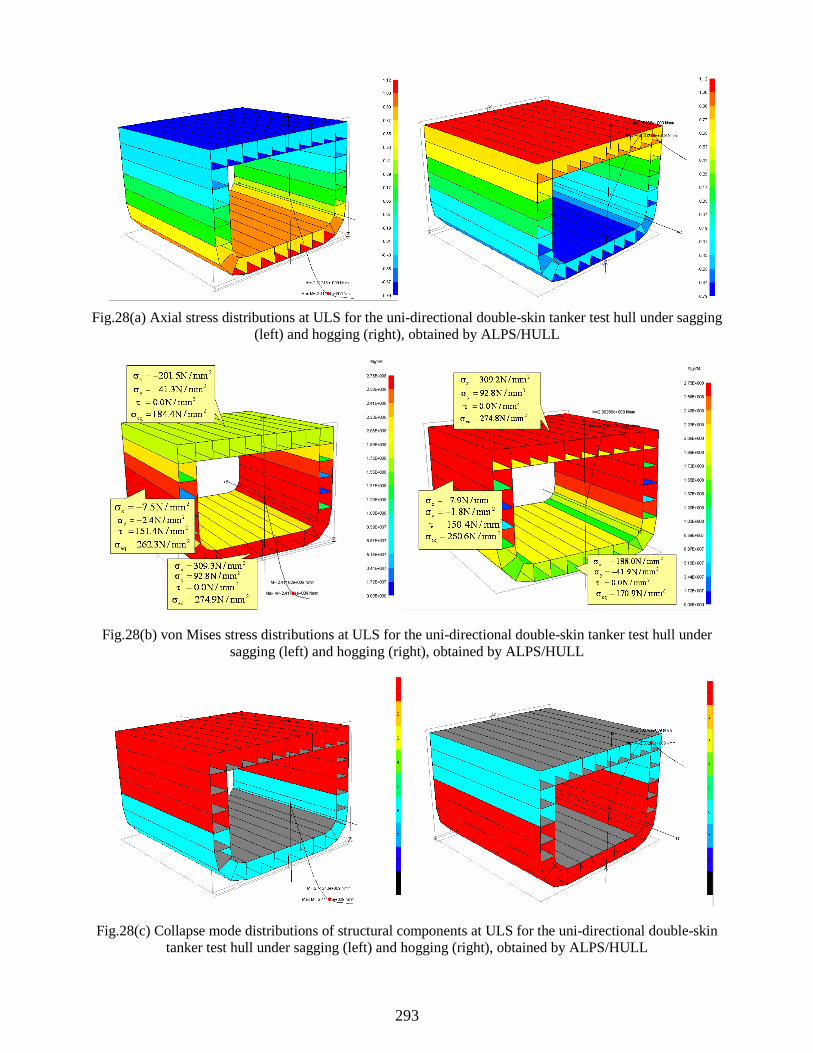
293
Fig.28(a) Axial stress distributions at ULS for the uni-directional double-skin tanker test hull under sagging
(left) and hogging (right), obtained by ALPS/HULL
Fig.28(b) von Mises stress distributions at ULS for the uni-directional double-skin tanker test hull under
sagging (left) and hogging (right), obtained by ALPS/HULL
Fig.28(c) Collapse mode distributions of structural components at ULS for the uni-directional double-skin
tanker test hull under sagging (left) and hogging (right), obtained by ALPS/HULL
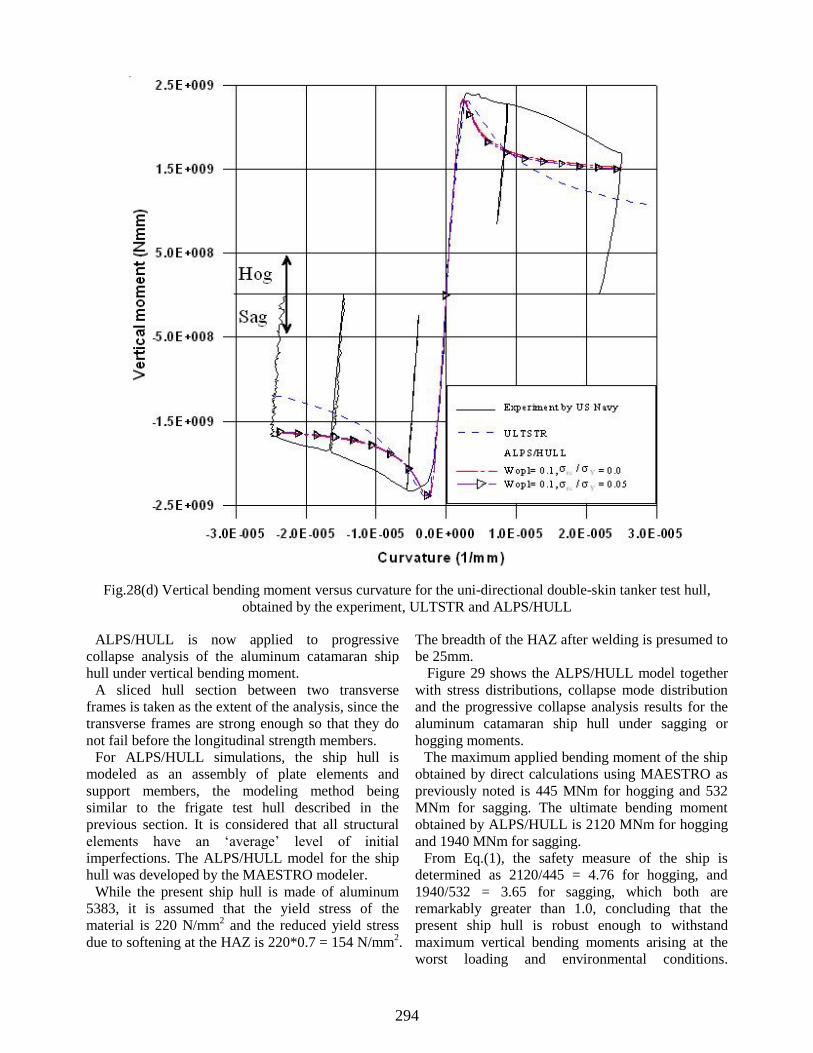
294
Fig.28(d) Vertical bending moment versus curvature for the uni-directional double-skin tanker test hull,
obtained by the experiment, ULTSTR and ALPS/HULL
ALPS/HULL is now applied to progressive
collapse analysis of the aluminum catamaran ship
hull under vertical bending moment.
A sliced hull section between two transverse
frames is taken as the extent of the analysis, since the
transverse frames are strong enough so that they do
not fail before the longitudinal strength members.
For ALPS/HULL simulations, the ship hull is
modeled as an assembly of plate elements and
support members, the modeling method being
similar to the frigate test hull described in the
previous section. It is considered that all structural
elements have an ‘average’ level of initial
imperfections. The ALPS/HULL model for the ship
hull was developed by the MAESTRO modeler.
While the present ship hull is made of aluminum
5383, it is assumed that the yield stress of the
material is 220 N/mm2 and the reduced yield stress
due to softening at the HAZ is 220*0.7 = 154 N/mm2.
The breadth of the HAZ after welding is presumed to
be 25mm.
Figure 29 shows the ALPS/HULL model together
with stress distributions, collapse mode distribution
and the progressive collapse analysis results for the
aluminum catamaran ship hull under sagging or
hogging moments.
The maximum applied bending moment of the ship
obtained by direct calculations using MAESTRO as
previously noted is 445 MNm for hogging and 532
MNm for sagging. The ultimate bending moment
obtained by ALPS/HULL is 2120 MNm for hogging
and 1940 MNm for sagging.
From Eq.(1), the safety measure of the ship is
determined as 2120/445 = 4.76 for hogging, and
1940/532 = 3.65 for sagging, which both are
remarkably greater than 1.0, concluding that the
present ship hull is robust enough to withstand
maximum vertical bending moments arising at the
worst loading and environmental conditions.
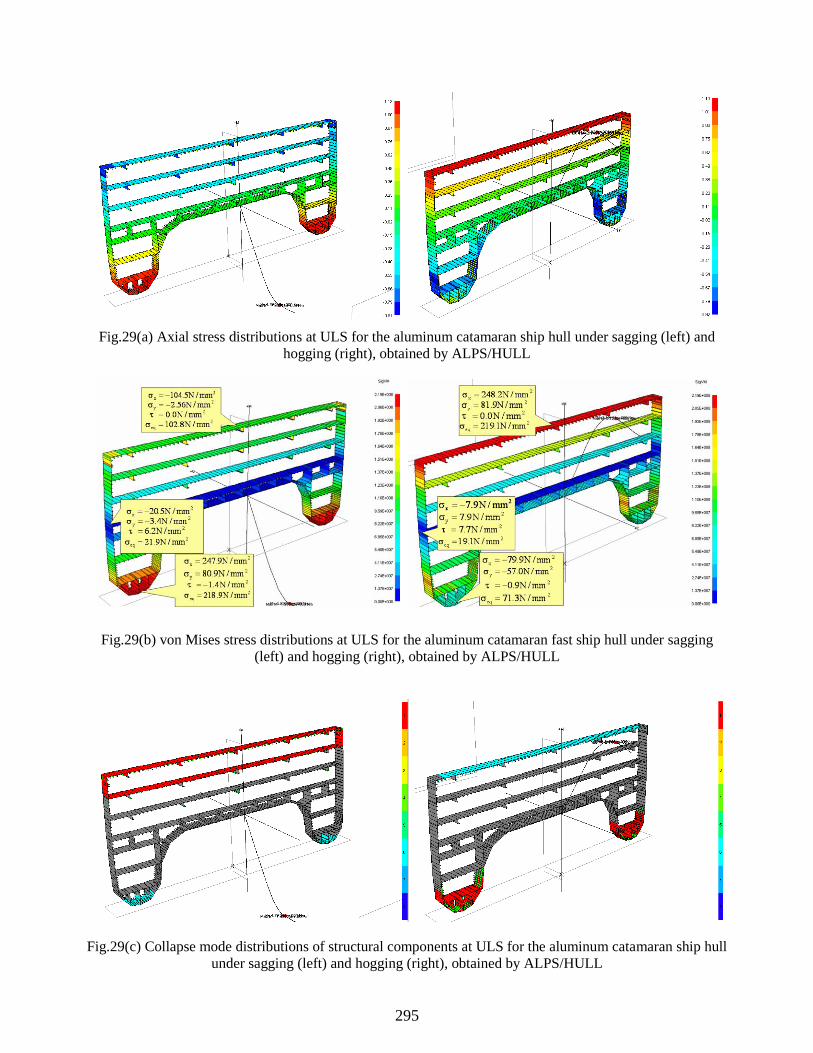
295
Fig.29(a) Axial stress distributions at ULS for the aluminum catamaran ship hull under sagging (left) and
hogging (right), obtained by ALPS/HULL
Fig.29(b) von Mises stress distributions at ULS for the aluminum catamaran fast ship hull under sagging
(left) and hogging (right), obtained by ALPS/HULL
Fig.29(c) Collapse mode distributions of structural components at ULS for the aluminum catamaran ship hull
under sagging (left) and hogging (right), obtained by ALPS/HULL

296
-0.0008 -0.0004 0 0.0004 0.0008
Curvature (1/m)
-3.0E+009
-2.0E+009
-1.0E+009
0.0E+000
1.0E+009
2.0E+009
3.0E+009
Vert
ical
ben
din
g m
om
ent
(Nm
)
All aluminium catamaran ship
ALPS/HULL
Wopl/t= 0.1, = 0.05
rc / Y
Hog
Sag
2.12E+09 Nm
-1.94E+09 Nm
0.445E+09 Nm
-0.532E+09 Nm Max. applied sag moment
Max. applied hog moment
MSAG / VSAG=0.212 ( / V=0.05)
MG / VHOG=0.154
MSAG / VSAG=0.000 ( / V=0.0)
MG / VHOG=0.000
MSAG / VSAG=0.445 ( / V=0.1)
MG / VHOG=0.308
MSAG / VSAG=0.696 ( / V=0.15)
MG / VHOG=0.504
UVSAG=-1.93E+09Nm
UVHOG=2.10E+09Nm
UVSAG=-1.88E+09Nm
UVHOG=2.04E+09Nm
UVSAG=-1.94E+09Nm
UVHOG=2.12E+09Nm
UVSAG=-1.81E+09Nm
UVHOG=1.91E+09Nm
Fig.29(d) Vertical bending versus curvature for the hypothetical aluminum catamaran fast ship hull, obtained
by ALPS/HULL
Effect of Horizontal Bending Moment on ULS of
the Aluminum Catamaran Fast Ship Hull
Theoretically speaking, the effect of horizontal
bending moment needs to be taken into account in
the process of structural scantlings and hull girder
ultimate strength evaluation.
In oblique or beam sea states, the horizontal
bending moments of catamaran ships can be of
importance, although they are usually negligible in
head sea states (Faltinsen et al. 1992).
Figure 29(d) shows the effect of horizontal bending
on the progressive hull girder collapse behavior
under combined vertical and horizontal bending. For
the present catamaran ship, the effect of horizontal
bending moment is considered to be very small,
because:
(1) The ship has a very large beam, more than
twice the overall depth, and thus the
horizontal moment of inertia for the hull cross
section is very large, and
(2) The twin hulls are widely separated so that the
ship has large roll stability and would not
experience a large heel angle which is the
main source of horizontal bending.
(3) The ultimate hull girder vertical bending
moment reduction is only about 10% even
when the applied horizontal bending is some
50% of the applied vertical bending in
magnitude.
CONCLUDING REMARKS
The aim of the present study has been to develop
some sophisticated core technologies for structural
design and strength assessment of large aluminum
multi-hull ships. The methodologies for ultimate
limit state assessment of aluminum stiffened panels
and aluminum ship hulls were developed by
extensive studies undertaken theoretically,
numerically and experimentally.
The developed technologies have been applied to
the design and safety assessment of a 120m long
aluminum catamaran fast ship, confirming that the
hull is robust enough against hull girder design loads.
It is hoped that the technologies and insights
developed from the present study will be useful for
the design and strength assessment of large
aluminum multi-hull ship structures.

297
Some parts of this study have shown that aluminum
5383 is superior to the standard aluminum alloy 5083
in terms of material properties, ULS characteristics
and welding performance. The new aluminum
stiffened panel strength models are undergoing
further validation against mechanical collapse panel
tests, the results of which will be published at a later
time.
ACKNOWLEDGEMENTS
The present study was undertaken by the support
of the U.S. Office of Naval Research. Mechanical
collapse test work was supported by Alcan Marine,
France, while Hanjin Heavy Industries &
Construction (HHIC), Co., Korea performed the
welding fabrication of aluminum test panels. The
efforts of N.I. Kim (HHIC), D.H. Kang, C.M. Park,
J.Y. Ryu, J.H. Jang and J.K. Seo (Pusan National
University) are appreciated.
REFERENCES
ALPS/HULL (2005). A computer program for the
progressive collapse analysis of ship hulls
(Version 2005.5). Ship and Offshore Structural
Mechanics Lab., Pusan National University.
ALPS/ULSAP (2005). A computer program for
ultimate limit state assessment of stiffened panels
(Version 2005.5). Ship and Offshore Structural
Mechanics Lab., Pusan National University.
Bruchman, D.D., Kihl, D.P. and Adamchak, J.C.
(2000). Evaluation of the effect of construction
tolerances on vessel strength. Ship Structure
Committee Report, SSC-411, Washington, D.C.
DNV (2003). Rules for ships: high speed, light craft
and naval surface craft. Det Norske Veritas,
Norway.
Dow, R.S. (1991). Testing and analysis of 1/3-scale
welded steel frigate model. Proceedings of the
International Conference on Advances in Marine
Structures, Dunfermline, Scotland, 749-773.
EN 13195-1 (2002). Aluminum and aluminum
alloys: wrought and cast products for marine
applications (shipbuilding, marine and offshore).
European Standard: French Standard, Association
Francaise de Normalisation (ANFOR).
Faltinsen, O.M., Hoff, J.R., Kvalsvold, J. and Zhao,
R. (1992). Global loads on high-speed catamarans.
Proceedings of the 5th Symposium on Practical
Design and Ships and Other Floating Structures
(PRADS’92), Newcastle, England, Vol.1, pp.360-
373.
Hughes, O.F. (1998). Two first principles structural
designs of a fast ferry all-aluminum and all-
composite, Proceedings of 4th International
Conference on Fast Sea Transportation, Vol. I,
Sydney, Australia, July, pp.91-98.
Kontoleon, M.J., Preftitsi, F.G. and Baniotopoulos,
C.C. (2000). Butt-welded aluminum joints: a
numerical study of the HAZ effect on the ultimate
tension strength. Proceedings of the NATO
Advanced Research Workshop on the Paramount
Role of Joints in the Reliable Response of
Structures, Ouranoupolis, Greece, May 21-23,
pp.337-346.
MAESTRO (2005). Version 8.7.1. Proteus
Engineering, Stevensville, MD 21666, USA.
Mazzolani, F.M. (1985). Aluminum alloy structures.
Pitman Advanced Publishing Program, London.
Moan, T. (2004). Marine structures for the future – a
sea of opportunities. J. of Marine Systems &
Ocean Technology, Vol.1, No.1, pp.1-19.
Paik, J.K. (2004). A guide for the ultimate
longitudinal strength assessment of ships. Marine
Technology, Vol.41, No.3, pp.122-139.
Paik, J.K. and Duran, A. (2004). Ultimate strength of
aluminum plates and stiffened panels for marine
applications. Marine Technology, Vol.41, No.3,
pp.108-121.
Paik, J.K. and Seo, J.K. (2005). Ultimate limit state
assessment of ship structures. Proceedings of
International Conference on Computational
Methods in Marine Engineering (MARINE 2005),
27-29 June, Oslo, Norway.
Paik, J.K. and Thayamballi, A.K. (2003). Ultimate
limit state design of steel-plated structures. John
Wiley & Sons, Chichester, U.K.
Paik, J.K., Thayamballi, A.K. and Lee, J.M. (2004a).
Effect of initial deflection shape on the ultimate
strength behavior of welded steel plates under
biaxial compressive loads. Journal of Ship
Research, Vol.48, No.1, pp.45-60.
Paik, J.K., van der Veen, S., Duran, A. and Collette,
M. (2004b). Considering aluminum welded panel
structures for aerospace, marine and land-based
applications: a comparison of ultimate
compressive strength design methods.
Proceedings of PRADS’2004, Germany, 12-17
September, Vol.2, pp.717-735.
Raynaud, G.M. (1995). New aluminum products for
high speed light crafts. Building High-speed
Aluminum Marine Vessels in Victoria – A
Feasibility Study, Business Victoria, Melbourne,
Australia.
Smith, C.S., Davidson, P.C., Chapman, J.C. and
Dowling, P.J. (1988). Strength and stiffness of
ships’ plating under in-plane compression and
tension. RINA Transactions, Vol.130, pp.277-296.