discounted cash flow valuation of thai oil public …
TRANSCRIPT
DISCOUNTED CASH FLOW VALUATION OF THAI OIL PUBLIC COMPANY LIMITED
PHAWEELITA SIRACHINDABHIROM
A THEMATIC PAPER SUBMITTED IN PARTIAL FULFILLMENT OF THE REQUIREMENTS FOR THE DEGREE OF MASTER OF MANAGEMENT
COLLEGE OF MANAGEMENT MAHIDOL UNIVERSITY
2016
COPYRIGHT OF MAHIDOL UNIVERSITY
Thematic paper entitled
DISCOUNTED CASH FLOW VALUATION OF THAI OIL PUBLIC COMPANY LIMITED
was submitted to the College of Management, Mahidol University
for the degree of Master of Management on
December 22, 2016
…………………….……………….. Phaweelita Sirachindabhirom Candidate ……………………………………… ……………………………………… Asst. Prof. Nareerat Taechapiroontong, Asst. Prof. Piyapas Tharavanij, Ph.D. Ph.D. Advisor Chairperson ……………………………………... ……………………………………… Duanporn Arbhasil, Vasan Siraprapasiri, Ph.D. M.Sc. Dean Committee member College of Management Mahidol University

ii
ACKNOWLEDGEMENTS
I wish to express my sincere gratitude to all of my professors at CMMU who
taught me well in each of the courses through Corporate Finance in MMCF, interna-
tional program at Mahidol University, for his or her constant support, guidance and en-
couragement.
I would like to acknowledge Thai Oil Public Company Limited and all of
my colleagues for their support, assistance and understanding during my hard time. My
working experiences and references from the company were truly beneficial and made
this paper possible.
Special thank is given to my family: The Sirachindabhiroms, for their sup-
port thoroughly the entire journey of my work and academic life.
Lastly, to my beloved friends, who were always by my side and ready to
cheer me up whenever things didn’t go exactly right, and for their participation and help
with this research.
Phaweelita Sirachindabhirom
iii
DISCOUNTED CASH FLOW VALUATION OF THAI OIL PUBLIC COMPANY LIMITED PHAWEELITA SIRACHINDABHIROM 5849020 M.M. (FINANCIAL MANAGEMENT) THEMATIC PAPER ADVISORY COMMITTEE: ASST.PROF.NAREERAT TAECHAPIROONTONG, Ph.D., ASST.PROF. PIYAPAS THARAVANIJ, Ph.D., VASAN SIRAPRAPASIRI, M.Sc.,
ABSTRACT This thematic paper aims to value the stock price of Thai Oil Public Com-
pany Limited (TOP) base on discounted cash flow valuation method which has the con-
cept that stock price of the firm should reflect its fundamental value in term of cash
flow, growth and risk. Together with strong performance and competitive cash operat-
ing cost among peers including expectation of strong domestic oil demand growth in
next year, we expect the bright future for TOP. As a result, the target price of TOP shall
approximately equal to 83.0 Baht per share while the current price settles at 73.0 Baht
per share; therefore, the valuation is indicative to BUY. However, there are variety of
factors that are beyond control that would cause a fluctuation in price of refinery and
petrochemical products which might be directly impact to company’s performance.
In conclusion, the valuation study is to suggest company intrinsic value
which the method still has some limitations. Therefore, the value must be consider care-
fully. However, the study can still provide guidance on processes of intrinsic valuation
for investors and interested person in material construction companies.
KEY WORDS: TOP / Valuation / Discounted Cash Flow / Construction Material 63 page
iv
CONTENTS
Page
ACKNOWLEDGEMENTS ii
ABSTRACT iii
LIST OF TABLES vii
LIST OF FIGURES viii
LIST OF ABBREVIATIONS x
CHAPTER I VALUATION 1
1.1 Highlights 1
1.1.1 BUY on TOP as a valuable stock with sustainable
growth to continue 1
1.1.2 Strong performance and competitive cash operating
cost among peers 1
1.1.3 Buoyant GRM and strong domestic oil demand growth
in 2017 2
1.2 Business Description 2
1.3 Industry Overview and Competitive Positioning 6
1.3.1 Macro-Economic Analysis 6
1.3.2 Industry Analysis 9
1.3.3 Competition Analysis 16
1.4 Investment Summary 18
1.4.1 A valuable stock with sustainable growth to continue 18
1.4.2 TOP as a regional and Thailand’s top tier refinery with
low competitive cash cost enables strong performance 18
1.4.3 Buoyant GRM could be expected from a bright 2017
refinery outlook with pro on Middle distillate spread 20
1.4.4 Still strong domestic & CLMV demand benefits TOP as
more than 90% of sales goes to those markets 20
v
CONTENTS (cont.)
Page
1.4.5 Discipline in attractive dividend payment on top of its
potential capital gain 21
1.5 Valuation 21
1.5.1 Valuation of TOP derives from FCFF 21
1.5.2 Discounted Cash Flow Model: Free Cash Flow
to Firm (FCFF) 22
1.5.3 5-year forecasted cash flow assumptions 22
1.5.4 Maintain strong margin 22
1.5.5 SG&A growth steady 22
1.5.6 Terminal value, discounted at 9.3% 23
1.5.7 Capital expenditure, CAPEX 23
1.5.8 Weighted average cost of capital, WACC 23
1.5.9 Conclusion 23
1.6 Financial Analysis 24
1.6.1 Slightly soften market GIM plus stock losses but
sustainable growth to continue 24
1.6.2 Strong financial position and financial ratios 24
1.6.3 Increasing cash flow along with revenues and margins 25
1.6.4 Common size analysis 25
1.6.5 Trend analysis 27
1.6.6 DuPont analysis 28
1.7 Investment Risk 29
1.7.1 Risk 29
1.7.2 Sensitivity analysis 32
1.7.3 Scenario analysis 32
CHAPTER II DATA 34
2.1 TOP Business Structure 34
vi
CONTENTS (cont.)
Page
2.2 SWOT Analysis 36
2.2.1 Strengths 36
2.2.2 Weakness 40
2.2.3 Opportunities 41
2.2.4 Threat 43
2.3 Five-force Analysis 45
2.3.1 Supplier Powers (High) 45
2.3.2 Buyer Power (Moderate) 46
2.3.3 Competitive Rivalry (High) 47
2.3.4 Threat of Substitution (Moderate) 48
2.3.5 Threat of New Entry: (Moderate) 49
2.4 Corporate Governance and Management Practices 50
2.4.1 Corporate Governance 50
2.4.2 Management Practices 50
2.4.3 Awards and Recognitions 51
2.5 Income Statement 52
2.6 Balance Sheet 52
2.7 Statement of Cash Flow 53
2.8 Financial Ratios 54
2.9 Peer’s Comparison-SPRC 55
2.9.1 Common size Analysis-TOP vs SPRC 55
2.9.2 Trend Analysis-TOP vs SPRC 57
2.10 Regional and Global Peer’s Multiples 60
REFERENCES 61
BIOGRAPHY 63
vii
LIST OF TABLES
Table Page
1.1 Risk Matrix 30
1.2 Key Risks Factors and Mitigations 31
1.3 Sensitivity analysis of EV/EBITDA and share price 32
2.1 Board of directors 35
2.2 Income Statement including projections 52
2.3 Balance Sheet including projections 52
2.4 Statement of Cash Flow including projections 53
2.5 Summary of key financial ratios 54
2.6 Peer’s Key Financial Ratios – as of 30 September 2016 54
2.7 Regional and Global Peer’s Multiples 60
viii
LIST OF FIGURES
Figure Page
1.1 Total Thailand crude refining capacity 3
1.2 Thai Oil market shares for refined petroleum product 3
1.3 TOP’s source of crude and product yield 5
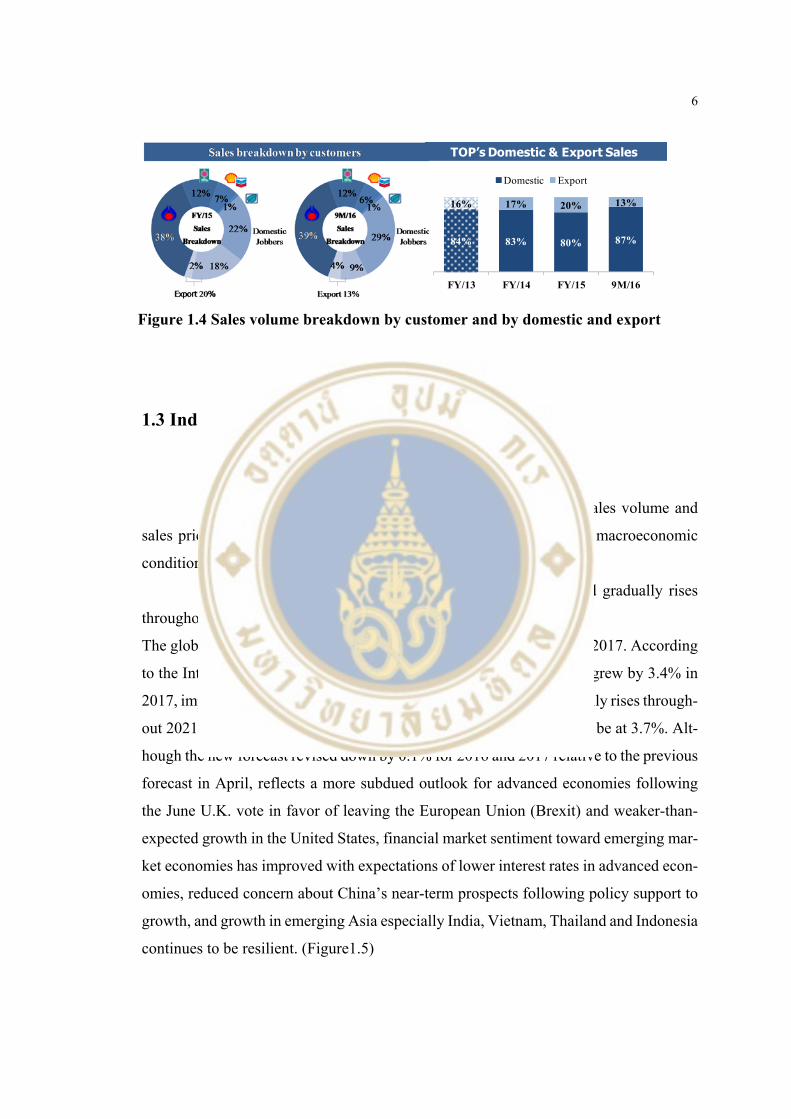
1.4 Sales volume breakdown by customer and by domestic and export 6
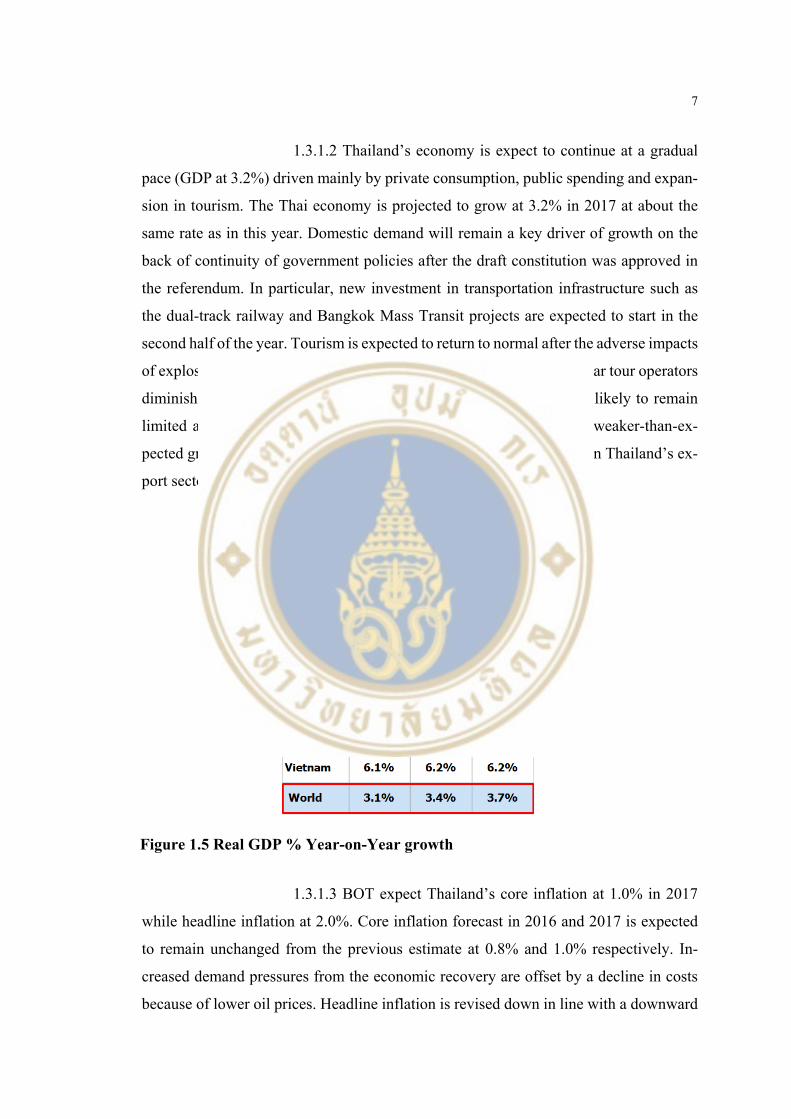
1.5 Real GDP % Year-on-Year growth 7
1.6 World oil demand& GDP growth 10
1.7 2017 global oil demand growth 10
1.8 Global Liquid Producer Breakeven Cost 11
1.9 Global Oil Demand and Supply Rebalance 12
1.10 AP&ME oil demand growth better than refinery addition in 2017 13
1.11 AP&ME surplus refining capacity 13
1.12 World middle distillate demand and supply growth 14
1.13 AP & ME Effective PX Capacity Additions 15
1.14 Global additional nameplate capacity of lube base plants 16
1.15 Thai asphalt cement road maintenance plan 16
1.16 TOP/Domestic refinery utilization rate 19
1.17 Nelson index graph-Regional comparison 19
1.18 Cash Operating Cost of Regional Refineries 19
1.19 Solomon Benchmark 20
1.20 Thailand petroleum product demand 21
1.21 CMV oil demand growth 21
1.22 Common size analysis (Income Statement) 25
1.23 Common size analysis (Balance Sheet: Asset) 26
ix
LIST OF FIGURES (cont.)
Figure Page
1.24 Common size analysis (Balance Sheet: Liabilities) 26
1.25 Trend analysis 27
1.26 DuPont analysis 28
2.1 TOP business structures as of 30 September 2016 34
2.2 TOP Major Shareholder 34
2.3 % Free-float 34
2.4 AEC Oil demand growth 42
2.5 Long term energy demand by type and by sector 44
2.6 Income Statement Comparison- TOP vs SPRC 55
2.7 Balance Sheet: Asset Comparison-TOP vs SPRC 56
2.8 Balance Sheet: Liabilities & Equity Comparison-TOP vs SPRC 56
2.9 Trend Analysis; Sales -TOP vs SPRC 57
2.10 Trend Analysis; Gross Margin-TOP vs SPRC 57
2.11 Trend Analysis; Net Profit Margin-TOP vs SPRC 58
2.12 Trend Analysis; ROA-TOP vs SPRC 58
2.13 Return Analysis; ROE-TOP vs SPRC 59
2.14 Risk Analysis; D/E-TOP vs SPRC 59

x
LIST OF ABBREVIATIONS
aromatic A group of unsaturated cyclic hydrocarbons containing one or
more benzene rings of six carbon atoms. They are highly reac-
tive and chemically versatile. The group name is derived from
the strong and not unpleasant odor characteristic of most chem-
icals in this family.
bdp Barrels per day
bbl or bbls Barrels (1 Bbl = 158.984 liters)
benzene An aromatic hydrocarbon in the form of a colorless, flammable
liquid. It is created by catalytically reforming naphtha, in the
thermal cracking process, and is used in the production of other
chemicals such as styrene, cumene, cyclohexane, aniline and
chlorobenzene.
bitumen Heavy oil product normally used for road pavement and con-
struction
complex refinery A refinery that has manufacturing processes (conversion units
or upgrading units) to upgrade lower value hydrocarbon prod-
ucts to higher value products. The type of of complexity of the
refineryprocessing facilities indicates the degree
continuous catalyst regeneration platformers (“CCR”)

xi
Refinery units that change the molecular structure of lower oc-
tane gasoline components to higher octane in the presence of
catalyst.
cracking (“CCU”) A process of breaking down larger molecules of heavy oil into
smaller ones by the action of heat, with the aid of catalyst.
crude distillation unit (“CDU”)A refinery unit that separates crude oil into fractions, by
the aid of heat, based on the difference in boiling point of hy-
drocarbons. The lightest fraction includes refinery fuel gas, LPG
and gasoline. The middle fraction includes kerosene and diesel.
The heaviest fraction (bottom stream) is mainly fuel oil, which
has the lowest value. Fuel oil can be further processed in the
conversion unit to produce more valuable products.
crude oil Crude oil is a mixture of hydrocarbon which is used as the prin-
cipal feedstock in the refinery for the production of petroleum
products.
diesel A general term of fuel used in diesel (compressionignition) en-
gines.
distillates Distillates may refer to any refined oil products.
feedstock Hydrocarbon compounds, such as crude oil, natural gas liquid
and imported residue that are fed into processing units and/or
blended into refined products.
fluidized catalytic cracking unit (“FCCU”)

xii
A refinery process unit that uses catalyst to convert low value,
heavy components to higher value, lighter components such as
high octane gasoline and other products.
fuel oil Oil generally used as furnace fuel. It is also widelyused as a
main source of energy for electricity generators and bunkering.
gross refining margin (“GRM”)Value of production (“VOP”) minus cost of intake
(“COI”) and cost of purchased utilities. VOP is calculated based
on the quantity of products from the refinery during a certain
period multiplied by the prices of each product type. COI is cal-
culated based on the quantity of crude oil and other feedstock
used in the refinery process during a certain period multiplied
by cost of crude.
heavy products Fuel oil, long residue and bitumen.
high vacuum unit (“HVU”)A refinery unit that further fractionates the black fuel oil
fraction produced by the CDU, which is also known as long res-
idue, to produce a light fuel oil fraction (light vacuum gasoil and
heavy vacuum gasoil) and a heavy fuel oil fraction (short resi-
due). In the HVU, separation occurs in the fractionation column
at a high temperature and under vacuum conditions to prevent a
cracking reaction.
hydrocracker unit (“HCU”)A refinery process unit using catalyst and hydrogen that
converts low value, heavy components to higher value, lighter
components such as high cetane diesel and other products.
xiii
hydrodesulfurization unit (“HDS”) A refinery process unit using catalyst and hydrogen
that removes sulfur from components to produce low sulfur die-
sel.
hydrotreating unit (“HDT”)A refinery process unit that removes contaminants such as
sulfur, nitrogen from naphtha and lighter components.
isomerization unit (“ISOM”)A refinery unit that processes light naphtha (low octane
gasoline component) and converts it to highoctane gasoline by
using a catalyst and hydrogen. Also known as a penex/molex
unit.
jet fuel A refined product used for both commercial aviation and mili-
tary aircraft. There are several jet fuel specifications. It is also
known as turbine fuel. The primary source of jet fuel blending
stocks is kerosene from CDU and hydrocracking unit.
kerosene A refined middle-distillate petroleum product that is used for jet
fuel, cooking, heating, lighting, solvent and for blending into
diesel and fuel oil.
light products LPG, unleaded gasoline, reformate and isomerate.
linear alkyl benzene (“LAB”)A family of organic compound commonly used as a raw
material in the manufacture of biodegradablehousehold deter-
gents.
LPG Liquefied petroleum gas. Consists primarily of propane and bu-
tane and is produced for use for cooking, home heating and as
an intermediate material in the manufacture of petrochemicals.
xiv
lube base oil The main component of finished lubricants derived from heavy
crude oil fraction in vacuum distillation.
thermal cracking unit (“TCU”) A refinery unit that breaks up heavy oil molecules into
lighter, more valuable fractions (e.g. gasoline, kerosene) by the
use of high temperature without the aid of catalysts.
very large crude carriers (“VLCC”)
A supertanker with a capacity between 160,000 and 320,000
deadweight tons. Deadweight tonnage(“DWT”) is the amount
of cargo, fuel, water, stores and crew that a tanker can carry
when fully loaded
1
CHAPTER I
VALUATION
1.1 Highlights
1.1.1 BUY on TOP as a valuable stock with sustainable growth to con-tinue
With our analysis and our assumption, we expect an upside gain 13.7% at
our target price of 83.0 baht per share under DCF and relative valuation method. We are
confident that TOP’s overall net profit will stay solid; given its rising refinery earnings
will offset the weaker non-refinery earnings i.e. petrochemical and lube base earnings.
Moreover we expect better contributions from completed operated in Q1/16 and Q2/16
respectively.
1.1.2 Strong performance and competitive cash operating cost among peers
As TOP’s past performance told, we strongly believe that TOP could deliver
strong performance going forward due to 1) the reliability of TOP plants reflected
through stable high utilization rate even higher than Thailand’s industry average, 2) TOP
as one of the most complex refinery and 3) TOP’s low competitive cash operating cost
considered as the first quartile in the Asia Pacific region. TOP cash operating cost is
only 1.4-1.5$/bbl lowest in Thai’s peers and much competitive than Korean & Indian
refiners of which the cost are around 2-3 $/bbl, Chinese refiners of which the cost are
around 3-4 $/bbl. Not to mention European/Russian refiners which were considered as
high cost players at around 4.5-5$/bbl. All of those are critical success factors for refin-
ery to have competitive refining margins while low cash operating cost. That could def-
initely reduce risk of volatility of commodity prices. Thus we do like TOP stock despite
it is in volatile business.
2
1.1.3 Buoyant GRM and strong domestic oil demand growth in 2017
could made bright future for TOP
We expect the tighter supply and colder weather from La Nina effect in
4Q16 would strengthen GRM. The mega refineries have planned shutdowns (Yasref
with 400KBD and Ras Tanura with 550KBD), leading to tight supply. Meanwhile, re-
fined-product spreads would be higher, especially gas oil which has supported by strong
demand during winter.
We believe that refinery margin could be strong and could have some im-
provements which could help offset softer outlook on petrochemical business as oil de-
mand growth outpacing refinery capacity addition in Asia Pacific and Middle East.
Moreover we have a positive view on middle distillate; JET and gasoil, spread supported
by recovered demand in coal sector and strong recovered economy growth especially in
Asia where majority of demand growth exists. Thus it would benefit TOP as a middle
distillate refiner.
We also believe in strong growth of oil demand in Thailand tracking with
the GDP growth which driven mainly by private consumption, public spending and ex-
pansion in tourism. Thus it’s positive to domestic oil demand growth expected to grow
2.3% in 2017 led by middle distillate products; JET and Diesel which is majority con-
sumption in Thailand. Therefore, we think that TOP as a leading domestic refining
player will definitely gain benefit from the strong domestic demand as TOP normally
sales to domestic market more than 80%.
1.2 Business Description
Thai Oil is one of the leading integrated publicly listed refining and petro-
chemical companies in Thailand. It currently own and operate the largest single-site
complex refinery in Thailand measured by nameplate capacity which is one of the most
complex refineries in the Asia-Pacific region. As of 30 September 2016, Thai Oil has
refining nameplate capacity of approximately 275,000 bpd of crude oil and other feed-
3
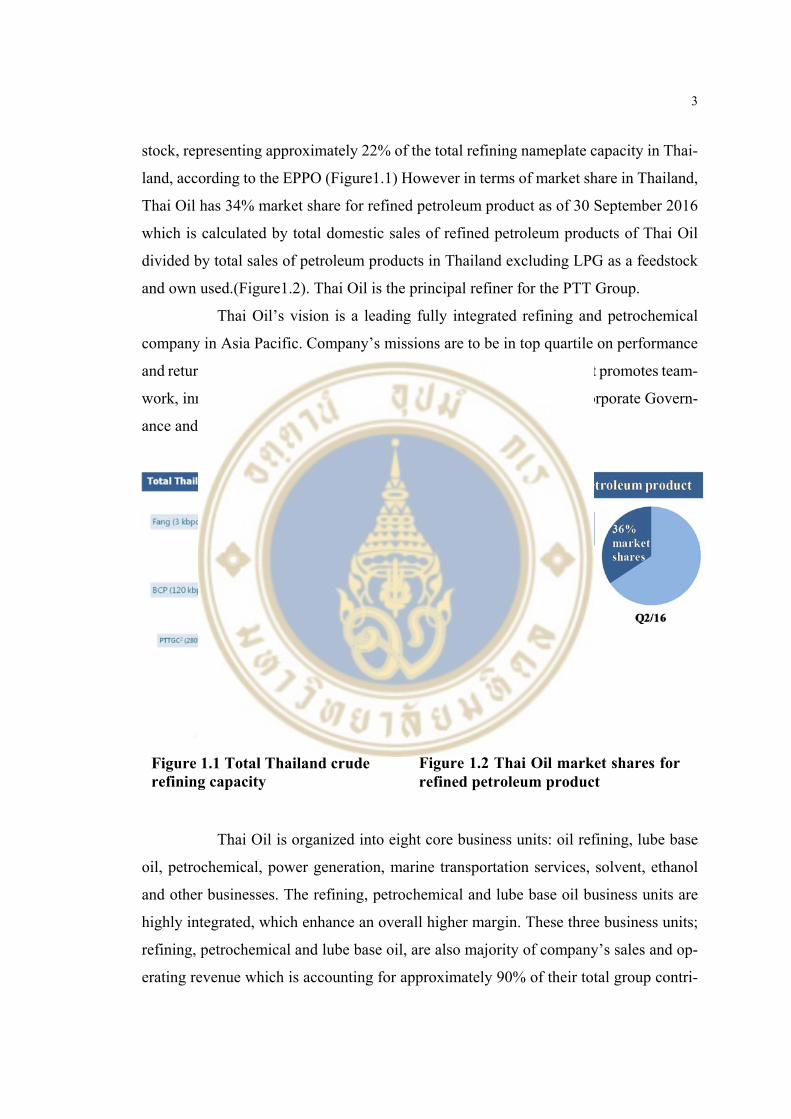
stock, representing approximately 22% of the total refining nameplate capacity in Thai-
land, according to the EPPO (Figure1.1) However in terms of market share in Thailand,
Thai Oil has 34% market share for refined petroleum product as of 30 September 2016
which is calculated by total domestic sales of refined petroleum products of Thai Oil
divided by total sales of petroleum products in Thailand excluding LPG as a feedstock
and own used.(Figure1.2). Thai Oil is the principal refiner for the PTT Group.
Thai Oil’s vision is a leading fully integrated refining and petrochemical
company in Asia Pacific. Company’s missions are to be in top quartile on performance
and return on investment, to create a high-performance organization that promotes team-
work, innovation and trust for sustainability and to emphasize good Corporate Govern-
ance and commit to Corporate Social Responsibility.
Thai Oil is organized into eight core business units: oil refining, lube base
oil, petrochemical, power generation, marine transportation services, solvent, ethanol
and other businesses. The refining, petrochemical and lube base oil business units are
highly integrated, which enhance an overall higher margin. These three business units;
refining, petrochemical and lube base oil, are also majority of company’s sales and op-
erating revenue which is accounting for approximately 90% of their total group contri-
Figure 1.1 Total Thailand crude refining capacity
Figure 1.2 Thai Oil market shares for refined petroleum product
4
bution. The remaining contributions are from power generation business units account-
ing for 5-8%, and others such marine, solvents, ethanol and other business units totally
accounting for 2-3%.
Thai Oil refinery, the Sriracha Complex, is located near the Laem Chabang
deep sea port in Sriracha, Cholburi Province, approximately 124 kilometers southeast
of Bangkok, the capital city of Thailand. The strategic location of the Sriracha Complex
provides our off take customers access to a convenient product delivery network. This
network allows company’s off take customers to take delivery of refined petroleum
products efficiently and in a cost-effective manner via the connecting multi-product
pipeline owned and operated by our related party, Thappline, as well as via ground
transportation and coastal vessels. The Sriracha Complex currently has three CDUs, two
CCRs, an ISOM, two HCUs, a FCCU, a TCU, three HDTs, two HDSs, three HVUs and
various supporting units that allow them to produce refined petroleum products that
meet their customers’ requirements. The various conversion units enable the company
to vary the output of our refinery and produce the blend of products which maximizes
their gross refining margin, and provides them with significant flexibility in the use of
feedstock. Thai Oil is also capable of processing a wide range of crude oil, including
crude oil from the Middle East, Asia (excluding Thailand), other foreign sources and
Thailand, although our choice of feedstock at any time depends on relative prices and
yields. Their gasohol, gasoline and diesel products are compliant with the sulfur content
requirements of the Euro IV standard (sulfur 50 ppm) and the company is the first re-
finery in Thailand to achieve this standard.
The feedstock for Thai Oil refinery primarily comprises crude oil imported
by PTT and other suppliers from the Middle East and other regions and sold through a
combination of long-term purchase contracts and spot market purchases to allow them
flexibility in obtaining crude oil. Thai Oil Single Buoy Mooring (SBM) facilities allows
them to receive crude oil and other feedstock directly from Very Large Crude Carrier
(VLCC), thereby reducing their crude freight cost and increasing their feedstock of-
floading efficiency.
Thai Oil consumed approximately 102.4 million barrels of crude oil for the
year ended December 31, 2015, and approximately 78.4 million barrels of crude oil for
the nine months ended September 30, 2016. In 2015, crude oil originally sourced from
5
the Middle East, Asia (excluding Thailand), others foreign sources and locally ac-
counted for, by volume, 77.1%, 12.0%, 2.3% and 8.6% of total crude oil consumption,
respectively. In the nine months ended September 30, 2016, crude oil originally sourced
from the Middle East, Asia (excluding Thailand), others foreign sources and locally
accounted for, by volume, 78.9%, 9.3%, 3.5% and 8.3% of their total crude oil con-
sumption, respectively.
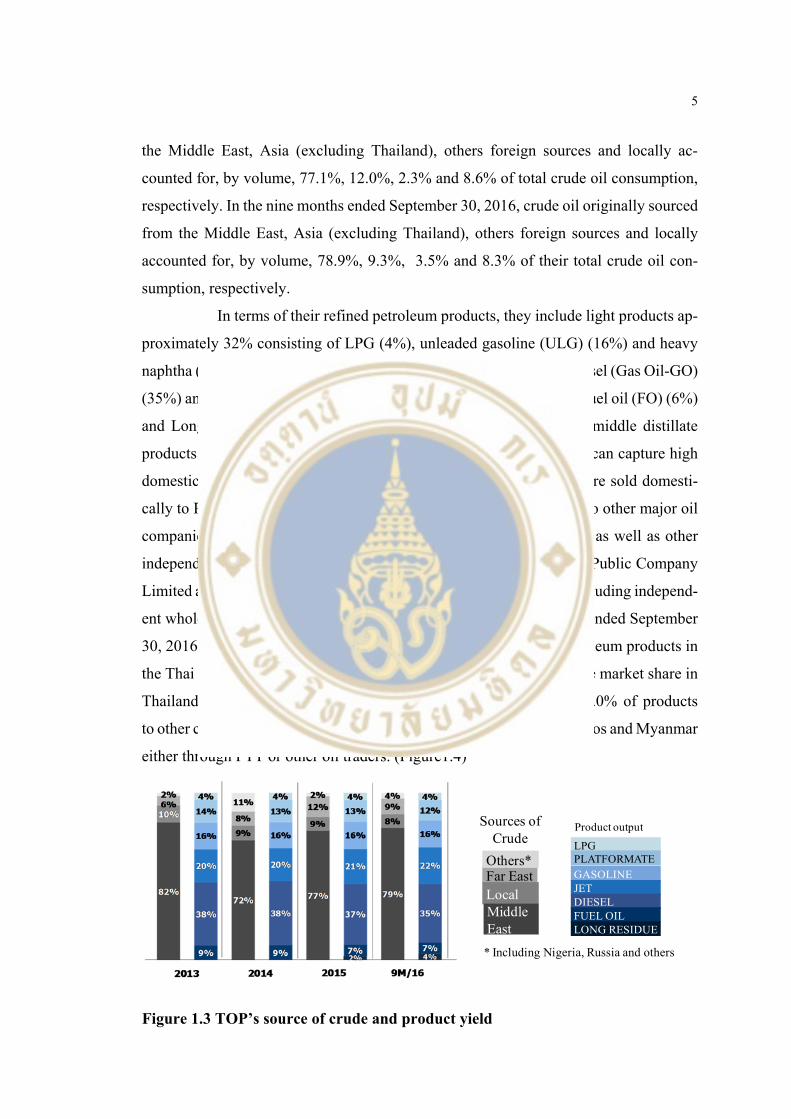
In terms of their refined petroleum products, they include light products ap-
proximately 32% consisting of LPG (4%), unleaded gasoline (ULG) (16%) and heavy
naphtha (12%) (Platformate), middle distillates (60%) consisting of diesel (Gas Oil-GO)
(35%) and jet fuel (JET)(22%), and heavy products 9% in the form of fuel oil (FO) (6%)
and Long Residue (LR)(4%) (Figure1.3) Thai Oil produces mainly middle distillate
products which are Thailand’s in-demand products thus the company can capture high
domestic portion. The majority of their refined petroleum products are sold domesti-
cally to PTT. They also sell refined petroleum products domestically to other major oil
companies, including Bangchak (BCP), Shell Thailand and Chevron, as well as other
independent oil wholesalers and offtake customers such PTG Energy Public Company
Limited and Susco Public Company Limited, and domestic jobbers (including independ-
ent wholesalers and petrol stations). In 2015 and for the nine months ended September
30, 2016, they sold, by volume, 80.0% and 87.0% of our refined petroleum products in
the Thai domestic market, which is approximately 31% and 34% of the market share in
Thailand according to DOEB and exported the remaining 20.0% and 13.0% of products
to other countries in Asia, including Singapore, Cambodia, Vietnam, Laos and Myanmar
either through PTT or other oil traders. (Figure1.4)
Sources of Crude
Far EastLocalMiddle East
Others*
* Including Nigeria, Russia and others
Product output
LPGPLATFORMATEGASOLINEJETDIESELFUEL OILLONG RESIDUE
Figure 1.3 TOP’s source of crude and product yield
6
1.3 Industry Overview and Competitive Positioning
1.3.1 Macro-Economic Analysis
Thai Oil’s results of operations are directly affected by sales volume and
sales prices of our products, which in turn are influenced by general macroeconomic
conditions globally and in Thailand.
1.3.1.1 2017’s world GDP growth at 3.4% and gradually rises
throughout 2021 supporting global oil demand growth
The global economy will improve slightly toward the end of 2016 into 2017. According
to the International Monetary Fund forecast in Oct 2016, global GDP grew by 3.4% in
2017, improved from the growth rate at 3.1% in 2016, and it will gradually rises through-
out 2021. The average world GDP growth in 2018-2020 is expected to be at 3.7%. Alt-
hough the new forecast revised down by 0.1% for 2016 and 2017 relative to the previous
forecast in April, reflects a more subdued outlook for advanced economies following
the June U.K. vote in favor of leaving the European Union (Brexit) and weaker-than-
expected growth in the United States, financial market sentiment toward emerging mar-
ket economies has improved with expectations of lower interest rates in advanced econ-
omies, reduced concern about China’s near-term prospects following policy support to
growth, and growth in emerging Asia especially India, Vietnam, Thailand and Indonesia
continues to be resilient. (Figure1.5)
84% 83% 80% 87%
16% 17% 20% 13%
FY/13 FY/14 FY/15 9M/16
Domestic Export
TOP’s Domestic & Export Sales
Figure 1.4 Sales volume breakdown by customer and by domestic and export
7
1.3.1.2 Thailand’s economy is expect to continue at a gradual
pace (GDP at 3.2%) driven mainly by private consumption, public spending and expan-
sion in tourism. The Thai economy is projected to grow at 3.2% in 2017 at about the
same rate as in this year. Domestic demand will remain a key driver of growth on the
back of continuity of government policies after the draft constitution was approved in
the referendum. In particular, new investment in transportation infrastructure such as
the dual-track railway and Bangkok Mass Transit projects are expected to start in the
second half of the year. Tourism is expected to return to normal after the adverse impacts
of explosions in the southern provinces and the crackdown on zero-dollar tour operators
diminish. Nonetheless, growth momentum of merchandise exports is likely to remain
limited and will continue to weigh on the economic recovery given weaker-than-ex-
pected growth in trading partners’ economies and structural problems in Thailand’s ex-
port sector.
1.3.1.3 BOT expect Thailand’s core inflation at 1.0% in 2017
while headline inflation at 2.0%. Core inflation forecast in 2016 and 2017 is expected
to remain unchanged from the previous estimate at 0.8% and 1.0% respectively. In-
creased demand pressures from the economic recovery are offset by a decline in costs
because of lower oil prices. Headline inflation is revised down in line with a downward
Figure 1.5 Real GDP % Year-on-Year growth
8
revision in the crude oil price forecast. While the Committee expects headline inflation
to return to the lower bound of the target band within this year at 0.3% and 2.0% in
2017, the timing would largely depend on movements in global crude oil prices.
1.3.1.4 A flat future for the monetary policy rate at 1.5% deemed
conducive for economic recovery to preserve space amid external uncertainties
The Committee maintained the policy interest rate in the August and September meet-
ings. The overall economic outlook remains largely unchanged from the meetings in the
preceding quarter. The economy is expected to recover at a gradual pace and inflation
is projected to return to the target band, with monetary conditions continuing to be ac-
commodative. While a potential increase in risk accumulation under the prolonged low
interest rate environment continues to warrant close monitoring. Nevertheless, after
Brexit the Thai economy is faced with greater risks on the external front, which will
affect the outlook of Thailand’s trading partners and overall confidence. While there is
a high degree of uncertainty associated with these risks, their consequences can be se-
vere should they materialize. The Committee thus emphasizes the need to preserve pol-
icy space, continuing to monitor and assess risks to the economic outlook in order to
formulate appropriate monetary policy.
1.3.1.5 Trump’s victory on US presidential election 2016 and
concerns on economic conditions. Markets have been so surprised after the results came
out and heavily nervous reacted to his aggressive policy. Major Trump policies includes
Foreign Policy i.e. to make changes of US lifted sanction in Iran, to open development
of nuclear weapons by Japan and South Korea that will lead to risky of political unrest,
the Tax Policy of reducing both corporate income tax and individual income tax which
will could be seen as an easing policy that will spur domestic spending within the US,
the Trade Policy of discarding the Trans-Pacific Partnership (TPP), changing current
trade agreements or anti-trade with China, which will bring volatility to world globali-
zation, the Immigration Policy building a border with Mexico to prevent illegal immi-
grants that will shrink the U.S. labor force and increase labor costs and the Climate
Change Policy of not believe in the global warming theory so he may thus abandon all
efforts towards promoting alternative energy (subsidies and supporting funds) while en-
couraging fossil fuel consumption. Overall, Trump's policies if implemented will put
the recovery of the U.S. economy at risk. However, it’s early to say the impact of the
9
policy because there are still some steps to follow before he actually takes over the Oval
Office in January 2017. Now that the public has voted, the electoral votes will be
counted and announced on January 6, 2017 with the official inauguration of the new
president on January 20, 2017. In the interim, he will select his cabinet and talk about
his policies.
1.3.1.6 Short term impact of Trump’s victory to Thailand: weak
commodities, baht weakness. While, Trump does not appear to have a specific stance
towards Thailand, the country’s economy faces downside risk if the new US president-
elect carries out his campaign promises to: 1) impose tariff barriers 2) withdraw military
support from key allies in the region (possibly leading to regional geopolitical realign-
ments) and 3) alter US energy policy. The most likely impact could come from possible
currency weakness and lower oil prices. However, reduced expectations of a US Fed
rate hike in December could offset some of the adverse impact. Also, Thailand’s direct
export exposure to the US is limited. Thus we do not think that Trump’s proposed poli-
cies will significantly impact the Thai economy.
1.3.2 Industry Analysis
1.3.2.1 Demand for refined products has been partly driven by
GDP growth. IEA expected global oil demand growth at 1.2 MBD in 2017 mainly driven
economic growth and cheap oil price boost. Based on information of IEA, EIA and IMF,
it can clearly seen that historical global oil demand has been partly driven by GDP
growth as shown in the graph; (Figure 1.6). During pre and post-crisis, world oil demand
grow around 2-3% a year on average within the level of GDP growth except the crisis
in the year 2008 and 2009 where the stagnant economy and recession during hamburger
crisis contracted oil demand growth. Furthermore in year 2010, the oil demand growth
is exceptionally high supported by Chinese economic boost after the global financial
crisis where Chinese GDP grew 10.3% yoy. Going forward, IEA expected global oil
demand growth at 1.2 MBD in 2017 mainly driven by economic growth (according to
IMF, world GDP is expected to grow 3.4% in 2017). Asia will be the region driving oil
demand growth at 0.7 MBD accounting for 60% of total world oil demand growth fol-
lowed by Middle East and U.S. of which oil demand growth is expected to grow around
10
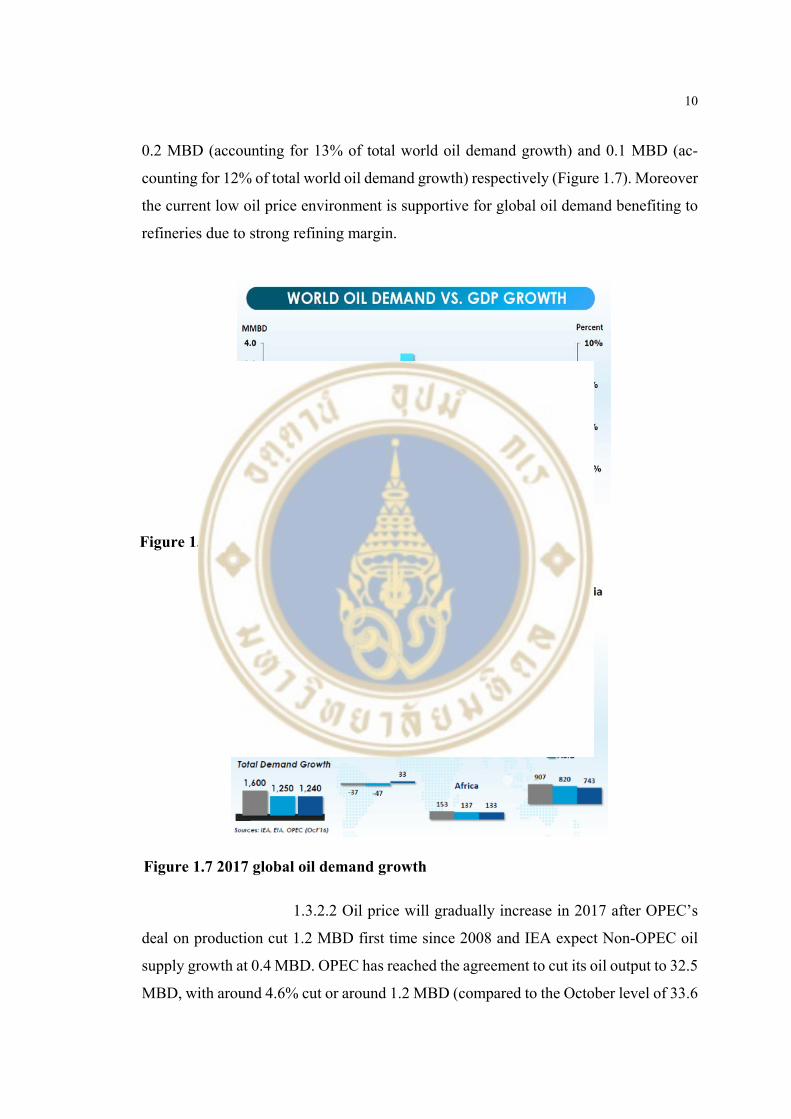
0.2 MBD (accounting for 13% of total world oil demand growth) and 0.1 MBD (ac-
counting for 12% of total world oil demand growth) respectively (Figure 1.7). Moreover
the current low oil price environment is supportive for global oil demand benefiting to
refineries due to strong refining margin.
1.3.2.2 Oil price will gradually increase in 2017 after OPEC’s
deal on production cut 1.2 MBD first time since 2008 and IEA expect Non-OPEC oil
supply growth at 0.4 MBD. OPEC has reached the agreement to cut its oil output to 32.5
MBD, with around 4.6% cut or around 1.2 MBD (compared to the October level of 33.6
Figure 1.6 World oil demand& GDP growth
Figure 1.7 2017 global oil demand growth
11
MBD) across OPEC producers except for Libya, Nigeria, Iran, and Indonesia, effective
1st of January 2017. The duration of this agreement is six months, extendable for an-
other six months to take into account prevailing market conditions and prospects. At the
next OPEC meeting 25 May 2017, the ministers will evaluate how well the group pro-
duction cut has worked to rebalance markets and whether an additional 6 months of
adjusted production is necessary. Moreover OPEC is expecting 600 KBD of incremental
production cuts from 8-10 non-OPEC producers, 300 KBD of which is expected from
Russia and that would be the next event to watch on 9 Dec; OPEC and non-OPEC con-
ference.
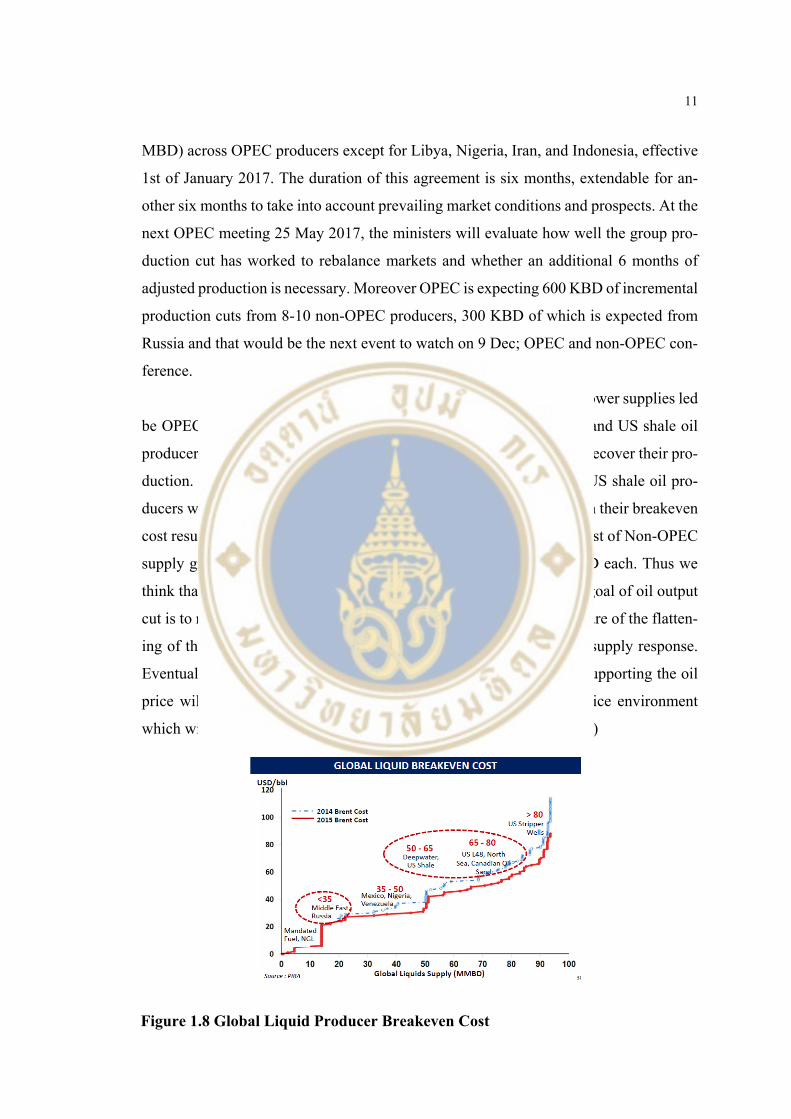
Oil price will be rebound as a consequence of lower supplies led
be OPEC’s production cut. Non OPEC supplies mainly from Russia and US shale oil
producers will take this higher price environment as an opportunity to recover their pro-
duction. Referring to global oil producer breakeven cost (Figure1.8),US shale oil pro-
ducers will be benefit when the oil price is above 50$/bbl it’s more than their breakeven
cost resulting in higher production. That’s in line with what IEA forecast of Non-OPEC
supply growth at 0.4 MBD led by US and Russia equally at 0.2 MBD each. Thus we
think that oil prices will not sustainably remain above $55/bbl, as the goal of oil output
cut is to normalize inventories, not high oil prices. OPEC might be aware of the flatten-
ing of the oil cost curve and the unprecedented velocity of the shale supply response.
Eventually, global oil demand and supply will rebalance in 1H2017 supporting the oil
price will gradually increase by then resulting in the still low oil price environment
which will be beneficial to oil demand and refinery margin. (Figure1.9)
Figure 1.8 Global Liquid Producer Breakeven Cost
12
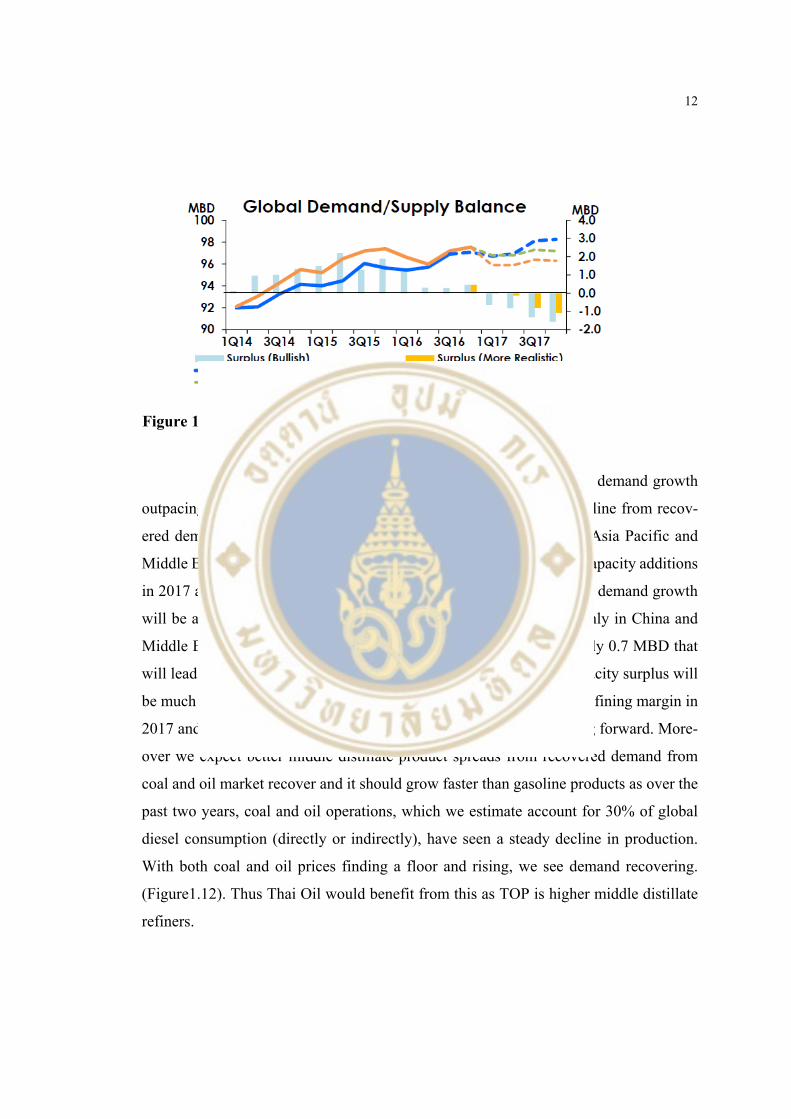
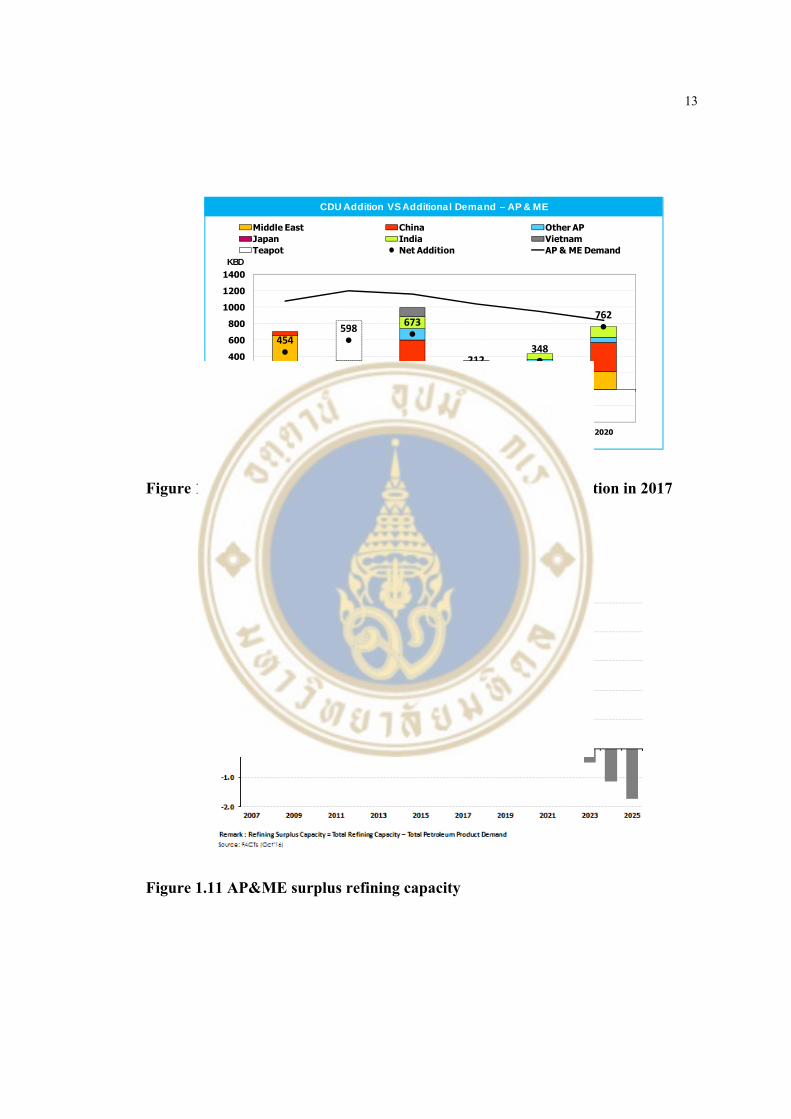
1.3.2.3 Stronger refining margin in 2017 from demand growth
outpacing refinery capacity addition and gasoil spread better off gasoline from recov-
ered demand. According to the FACT data (FACT Global Energy), Asia Pacific and
Middle East oil demand growth is expected to be outpace the refining capacity additions
in 2017 and going forward.(Figure1.10). It can clearly be seen that the demand growth
will be at almost 1.2 MBD while the refining capacity additions mainly in China and
Middle East netting off capacity closure in Japan will be approximately 0.7 MBD that
will lead to expected strong refining margin in 2017. The refinery capacity surplus will
be much lower in 2017 and in 4 years ahead (Figure1.11). Therefore refining margin in
2017 and in the near future is expected to be strong and improve going forward. More-
over we expect better middle distillate product spreads from recovered demand from
coal and oil market recover and it should grow faster than gasoline products as over the
past two years, coal and oil operations, which we estimate account for 30% of global
diesel consumption (directly or indirectly), have seen a steady decline in production.
With both coal and oil prices finding a floor and rising, we see demand recovering.
(Figure1.12). Thus Thai Oil would benefit from this as TOP is higher middle distillate
refiners.
Figure 1.9 Global Oil Demand and Supply Rebalance
13
Note: Adjusted capacity based on start-up period (effective additional capacity)
454598
673
212348
762
-400-200
0200400600800
100012001400
2015 2016 2017 2018 2019 2020
KBD
Middle East China Other APJapan India VietnamTeapot Net Addition AP & ME Demand
CDU Addition VS Additional Demand – AP & ME
Figure 1.10 AP&ME oil demand growth better than refinery addition in 2017
Figure 1.11 AP&ME surplus refining capacity
14
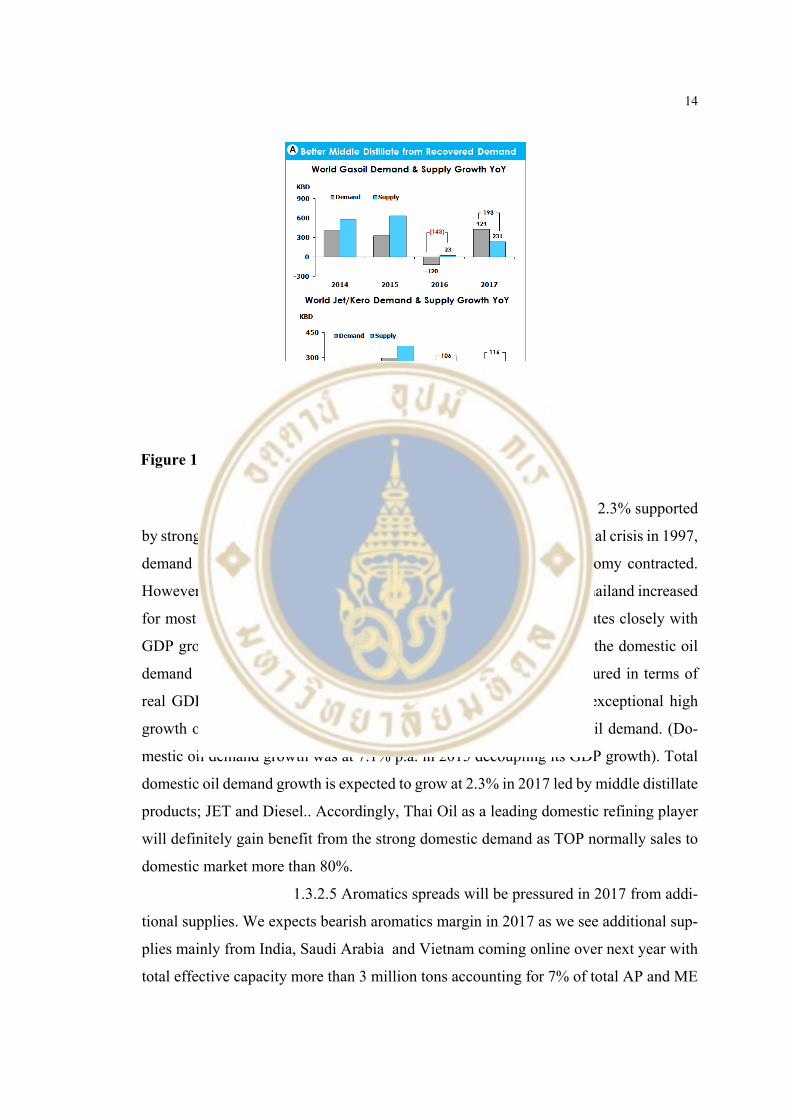
1.3.2.4 Healthy domestic oil demand growth at 2.3% supported
by strong economy. In the few years immediately after the Asian financial crisis in 1997,
demand for refined products in Thailand decreased as the Thai economy contracted.
However, from 2004 through 2015, refined products consumption in Thailand increased
for most of the years. This significant increase in consumption correlates closely with
GDP growth in Thailand. During the past period from 2011 to 2015, the domestic oil
demand growth was average at 4.4% p.a. while Thai economy, measured in terms of
real GDP, grew at a CAGR of 3.4%. That was including one-time exceptional high
growth of the domestic oil demand as low oil price attracting more oil demand. (Do-
mestic oil demand growth was at 7.1% p.a. in 2015 decoupling its GDP growth). Total
domestic oil demand growth is expected to grow at 2.3% in 2017 led by middle distillate
products; JET and Diesel.. Accordingly, Thai Oil as a leading domestic refining player
will definitely gain benefit from the strong domestic demand as TOP normally sales to
domestic market more than 80%.
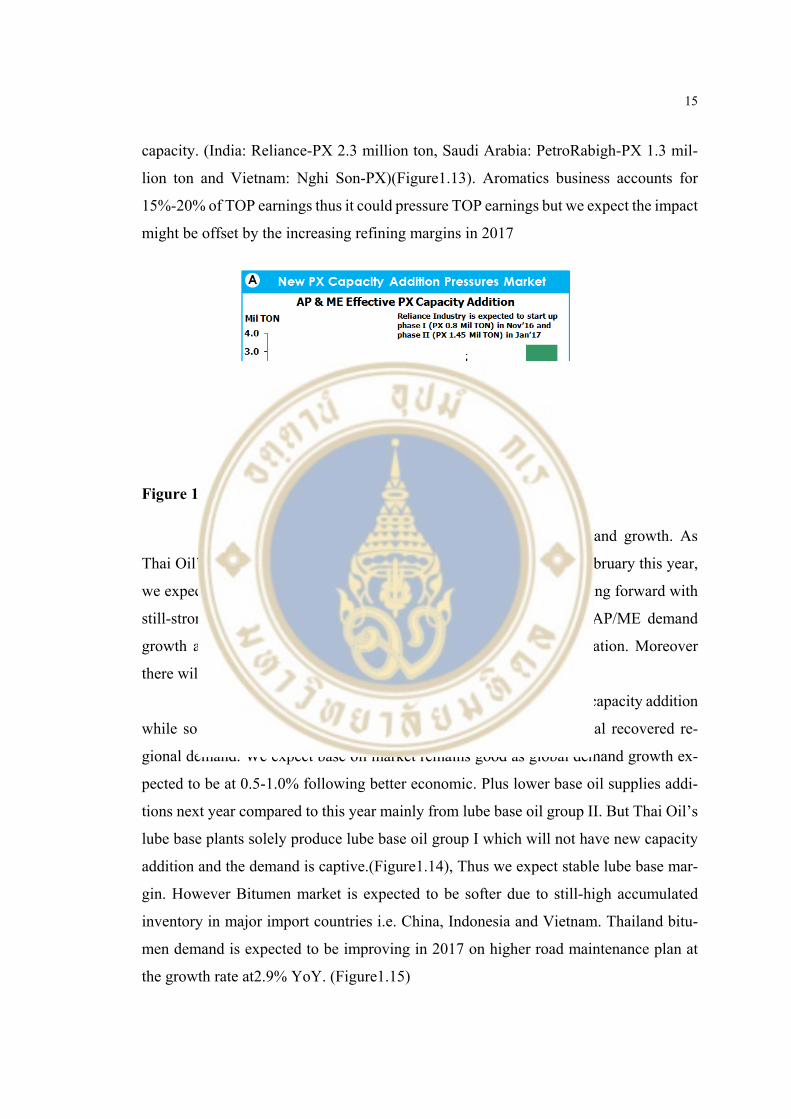
1.3.2.5 Aromatics spreads will be pressured in 2017 from addi-
tional supplies. We expects bearish aromatics margin in 2017 as we see additional sup-
plies mainly from India, Saudi Arabia and Vietnam coming online over next year with
total effective capacity more than 3 million tons accounting for 7% of total AP and ME
Figure 1.12 World middle distillate demand and supply growth
15
capacity. (India: Reliance-PX 2.3 million ton, Saudi Arabia: PetroRabigh-PX 1.3 mil-
lion ton and Vietnam: Nghi Son-PX)(Figure1.13). Aromatics business accounts for
15%-20% of TOP earnings thus it could pressure TOP earnings but we expect the impact
might be offset by the increasing refining margins in 2017
1.3.2.6 Stronger LAB market on steady demand growth. As
Thai Oil’s new business unit; LAB had successfully commission in February this year,
we expect the business unit will continuously contribute its margin going forward with
still-strong LAB market on steady demand growth. We see strong AP/ME demand
growth at 2.6% following better economic growth and higher population. Moreover
there will be no new plant startup in 2017.
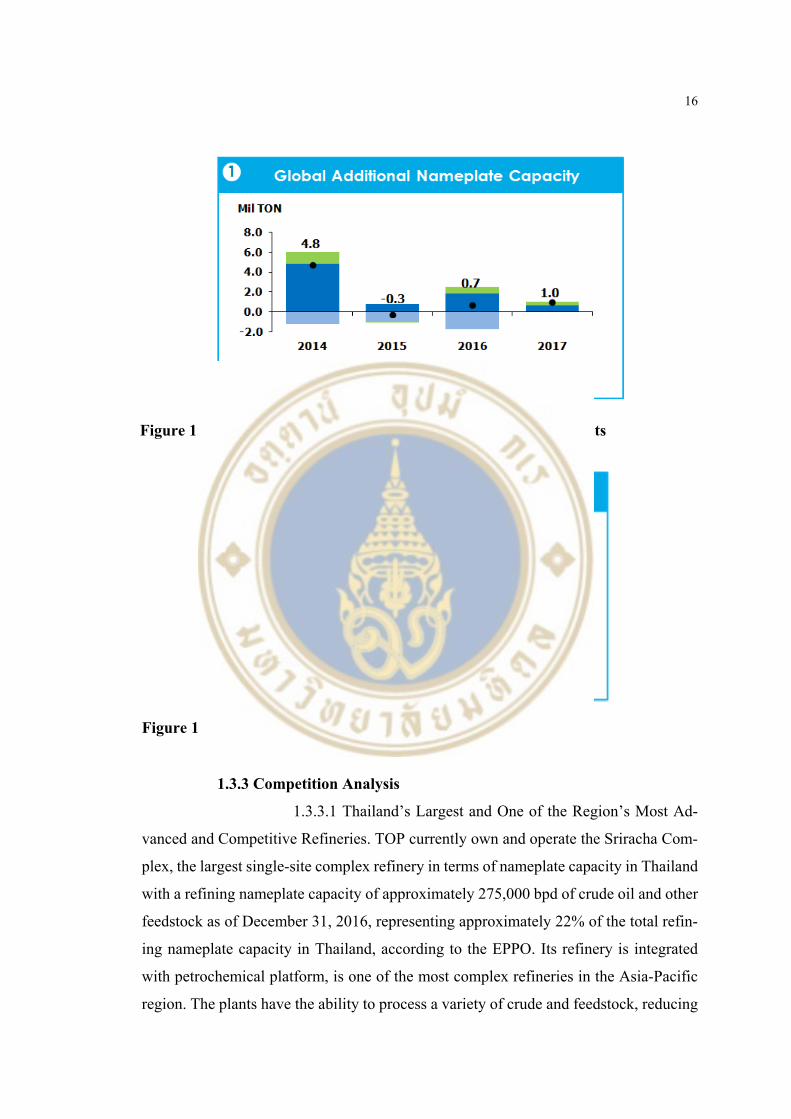
1.3.2.7 Stable Base Oil market on lower global capacity addition
while softer Bitumen market on accumulated inventory amid potential recovered re-
gional demand. We expect base oil market remains good as global demand growth ex-
pected to be at 0.5-1.0% following better economic. Plus lower base oil supplies addi-
tions next year compared to this year mainly from lube base oil group II. But Thai Oil’s
lube base plants solely produce lube base oil group I which will not have new capacity
addition and the demand is captive.(Figure1.14), Thus we expect stable lube base mar-
gin. However Bitumen market is expected to be softer due to still-high accumulated
inventory in major import countries i.e. China, Indonesia and Vietnam. Thailand bitu-
men demand is expected to be improving in 2017 on higher road maintenance plan at
the growth rate at2.9% YoY. (Figure1.15)
Figure 1.13 AP & ME Effective PX Capacity Additions
16
1.3.3 Competition Analysis
1.3.3.1 Thailand’s Largest and One of the Region’s Most Ad-
vanced and Competitive Refineries. TOP currently own and operate the Sriracha Com-
plex, the largest single-site complex refinery in terms of nameplate capacity in Thailand
with a refining nameplate capacity of approximately 275,000 bpd of crude oil and other
feedstock as of December 31, 2016, representing approximately 22% of the total refin-
ing nameplate capacity in Thailand, according to the EPPO. Its refinery is integrated
with petrochemical platform, is one of the most complex refineries in the Asia-Pacific
region. The plants have the ability to process a variety of crude and feedstock, reducing
Figure 1.14 Global additional nameplate capacity of lube base plants
Figure 1.15 Thai asphalt cement road maintenance plan
17
dependence on any given type of feedstock. This allows company to achieve efficient
production, thus minimizing both logistics costs and product wastage throughout the
production chain. It also benefit from ability to produce higher value-added petrochem-
ical products instead of selling those products in their intermediate stage at lower mar-
gins to the market. The technologically superior plant enables the company to produce
a more favorable products slate, with a focus on the more profitable middle distillates
and less on heavy oils which have lower profit margins. For example, in response to the
diminishing spreads for paraxylene and benzene, TOP could reduce the production of
paraxylene and benzene, and produced a greater quantity of other refined petroleum
products, such as unleaded gasoline 95 and gasohol, instead in order to minimize the
impact on profit margins as well as adjust its production proportions according to market
conditions.
1.3.3.2 Diversified Earnings through Integration with, and Sta-
ble Contribution from, their Subsidiaries. TOP diversified its business beyond oil petro-
leum refining, which is heavily affected by commodity pricing, the operations have been
expanded to a broad range of downstream products including petrochemical products,
lube base oil and its by-products, solvent products, surfactants 110 and ethanol, and
whose derivative products also in many cases enjoy higher profit margins. The company
benefit from diversified portfolio of businesses and products which enables the company
to reduce dependence on any one product. This could reduce earnings volatility and
increase operating margins. In addition, it also invested in support businesses, including
marine and pipeline transportation, power production and energy services. The ability
to produce or provide many of the services required for its businesses further reduce the
volatility of the price at which we can procure these at, thus improving operating mar-
gins.
1.3.3.3 Industry with High Natural Barriers to Entry and Strong
Market Positioning. Although there are no regulatory barriers preventing new entrants
from entering the Thai refining market, the significant investments required in the con-
struction of a new refinery, as well as the long lead times which would be required
before the new refinery becomes operational, means that the oil refinery industry is one
with high natural barriers to entry. Furthermore, TOP distributes products to various
long term customers under long term contracts, including PTT. We believe the long-
18
term customers and offtake relationships place the company in an advantageous position
compared with any new competitors.
1.4 Investment Summary 1.4.1 A valuable stock with sustainable growth to continue
With our analysis and our assumption, we expect an upside gain 13.7% at
our target price of 83.0 baht per share under DCF method. Thus we recommend BUY
on TOP. We think that TOP’s overall net profit will stay solid; given its rising refinery
earnings will offset the weaker non-refinery earnings i.e. petrochemical and lube base
earnings. Moreover we expect better contributions from completed projects such as
LAB and 2 small power plants which Thai Oil has successfully commissioning operated
in Q1/16 and Q2/16 respectively.
1.4.2 TOP as a regional and Thailand’s top tier refinery with low com-
petitive cash cost enables strong performance
As TOP’s past performance told, we strongly believe that TOP could de-
liver strong performance going forward due to 1) the reliability of TOP plants reflected
through stable high utilization rate even higher than Thailand’s industry average (Fig-
ure1.16), 2) TOP as one of the most complex refinery reflected through a top rank in the
Nelson index; refinery’s upgrading capability index for comparison. (Figure1.17), 3)
TOP’s low competitive cash operating cost considered as the first quartile in the Asia
Pacific region by Solomon Benchmarking (Figure1.19); TOP cash operating cost is only
1.4-1.5$/bbl lowest in Thai’s peers and much competitive than Korean & Indian refiners
of which the cost are around 2-3 $/bbl, Chinese refiners of which the cost are around 3-
4 $/bbl. Not to mention European/Russian refiners which were considered as high cost
players at around 4.5-5$/bbl (Figure1.18). All of those are critical success factors for
refinery to have competitive refining margins while low cash operating cost could defi-
nitely reduce risk of volatility of commodity prices. Thus we do like TOP stock despite
it is in volatile business.

19
Figure 1.16 TOP/Domestic refinery utilization rate
Figure 1.17 Nelson index graph-Regional comparisons
Figure 1.18 Cash Operating Cost of Regional Refineries

20
1.4.3 Buoyant GRM could be expected from a bright 2017 refinery out-
look with pro on Middle distillate spread
Singapore GRM has recently been rising to the level of 7-8 $/bbl as of av-
erage quarter 4-to-date from the low level in the previous quarter of 5 $/bbl that mainly
supported by winter demand and some plants maintenance in the region. Going forward,
we still believe that refinery margin could be strong and have some improvements which
could help offset softer outlook on petrochemical business as oil demand growth out-
pacing refinery capacity addition in Asia Pacific and Middle East. Moreover we have a
positive view on middle distillate; JET and gasoil, spread supported by recovered de-
mand in coal sector and strong recovered economy growth especially in Asia where
majority of demand growth exists. Thus it would benefit TOP as a middle distillate re-
finer.
1.4.4 Still strong domestic & CLMV demand benefits TOP as more
than 90% of sales goes to those markets
We believe in strong growth of oil demand in Thailand tracking with the
GDP growth. With the GDP’s growth forecast by BOT of 3.2% growth in 2017 driven
mainly by private consumption, public spending and expansion in tourism thus company
expect the oil demand growth of 2.3% which is quite conservative to us. The domestic
Figure 1.19 Solomon Benchmark

21
oil demand growth will be mainly led by middle distillate products; JET and Diesel
which is majority consumption in Thailand. (Figure1.20). Therefore, we think that TOP
as a leading domestic refining player will definitely gain benefit from the strong domes-
tic demand as TOP normally sales to domestic market more than 80%. Moreover with
the strong oil demand growth in CLMV forecasted to be 6.5% in 2017 (Figure1.21), that
would also an additional benefits to TOP as they sells to CLMV market around 7-9%
which is more or less the price is as same as what TOP sale in domestic market.
1.4.5 Discipline in attractive dividend payment on top of its potential
capital gain
We like TOP as one of companies who has discipline on dividend payment
to shareholders. Referring to TOP’s historical dividend payment although the policy set
a dividend payout is not less than 25%, T OP paid around 40-45% dividend payout ratio
or equivalent around 4-5% yield
1.5 Valuation (Multiples Method)
1.5.1 Valuation of TOP derives from FCFF
Figure 1.20 Thailand petroleum product demand
Figure 1.21 CMV oil demand growth
22
We evaluated TOP by using Discounted Cash Flow method, we are confi-
dent that the most appropriated method for TOP are the Free Cash Flow to
Firm(FCFF) which incorporate with the long term growth prospects and concrete cost
of debt from its corporate bond.
1.5.2 Discounted Cash Flow Model: Free Cash Flow to Firm (FCFF)
This technique is appropriate for TOP as the company has high growth pro-
spects and it takes in consideration the time value of money. TOP has the long term and
relative and stable debt structure. The model also accounted for future growth and long
term prospective. The target price based on this model is THB 83.0.
The primary components of our FCFF model are (1) 5-year forecasted cash
flow, (2) terminal value (3) capital expenditure, and (4) weighted average cost of capital.
1.5.3 5-year forecasted cash flow assumptions
The 5-year projected cash flows are obtained by increasing sale revenue,
which mainly derived from continuously increasing on price level. Economic growth is
the key driver of products demand while the supply side expected to be increase in
smaller level. This leads to a rise in product price, especially TOP’s three main busi-
nesses, which are refinery, aromatic and lube base.
1.5.4 Maintain strong margin
TOP is able to diversify its type of crude intake and product outputs to max-
imize demand and margin. Flexibility in crude intake allows diversification of crude
types to source cheaper crude and flexibility in product outputs by maximizing middle
distillates (jet and diesel) by adjusting production mode to capture domestic demand and
price premium. These support our confident that the firm is able to maintain the margin
at higher level
1.5.5 SG&A growth steady
Trend and historical data suggest steady growth of SG&A. Due to contin-
uously improvement of plant reliability and the fact that the firm has ability to control
its cost effectively, supports our belief that SG&A will be increased steadily. Apart from
23
the year of major turnaround (major turnaround every 5- 6 year, latest 2014, the next is
in 2019), the cost will be higher approximately 0.2$/bbl
1.5.6 Terminal value, discounted at 9.3%
We set stable growth rate to be less than the growth rate of the economy in
which a firm operates. 2017’s world GDP and Thailand GDP are expected to be 3.4%
and 3.2%, respectively while, the head line inflation rate is projected to be at 2%. We
apply the inflation rate at 2% as the stable growth rate which we believe that is appro-
priate.
1.5.7 Capital expenditure, CAPEX
The CAPEX is provided by the company with explicit plan on capital ex-
penditure. TOP’s CAPEX investments will cover improvements in plants reliability, ef-
ficiency and flexibility, environment and fuel efficiency improvement as well as value
chain enhancement. TOP has sufficient internal cash flow to fund their investment plans,
such as Jetty 7&8 improvements, lorry expansion and Benzene derivatives-LAB includ-
ing annual maintenance approximately 40 M$/year per year.
1.5.8 Weighted average cost of capital, WACC
For the cost of equity (Figure22), was calculated by CAPM model. We as-
sume risk-free rate of 2.57% from the 10-year government bond, the market return was
calculated by averaging monthly return of SET index. Finally, the beta of 0.90 which
we estimated by regressing monthly returns on stock against SET index. Accordingly,
we come across cost of equity at 12.31% along with 4.54% cost of debt and 20% tax
rate. The debt: equity weight is 34.6%:65.4%, WACC is 9.30%
1.5.9 Conclusion
We believe FCFF will reflect the intrinsic value of the company base on
gradual consistent growth. The fair price for TOP is THB 83.0. There is a clear signal
to BUY with 13.7% upside gain from the quote of THB 73.0, as at December 8,2016
24
1.6 Financial Analysis
1.6.1 Slightly soften market GIM plus stock losses but sustainable
growth to continue
The highlight of 3Q16 was stock losses of Baht 625m from stock gains
totaling Baht 4,362m posted in 2Q16. Stable-to-soft refining margin and lube base mar-
gin has weakened the market GIM (Gross integrated margin). Moreover, the major turn-
around of TLB plant not only reduces utilization from 84% to 62%, but also raised the
firm’s OPEX by US$0.1/bbl. However, aromatic business has relieved the downside in
total firm’s margin as a result of better PX margin and a newly LAB plant that help
added margin on aromatic business.
We expect the tighter supply and colder weather from La Nina effect in
4Q16 would strengthen GRM. The mega refineries have planned shutdowns (Yasref
with 400KBD and Ras Tanura with 550KBD), leading to tight supply. Meanwhile, re-
fined-product spreads would be higher, especially gas oil which has supported by strong
demand during winter. In addition, lube base utilization will be normalized after shut-
down in 3Q16. The demand growth outpacing refinery capacity addition is expected to
higher refinery margins in 2017.
1.6.2 Strong financial position and financial ratios
The company liquidity is supported by solid cash flow generation and good
access to capital markets and banks. It can generate EBITDA of THB 22,590 million
and THB 19,144 million for the nine-month period of the year 2016 and 2015, respec-
tively. As of 30 Sep 2016, 84% of total debt was in the form of debentured with an
outstanding principal amount of THB 62,647 million. Meanwhile, 16% was in the form
of long-term borrowings with an outstanding principal amount of THB 11,727 million.
Short-term borrowings of THB 988 million accounted for 1.3% of total
debt, while about 49.3% or THB 37,228 million had a maturity beyond five years as of
30 Sep 2016. TOP held cash and current investment of THB56, 425million. As of
30September 2016, interest coverage ratio stood at 7.8 time, net debt per equity stood at
0.2 times
25
1.6.3 Increasing cash flow along with revenues and margins
During nine-month period, the company generated positive cash flow from
operation and invested residual cash in short term investment. The CAPEX investments
were financed by long-term debt, the average debt life was 11.8 years. Dividend was
paid regularly based on annually performance. Finally, ending cash on hand demon-
strated its liquidity and availability of future investment.
1.6.4 Common size analysis
1.6.4.1 Income Statement: based on latest published financial
statement of 3Q16, it indicated that from 100% of total revenue, cost of goods sold is
the major proportion of TOP. Others expenses include depreciation, SG&A, tax account
for only 4%. Finally, the left portion is the net profit which was only 4.4% of total rev-
enue.
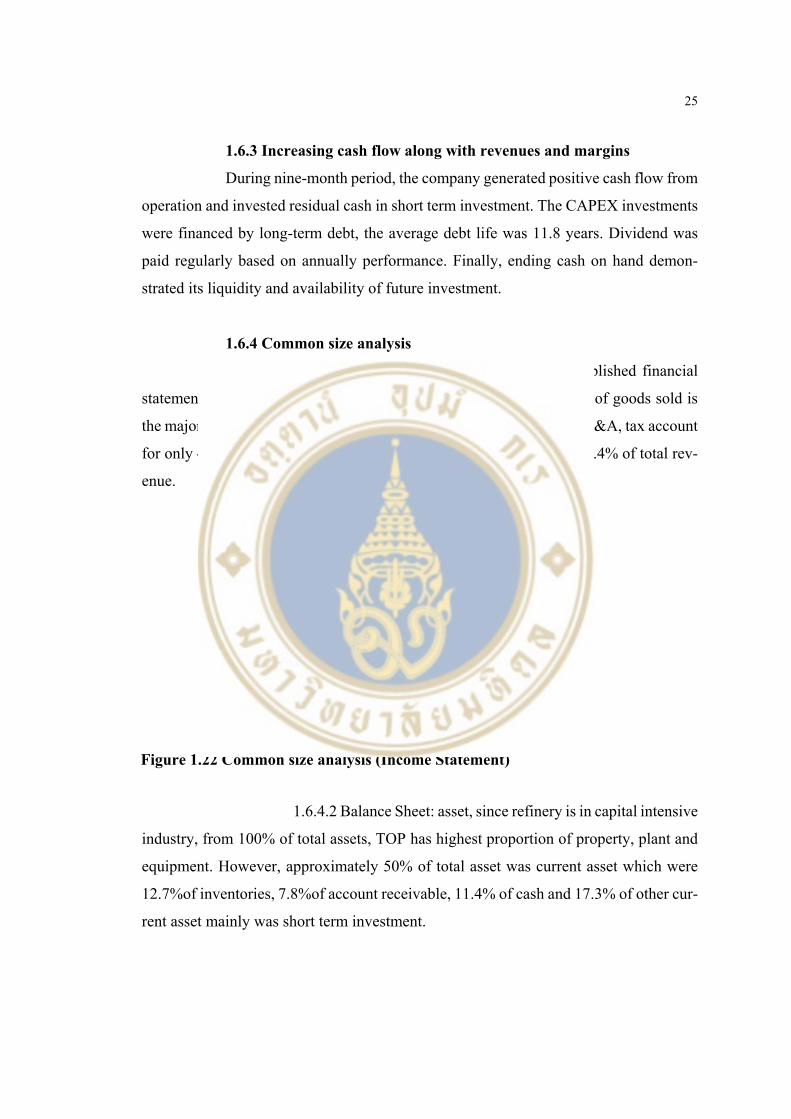
1.6.4.2 Balance Sheet: asset, since refinery is in capital intensive
industry, from 100% of total assets, TOP has highest proportion of property, plant and
equipment. However, approximately 50% of total asset was current asset which were
12.7%of inventories, 7.8%of account receivable, 11.4% of cash and 17.3% of other cur-
rent asset mainly was short term investment.
Figure 1.22 Common size analysis (Income Statement)
26
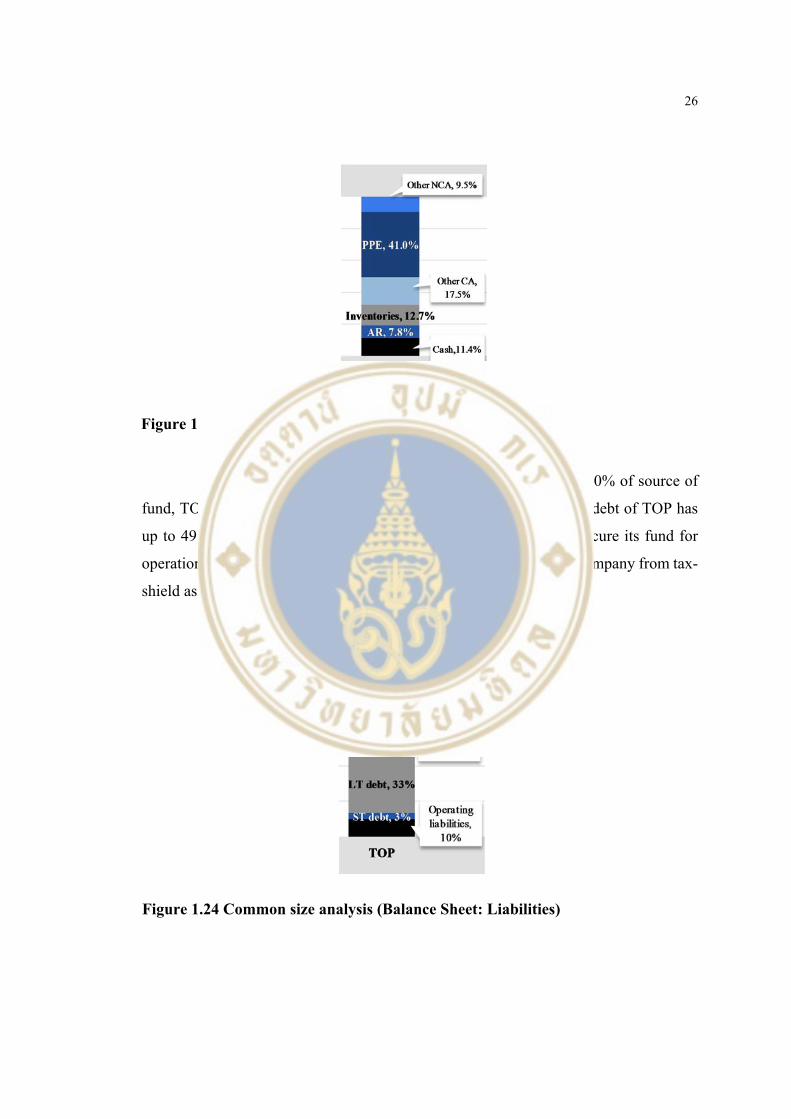
Liabilities and Equity: for capital structure, 100% of source of
fund, TOP has slightly higher portion of equity than debt. Long term debt of TOP has
up to 49.3% had a maturity beyond five years. This allow firm to secure its fund for
operation and future investment. Moreover, having debt benefits the company from tax-
shield as TOP has effective tax rate approximately 13%.
Figure 1.24 Common size analysis (Balance Sheet: Liabilities)
Figure 1.23 Common size analysis (Balance Sheet: Asset)
27
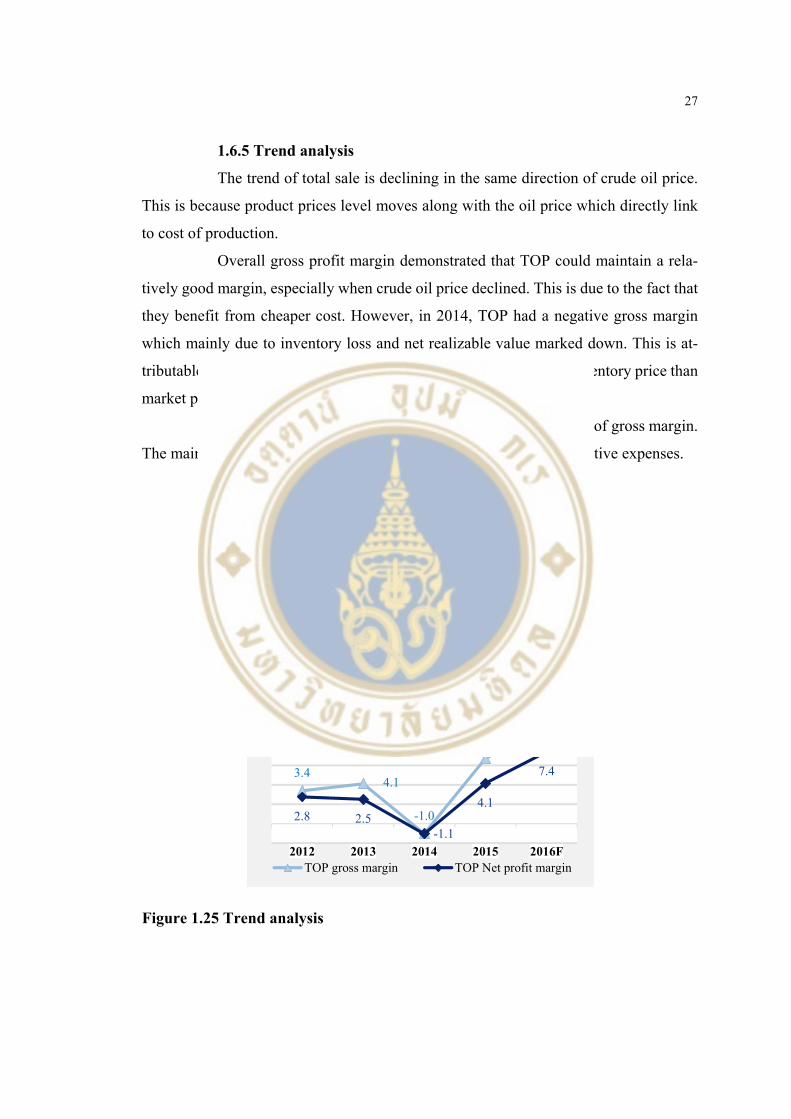
1.6.5 Trend analysis
The trend of total sale is declining in the same direction of crude oil price.
This is because product prices level moves along with the oil price which directly link
to cost of production.
Overall gross profit margin demonstrated that TOP could maintain a rela-
tively good margin, especially when crude oil price declined. This is due to the fact that
they benefit from cheaper cost. However, in 2014, TOP had a negative gross margin
which mainly due to inventory loss and net realizable value marked down. This is at-
tributable to a dramatically dropped in oil price that lead to a lower inventory price than
market price.
The trend of net profit margin moves in the same direction of gross margin.
The main expenses are depreciation and selling and general administrative expenses.
447415 390
294246
2012 2013 2014 2015 2016F
TOP Sale
3.44.1
-1.0
6.7
9.9
2.8 2.5-1.1
4.1
7.4
2012 2013 2014 2015 2016FTOP gross margin TOP Net profit margin
Figure 1.25 Trend analysis
28
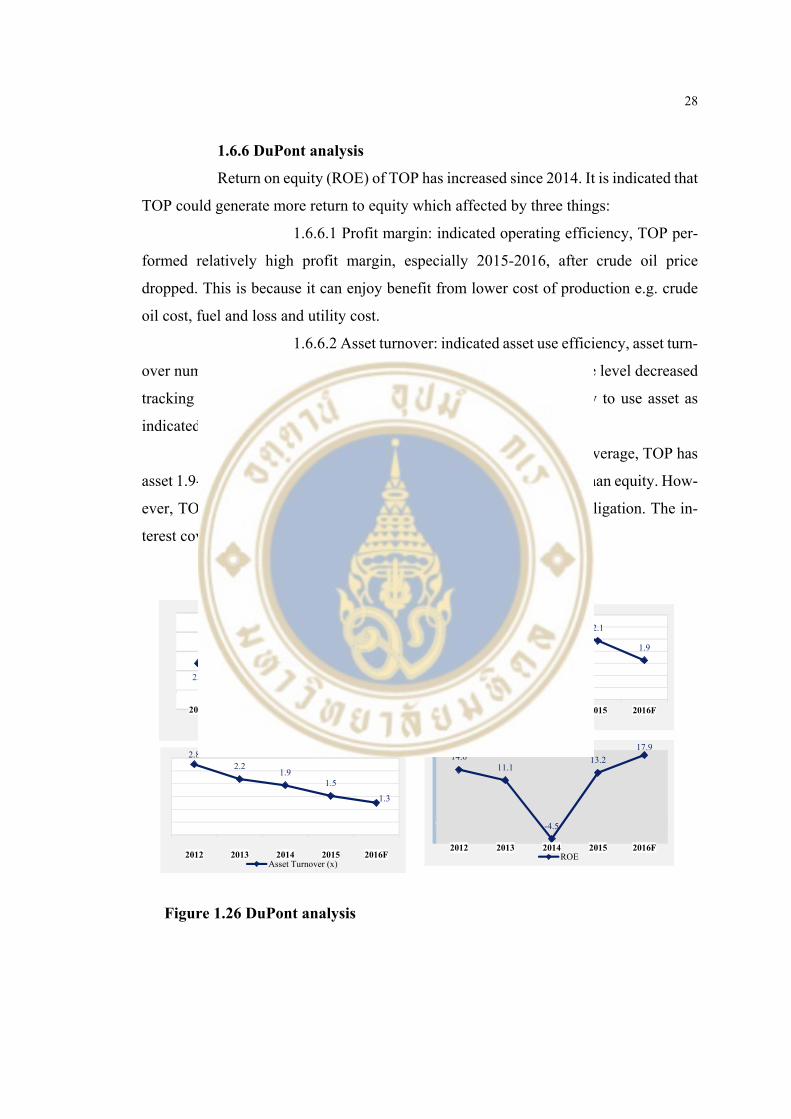
1.6.6 DuPont analysis
Return on equity (ROE) of TOP has increased since 2014. It is indicated that
TOP could generate more return to equity which affected by three things:
1.6.6.1 Profit margin: indicated operating efficiency, TOP per-
formed relatively high profit margin, especially 2015-2016, after crude oil price
dropped. This is because it can enjoy benefit from lower cost of production e.g. crude
oil cost, fuel and loss and utility cost.
1.6.6.2 Asset turnover: indicated asset use efficiency, asset turn-
over number tend to declined. It is mainly due to overall products price level decreased
tracking crude oil price. However, TOP could maintain its efficiency to use asset as
indicated in high level of production and sale volume.
1.6.6.3 Equity multiplier: indicated financial leverage, TOP has
asset 1.9-2.2 times of equity. It is because TOP financed by debt more than equity. How-
ever, TOP can control debt levels and has ability to meet financial obligation. The in-
terest coverage ratio during 2012-2016 is around 4-7 times.
2.82.2
1.91.5
1.3
2012 2013 2014 2015 2016FAsset Turnover (x)
2.8 2.5
-1.1
4.1
7.4
2012 2013 2014 2015 2016F
Net profit margin
1.9
2.0
2.2
2.1
1.9
2012 2013 2014 2015 2016FAsset/Equity
14.011.1
-4.5
13.2
17.9
2012 2013 2014 2015 2016FROE
Figure 1.26 DuPont analysis
29
1.7 Investment Risk
1.7.1 Risks
1.7.1.1 Fluctuations in prices of refinery and petrochemical
products or feedstock: the market prices of crude oil and other feedstock have been and
volatile and subjected to a variety of factors that are beyond control. These factors in-
clude 1) global and regional events and circumstances, as well as political developments
and instability in petroleum producing regions, such as the Middle East and Asia 2) the
ability of the Organization of Petroleum Exporting Countries (“OPEC”) and other pe-
troleum-producing nations to set and maintain production levels and influence market
prices 3) market prices and supply and demand of crude oil, feedstock, natural gas, re-
fined petroleum products and substitute energy sources
1.7.1.2 Cyclical and highly competitive nature of business: his-
torically, the refining and petrochemical industries have experienced alternating periods
of tight supply, resulting in increased prices and profit margins, followed by periods of
substantial capacity addition, resulting in oversupply and reduced prices and profit mar-
gins. The refining industry is highly competitive with respect to the sale of refined pe-
troleum products in the Thai domestic, regional and global markets. TOP principal com-
petitors include other major domestic petroleum refiners as well as other global refiners
who export products into the regional and domestic markets in the refined petroleum
products business.
1.7.1.3 Fluctuations in the value of the Baht against foreign cur-
rencies: substantially all of revenues and crude oil and feedstock costs are denominated
in U.S.dollars and translated into Baht for inclusion in our financial statements. As a
result, fluctuations in the value of the Baht against the U.S. dollar may adversely affect
our financial condition and results of operations. Any depreciation of the Baht against
foreign currencies, primarily the U.S. dollar, materially affects the results of operations
because the purchase crude oil and other raw materials and equipment and services are
denominated primarily in U.S. dollars as well as the interest and principal payment on
U.S. currency-denominated debt.

30
1.7.1.4 Heavily dependent on PTT: TOP is heavily dependent
on its relationship with PTT as supplier (source approximately 50% of crude oil), cus-
tomer (accounting for 45% of total revenue) and major shareholder (own 49.1%of total
shares). Any changes in these relationships may materially and adversely affect to the
company. PTT could have the ability to control management and administration in par-
ticular, the nomination of directors to be appointed by the annual general meeting of
shareholders and the nomination of certain executive officers to be appointed by the
board of directors.
We have also develop risk assessment through a risk matrix de-
fining various levels of risk which will impact to company and likelihood of such events
are going to happen as well as how well company have their mitigation plan in order to
narrowing chances and impacts from those risk. (Table 1.1 Risk Matrix), (Table 1.2 Key
Risks Factors and Mitigations)
Table 1.1 Risk Matrix

31
Table 1.1 Risk Matrix (cont.)
Table 1.2 Key Risks Factors and Mitigations
Key Risk Factors & Mitigations
Key Risk Factors Mitigation
1 Fluctuations in prices of refinery and
petrochemical products or feedstock
• Commodity hedging
• Operational excellence by diversify crude types, perform flexible operation, control
competitive cash cost
2 Cyclical and highly competitive nature of
business
• Diversify business portfolio i.e. expand to value chain enhancement business such
petrochemical and lube base oil, expand to more downstream product such LAB (Linea Alkyl
Benzene), invest in less volatile business such power plants which has Power Purchase
Agreement with EGAT as a earning stability segment for company’s portfolio
• Operational Excellence ensuring reliable operation to produce on-spec product and to avoid
unplanned shutdown from accidents causing delayed shipments to customers
3 Fluctuations in the value of the Baht against
foreign currencies
• Adapt natural hedge policy to minimize the effects of foreign currency fluctuations on their gross refining margins and product-to-feedstock margins by having foreign currency borrowings, entering into short term forward contracts and currency swaps to manage exposure to fluctuations in foreign currencies on short term trade payables and receivables
4 Heavily dependent on PTT • Enter into short and long term crude oil supply contracts with other major oil companies, suchas Shell Thailand and Chevron, and procure feedstock from short-term suppliers and on the spot market.
• Make sales to PTT under long-term off take agreements with minimum off takecommitments.
32
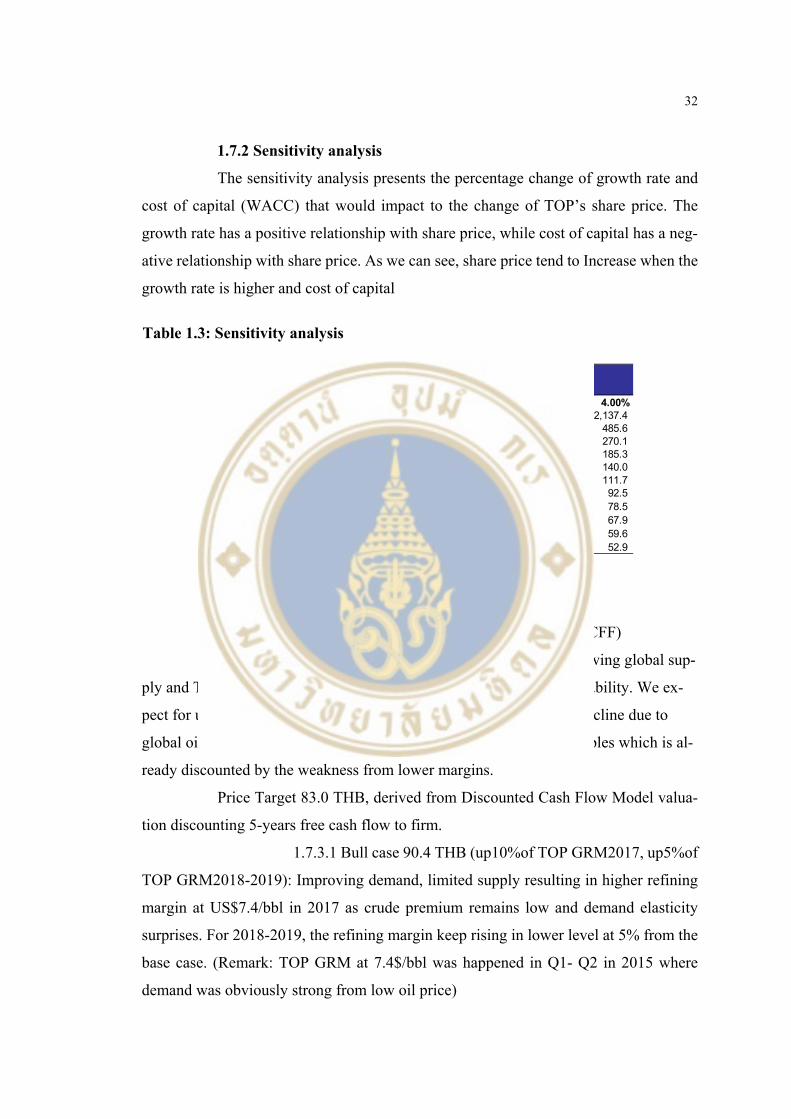
1.7.2 Sensitivity analysis
The sensitivity analysis presents the percentage change of growth rate and
cost of capital (WACC) that would impact to the change of TOP’s share price. The
growth rate has a positive relationship with share price, while cost of capital has a neg-
ative relationship with share price. As we can see, share price tend to Increase when the
growth rate is higher and cost of capital
1.7.3 Scenario analysis
Discounted Cash Flow Model: Free Cash Flow to Firm (FCFF)
We believe that TOP could have upside potential from slowing global sup-
ply and TOP’s gross profit will improve due to better earnings sustainability. We ex-
pect for upside potential for refining margins as crude oil premiums decline due to
global oil supply glut. Moreover TOP stock is trading at the low multiples which is al-
ready discounted by the weakness from lower margins.
Price Target 83.0 THB, derived from Discounted Cash Flow Model valua-
tion discounting 5-years free cash flow to firm.
1.7.3.1 Bull case 90.4 THB (up10%of TOP GRM2017, up5%of
TOP GRM2018-2019): Improving demand, limited supply resulting in higher refining
margin at US$7.4/bbl in 2017 as crude premium remains low and demand elasticity
surprises. For 2018-2019, the refining margin keep rising in lower level at 5% from the
base case. (Remark: TOP GRM at 7.4$/bbl was happened in Q1- Q2 in 2015 where
demand was obviously strong from low oil price)
83.0 0% 1.00% 2.00% 3.00% 4.00%4.3% 157.0 202.0 286.1 499.7 2,137.45.3% 125.2 152.5 196.2 278.0 485.66.3% 103.6 121.7 148.1 190.7 270.17.3% 87.9 100.7 118.2 144.0 185.38.3% 76.0 85.4 97.8 114.9 140.0
%WACC 9.3% 66.7 73.9 83.0 95.1 111.710.3% 59.2 64.8 71.8 80.7 92.511.3% 53.0 57.6 63.0 69.8 78.512.3% 47.9 51.6 56.0 61.3 67.913.3% 43.5 46.6 50.1 54.4 59.614.3% 39.8 42.3 45.3 48.8 52.9
Price per share (THB)
%Growth
Table 1.3: Sensitivity analysis
33
1.7.3.2 Base case 83.0 THB: refining margin could be strong at
US$6.7/bbl in 2017 (we expect upside from Y2016 as the trough was behind, PX spread
(PX-ULG95) of US$280/ton in 2017 as additional supply, lube oil margin is expected
to be stable as lower global capacity addition.
1.7.3.3 Bear case 67.5 THB: weaker global economy leads to
lower product demand hence it will impact to lower refining margin at cash cost level
of US$4.0/bbl in 2017, and declined by 10% of the base case during 2018-2019.
For our scenario analysis through discounted cash flow model
valuation could be concluded that in improving demand and limited supply conditions,
TOP share price could have an upside 9% from our target price in Bull case since .
While, in weaker global economy, the share price could be fallen by 19% from the target
price in Bear case.
34
CHAPTER II
DATA
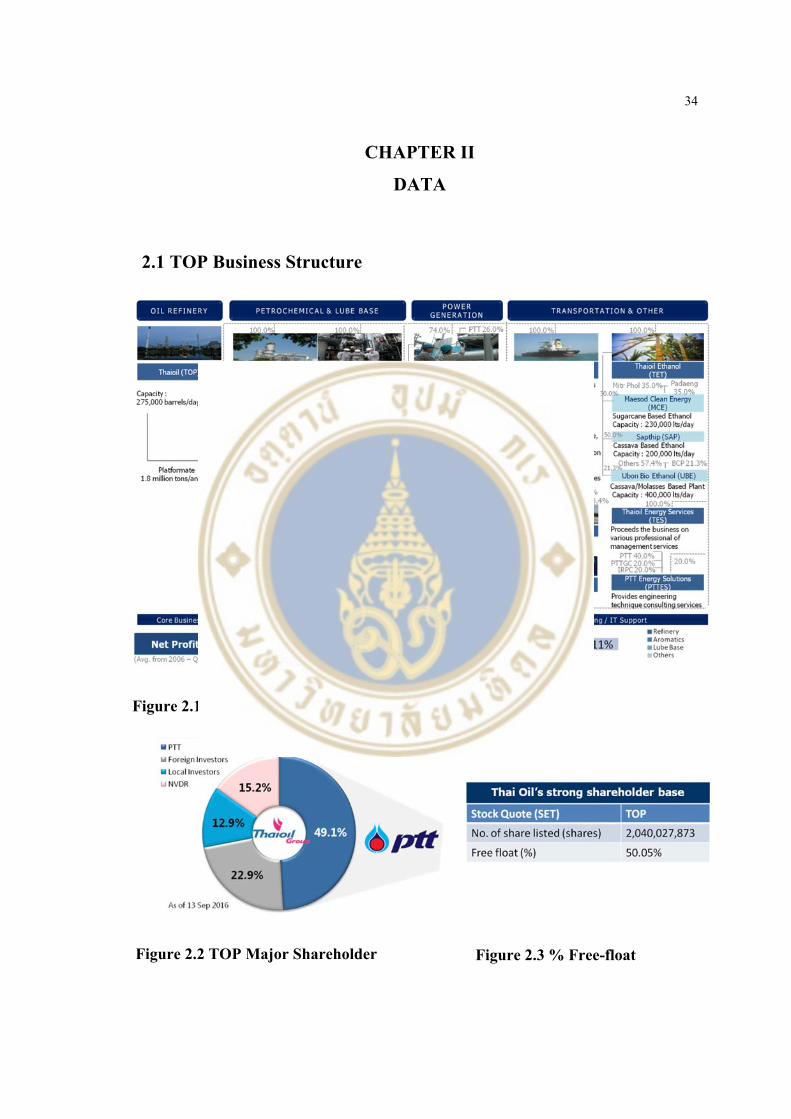
2.1 TOP Business Structure
Figure 2.1 TOP business structures as of 30 September 2016
Figure 2.2 TOP Major Shareholder Figure 2.3 % Free-float

35
Table 2.1 Board of directors
36
2.2 SWOT Analysis
2.2.1 Strengths
2.2.1.1 Thailand’s largest and one of the region’s most advanced
and competitive refineries: Thai Oil has refining nameplate capacity of approximately
275,000 bpd of crude oil and other feedstock as of representing approximately 22% of
the total refining nameplate capacity in Thailand of 1,251,500 bpd, according to the
EPPO.(Largest in Thailand). Thai Oil refinery, which is integrated with petrochemical
platform, is one of the most complex refineries in the Asia-Pacific region, with an aver-
age complexity of 9.8 based on our internal estimates using the methodology of the
Nelson Complexity Index. The Nelson Complexity Index measures a refinery’s upgrad-
ing capability, with the ratio representing the complexity of barrels divided by crude
distillation nameplate capacity. Thai Oil plants have the ability to process a variety of
crude and feedstock, reducing our dependence on any given type of feedstock. This al-
lows them to achieve efficient production, thus minimizing both logistics costs and
product wastage throughout the production chain.
Thai Oil also benefit from their ability to produce higher value-
added petrochemical products instead of selling those products in their intermediate
stage at lower margins to the market. For example, they have been able to utilize the
platformate generated in the oil refinery to produce petrochemical products, including
paraxylene and benzene during periods where the market prices for such products
yielded higher margins than other products. While their various units and plants are
integrated with each other, they can also operate independently, allowing them the abil-
ity to adjust their production proportions according to market conditions, as well as to
more efficiently manage their maintenance schedules to minimize the impact to their
operations. They have three CDUs, which allow them to co-ordinate the maintenance of
the CDUs without needing to halt their refining process. Therefore, their plants have
been able to maintain higher utilization rates than other plants in the market. For exam-
ple, the capacity utilization rate of their refinery was 101.8%, 97.9%, and 107.5% for
the years ended December 31, 2013, 2014, and 2015, respectively.
37
2.2.1.2 Diversified earnings through integration with, and sig-
nificant contribution from, their subsidiaries: in order to diversify their business beyond
oil petroleum refining, which is heavily affected by commodity pricing, they have ex-
panded their operations to a broad range of downstream products including petrochem-
ical products, lube base oil and its by-products, solvent products, surfactants and etha-
nol, and related derivative products which in many cases enjoy higher profit margins.
The diversification enables them to reduce their dependence on any one product. This
allows them to reduce earnings volatility and increase operating margins. In addition,
they have also invested in support businesses, including marine and pipeline transpor-
tation, power production and energy services.
2.2.1.3 Strategic relationship and operational integration with
PTT as the Group’s principal refiner: PTT, a Thai state-owned entity and Thailand’s
national oil company, is a long-term shareholder with a 49.1% interest in the Company.
PTT purchases a substantial portion of its requirements at prevailing market prices from
them. Thai Oil is the PTT Group’s principal refiner. PTT’s dual role as their major
shareholder and key business partner has resulted in a mutually beneficial business part-
nership covering, amongst others, crude oil production and product offtake. They also
enjoy operational synergies as part of the PTT Group, including the reduction of freight
costs in the purchase of larger quantities of crude oil and other feedstock and the transfer
of knowledge and shared services. They are also able to take advantage of PTT’s exper-
tise and contacts. For example, they have been able to obtain crude oil that is originally
derived from sources which would otherwise not be available to them.
2.2.1.4 Strategic location with competitive advantages in access
to key markets: the refinery plants are located within the Sriracha Complex. Their SBM
provides direct access to deep water ports, and the ability to receive crude oil and other
feedstock directly from VLCC, thereby enabling them to reduce freight costs and in-
crease feedstock offloading efficiency. This strategic location provides them with key
competitive advantages as it puts them in close proximity with the key domestic markets
such as Bangkok, and a number of their key suppliers and customers in other parts of
Thailand. They also enjoy available connections to delivery networks such as multi-
product pipelines, including Thappline, a major pipeline operator, which transports a
38
substantial portion of their products. This allows them to minimize feedstock and prod-
uct transportation costs, enabling them to receive feedstock from their suppliers and
deliver end-products to their customers in a timely and cost-effective manner.
2.2.1.5 Industry with high barriers to entry and strong market
positioning: although there are no regulatory barriers preventing new entrants from en-
tering the Thai refining market, the significant investments required in the construction
of a new refinery, as well as the long lead times which would be required before the new
refinery becomes operational, means that the oil refinery industry is one with high nat-
ural barriers to entry. Furthermore, they distribute their products to various long term
customers under long term contracts, including PTT, with whom they have guaranteed
off take arrangements. Their long-term customers and off take relationships place them
in an advantageous position compared with any new competitors.
2.2.1.6 Technological superiority, logistical advantages & cost
leadership: their technological superiority; actively partner with industry leaders and
pursue their own research and development initiatives to improve their technologies.
They have collaborated with the Petroleum and Petrochemical College (“PPC”) and
Chulalongkorn University to establish research and development center located in the
PPC. One of their R&D initiatives helped them improve their operations. For example,
they successfully improved the preheat train mechanism for their CDU-3 based on re-
sults from their R&D projects. Their logistical advantages provided by our wholly-
owned subsidiary, Thaioil Marine as their marketing arm. Thaioil Marine owned four
oil product and petrochemical tankers with a combined capacity of 48,850 deadweight
tons. They also operate other oil and chemical transportation units through their other
subsidiaries and joint ventures, such as TOP Maritime and Thaioil Marine International
Pte.Ltd. It aims to become a fleet leader for PTT Group and in Asia to support the grow-
ing petroleum and petrochemical market by expanding our fleet size which will provide
them with logistical advantages over their competitors. In addition, as Thai Oil is fully
integrated refinery with petrochemical and lube base, they can operate as an optimiza-
tion among each unit. Their feedstock slate is more flexible than those of their compet-
itors’ that have less complex refineries and plants. Their refinery and production units
are therefore able to take advantage of more cost-effective feedstock, as well as changes
in market conditions, and they are able to benefit from optimization of their product mix
39
and incremental gross margin opportunities for their refinery and production units.
While they are able to share their costs and lower their cost required to process each
barrel of feedstock. Their average integrated cash costs were US$2.2/bbl as of nine
month 2016.
2.2.1.7 Highly experienced management team: their senior man-
agement team is highly experienced and has a proven track record in the refining and
petrochemical related industries. The most senior members of their executive manage-
ment as of December 31,2015, Mr. Atikom Terbsiri, Mr. Mitri Reodacha, Mr. Somchai
Wongwattanasan, Mr. Kosol Pimthanothai, Mr. Chatapong Wungtanagorn, Ms. Pat-
taralada Sa ngasang, Mr. Surachai Saengsamran, Mr. Bandhit Thamprajamchit and Mr.
Viroj Meenaphant, have an average of over 30 years of experience in the Thai refinery
and petrochemical related industries and within the PTT Group.
2.2.1.8 Strong financial profile: Thai Oil liquidity is supported
by solid cash flow generation and good access to capital markets and banks. They gen-
erated EBITDA of THB25,491.7 million (US$740.2 million) and THB 22,590.2 million
for the years ended December 31,2015 and nine month ended September 30, 2016 re-
spectively. As of September 30, 2016, 84.3% of their total debt was in the form of de-
bentures with an outstanding principal amount of THB 62,647.0 million (US$1,796.3
million) while 15.7% was in the form of long-term borrowings with an outstanding prin-
cipal amount of THB11,727.0 million (US$336.3 million). Short-term borrowings of
THB 1,184.0 million (US$33.9 million) accounted for 1.6% of our total debt, while
about 72.3% of the debt had a maturity beyond five years as of September 30, 2016.They
held cash and current investments of THB 56,425.0 million (US$1,617.7 million) as of
September 30, 2016 compared with THB 7,967.2 million (US$228.0 million) of debt
maturing by September 30, 2017. Their EBITDA interest coverage ratio, where interest
coverage is equal to EBITDA for any period divided by finance costs during such pe-
riod, stood at 8.9 times as of September 30, 2016 . Thai Oil adopt a conservative treasury
policy of capping net debt divided by EBITDA at under 2.0 times and net debt divided
by equity at under 1.0 times. Net debt, or total interest bearing debt net of cash and cash
equivalents and current investments, divided by EBITDA stood at 0.7 times as of Sep-
tember 30, 2016. Net debt divided by equity stood at 0.2 times as of September 30, 2016
40
2.2.2 Weakness
2.2.2.1 Single-site refinery presents operating risk: Thai Oil
plants as a single-site refineries are located in the same area of Sriracha. This is classi-
fied as an operating risk, if there’s extremely hazardous events happened in that site, it
may affect to the whole business of the refining company. However Thai Oil can par-
tially close some risk of having 3 CDUs (Crude Distillation Unit) allowing them to take
turn for shut down operation that will less effects to the company.
2.2.2.2 Volatile industry, exposure to inherent volatility in the
refining and petrochemical markets: cyclicality in the refining and petrochemical indus-
tries may result in reduced volumes or operating margins, and volatile margins in the
refining and petrochemical industries and uncertainty regarding the global economic
recovery could have a material adverse effect on them in the future. Moreover fluctua-
tions in market prices of crude oil and other feedstock, as well as refined petroleum
products or petrochemical products, may affect their results of operations.
2.2.2.3 Limited staff competent in news business: they may not
be successful in developing new businesses, including our ethanol, starch, biogas or
such start-up business. The start-up and initial operations of new production plants are
typically affected by adjustment and other operational challenges which can delay the
commencement of full production, require production slowdown or shut downs, and
result in higher than expected production costs. The risk that any of these circumstances
may occur is higher where, as in our case, we have limited trained staff and management
with experience in the ethanol, starch, biogas, whether on our own or together with joint
venture partners.
2.2.2.4 Heavily dependent on their relationship with PTT as
their supplier, customer and major shareholder: any changes in these relationships may
materially and adversely affect Thai oil as PTT is their largest customer by revenue,
accounting for 49.2% of total sales revenue in the nine month ended September, 2016.
As a result, they will be affected by a reduction in or loss of sales to PTT or changes in
its financial condition or operations. However Thai Oil have entered into the the product
offtake and crude oil supply agreement (the “POCSA”) with PTT. The POCSA does not
contain a termination date but may be terminated after July 2024, in addition to other
41
causes, by either party with 12 months prior written notice of termination to the other
party.
2.2.2.5 Capital intensive business and their expansion plans
have significant capital expenditures and financing requirements, which are subject to a
number of risks and uncertainties: the refining and petrochemical industries are capital
intensive. Their ability to maintain and increase their revenues and net profits is partially
dependent upon continued capital spending, including investing in, constructing, up-
grading and maintaining their facilities. In addition, they continuously monitor develop-
ments in the refining and petrochemical products markets in Thailand, Southeast Asia,
East Asia and elsewhere for opportunities to expand into new businesses or invest in
derivative uses of their refinery and petrochemical production. Any future expansion of
their business, including their planned expansion projects, will require additional capital
expenditures, which may be substantial.
2.2.2.6 Feedstock supply dependency: Thai Oil is dependent on
foreign sources for their supply of crude oil and other feedstock, in particular from the
Middle East, and any disruption in their supply of crude oil and other feedstock could
reduce their margins and materially adversely affect their results of operations. The sup-
ply of imported crude oil and other feedstock is subject to a variety of factors that are
beyond their control, including the political developments and instability in petroleum
producing regions, in particular in the Middle East, government regulations with respect
to oil and energy industries in those regions, import tariffs and other restrictions, weather
conditions and overall economic conditions in those regions.
2.2.3 Opportunities
2.2.3.1 Growing AEC and CLMV oil markets so we can en-
hance growth through geographic expansion to develop new markets and collaboration
with our customers: according to growing oil demand in AEC and CLMV countries
shown in the graph (Figure 2.4 AEC Oil Demand Growth), it’s clearly seen that AEC
oil demand growth is expected to grow approximately grow rate at 6% p.a. in the future
while CLMV oil demand growth is expected to be approximately 2-3% p.a. It is a great
opportunities for Thai oil to take advantages of the strong growth prospect in the AEC
market. Moreover for the CLMV market, Thai Oil exports their petroleum products to
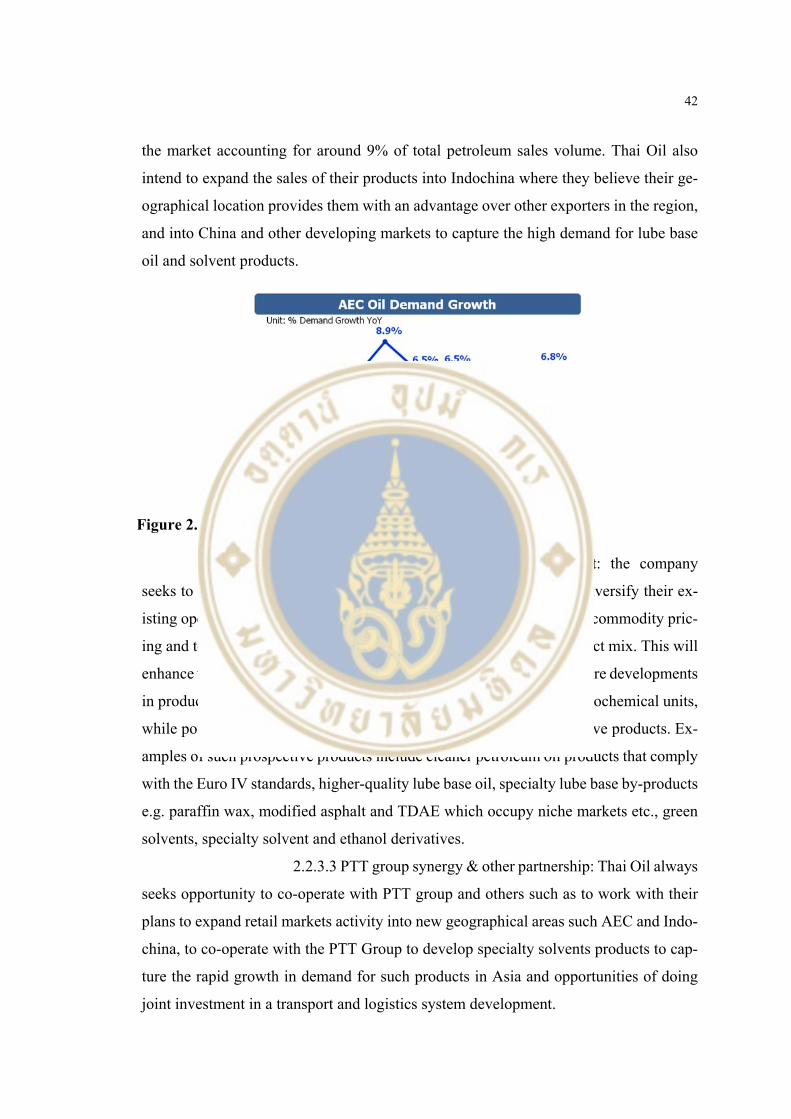
42
the market accounting for around 9% of total petroleum sales volume. Thai Oil also
intend to expand the sales of their products into Indochina where they believe their ge-
ographical location provides them with an advantage over other exporters in the region,
and into China and other developing markets to capture the high demand for lube base
oil and solvent products.
2.2.3.2 Specialties/Value chain enhancement: the company
seeks to expand their product offerings across their business unit to diversify their ex-
isting operations from petroleum refining which is heavily affected by commodity pric-
ing and to introduce new products with higher margins into their product mix. This will
enhance their competitiveness by improving their ability to adapt to future developments
in product demand, as well as further integrating their refinery and petrochemical units,
while potentially providing them with higher returns from new attractive products. Ex-
amples of such prospective products include cleaner petroleum oil products that comply
with the Euro IV standards, higher-quality lube base oil, specialty lube base by-products
e.g. paraffin wax, modified asphalt and TDAE which occupy niche markets etc., green
solvents, specialty solvent and ethanol derivatives.
2.2.3.3 PTT group synergy & other partnership: Thai Oil always
seeks opportunity to co-operate with PTT group and others such as to work with their
plans to expand retail markets activity into new geographical areas such AEC and Indo-
china, to co-operate with the PTT Group to develop specialty solvents products to cap-
ture the rapid growth in demand for such products in Asia and opportunities of doing
joint investment in a transport and logistics system development.
Figure 2.4 AEC Oil demand growth
43
2.2.3.4 M&A / International investment
2.2.4 Threat
2.2.4.1 Surplus supply and pressured demand: this will deterio-
rate overall refining margin resulting in narrowing profit of the company. However the
players who have lean operating cost will be the one who have got less impact and fi-
nally will be the last man standing in the business. Thus Thai Oil always takes it seri-
ously to maintain their low competitive cash cost in order to remain competitive in the
business. In addition, it is unable to predict with certainty future supply and demand
balances, market conditions and other factors that may affect operating margins. The
company may reduce production at or leave idle a facility or a particular unit at a facility
for an extended period of time, discontinue a product line because of an oversupply of
a particular product and/or a lack of demand for that particular product, or high feed-
stock prices that make production uneconomical, which may have a material adverse
effect on our results of operations.
2.2.4.2 New world scale / Competitive refineries: although
there’s no refineries expansion in Thailand, it’s not the case for regional refineries and
global refineries keep upgrading and expanding refining capacities being competitive in
the market. For example, regional peer refinery like S-Oil is in the process of upgrading
their units; RFCC & Olefin downstream. It’s on track with its original commissioning
start-up in 1H18. That will deliver the company accretive growth after the structural
enhancement of its earnings power via its upgrading unit. Accordingly, if Thai Oil does
nothing, the company will fall behind it peers and will lose competitive advantages in
the market.
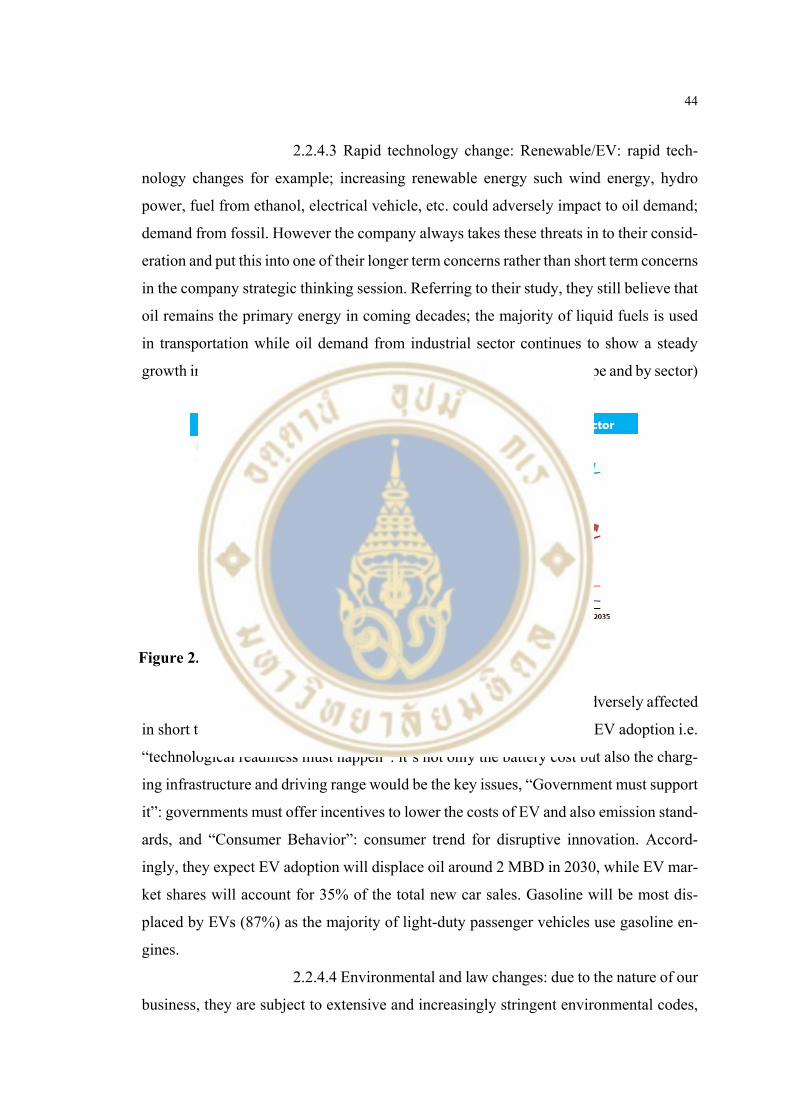
44
2.2.4.3 Rapid technology change: Renewable/EV: rapid tech-
nology changes for example; increasing renewable energy such wind energy, hydro
power, fuel from ethanol, electrical vehicle, etc. could adversely impact to oil demand;
demand from fossil. However the company always takes these threats in to their consid-
eration and put this into one of their longer term concerns rather than short term concerns
in the company strategic thinking session. Referring to their study, they still believe that
oil remains the primary energy in coming decades; the majority of liquid fuels is used
in transportation while oil demand from industrial sector continues to show a steady
growth in the next 20 years. (Figure 2.5 Long term energy demand by type and by sector)
They see an impact of EV demand will not be adversely affected
in short term as well because there will be many key success factors of EV adoption i.e.
“technological readiness must happen”: it’s not only the battery cost but also the charg-
ing infrastructure and driving range would be the key issues, “Government must support
it”: governments must offer incentives to lower the costs of EV and also emission stand-
ards, and “Consumer Behavior”: consumer trend for disruptive innovation. Accord-
ingly, they expect EV adoption will displace oil around 2 MBD in 2030, while EV mar-
ket shares will account for 35% of the total new car sales. Gasoline will be most dis-
placed by EVs (87%) as the majority of light-duty passenger vehicles use gasoline en-
gines.
2.2.4.4 Environmental and law changes: due to the nature of our
business, they are subject to extensive and increasingly stringent environmental codes,
Figure 2.5 Long term energy demand by type and by sector

45
rules, laws and regulations, both domestic and international. Some of these laws and
regulations require their facilities to operate under permits, licenses, authorizations or
certificates that are subject to renewal or modification. Any amendments or modifica-
tions to these laws and regulations and permits may require them to install pollution
control equipment and to implement changes to their operations to limit the impact or
potential impact on the environment, health and safety. A violation of these laws, codes,
rules and regulations or permit conditions can result in substantial fines, criminal sanc-
tions, permit revocations and facility shutdowns.
Changes to environmental laws and regulations, their interpre-
tations or enforcement may require them to make additional capital expenditures or in-
cur additional operating expenses in order to maintain their current operations, curtail
their production activities or take other actions that could have a material adverse effect
on our financial condition, results of operations and cash flow. In addition, they may be
unable to sell any refined petroleum or other products if they fail to meet new specifi-
cations. If they fail to meet environmental requirements, they may also be subject to
administrative, civil and criminal proceedings by governmental authorities, as well as
civil proceedings by environmental groups and other individuals, which could result in
substantial fines and penalties and perhaps it could limit or halt our operations. These
changes could also limit the availability of their funds for other purposes, which could
adversely affect their business, financial condition, results of operations and cash flows.
2.3 Five Forces Analysis
2.3.1 Supplier Powers (High)
2.3.1.1 Feedstock supply dependency: Thai Oil is dependent
on foreign sources for their supply of crude oil and other feedstock, in particular from
the Middle East, and any disruption in their supply of crude oil and other feedstock
could reduce their margins and materially adversely affect their results of operations.
The supply of imported crude oil and other feedstock is subject to a variety of factors
that are beyond their control, including the political developments and instability in
petroleum producing regions, in particular in the Middle East, government regulations
46
with respect to oil and energy industries in those regions, import tariffs and other re-
strictions, weather conditions and overall economic conditions in those regions.
2.3.1.2 Volatile industry; fluctuation in market prices of crude
oil and other feedstock: cyclicality in the refining and petrochemical industries may re-
sult in reduced volumes or operating margins, and volatile margins in the refining and
petrochemical industries and uncertainty regarding the global economic recovery
could have a material adverse effect on them in the future. Moreover fluctuations in
market prices of crude oil and other feedstock, as well as refined petroleum products
or petrochemical products, may affect their results of operations. Historically, the re-
fining and petrochemical industries have experienced alternating periods of tight sup-
ply, resulting in increased prices and profit margins, followed by periods of substantial
capacity addition, resulting in oversupply and reduced prices and profit margins. Their
financial results are primarily dependent on factors beyond their control which affect
the margins between the prices of their refined petroleum, petrochemical and lube base
oil products and the cost to acquire crude oil and other feedstock. Future volatility may
negatively affect their results of operations, since the margin between products and
feedstock prices may decrease below the amount needed for them to generate net cash
flow sufficient for their needs.
2.3.2 Buyer Power (Moderate)
2.3.2.1 Heavily dependent on their relationship with PTT: as
their major customer, supplier and major shareholder but all the price are taken place
at market price. Any changes in these relationships may materially and adversely af-
fect Thai oil as PTT is their largest customer by revenue, accounting for 49.2% of total
sales revenue in the nine month ended September, 2016. As a result, they will be af-
fected by a reduction in or loss of sales to PTT or changes in its financial condition or
operations, if PTT is unable to purchase their products, or otherwise ceases or sus-
pends its purchases, and they cannot find other customers to offtake those quantities in
bulk, our revenues, margins and cash flows may be adversely affected. However Thai
Oil have entered into the the product offtake and crude oil supply agreement (the
“POCSA”) with PTT. The POCSA does not contain a termination date but may be ter-
minated after July 2024, in addition to other causes, by either party with 12 months
47
prior written notice of termination to the other party. In addition all volume taken by
PTT under POSCA is based on market price.
2.3.2.2 Thai Oil depends on a small number of customers for a
significant portion of their net sales. However, Thai Oil is the only one refinery who
could produce on-spec unleaded gasoline octane 95. They sell refined petroleum prod-
ucts domestically to other major oil companies, including Bangchak (BCP), Shell
Thailand and Chevron, as well as other independent oil wholesalers and offtake cus-
tomers such PTG Energy Public Company Limited and Susco Public Company Lim-
ited, and domestic jobbers (including independent wholesalers and petrol stations). As
a result of their dependence on this small number of customers, they may be affected
by changes in their financial condition or operations or their demand for their prod-
ucts. However they have supported the growth of other independent offtake customers
to capture the growing demand in Thailand and such offtake customers continue to be
a growing portion of their sales. They also seek to expand their customer base both in
the domestic and international markets, including traders and end users, to accommo-
date sales fluctuations to their major offtake customers. However Thai Oil is the only
one refiner who could produce on-spec unleaded gasoline octane 95, customers need
to rely on the company’s product otherwise they need to import those product to sell in
their distribution channel.
2.3.3 Competitive Rivalry (High)
2.3.3.1 The refining, petrochemical and lube base oil industries
are highly competitive: the refining industry is highly competitive with respect to the
sale of refined petroleum products in the Thai domestic, regional and global markets.
Their principal competitors include other major domestic petroleum refiners (7 major
refiners in Thailand, Thai Oil is the largest one) as well as other global refiners who
export products into the regional and domestic markets in the refined petroleum prod-
ucts business. They compete for available supplies of crude oil and other feedstock and
for outlets of their refined petroleum products. Domestic petroleum refiners, including
Thai Oil, increased refining capacity in the 1990s and the 2000s without a corresponding
increase in demand for refined petroleum products, which has resulted in overcapacity
for several major refined petroleum products. Currently, there is an excess supply in the
48
Thai domestic market of certain refined petroleum products, such as gasoline, diesel, jet
and fuel oil, petrochemical products, such as paraxylene and benzene, and lube base oil
products. Continued imbalance in the supply and demand for certain refined petroleum,
petrochemical and lube base oil products in the domestic market could cause pricing
pressure in the domestic market and force suppliers, including Thai Oil, to sell their
excess production in the traditionally lower margin export markets, which may have a
material adverse effect on their operating margins and results of operations.
Thai Oil do not have any retail business and therefore are de-
pendent upon others to sell their refined petroleum, petrochemical and lube base oil
products into the retail market. Three of Their domestic competitors have both refining
and marketing operations and may be better positioned to sell their products in the do-
mestic market. Some of thier competitors who sell into the markets to which they export
may be able to drive down product prices if they have costs lower than Thai Oil and
their export quantities are sufficiently large to influence market prices. Furthermore,
some of thier competitors may have greater financial, technological and other resources
than Thai Oil, and may be in a better position to withstand changes in market conditions.
2.3.4 Threat of Substitution (Moderate)
2.3.4.1 Rapid technology change: Renewable/EV: rapid tech-
nology changes for example; increasing renewable energy such wind energy, hydro
power, fuel from ethanol, electrical vehicle, etc. could adversely impact to oil demand;
demand from fossil. However the company always takes these threats in to their consid-
eration and put this into one of their longer term concerns rather than short term concerns
in the company strategic thinking session. Referring to their study, they still believe that
oil remains the primary energy in coming decades; the majority of liquid fuels is used
in transportation while oil demand from industrial sector continues to show a steady
growth in the next 20 years. They see an impact of EV demand will not be adversely
affected in short term as well because there will be many key success factors of EV
adoption i.e. “technological readiness must happen”: it’s not only the battery cost but
also the charging infrastructure and driving range would be the key issues, “Government
must support it”: governments must offer incentives to lower the costs of EV and also
49
emission standards, and “Consumer Behavior”: consumer trend for disruptive innova-
tion. Accordingly, they expect EV adoption will displace oil around 2 MBD in 2030,
while EV market shares will account for 35% of the total new car sales. Gasoline will
be most displaced by EVs (87%) as the majority of light-duty passenger vehicles use
gasoline engines.
2.3.5 Threat of New Entry: (Moderate)
2.3.5.1 New world scale/ Competitive refineries: although
there’s no refineries expansion in Thailand, it’s not the case for regional refineries and
global refineries keep upgrading and expanding refining capacities being competitive
in the market. For example, regional peer refinery like S-Oil is in the process of up-
grading their units; RFCC & Olefin downstream. It’s on track with its original com-
missioning start-up in 1H18. That will deliver the company accretive growth after the
structural enhancement of its earnings power via its upgrading unit. Accordingly, if
Thai Oil does nothing, the company will fall behind it peers and will lose competitive
advantages in the market.
2.3.5.2 Capital intensive business and their expansion plans
have significant capital expenditures and financing requirements, which are subject to
a number of risks and uncertainties. The refining and petrochemical industries are cap-
ital intensive. Their ability to maintain and increase their revenues and net profits is
partially dependent upon continued capital spending, including investing in, construct-
ing, upgrading and maintaining their facilities. In addition, they continuously monitor
developments in the refining and petrochemical products markets in Thailand, South-
east Asia, East Asia and elsewhere for opportunities to expand into new businesses or
invest in derivative uses of their refinery and petrochemical production. Any future ex-
pansion of their business, including their planned expansion projects, will require ad-
ditional capital expenditures, which may be substantial.
50
2.4 Corporate Governance and Management Practices
2.4.1 Corporate Governance
The company implement new principles and practices to improve corporate
governance from time to time. They have corporate governance principles that apply to
directors and employees. The principles of good corporate governance are generally
based on the principles of good corporate governance established by the SET and the
Thai SEC and address a wide range of matters, including establishing procedures and
requirements relating to the following:
• Duties, responsibilities, qualifications and ethics with respect to the board
of directors;
• Responsibilities to shareholders, employees, society and the environment;
• Relationships with customers, trading partners, and competitors;
• Codes of conduct for executives and employees;
• Internal controls and risk management; and
• Information disclosure and transparency.
The principles of good corporate governance also set out their policies and
guidelines on matters relating to marketing communications, intellectual property,
health, safety and environment, human rights, anticorruption and bribery, internal con-
trols, conflict of interests, confidentiality, connected transactions, use of information
technology system and good procurement practices.
2.4.2 Management Practices
The company have adopted a management code of conduct which outlines
certain management practices, focusing on good management and responsibility to our
shareholders. They have systems to implement management practices and committees
at the operational level to implement and review these systems. They have also imple-
mented an employee’s code of conduct which outlines their various policies, systems
and committees to fulfill responsibilities to different stakeholder groups, namely, our
shareholders, business partners, competitors and creditors, employees, society and the
environment and the Government and associated organizations.

51
2.4.3 Awards and Recognitions
The company have received numerous awards and recognitions both inter-
nationally and domestically. they were awarded, amongst others, the Strongest Adher-
ence to CG Award at the 4th Annual Southeast Asia Institutional Investor Corporate
Award event for 2014, based on a survey of investors and analysts of leading Southeast
Asian companies conducted by Alpha Southeast Asia, a leading publication on interna-
tional finance and investment, the Assets Excellence in Management and Corporate
Governance Awards 2014 (Platinum Level) from The Assets, Asia’s leading finance
journal, and Asia’s Outstanding Company on Corporate Governance Award for two
consecutive years, from the Corporate Governance Asia. Domestically, they received
the SET Award of Honor for CG and Corporate Social Responsibility with continued
excellence (2012-2014) at the SET Awards 2014 event, rated “Excellent” in the category
of Corporate Governance Report of Thai Listed Companies 2014 for six consecutive
years, presented by the Thai Institute of Directors and we are one of the 19 Thai listed
companies to undergo assessment for outstanding corporate governance practices under
the ASEAN CG Scorecard criteria.

52
2.5 Income Statement
Table 2.2 Income Statement including projections
2.6 Balance Sheet
Table 2.3 Balance Sheet including projections
Year to 31 Dec (Bt mn) 2012 2013 2014 2015 2016F 2017F 2018F 2019F 2020F
Sales 447,432 414,599 390,090 293,569 246,378 296,617 321,704 321,222 335,176
Cost of Goods Sold 432,312 397,556 394,170 273,819 221,998 274,348 297,098 298,261 311,551
Gross Profit 15,119 17,043 (4,080) 19,750 24,380 22,269 24,605 22,962 23,624
Operating Expenses 2,631 2,582 2,641 3,207 2,692 3,240 3,514 4,216 3,662
Operating Profit 12,488 14,461 (6,722) 16,543 21,689 19,028 21,091 18,745 19,962
Interest Expense 2,343 3,786 3,966 3,435 3,219 3,354 3,026 2,930 2,694
Net Investment Income/(Loss) 963 1,825 2,848 2,201 726 741 756 771 786
Net other Non-op. Income/(Loss) 1,350 2,623 2,085 1,546 1,298 1,562 1,694 1,728 1,763
Net Extraordinaries (Incl. Minority Interests) 1,651 (3,571) 695 (3,077) (423) (431) (440) (449) (462)
Pretax Income 14,109 11,552 (5,060) 13,779 20,071 17,546 20,075 17,866 19,356
Income Taxes 1,789 1,158 (920) 1,597 1,819 2,697 4,103 3,663 3,964
Net Profit 12,320 10,394 (4,140) 12,181 18,252 14,850 15,972 14,203 15,392
EBITDA 20,478 23,131 1,896 24,855 30,357 27,961 30,156 27,844 29,096
EPS (Bt) 6.039 5.095 (2.029) 5.971 8.947 7.279 7.829 6.962 7.545
Year as of 31 Dec (Bt mn) 2012 2013 2014 2015 2016F 2017F 2018F 2019F 2020F
Total Assets 170,676 209,602 193,607 192,166 200,582 204,341 212,071 214,721 222,452
Current Assets 100,382 126,876 95,464 90,490 96,176 102,448 114,848 121,859 134,004
Cash & ST Investments 28,322 43,815 46,483 53,129 58,621 57,478 66,389 72,877 82,929
Inventories 40,004 48,509 28,533 18,883 19,221 23,754 25,724 25,824 26,975
Accounts Receivable 27,090 28,746 16,141 14,177 12,722 15,316 16,611 16,586 17,307
Others 4,966 5,806 4,307 4,302 5,612 5,901 6,124 6,571 6,794
Non-current Assets 70,295 82,726 98,143 101,676 104,406 101,892 97,223 92,863 88,447
LT Investments 2,287 13,460 14,056 14,356 14,356 14,356 14,356 14,356 14,356
Net fixed Assets 64,864 65,609 79,120 83,258 86,112 83,061 78,535 74,009 69,482
Others 3,144 3,657 4,968 4,062 3,938 4,475 4,332 4,498 4,609
Total Liabilities 79,953 113,681 105,763 95,157 93,534 89,126 88,072 82,910 82,175
Current Liabilities 35,171 49,576 35,635 18,192 23,769 21,485 25,615 21,714 25,514
Accounts Payable 26,615 31,554 17,811 12,053 12,106 14,961 16,201 16,265 16,990
ST Borrowings 4,635 13,478 12,836 1,787 7,613 2,537 5,597 1,673 4,949
Others 3,921 4,543 4,988 4,352 4,050 3,987 3,816 3,775 3,575
Long-term Liabilities 44,781 64,105 70,128 76,965 69,765 67,641 62,457 61,197 56,661
Long-term Debts 42,162 61,385 67,265 73,719 66,519 64,395 59,211 57,951 53,415
Others 2,619 2,721 2,863 3,246 3,246 3,246 3,246 3,246 3,246
Shareholders' Equity 90,724 95,921 87,844 97,009 107,047 115,215 123,999 131,811 140,277
Common Stock 20,400 20,400 20,400 20,400 20,400 20,400 20,400 20,400 20,400
Capital Surplus 6,344 6,669 6,930 7,193 7,193 7,193 7,193 7,193 7,193
Retained Earnings 63,979 68,851 60,514 69,416 79,454 87,622 96,406 104,218 112,684
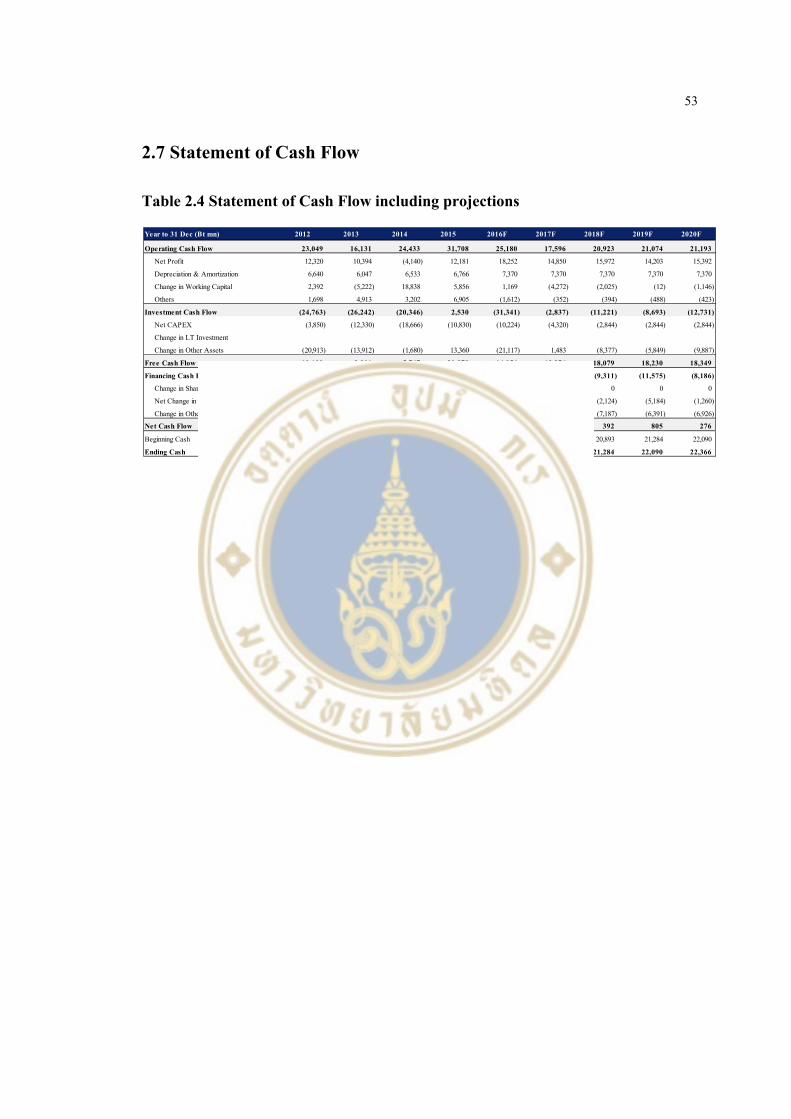
53
2.7 Statement of Cash Flow
Table 2.4 Statement of Cash Flow including projections
Year to 31 Dec (Bt mn) 2012 2013 2014 2015 2016F 2017F 2018F 2019F 2020F
Operating Cash Flow 23,049 16,131 24,433 31,708 25,180 17,596 20,923 21,074 21,193
Net Profit 12,320 10,394 (4,140) 12,181 18,252 14,850 15,972 14,203 15,392
Depreciation & Amortization 6,640 6,047 6,533 6,766 7,370 7,370 7,370 7,370 7,370
Change in Working Capital 2,392 (5,222) 18,838 5,856 1,169 (4,272) (2,025) (12) (1,146)
Others 1,698 4,913 3,202 6,905 (1,612) (352) (394) (488) (423)
Investment Cash Flow (24,763) (26,242) (20,346) 2,530 (31,341) (2,837) (11,221) (8,693) (12,731)
Net CAPEX (3,850) (12,330) (18,666) (10,830) (10,224) (4,320) (2,844) (2,844) (2,844)
Change in LT Investment
Change in Other Assets (20,913) (13,912) (1,680) 13,360 (21,117) 1,483 (8,377) (5,849) (9,887)
Free Cash Flow 19,199 3,801 5,767 20,878 14,956 13,276 18,079 18,230 18,349
Financing Cash Flow (5,956) 14,954 (3,152) (14,711) (9,587) (13,882) (9,311) (11,575) (8,186)
Change in Share Capital 0 0 0 0 0 0 0 0 0
Net Change in Debt 1,109 28,066 5,238 (4,595) (1,374) (7,200) (2,124) (5,184) (1,260)
Change in Other LT Liab. (7,065) (13,112) (8,390) (10,116) (8,213) (6,682) (7,187) (6,391) (6,926)
Net Cash Flow (7,670) 4,843 934 19,527 (15,748) 877 392 805 276
Beginning Cash 18,129 10,460 15,303 16,237 35,764 20,016 20,893 21,284 22,090
Ending Cash 10,460 15,303 16,237 35,764 20,016 20,893 21,284 22,090 22,366
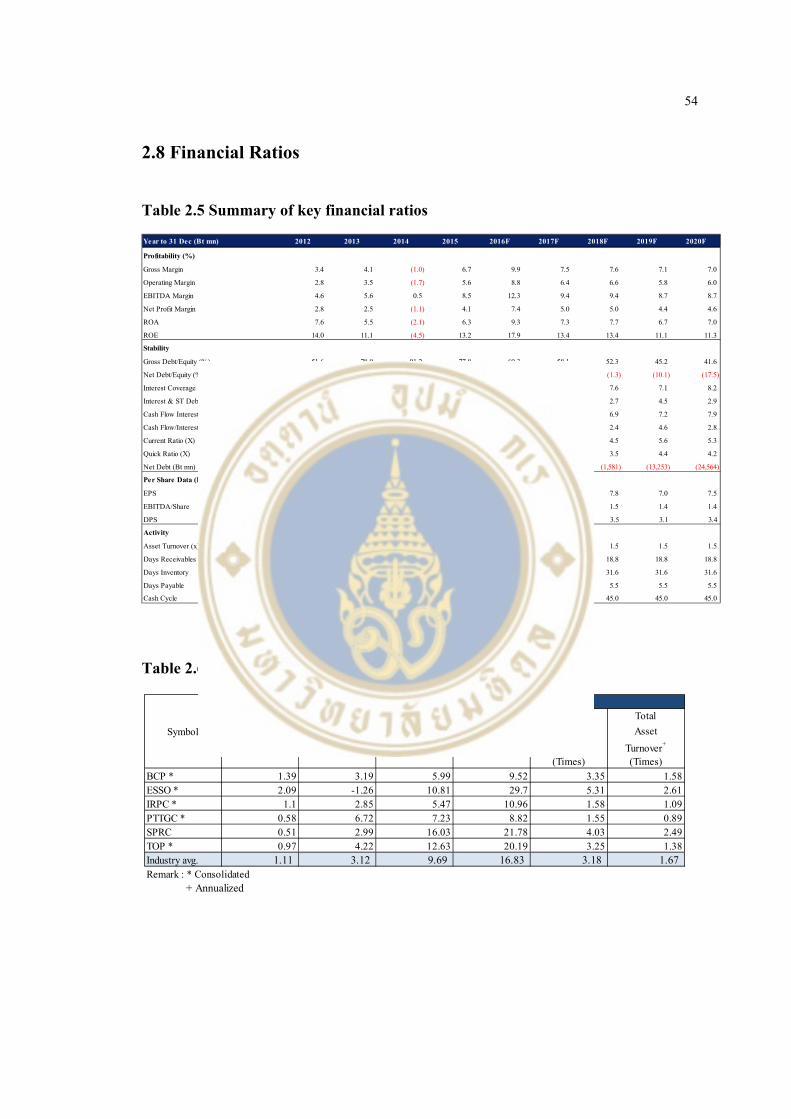
54
2.8 Financial Ratios
Table 2.5 Summary of key financial ratios
Table 2.6 Peer’s Key Financial Ratios – as of 30 September 2016
D/E Net Profit Return on Return on Fixed Total
(Times) Margin Asset+
Equity+ Asset Asset
(%) (%) (%) Turnover+
Turnover+
(Times) (Times)
BCP * 1.39 3.19 5.99 9.52 3.35 1.58ESSO * 2.09 -1.26 10.81 29.7 5.31 2.61IRPC * 1.1 2.85 5.47 10.96 1.58 1.09PTTGC * 0.58 6.72 7.23 8.82 1.55 0.89SPRC 0.51 2.99 16.03 21.78 4.03 2.49TOP * 0.97 4.22 12.63 20.19 3.25 1.38
1.11 3.12 9.69 16.83 3.18 1.67
+ AnnualizedRemark : * ConsolidatedIndustry avg.
Symbol
Key Financial Ratios
Year to 31 Dec (Bt mn) 2012 2013 2014 2015 2016F 2017F 2018F 2019F 2020F
Profitability (%)
Gross Margin 3.4 4.1 (1.0) 6.7 9.9 7.5 7.6 7.1 7.0
Operating Margin 2.8 3.5 (1.7) 5.6 8.8 6.4 6.6 5.8 6.0
EBITDA Margin 4.6 5.6 0.5 8.5 12.3 9.4 9.4 8.7 8.7
Net Profit Margin 2.8 2.5 (1.1) 4.1 7.4 5.0 5.0 4.4 4.6
ROA 7.6 5.5 (2.1) 6.3 9.3 7.3 7.7 6.7 7.0
ROE 14.0 11.1 (4.5) 13.2 17.9 13.4 13.4 11.1 11.3
Stability
Gross Debt/Equity (%) 51.6 78.0 91.2 77.8 69.3 58.1 52.3 45.2 41.6
Net Debt/Equity (%) 20.4 32.4 38.3 23.1 14.5 8.2 (1.3) (10.1) (17.5)
Interest Coverage (X) 7.0 4.1 (0.3) 5.0 7.2 6.2 7.6 7.1 8.2
Interest & ST Debt Coverage (X) 2.4 0.9 (0.1) 3.3 2.1 3.5 2.7 4.5 2.9
Cash Flow Interest Coverage (X) 9.8 4.3 6.2 9.2 7.8 5.2 6.9 7.2 7.9
Cash Flow/Interest & ST Debt (X) 3.3 0.9 1.5 6.1 2.3 3.0 2.4 4.6 2.8
Current Ratio (X) 2.9 2.6 2.7 5.0 4.0 4.8 4.5 5.6 5.3
Quick Ratio (X) 1.7 1.6 1.9 3.9 3.2 3.7 3.5 4.4 4.2
Net Debt (Bt mn) 18,475 31,048 33,618 22,377 15,511 9,454 (1,581) (13,253) (24,564)
Per Share Data (Bt)
EPS 6.0 5.1 (2.0) 6.0 8.9 7.3 7.8 7.0 7.5
EBITDA/Share 10.0 11.3 0.9 12.2 14.9 13.7 1.5 1.4 1.4
DPS 2.7 2.3 1.2 2.7 4.0 3.3 3.5 3.1 3.4
Activity
Asset Turnover (x) 2.8 2.2 1.9 1.5 1.3 1.5 1.5 1.5 1.5
Days Receivables 22.1 25.3 15.1 17.6 18.8 18.8 18.8 18.8 18.8
Days Inventory 33.8 44.5 26.4 25.2 31.6 31.6 31.6 31.6 31.6
Days Payable 6.2 7.9 4.5 4.4 5.5 5.5 5.5 5.5 5.5
Cash Cycle 49.7 61.9 37.0 38.4 45.0 45.0 45.0 45.0 45.0
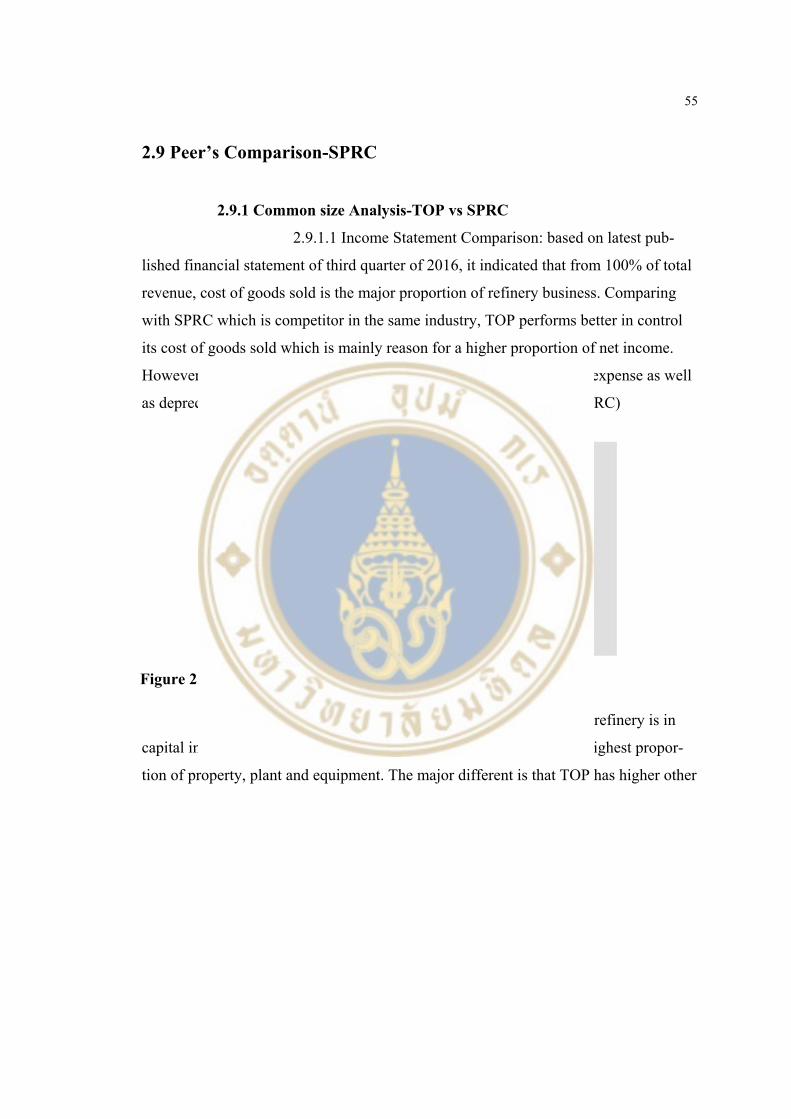
55
2.9 Peer’s Comparison-SPRC
2.9.1 Common size Analysis-TOP vs SPRC
2.9.1.1 Income Statement Comparison: based on latest pub-
lished financial statement of third quarter of 2016, it indicated that from 100% of total
revenue, cost of goods sold is the major proportion of refinery business. Comparing
with SPRC which is competitor in the same industry, TOP performs better in control
its cost of goods sold which is mainly reason for a higher proportion of net income.
However, SPRC is better control in selling and general administrative expense as well
as depreciation. (Figure 2.6 Income Statement Comparison-TOP vs SPRC)
2.9.1.2 Balance Sheet, asset comparison, since refinery is in
capital intensive industry, from 100% of total assets, both firms have highest propor-
tion of property, plant and equipment. The major different is that TOP has higher other
Figure 2.6 Income Statement Comparison -TOP vs SPRC
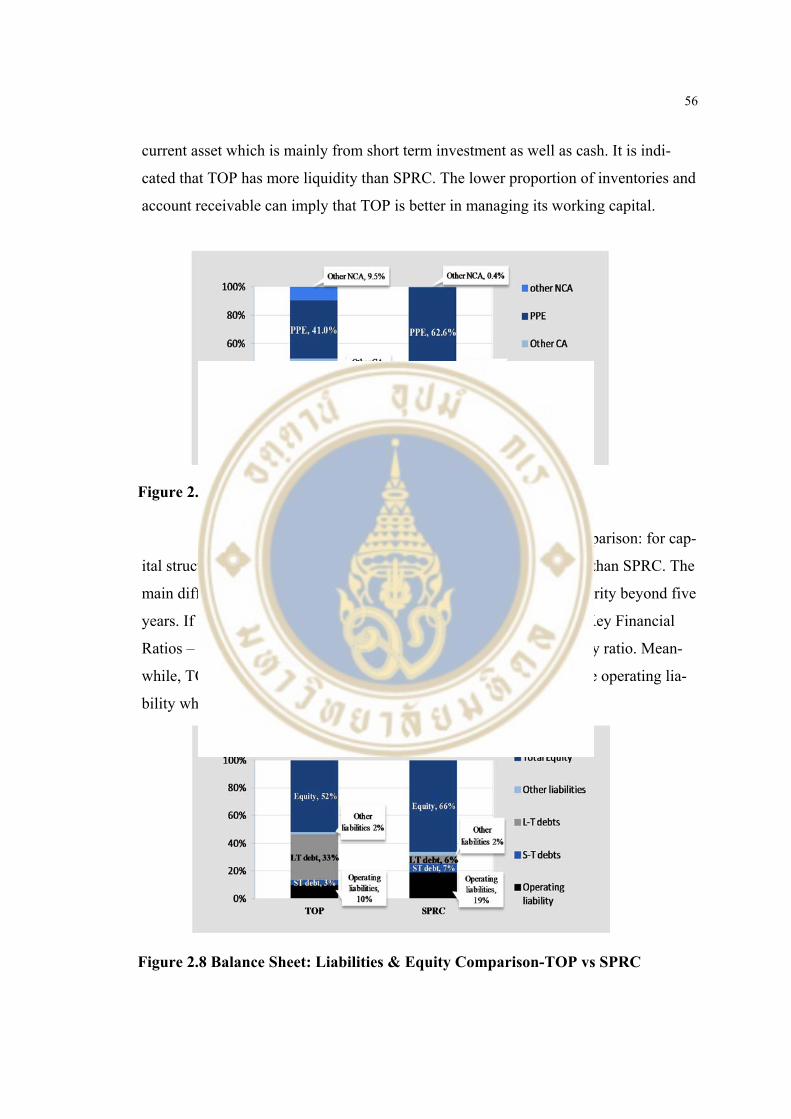
56
current asset which is mainly from short term investment as well as cash. It is indi-
cated that TOP has more liquidity than SPRC. The lower proportion of inventories and
account receivable can imply that TOP is better in managing its working capital.
2.9.1.3 Balance Sheet, liabilities & equity comparison: for cap-
ital structure, 100% of source of fund, TOP has higher portion of debt than SPRC. The
main different is long term debt of TOP which up to 49.3% had a maturity beyond five
years. If we compared with the industries average, (Table 2.6: Peer’s Key Financial
Ratios – as of 30 September 2016) SPRC has the lowest debt per equity ratio. Mean-
while, TOP is closer to the industry average. However, SPRC has more operating lia-
bility which mainly from trade and other payables.
Figure 2.7 Balance Sheet: Asset Comparison-TOP vs SPRC
Figure 2.8 Balance Sheet: Liabilities & Equity Comparison-TOP vs SPRC
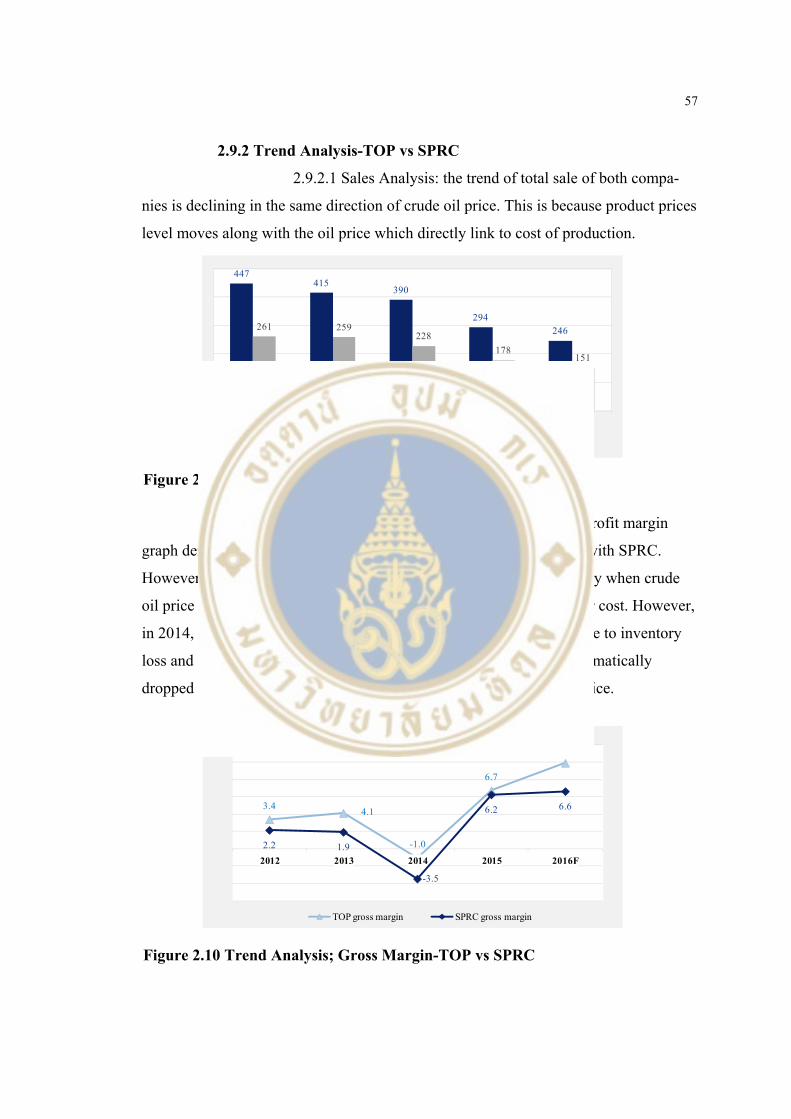
57
2.9.2 Trend Analysis-TOP vs SPRC
2.9.2.1 Sales Analysis: the trend of total sale of both compa-
nies is declining in the same direction of crude oil price. This is because product prices
level moves along with the oil price which directly link to cost of production.
2.9.2.2 Gross Margin Analysis: overall gross profit margin
graph demonstrated that TOP generate better gross margin compared with SPRC.
However both firms could maintain a relatively good margin, especially when crude
oil price declined. This is due to the fact that they benefit from cheaper cost. However,
in 2014, both companies had a negative gross margin which mainly due to inventory
loss and net realizable value marked down. This is attributable to a dramatically
dropped in oil price that lead to a lower inventory price than market price.
447415
390
294246261 259
228
178151
2012 2013 2014 2015 2016F
TOP Sale SPRC Sale
Figure 2.9 Trend Analysis; Sales -TOP vs SPRC
3.44.1
-1.0
6.7
9.9
2.2 1.9
-3.5
6.2 6.6
2012 2013 2014 2015 2016F
TOP gross margin SPRC gross margin
Figure 2.10 Trend Analysis; Gross Margin-TOP vs SPRC
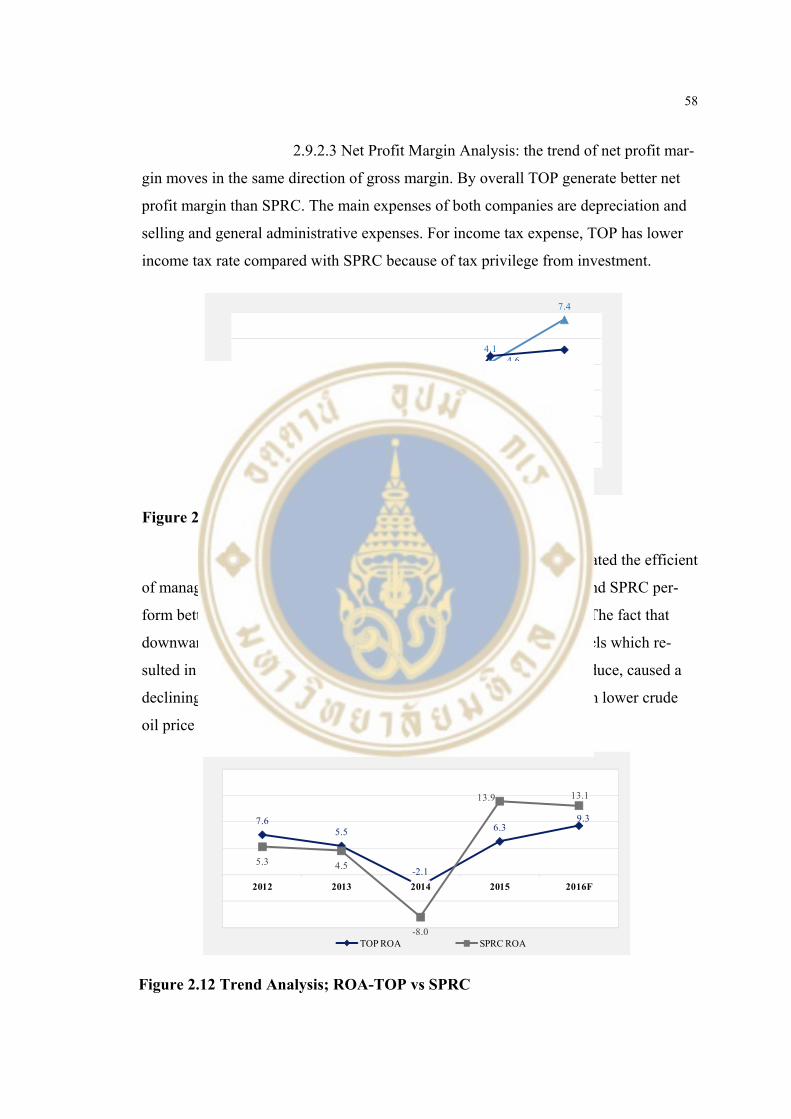
58
2.9.2.3 Net Profit Margin Analysis: the trend of net profit mar-
gin moves in the same direction of gross margin. By overall TOP generate better net
profit margin than SPRC. The main expenses of both companies are depreciation and
selling and general administrative expenses. For income tax expense, TOP has lower
income tax rate compared with SPRC because of tax privilege from investment.
2.9.2.4 Return Analysis; ROA: the graph indicated the efficient
of management in using asset to generate earnings. After 2014, TOP and SPRC per-
form better than the past but SPRC tends to perform better than TOP. The fact that
downward trend of oil price has affected in reducing product price levels which re-
sulted in working capital, i.e. inventory; account receivable trade to reduce, caused a
declining in total asset since 2014. Moreover, cheaper energy cost from lower crude
oil price also supported the earnings to increase.
2.82.5
-1.1
4.1
7.4
1.7 1.5
-2.8
4.6 5.1
2012 2013 2014 2015 2016F
TOP Net profit margin SPRC Net profit margin
Figure 2.11 Trend Analysis; Net Profit Margin-TOP vs SPRC
7.65.5
-2.1
6.39.3
5.3 4.5
-8.0
13.9 13.1
2012 2013 2014 2015 2016F
TOP ROA SPRC ROA
Figure 2.12 Trend Analysis; ROA-TOP vs SPRC
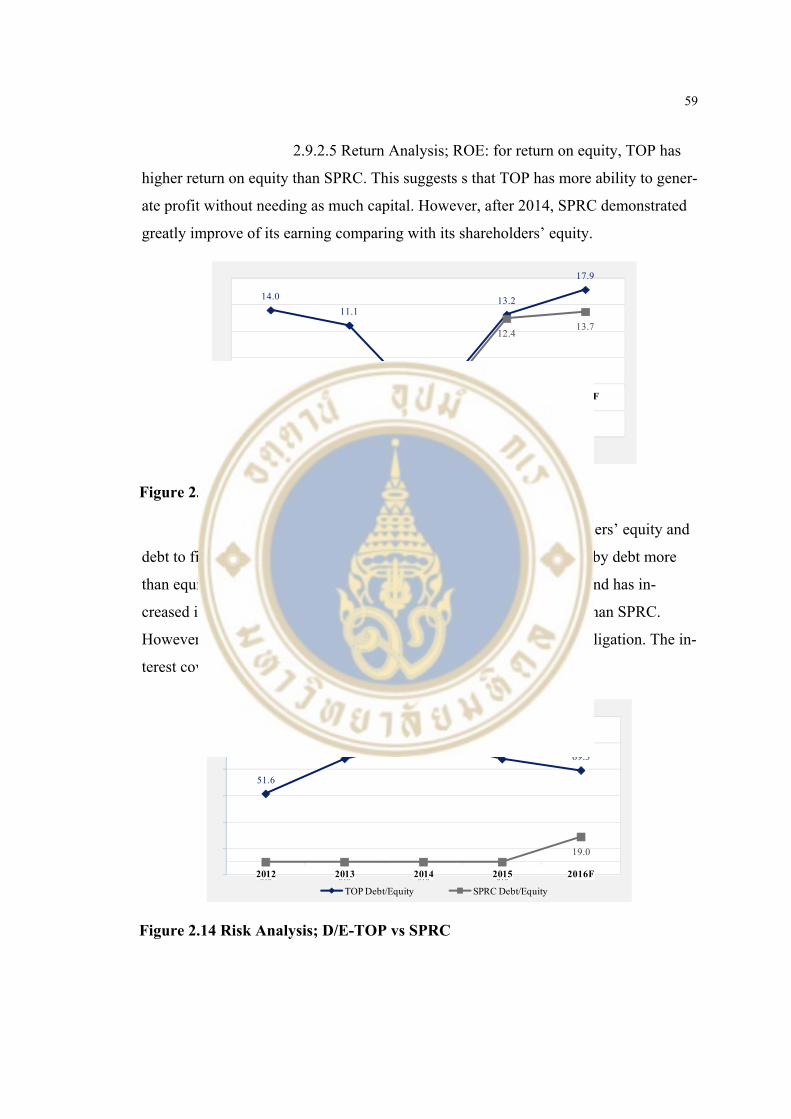
59
2.9.2.5 Return Analysis; ROE: for return on equity, TOP has
higher return on equity than SPRC. This suggests s that TOP has more ability to gener-
ate profit without needing as much capital. However, after 2014, SPRC demonstrated
greatly improve of its earning comparing with its shareholders’ equity.
2.9.2.6 Risk Analysis; D/E: the mixture of owners’ equity and
debt to finance operation of TOP and SPRC is contrast. TOP financed by debt more
than equity while SPRC financed totally by equity during 2012-2014 and has in-
creased its debt in 2016. As higher debt, TOP is considered as riskier than SPRC.
However, it can control debt levels and has ability to meet financial obligation. The in-
terest coverage ratio during 2012-2016 is around 4-7 times.
14.0
11.1
-4.5
13.2
17.9
3.4 3.0
-5.7
12.413.7
2012 2013 2014 2015 2016F
TOP ROE SPRC ROE
Figure 2.13 Return Analysis; ROE-TOP vs SPRC
51.6
78.0
91.2
77.869.3
0.0 0.0 0.0 0.0
19.0
2012 2013 2014 2015 2016F
TOP Debt/Equity SPRC Debt/Equity
Figure 2.14 Risk Analysis; D/E-TOP vs SPRC
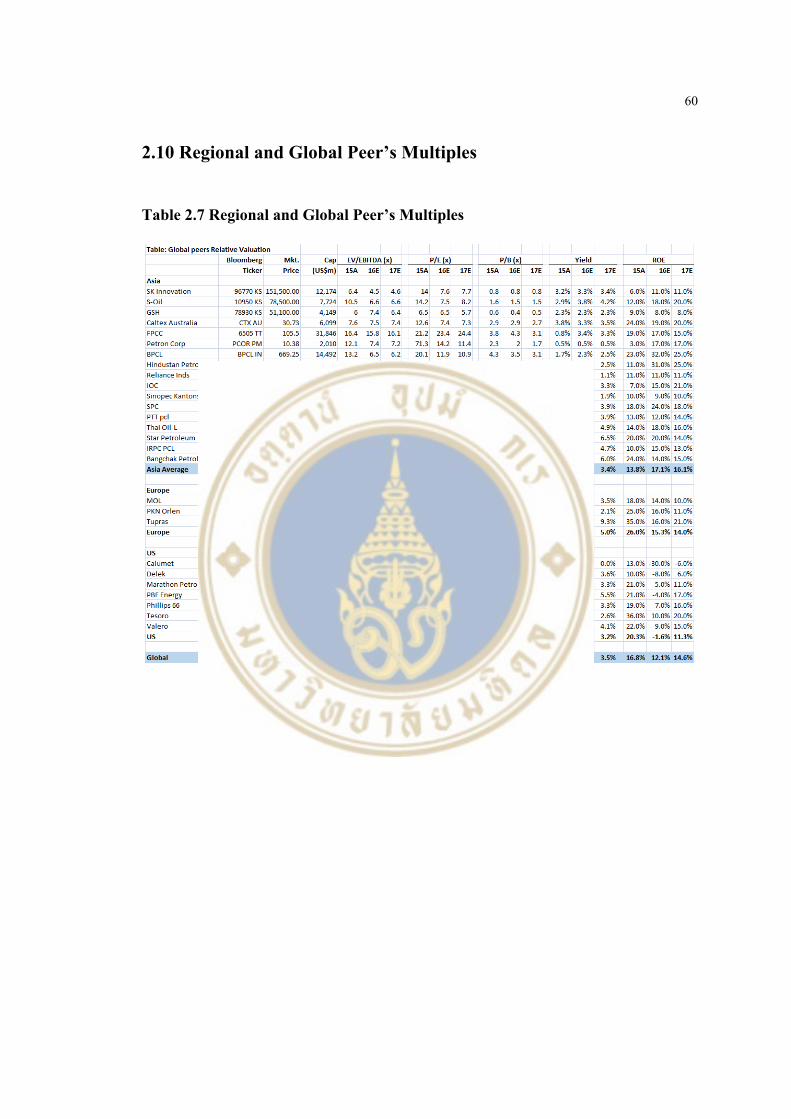
60
2.10 Regional and Global Peer’s Multiples
Table 2.7 Regional and Global Peer’s Multiples
61
REFERENCES
A comparable peer-SPRC financial performance: SET Smart;
http://www.setsmart.com/ ,
Analyst presentation-SPRC; http://investor.sprc.co.th/slides.html
Analyst presentation-TOP; https://investor-th.thaioilgroup.com/slides.html
BOT’s Thailand economic outlook- BOT’s monetary policy report of Sep 2016:
https://www.bot.or.th/Thai/PressandSpeeches/Press/News2559/
n4959e.pdf
Current oil market situation-company’s source: https://www.thaioilgroup.com/
home/media_interview_special.aspx?id=51
IMF’s world economic outlook: http://www.imf.org/external/pubs/ft/weo/2016/02/
MD&A-SPRC; http://investor.sprc.co.th/newsroom_set.html
MD&A-TOP; https://investor-th.thaioilgroup.com/download.html
Peer’s Multiples: Bloomberg, setsmart
Refinery, Aromatics, Lube base oil Market Outlook-Company’s presentation material:
https://investor-th.thaioilgroup.com/slides.html
Research on oil demand and supply-JBC energy :http://www.jbcenergy.com/
SET trade: http://www.settrade.com/C04_01_stock_quote_p1.jsp?txtSym
bol=TOP&ssoPageId=9&selectPage=
SET: http://www.set.or.th/set/mainpage.do?language=th&country=EN
SPRC’s website: www.sprc.co.th/
Thai Oil’s annual report: https://investor-th.thaioilgroup.com/ar.html
Thai Oil’s presentation materials: https://investor-th.thaioilgroup.com/slides.html
62
Thai Oil’s website: http://www.thaioilgroup.com/
Trump Policy and impacts: http://www.independent.co.uk/news/world/americas/us-
elections/donald-trump-president-us-election-2016-result-what-it-means-
for-the-world-a7410136.html
World oil demand and supply in IEA’s Oil market report: https://www.iea.org/news
room/news/.../iea-releases-oil-market-report-for-october.html
63
BIOGRAPHY
NAME Ms. Phaweelita Sirachindabhirom
DATE OF BIRTH 01 April 1987
PLACE OF BIRTH Bangkok, Thailand
INSTITUTIONS ATTENDED Bachelor of Commerce and Account-
ancy, Chulalongkorn University, 2008
Master of Management,
Mahidol University, 2016
RESEARCH GRANTS -
HOME ADDRESS 632 Moo11 Klongdan, Bangbo,
Samutprakarn, 10550 Thailand
Email: [email protected]
EMPLOYMENT ADDRESS Thai Oil Public Company Limited,
555/1 Energy complex Building A,11th
Floor, Vibhabadi Rangsit Road, Cha-
tuchak, Chatuchak, Bangkok 10900,
Thailand
PUBLICATION/PRESENTATION -