discounted cash flow valuation of mega lifesciences …
TRANSCRIPT

DISCOUNTED CASH FLOW VALUATION OF MEGA
LIFESCIENCES PUBLIC COMPANY LIMITED
NUTTHAKAMOL KAMOLRAT
A THEMATIC PAPER SUBMITTED IN PARTIAL
FULFILLMENT OF THE REQUIREMENTS FOR
THE DEGREE OF MASTER OF MANAGEMENT
COLLEGE OF MANAGEMENT
MAHIDOL UNIVERSITY
2020
COPYRIGHT OF MAHIDOL UNIVERSITY
Thematic paper
entitled
DISCOUNTED CASH FLOW VALUATION OF OF MEGA
LIFESCIENCES PUBLIC COMPANY LIMITED
was submitted to the College of Management, Mahidol University
for the degree of Master of Management
on
December 27, 2020
..............................................................
Miss Nutthakamol Kamolrat
Candidate
.............................................................. ..............................................................
Prof. Roy Kouwenberg, Simon Zaby,
Ph.D., CFA Ph.D.
Advisor Chairperson
.............................................................. ..............................................................
Asst. Prof. Duangporn Arbhasil, Worapong Janyangyuen,
Ph.D. Ph.D.
Dean Committee member
College of Management
Mahidol University

ii
ACKNOWLEDGEMENTS
First of all, I would like to extend my deepest gratitude to professors at
CMMU who provided the greatest knowledge to instruct this thematic paper, especially
Ajarn Roy Kouwenberg, Ajarn Susheel Narula and Ajarn Piyapas Tharavanij. This
paper could not be complete without their valuable advices and extensive knowledge of
valuation methods. Prior to study this finance course, I had only limited knowledge of
finance and did not understand how the capital market works. I believe that the
knowledges that I was given, would lead me to a wider opportunity to work in the
finance industry.
Second, I also had great pleasure of working with my friends in Corporate
finance program who always helped and supported me during a hard time to pass every
task deadline that we faced. Their willingness to help made me truly appreciate.
Lastly, I’m extremely grateful to have my family love and support, without
them I could not imagine getting this far. Thank you for always listen to my problems
and give me the helpful advice, also cheered me up when I was down. My gratitude to
you is infinite.
Nutthakamol Kamolrat
iii
DISCOUNTED CASH FLOW VALUATION OF MEGA LIFESCIENCES
PUBLIC COMPANY LIMITED
NUTTHAKAMOL KAMOLRAT 6249083
M.M. ( FINANCIAL MANAGEMENT)
THEMATIC PAPER ADVISORY COMMITTEE: ROY KOUWENBERG, Ph.D.,
SIMON ZABY, Ph.D., WORAPONG JANYANGYUEN, Ph.D.
ABSTRACT
This thematic paper aims to estimate the intrinsic value of Mega
Lifesciences Public Company Limited (MEGA) by using discounted cash flow
valuation method (FCFF). The estimated share value should reflect the company’s
fundamentals, expected future performance and the risk. MEGA is operating in
developing countries or emerging markets, and the nominal GDP growth of these
countries are relatively high. I expect that this will lead to high demand for dietary
supplement products as the company’s sales is directly related to disposable income
based on historical information. The target price on December 31st, 2020 of MEGA
was estimated to be 43.17 baht with an upside of 27% when compared to the market
price 34 baht on November 13th, 2020. Accordingly, we recommend to BUY.
Another important move that MEGA made recently in order to bring the company
further growth was acquiring PT Futamed Pharmaceuticals, a manufacturing plant in
Indonesia, so that it can sell new drugs and technologies in the Indonesian market,
and it also acquired Sando.
Ultimately, we hope that this study will be useful and able to guide
interested investors regarding the intrinsic valuation of Mega Lifesciences Public
Company Limited.
KEY WORDS: MEGA/ Valuation/ Discounted cash flow/ Pharmaceutical/ Dietary
supplement products
41 pages
iv
CONTENTS
Page
ACKNOWLEDGEMENTS ii
ABSTRACT iii
LIST OF TABLES vi
LIST OF FIGURES vii
CHAPTER I INTRODUCTION 1
1.1 Company introduction 1
1.2 Recent developments of MEGA 2
1.3 Valuation and investment recommendation summary 3
CHAPTER II BUSINESS DESCRIPTION 4
2.1 Business overview 4
2.2 Corporate strategy and long term goals 5
2.2.1 Mega vision 5
2.2.2 Mega objective 5
2.2.3 Long term goals 5
2.3 Business segment 5
2.3.1 Mega We Care branded products business 5
2.3.2 Maxxcare distribution business 5
2.3.3 OEM business 6
2.4 Business Segment Revenue 6
2.5 Value chain 7
2.5.1 Support activities 7
2.5.2 Primary activities 8
2.6 SWOT analysis 8
2.6.1 Strengths 8
2.6.2 Weaknesses 8
2.6.3 Opportunities 9
2.6.4 Threats 9
v
CONTENTS (cont.)
Page
CHAPTER III ANALYSIS OF MACROECONOMY, INDUSTRY AND
COMPETITORS 10
3.1 Macro-Economies analysis 10
3.1.1 Global gross domestic product 10
3.1.2 Global inflation 12
3.1.3 Monetary policy rate 12
3.2 Industry analysis 15
3.3 Competition analysis 19
3.3.1 Five force model 19
3.4 Company’s current situation of 9M20 19
CHAPTER IV VALUATION 22
4.1 Financial analysis 22
4.1.1 Dupont’s analysis 22
4.1.2 Growth analysis 23
4.2 Discounted cash flow valuation 27
4.2.1 Revenue forecast 27
4.2.2 Terminal growth rate 30
4.2.3 Required return on equity 31
4.2.4 Cost of debt 32
4.2.5 Weighted average cost of capital -WACC 33
4.2.6 Valuation summary 34
4.3 Sensitivity analysis 34
4.4 Valuation recommendation 35
CHAPTER V INVESTMENT RISKS 36
5.1 Price limitation in Vietnam 36
5.2 Real disposable income effects the growth of the company 36
5.3 Risk of foreign currency exchange rates 36
vi
CONTENTS (cont.)
Page
5.4 Interest rates fluctuations affect to company financial performance 37
CHAPTER VI CONCLUSIONS 38
6.1 Investment recommendation 38
6.1.1 3Q20 MEGA had an impressive performance 38
6.1.2 MEGA continuously expands the business 38
6.2 Triggers for re-assessment 38
6.2.1 Sensitivity of WACC and terminal growth rate 38
6.2.2 Change in business model 39
6.3 Limitations 39
REFERENCES 41
BIOGRAPHY 42
vii
LIST OF TABLES
Table Page
1.1 Market profile 1
1.2 Earning forecast of MEGA 2
1.3 Target price of MEGA (DCF valuation) 3
3.1 9M20 performance 20
3.2 3Q20 performance 21
3.3 Revenue by business segment 21
4.1 Dupont’s analysis of MEGA 23
4.2 Dupont’s analysis of BKL 23
4.3 Myanmar market size CAGR over nominal GDP CAGR 27
4.4 Myanmar % market size growth 28
4.5 Revenue forecast 2020 28
4.6 Growth of Vitamin and supplement industry 29
4.7 Nominal GDP of South East Asia and other countries 29
4.8 Market size CAGR to GDP CAGR 30
4.9 Revenue forecasted by segment 30
4.10 GDP of South East Asia 31
4.11 Terminal growth rate of MEGA 31
4.12 CAPM model 32
4.13 Effective interest rate calculation 32
4.14 After tax cost of debt 32
4.15 Weight of debt and equity 33
4.16 WACC estimation 33
4.17 Free cash flow estimation of MEGA 34
4.18 Target price of MEGA 34
4.19 Sensitivity analysis in a range of ±50% 35
4.20 Implied WACC and cost of equity 35
viii
LIST OF FIGURES
Figure Page
2.1 Revenue by segments 6
2.2 Revenue by regions 7
3.1 World gross domestic product 11
3.2 Gross domestic product separated into country groups 11
3.3 Global inflation (average consumer prices) 12
3.4 Advanced economies policy rate 13
3.5 Emerging market economies policy rate 14
3.6 GDP per capita 14
3.7 Dietary supplement expenditure 15
3.8 Global supplement industry sales and growth, 2007-2021 16
3.9 Supplement sales and growth, 2007-2017 16
3.10 Supplement sales by product,2017 17
3.11 Latin American: Supplement sales and growth,2007-2021 18
3.12 Operating revenues 18
4.1 Core revenue trend of MEGA and BKL 24
4.2 Cost of goods sold trend of MEGA and BKL 24
4.3 Net profit trend of MEGA and BKL 25
4.4 EPS trend of MEGA and BKL 26
4.5 Free cash flow trend of MEGA and BKL 26
5.1 Risk assessment matrix of MEGA 37
1
CHAPTER I
INTRODUCTION
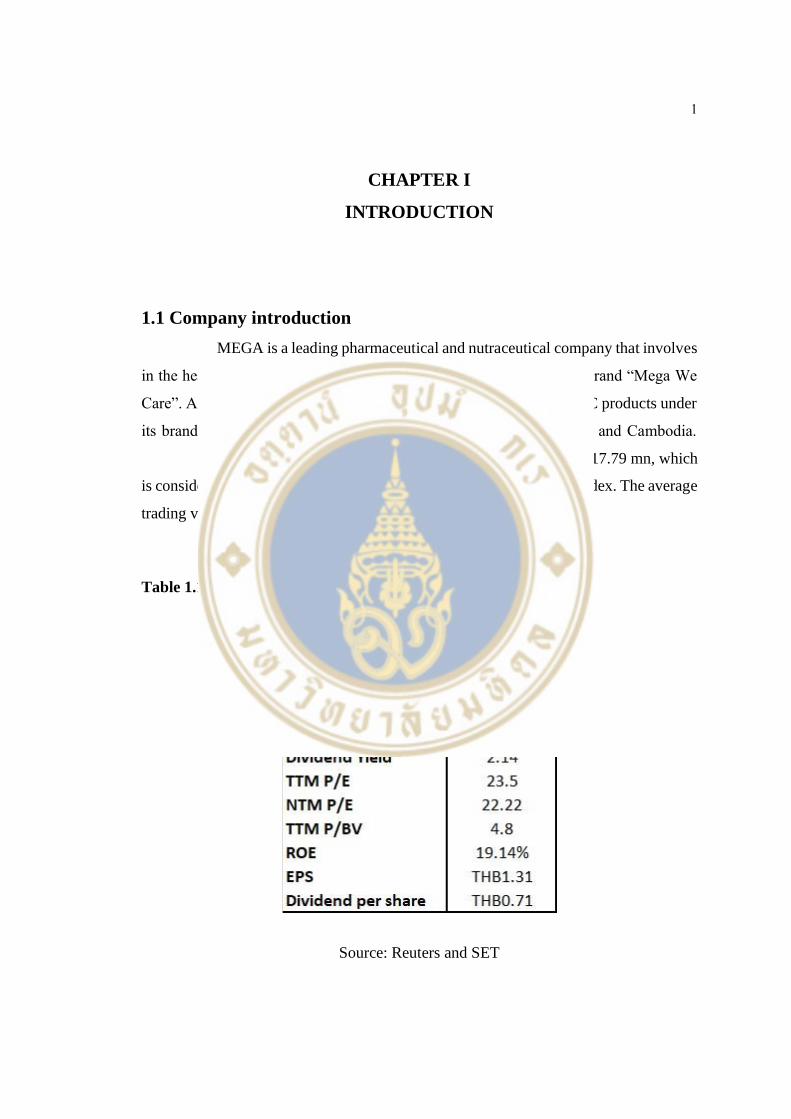
1.1 Company introduction
MEGA is a leading pharmaceutical and nutraceutical company that involves
in the health and wellness industry in developing countries under its brand “Mega We
Care”. Also, MEGA is a leading distributor of pharmaceutical and OTC products under
its brand “Maxxcare” in Indochina, consisting of Myanmar, Vietnam and Cambodia.
Market capitalization of MEGA’s listed stock is THB 28,117.79 mn, which
is considered to be a mid-cap stock and it is a member of the SET100 index. The average
trading volume within the past 1 year is 2,116,542.37 shares.
Table 1.1 Market profile
Source: Reuters and SET

2
1.2 Recent developments of MEGA
Recently, MEGA acquired PT Futamed Pharmaceuticals which is a
manufacturing plant in Indonesia. This action will build the path for MEGA to sell new
drugs and technologies in Indonesian market. Another important move was the
acquisition of Sandoz, a global leader in generic and biosimilar medicines, in Ethiopia
and Myanmar.
According to our team earnings forecast, the operating revenue will have a
compound growth rate of 9.8% between 2020 and 2025. Gross profit margin is 40%,
slightly decreased from 2019 due to the fact that the firm changed its business model to
distribute more lower margin products (Maxxcare). SG&A is 26% of operating revenue
as we approximated it according to management discussion of 9M20 that SG&A was
26.3%. From 2020 to 2025, EBIT and net profit compounded growth is expected to be
10.2%, 10.3%, respectively.
Table 1.2 Earning forecast of MEGA
Income Statement (Mthb) 2015 2016 2017 2018 2019 2020F 2021F 2022F 2023F 2024F 2025F
Revenue 7,945 8,810 9,597 10,182 11,130 12,709 14,049 15,498 16,980 18,526 20,265
Investment income 28 14 16 22 15 15 15 15 15 15 15
Net foreign exchange gain 101.92 0 0 0 0 0 0 0 0 0 0
Other income 22 18 27 102 34 30 30 30 30 30 30
Total revenue 8,097 8,842 9,640 10,306 11,179 12,754 14,094 15,543 17,025 18,571 20,310
COGS 4,538 5,123 5,277 5,791 6,551 7,653 8,456 9,326 10,215 11,143 12,186
% of revenue 57% 58% 55% 57% 59% 60% 60% 60% 60% 60% 60%
Gross Profit 3,558 3,719 4,363 4,515 4,628 5,102 5,637 6,217 6,810 7,428 8,124
Overall gross margins in 1H20 was 39%. Slight decline was mainly a result of change in revenue mix driven by relatively higher growth in Maxxcare revenue and slightly lowersegmental gross margins, partly due to change in business1model in few markets; adjusted fo
Selling and Administrative Expenses 2,718 2,674 2,965 3,052 3,176 3,343 3,695 4,030 4,415 4,817 5,269
% of revenue 34% 30% 31% 30% 29% 26% 26% 26% 26% 26% 26%
Selling expenses 1,717 1,634 1,856 1,886 1,899 2,006 2,217 2,418 2,649 2,890 3,161
Administrative expenses 1,001 1,041 1,109 1,166 1,278 1,337 1,478 1,612 1,766 1,927 2,108
Net foreign exchange loss - 90 72 15 78 0 0 0 0 0 0
EBIT 841 955 1,327 1,447 1,373 1,759 1,943 2,188 2,395 2,612 2,855
Finance costs 13 22 26 34 65 62 60 62 69 75 83
Share of loss of associates and joint
ventures 0 0 2 4 9 5 5 5 5 5 5
Profit before income tax expense 828 933 1299 1409 1299 1,693 1,878 2,120 2,322 2,531 2,767
Tax expense 132 138 186 203 160 339 376 424 464 506 553
Profit for the year 696 795 1113 1206 1139 1,354 1,502 1,696 1,857 2,025 2,214
3
1.3 Valuation and investment recommendation summary
We recommend to BUY this stock with the target share price of 43.17 baht
from discounted cash flow valuation with upside of 27.0%. The company has high
potential growth in developing market that the company significantly expanded capacity
which leads MEGA to capture higher market shares in dietary supplement market. Also,
MEGA performed excellent in 9M20, so we expect that it will have a strong financial
report in this year. However, the current stock price may already reflect this information.
Table 1.3 Target price of MEGA (DCF valuation)
Share price Bt 34.00
Target price Bt 43.17
Upside +27.0%
4
CHAPTER II
BUSINESS DESCRIPTION
2.1 Business overview
Mega Lifesciences Public Company Limited is an international
manufacturer and distributer of pharmaceutical, nutraceutical products, and fast moving
consumer goods (FMCG). The company was founded by Mr. Kirit Shah, and was
established in 1982 with an initial registered capital of 5 million baht. The business has
started by producing soft gelatin capsules (OEM) with the production capacity of 230
million soft gel capsules annually, and also known as the first manufacturer in Thailand
who produced soft gel at that time.
In 1986, the company started to produce Nifedipine (medicine for
hypertension and chest pain) for Berlin Pharmaceutical Industry Co., Ltd. and became
an exclusive manufacturing partnership because Nifedipine was a very successful
flagship product, and it created a reputation for the company as a pharmaceutical
products manufacturer.
In 1994, this year was the beginning of the branded products business of
Mega We CareTM.
In 1995, the company decided to expand the market to another country by
opening a representative office in Vietnam and set up a subsidiary in Myanmar and
Cambodia. Those actions were for selling its own Mega We CareTM branded products.
In 2000, the company separated its business operations into 2 divisions
which are branded products business (Mega We CareTM trademark), and distribution
business (MaxxcareTM trademark). It also offered the excess capacity to produce the
products under customer’s brand (OEM services)
In 2002, the company expanded its capacity by leased land, building in
Dandenong, Melbourne, Australia to construct a manufacturing plant. This
manufacturing facilities produce packages tablets, hard capsules and powders.

5
2.2 Corporate strategy and long term goals
2.2.1 Mega vision
Mega’s Vision is to ‘Create a Thinking Organization which will change
before it is forced to Change. An Organization which will live and grow beyond each
one of us’
2.2.2 Mega objective
Mega’s Objective is to create value by marketing and selling medicines and
medicinal supplements in developing countries.
2.2.3 Long term goals
Mega tries to maintain its current market share, expects to double core
business revenue within 5-7 years and to increases the revenue in sub-Saharan Africa to
follow the term of ‘Build Africa’ and penetrates further in the natural herbal products
business. Ultimately, attempting to change the company position to be a health care
company.
2.3 Business segment
MEGA operates 3 business segments as following;
2.3.1 Mega We CareTM branded products business
The company develop, manufactures, markets and sells nutraceutical
products, prescription pharmaceutical products and OTC (Over the counter) products.
2.3.2 MaxxcareTM distribution business
The company markets, sells and distributes diverse branded prescription
pharmaceutical products, OTC (Over the counter) and FMCG (Fast-moving
consumer goods) products. This business operates in three countries, consisting of,
6
Myanmar, Vietnam, and Cambodia. Main clients are leading domestic and international
pharmaceutical and FMCG (Fast-moving consumer goods) companies.
2.3.3 OEM business
Company’s manufacturing facilities in Thailand and Australia offer excess
production capacity to third-party customers.
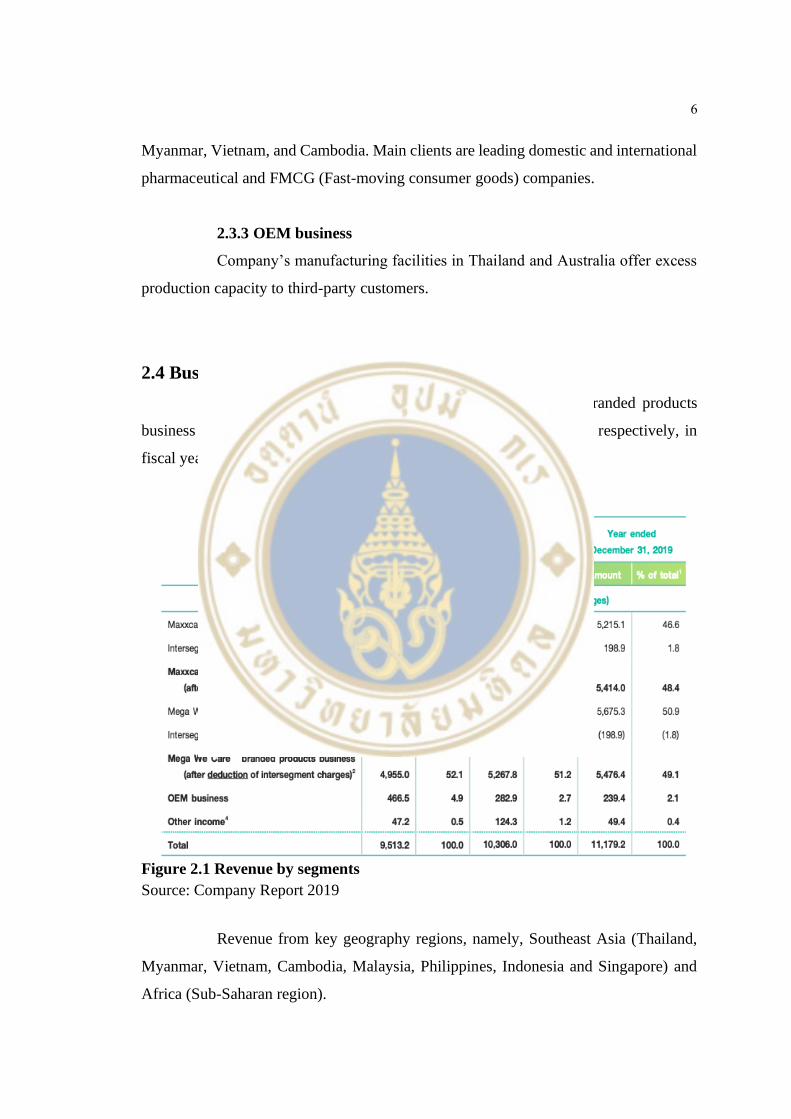
2.4 Business segment revenue
Big portion of revenue comes from Mega We CareTM branded products
business and MaxxcareTM distribution business by 49.1% and 48.4%, respectively, in
fiscal year 2019.
Figure 2.1 Revenue by segments
Source: Company Report 2019
Revenue from key geography regions, namely, Southeast Asia (Thailand,
Myanmar, Vietnam, Cambodia, Malaysia, Philippines, Indonesia and Singapore) and
Africa (Sub-Saharan region).
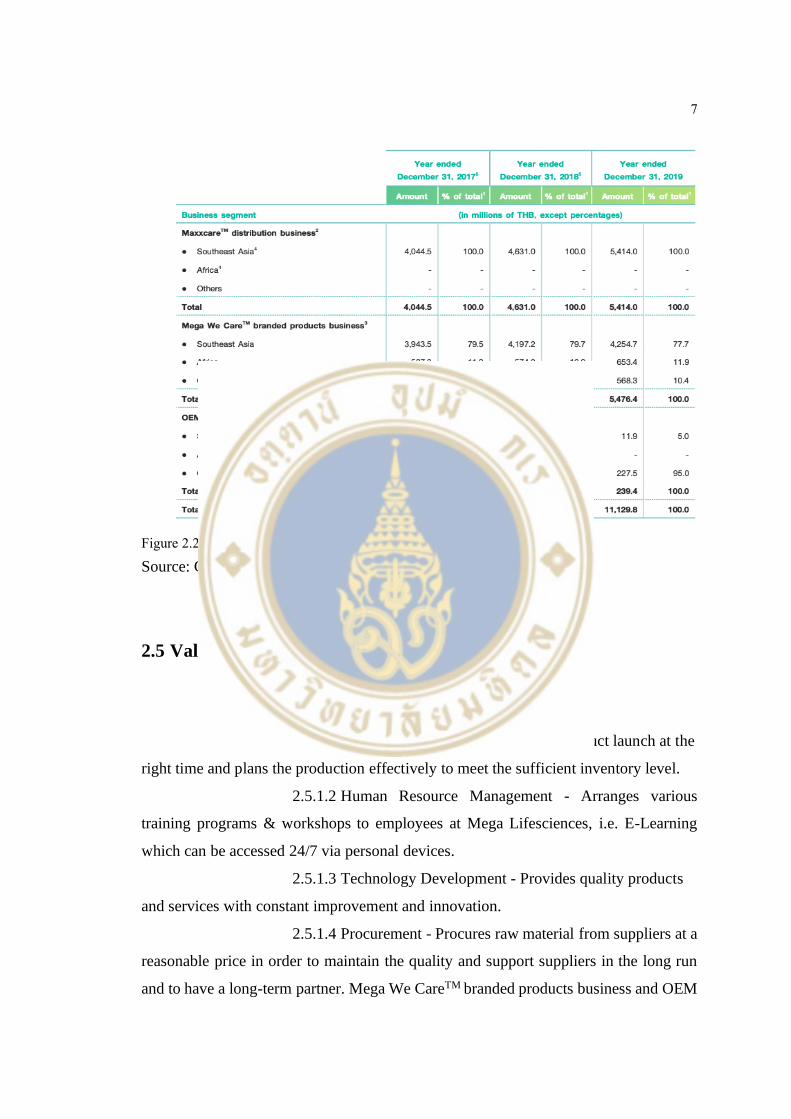
7
Figure 2.2 Revenue by regions Source: Company Report 2019
2.5 Value chain
2.5.1 Support activities
2.5.1.1 Infrastructure - Plans to have new product launch at the
right time and plans the production effectively to meet the sufficient inventory level.
2.5.1.2 Human Resource Management - Arranges various
training programs & workshops to employees at Mega Lifesciences, i.e. E-Learning
which can be accessed 24/7 via personal devices.
2.5.1.3 Technology Development - Provides quality products
and services with constant improvement and innovation.
2.5.1.4 Procurement - Procures raw material from suppliers at a
reasonable price in order to maintain the quality and support suppliers in the long run
and to have a long-term partner. Mega We CareTM branded products business and OEM
8
business rely on 4 types of raw materials. 1.Active ingredients 2. Excipient 3. Packaging
4. Gelatin.
2.5.2 Primary activities
2.5.2.1 Inbound Logistics - obtain 4 types of raw materials.
1.Active ingredients 2. Excipient 3. Packaging 4. Gelatin.
2.5.2.2 Operations - Produce Herbal medicines, Probiotics for
life, Eugica (Natural cold & cough care, Medical nutrition, Condition specific
vitamins.
2.5.2.3 Outbound Logistics - distribute products across south
east Asia, and Africa to clients, namely, leading domestic and international
pharmaceutical and FMCG (Fast-moving consumer goods) companies.
2.5.2.4 Marketing & Sales – sales products throughout 34
countries and advertises on public television channels.
2.5.2.5 Services - provides company visitation to customer
regularly and provides knowledge building programs by key speakers and other
programs.
2.6 SWOT analysis
2.6.1 Strengths
2.6.1.1 A leader in pharmaceutical and nutraceutical in fast
growing developing markets, particularly in Myanmar where it contributed 70%
proportion in overall Maxxcare business in FY19.
2.6.1.2 A leader in distribution of pharmaceutical and OTC
products in Myanmar, Vietnam and Cambodia.
2.6.2 Weaknesses
2.6.2.1 Expiry in manufacturing license may cause the company
to disrupt the production line.

9
2.6.3 Opportunities
2.6.3.1 New market in Colombia.
2.6.3.2 The governments of Myanmar and Vietnam permitted
MEGA’s subsidiaries to import more pharmaceutical and consumer goods to their
countries. As a result, the proportion of Maxxcare sales increased.
2.6.3.3 The supplement market in Asian countries is growing.
In 2017, the proportion of supplement sales in Asian market was highest compare to the
world. (Source: Nutrition Business Journal)
2.6.4 Threats
2.6.4.1 Consumer real disposable income stalls or decreases
could impact the demand for products.
2.6.4.2 Expiring patents.
2.6.4.3 Changes in laws and regulations, particularly in
Myanmar, Vietnam and Cambodia.
2.6.4.4 Changes in consumer preferences.
10
CHAPTER III
ANALYSIS OF MACROECONOMY, INDUSTRY AND
COMPETITORS
3.1 Macro-Economies analysis
3.1.1 Global gross domestic product
Global economy growth is forecasted at -4.4% in 2020 according to world
economy outlook released data from International Monetary Fund. In 2H2020,
developed economies mostly activity resume rapidly more than expected after
lockdowns were reduced, but many countries are still partially re-opened, and some are
reinstating partial lockdowns. Global growth is projected at 5.2% in 2021 recovery
from the previous year with downtrend forecast due to expectation of continued social
distancing. The growth forecasts indicate broad negative production gaps and increased
unemployment rates this year and in 2021 over advanced and emerging market
economics. In the long term, after recovery in 2021 the global growth is gradually slow
about 3.2% as before pandemic level for advanced and emerging market economies.
The pandemic will increase inequality and poverty. People who live with daily wage
probably confront income losses. Moreover, about 90 million people could drop below
the $1.90 a day income. The projection is based on continued social distancing into 2021
and it will gradually fade as vaccines are produced and expanded. Local transmission
would decrease to low level at the end of 2022. The huge impacts of the pandemic will
drag potential productivity growth, investment in physical capital and technology
blending with material of production.
11
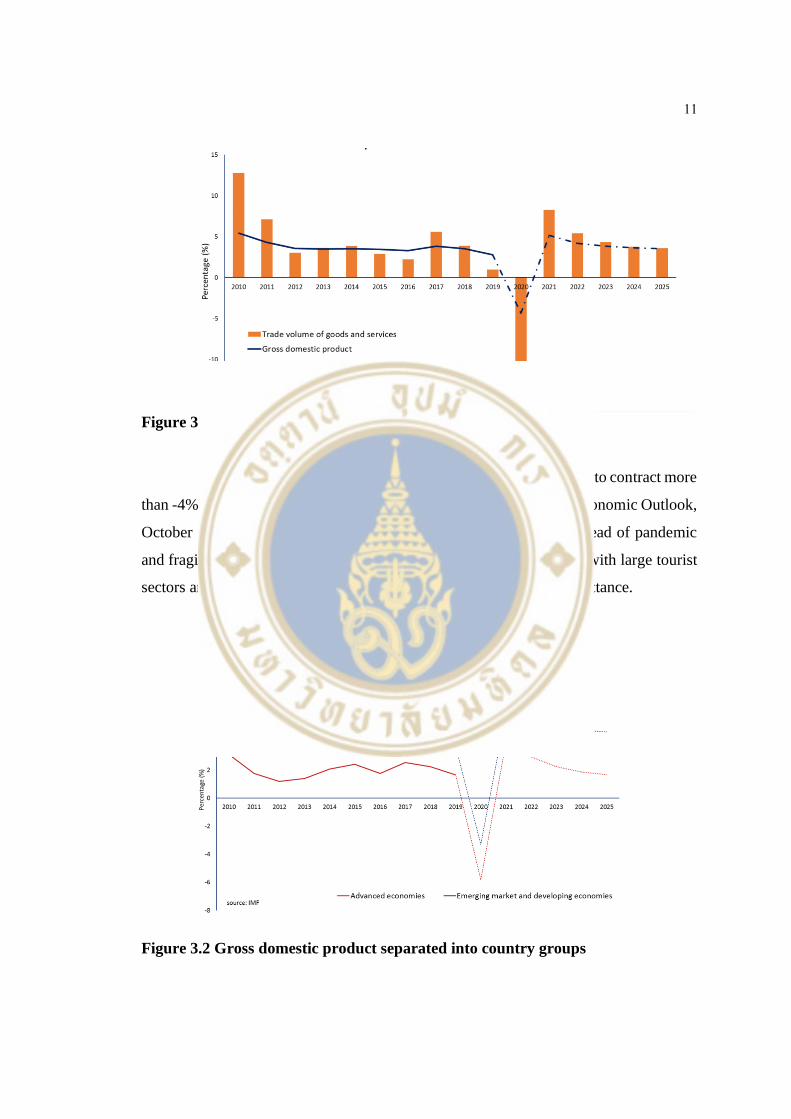
Figure 3.1 World gross domestic product
All emerging market and developing economy are expected to contract more
than -4% in 2020 before rebounding about 8% in 2021 (IMF, World Economic Outlook,
October 2020), overview remains uncertain due to the continuing spread of pandemic
and fragile health care systems. The most critically affected countries with large tourist
sectors and the greater dependence on external finance, including remittance.
Figure 3.2 Gross domestic product separated into country groups
12
3.1.2 Global inflation
Inflation in advanced economies continues below pre-pandemic level,
emerging market and developing economies decreases sharply. Inflation remains low
due to consumers increase spending on goods or services that they had been forced to
delay consuming because of lockdowns and restriction on movement. They also highly
perceive risk of joblessness and falling sick by prompted saving. In addition, lenders
have lower leading as borrow service due to the high debt occurred during pandemic
and concerning about the limited of monetary policy’s ability to generate demand (IMF,
World Economic Outlook, October 2020 P.3)
Figure 3.3 Global inflation (average consumer prices)
3.1.3 Monetary policy rate
Many countries in advanced economies confront the prompted challenge of
restraining of the virus spread, improving health system and developing a treatment as
well as stimulating economies from the pandemic (A World Bank Group, Global
Economies Prospects) The central bank in many advanced economies are using
quantitative easing on a huge scale and developing new tools to support demand and
financial market. Advanced economy central banks suddenly ease monetary policy rate
cutting policy rates in most advanced economies close to or below zero at the same time,
the central banks have executed extra measures to ease tight credit markets. In the other
hand, central bank in emerging market and developed economies also response the
13
pandemic immediately by sharply cutting their policy rate using various monetary and
financial policy to support the flow in financial market. Some have implemented easing
program by asset purchase which mostly is government bonds and private bonds to
stabilize yield of long maturity which sharply increase among tight liquidity.
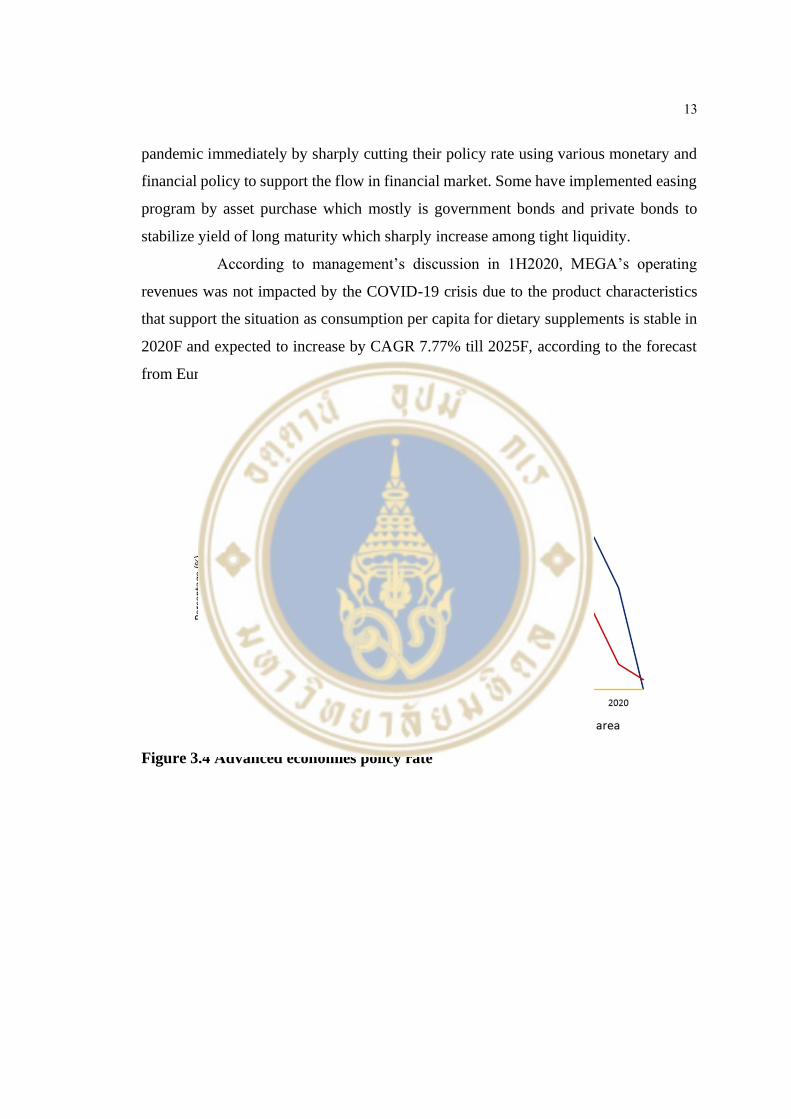
According to management’s discussion in 1H2020, MEGA’s operating
revenues was not impacted by the COVID-19 crisis due to the product characteristics
that support the situation as consumption per capita for dietary supplements is stable in
2020F and expected to increase by CAGR 7.77% till 2025F, according to the forecast
from Euromonitor.
Figure 3.4 Advanced economies policy rate
14
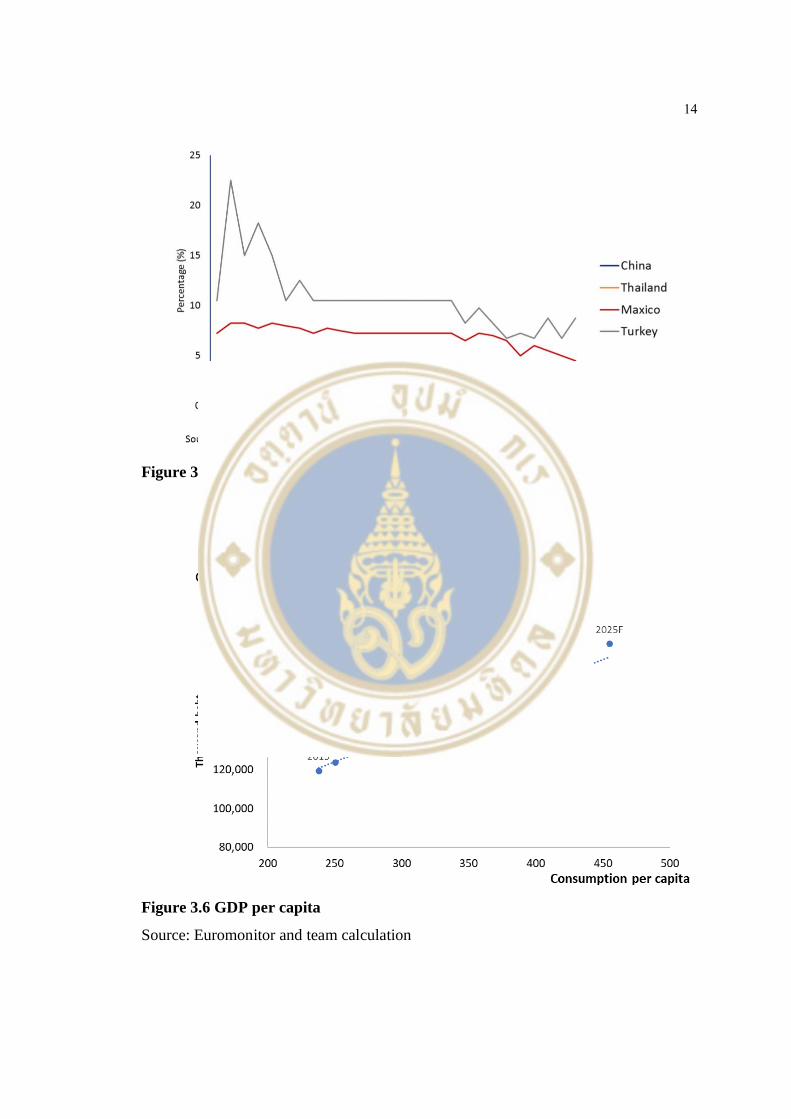
Figure 3.5 Emerging market economies policy rate
Figure 3.6 GDP per capita
Source: Euromonitor and team calculation
15
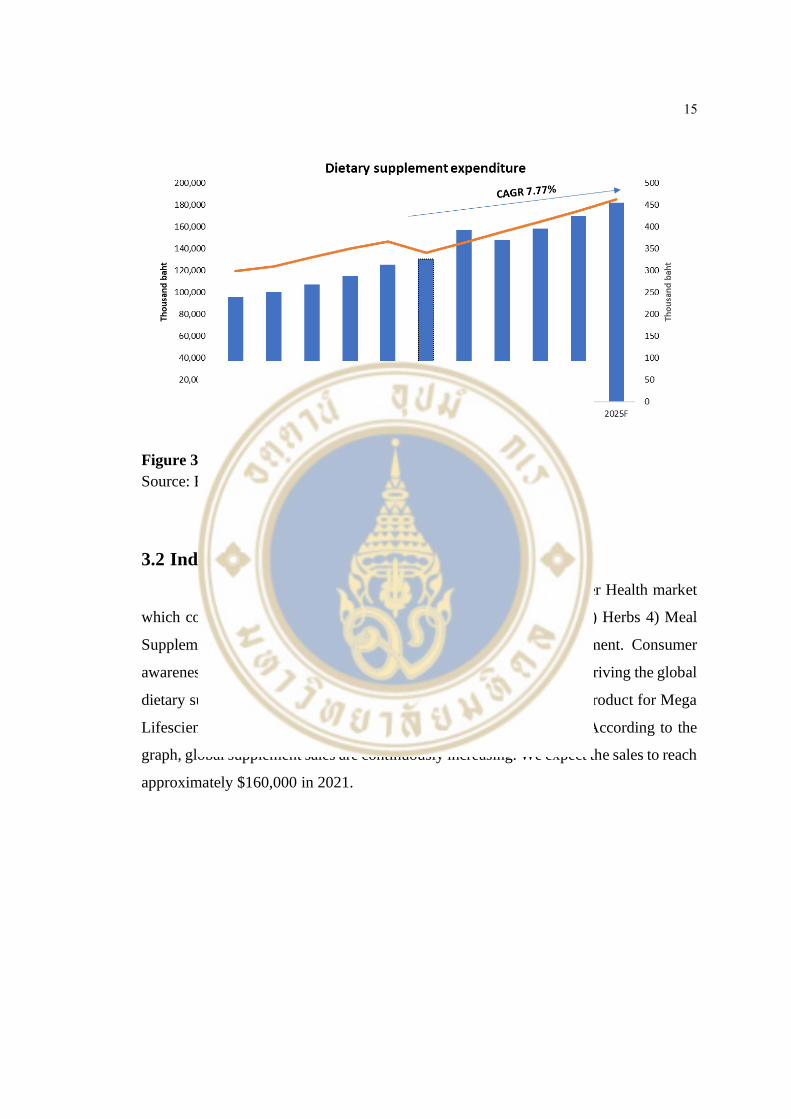
Figure 3.7 Dietary supplement expenditure
Source: Euromonitor and team calculation
3.2 Industry analysis
Dietary supplement is the greatest section of the Consumer Health market
which contains six main product sections: 1) Vitamins 2) Minerals 3) Herbs 4) Meal
Supplements 5) Sports Nutrition Supplements 6) Specialty Supplement. Consumer
awareness regarding preventative healthcare and aging population are driving the global
dietary supplement market. Moreover, dietary supplement is the key product for Mega
Lifesciences and a key supporter to the Consumer Health Business. According to the
graph, global supplement sales are continuously increasing. We expect the sales to reach
approximately $160,000 in 2021.
16
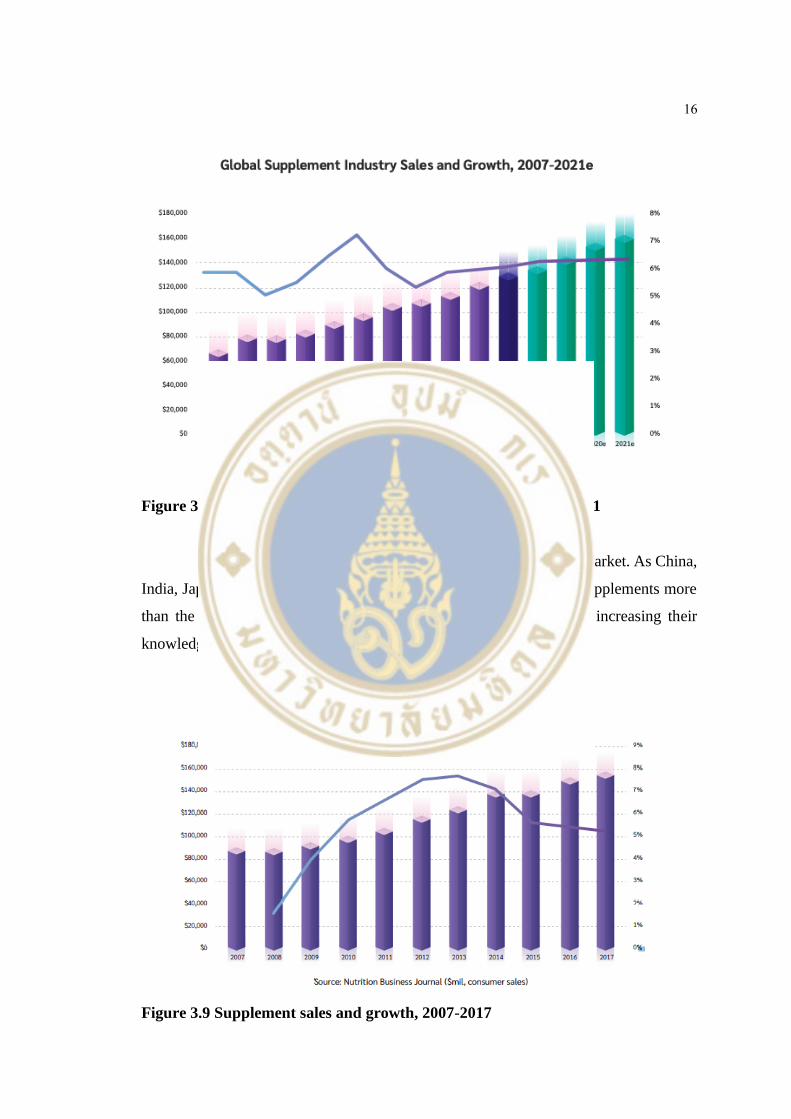
Figure 3.8 Global supplement industry sales and growth, 2007-2021
In Asia, overall countries are growing faster than the U.S market. As China,
India, Japan and other Asian countries were spending the money on supplements more
than the U.S. due to consumers access through digital information, increasing their
knowledge of medicine advantages and preventing future illness.
Figure 3.9 Supplement sales and growth, 2007-2017
17
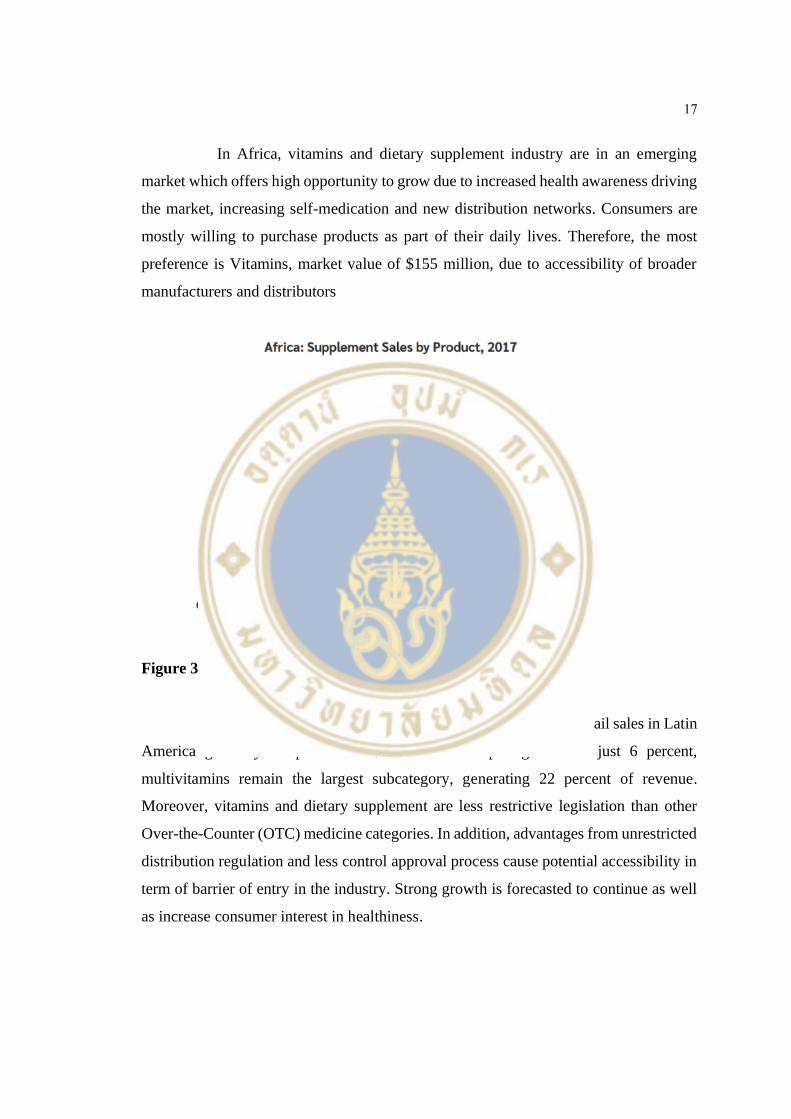
In Africa, vitamins and dietary supplement industry are in an emerging
market which offers high opportunity to grow due to increased health awareness driving
the market, increasing self-medication and new distribution networks. Consumers are
mostly willing to purchase products as part of their daily lives. Therefore, the most
preference is Vitamins, market value of $155 million, due to accessibility of broader
manufacturers and distributors
Figure 3.10 Supplement sales by product,2017
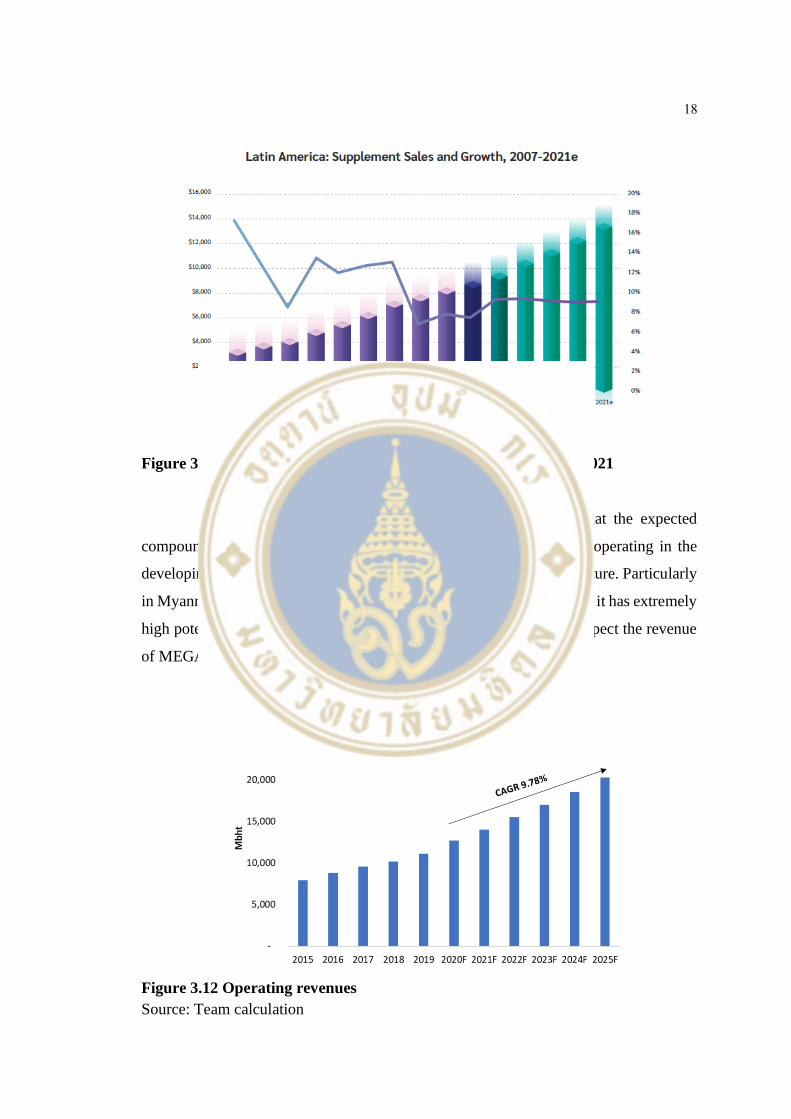
In Central and south America, In Q2 2018, overall VMS retail sales in Latin
America grew by 14 percent to $1.7 billion. Despite growth of just 6 percent,
multivitamins remain the largest subcategory, generating 22 percent of revenue.
Moreover, vitamins and dietary supplement are less restrictive legislation than other
Over-the-Counter (OTC) medicine categories. In addition, advantages from unrestricted
distribution regulation and less control approval process cause potential accessibility in
term of barrier of entry in the industry. Strong growth is forecasted to continue as well
as increase consumer interest in healthiness.
18
Figure 3.11 Latin American: Supplement sales and growth,2007-2021
In summary, our operating revenue forecasted shows that the expected
compounding growth rate is approximately 9.78% due to MEGA is operating in the
developing countries which has high potential to grow further in the future. Particularly
in Myanmar, the market size of Myanmar is only 1 to 10 of Thailand, so it has extremely
high potential growth. As Myanmar's supplement market rise, we expect the revenue
of MEGA to increase as well.
Figure 3.12 Operating revenues
Source: Team calculation
19
3.3 Competition analysis
3.3.1 Five force model
3.3.1.1 Buyer power (High) – MEGA’s products are
supplements. Customers may be sensitive to the price as it’s not necessary in daily life.
By raising prices, the company must consider that buyers can compare the price with
the alternative products on the internet easily.
3.3.1.2 Threat of substitutes (Moderate) – Some people may
prefer to consume supplement drinks instead of vitamins. If the company raises
vitamin’s prices, consumers might find it expensive. They switch to consuming
supplement drinks, and this impacts the sales of MEGA.
3.3.1.3 Rivalry within the Industry (High) – MEGA have both
international and domestic rivals. Most of rivals have stayed within the industry for
many years and are well perceived by the customer. Not only dietary supplement has
low product differentiation, but also has low switching costs.
3.3.1.4 Threat of new entrants (Low) – New domestic and
foreign competitors require great investments in research and development, technical
know-how, and distribution. This makes it less likely new companies enter the industry
and bring the negative impact to the business.
3.3.1.5 Supplier power (Moderate) – MEGA do not have long-
term supply agreements with the raw material suppliers which leads to high risk of
shortage in supply and varying market price. In that case, MEGA must acquire raw
materials from different suppliers, who might charge a higher price or provide raw
materials that do not meet expected quality.
3.4 Company’s current situation of 9M20
In 2020, MEGA has change its business structure by increasing sale
proportion of Maxxcare due to the government of Myanmar and Vietnam permitted
MEGA’s subsidiaries to import pharmaceutical and consumer goods to their countries
20
alongside with the local importers. The business re-structured will affect to the revenue,
gross profits and SG&A expenses, but not to the EBITDA and net profits.
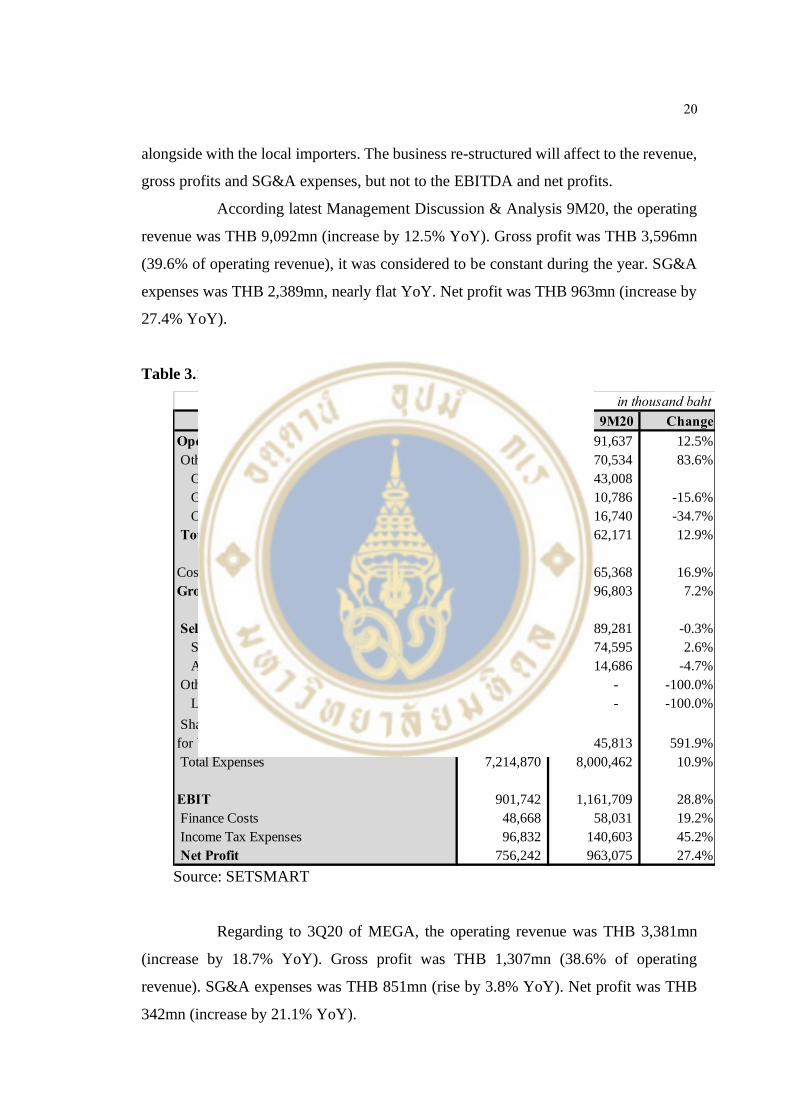
According latest Management Discussion & Analysis 9M20, the operating
revenue was THB 9,092mn (increase by 12.5% YoY). Gross profit was THB 3,596mn
(39.6% of operating revenue), it was considered to be constant during the year. SG&A
expenses was THB 2,389mn, nearly flat YoY. Net profit was THB 963mn (increase by
27.4% YoY).
Table 3.1 9M20 performance
Source: SETSMART
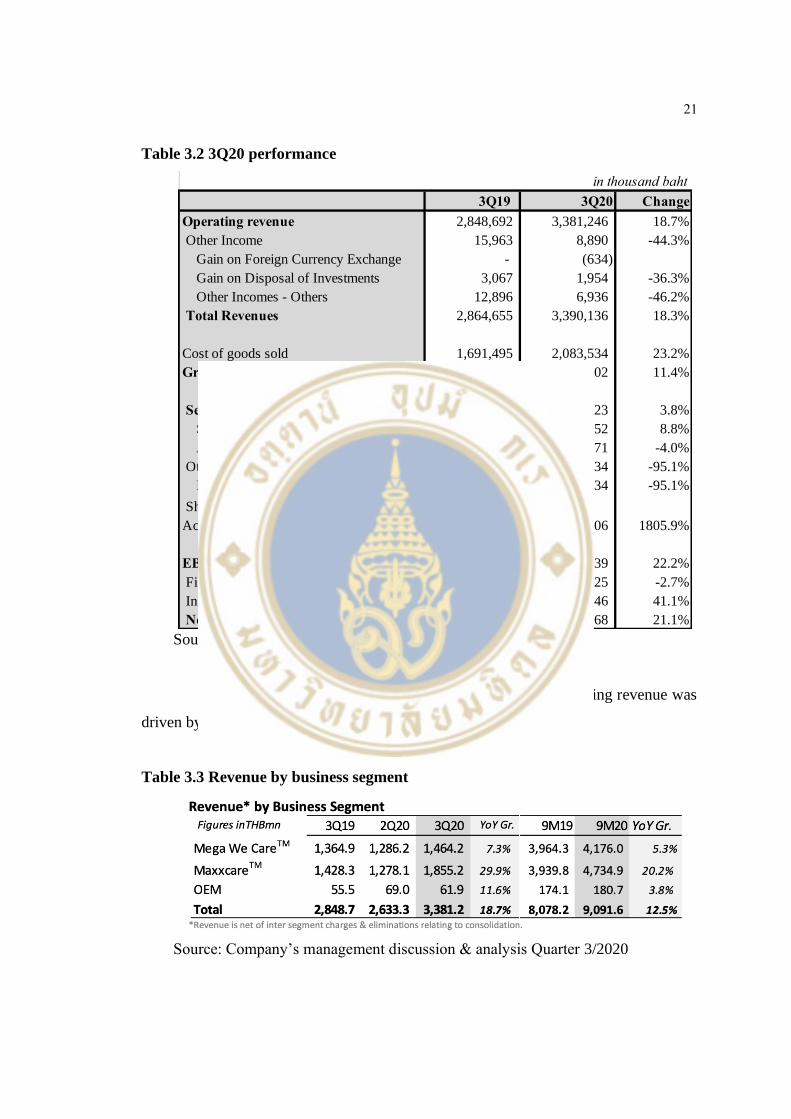
Regarding to 3Q20 of MEGA, the operating revenue was THB 3,381mn
(increase by 18.7% YoY). Gross profit was THB 1,307mn (38.6% of operating
revenue). SG&A expenses was THB 851mn (rise by 3.8% YoY). Net profit was THB
342mn (increase by 21.1% YoY).
in thousand baht
9M19 9M20 Change
Operating revenue 8,078,197 9,091,637 12.5%
Other Income 38,415 70,534 83.6%
Gain on Foreign Currency Exchange - 43,008
Gain on Disposal of Investments 12,781 10,786 -15.6%
Other Incomes - Others 25,634 16,740 -34.7%
Total Revenues 8,116,612 9,162,171 12.9%
Cost of goods sold 4,759,857 5,565,368 16.9%
Gross profit 3,356,755 3,596,803 7.2%
Selling and Administrative Expenses 2,396,843 2,389,281 -0.3%
Selling Expenses 1,436,696 1,474,595 2.6%
Administrative Expenses 960,147 914,686 -4.7%
Other Expenses 51,549 - -100.0%
Loss on Foreign Currency Exchange 51,549 - -100.0%
Shares of Losses From Investments Accounted
for Using the Equity Method 6,621 45,813 591.9%
Total Expenses 7,214,870 8,000,462 10.9%
EBIT 901,742 1,161,709 28.8%
Finance Costs 48,668 58,031 19.2%
Income Tax Expenses 96,832 140,603 45.2%
Net Profit 756,242 963,075 27.4%
21
Table 3.2 3Q20 performance
Source: SETSMART
It can be seen clearly from the table that the overall operating revenue was
driven by Maxxcare business.
Table 3.3 Revenue by business segment
Source: Company’s management discussion & analysis Quarter 3/2020
in thousand baht
3Q19 3Q20 Change
Operating revenue 2,848,692 3,381,246 18.7%
Other Income 15,963 8,890 -44.3%
Gain on Foreign Currency Exchange - (634)
Gain on Disposal of Investments 3,067 1,954 -36.3%
Other Incomes - Others 12,896 6,936 -46.2%
Total Revenues 2,864,655 3,390,136 18.3%
Cost of goods sold 1,691,495 2,083,534 23.2%
Gross profit 1,173,160 1,306,602 11.4%
Selling and Administrative Expenses 819,426 850,923 3.8%
Selling Expenses 500,725 544,952 8.8%
Administrative Expenses 318,701 305,971 -4.0%
Other Expenses 12,904 634 -95.1%
Loss on Foreign Currency Exchange 12,904 634 -95.1%
Shares of Losses From Investments
Accounted for Using the Equity Method 2,162 41,206 1805.9%
EBIT 338,668 413,839 22.2%
Finance Costs 17,394 16,925 -2.7%
Income Tax Expenses 39,140 55,246 41.1%
Net Profit 282,134 341,668 21.1%
22
CHAPTER IV
VALUATION
4.1 Financial analysis
4.1.1 Dupont’s analysis
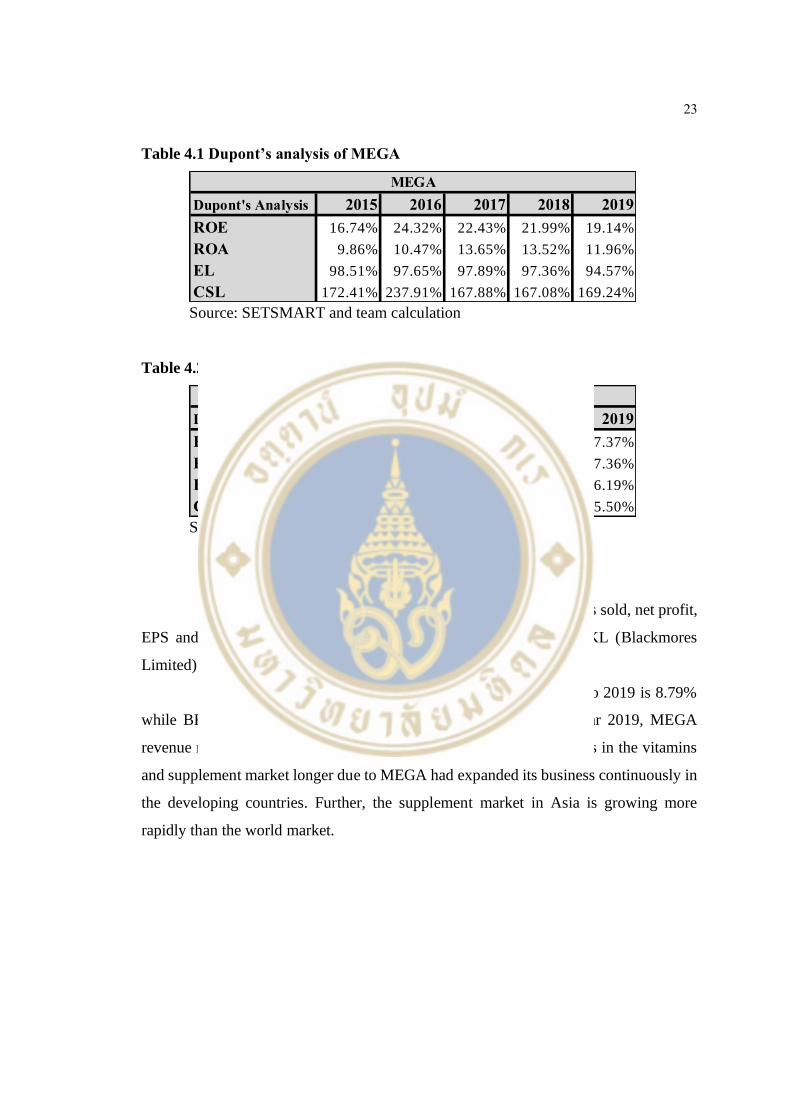
Due to the fact that Dupont’s analysis is a tool to analyze fundamental
performance of companies, so we use this method to analyze MEGA’s performance in
comparison to its key competitor, BKL. From the past 5 years, return on equity of
MEGA gradually increases to 19.14% from 16.74% (2015), meaning that out of 100
baht of an equity investment, shareholders would get a return back in the form of net
income by 19.14 baht. In terms of earning leverage (EL), it’s a measurement of
company’s net income compared to its net operating profit after tax. MEGA had 94.57%
earning leverage in 2019 which slightly declined by 3.94% from 2015. It means that its
net income was only 94.57% of the net income that it would have had if it has no debt.
For capital structure leverage (CSL), it compares average total assets to an average
equity. MEGA had 169.24% capital structure leverage in 2019 which decreased by
3.17% from 2015. It means that the value of the firm’s total assets is 169.24% that of
the value of the firm’s equity
In contrast, BKL’s return on equity significantly dropped from 53.73%
(2015) to 17.37% (2019) which mean out of 100 baht, the investors get the return back
less than previous for 36.36 baht.
Overall, it seems that in 2019 MEGA was doing better than BKL based on
Dupont’s analysis due to an increase in ROA in the past five years. However, the net
income declined because lower earnings leverage, but it was compensated by low debt
accumulation due to a reduction on capital structure leverage that reflects lower risk.
23
Table 4.1 Dupont’s analysis of MEGA
Source: SETSMART and team calculation
Table 4.2 Dupont’s analysis of BKL
Source: Reuters and team calculation
4.1.2 Growth analysis
This section compares the growth of revenue, cost of goods sold, net profit,
EPS and free cash flow between MEGA and its key competitor BKL (Blackmores
Limited).
MEGA revenue was in upward trend, CAGR from 2015 to 2019 is 8.79%
while BKL was in a downward trend, CAGR -5.69%. In fiscal year 2019, MEGA
revenue reach to the peak and almost in the same level as BKL who is in the vitamins
and supplement market longer due to MEGA had expanded its business continuously in
the developing countries. Further, the supplement market in Asia is growing more
rapidly than the world market.
Dupont's Analysis 2015 2016 2017 2018 2019
ROE 16.74% 24.32% 22.43% 21.99% 19.14%
ROA 9.86% 10.47% 13.65% 13.52% 11.96%
EL 98.51% 97.65% 97.89% 97.36% 94.57%
CSL 172.41% 237.91% 167.88% 167.08% 169.24%
MEGA
Dupont's Analysis 2015 2016 2017 2018 2019
ROE 53.73% 48.85% 37.35% 36.24% 17.37%
ROA 25.93% 22.56% 16.12% 16.24% 7.36%
EL 98.20% 97.74% 97.96% 96.13% 96.19%
CSL 210.97% 221.52% 236.52% 232.17% 245.50%
BKL

24
Figure 4.1 Core revenue trend of MEGA and BKL
Source: SETSMART, Reuters and team calculation
According to cost of goods sold chart, it seems that BKL able to manage the
cost better than MEGA. However, MEGA able manage cost as good as previous by
maintaining the cost approximately 54%-59% comparing to sales for all five years.
Figure 4.2 Cost of goods sold trend of MEGA and BKL Source: SETSMART, Reuters and team calculation
7,945 8,810
9,597 10,182 11,130
15,610 16,763
14,985 15,281
12,351
-
5,000
10,000
15,000
20,000
2015 2016 2017 2018 2019
Mth
bCore Revenue
MEGA BKL
4,538
5,123 5,277
5,791
6,551
4,794
5,747
6,293
5,911
5,075
2,000
2,500
3,000
3,500
4,000
4,500
5,000
5,500
6,000
6,500
7,000
2015 2016 2017 2018 2019
Mth
b
Cost of Goods Sold
MEGA BKL
25
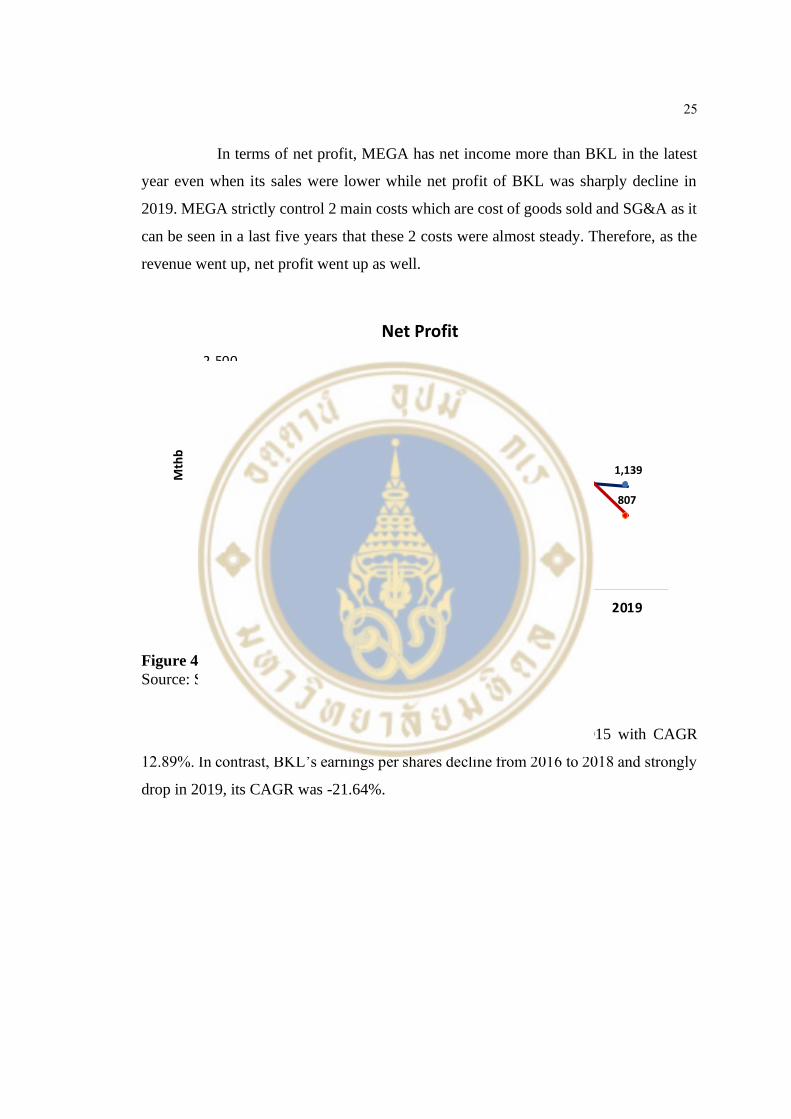
In terms of net profit, MEGA has net income more than BKL in the latest
year even when its sales were lower while net profit of BKL was sharply decline in
2019. MEGA strictly control 2 main costs which are cost of goods sold and SG&A as it
can be seen in a last five years that these 2 costs were almost steady. Therefore, as the
revenue went up, net profit went up as well.
Figure 4.3 Net profit trend of MEGA and BKL Source: SETSMART, Reuters and team calculation
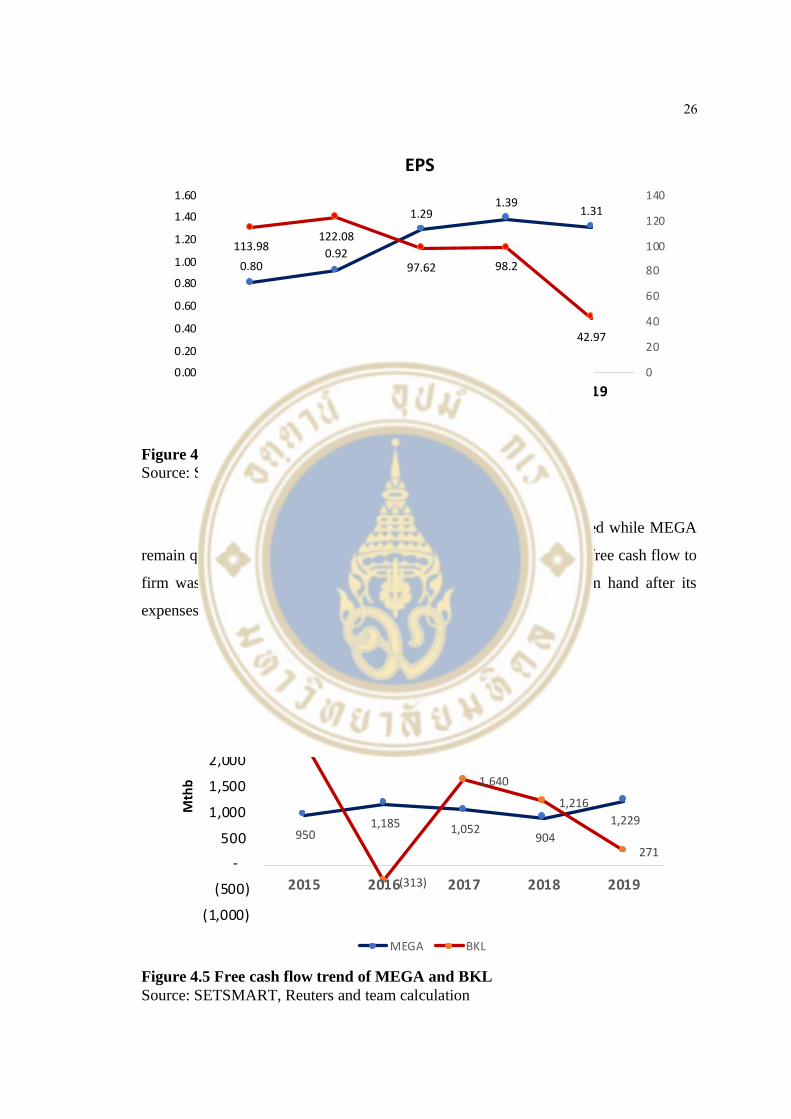
Earnings Per Share of MEGA increase steadily from 2015 with CAGR
12.89%. In contrast, BKL’s earnings per shares decline from 2016 to 2018 and strongly
drop in 2019, its CAGR was -21.64%.
696 795
1,113 1,206
1,139
1,960 2,103
1,682 1,693
807
-
500
1,000
1,500
2,000
2,500
2015 2016 2017 2018 2019
Mth
b
Net Profit
MEGA BKL
26
Figure 4.4 EPS trend of MEGA and BKL
Source: SETSMART, Reuters and team calculation
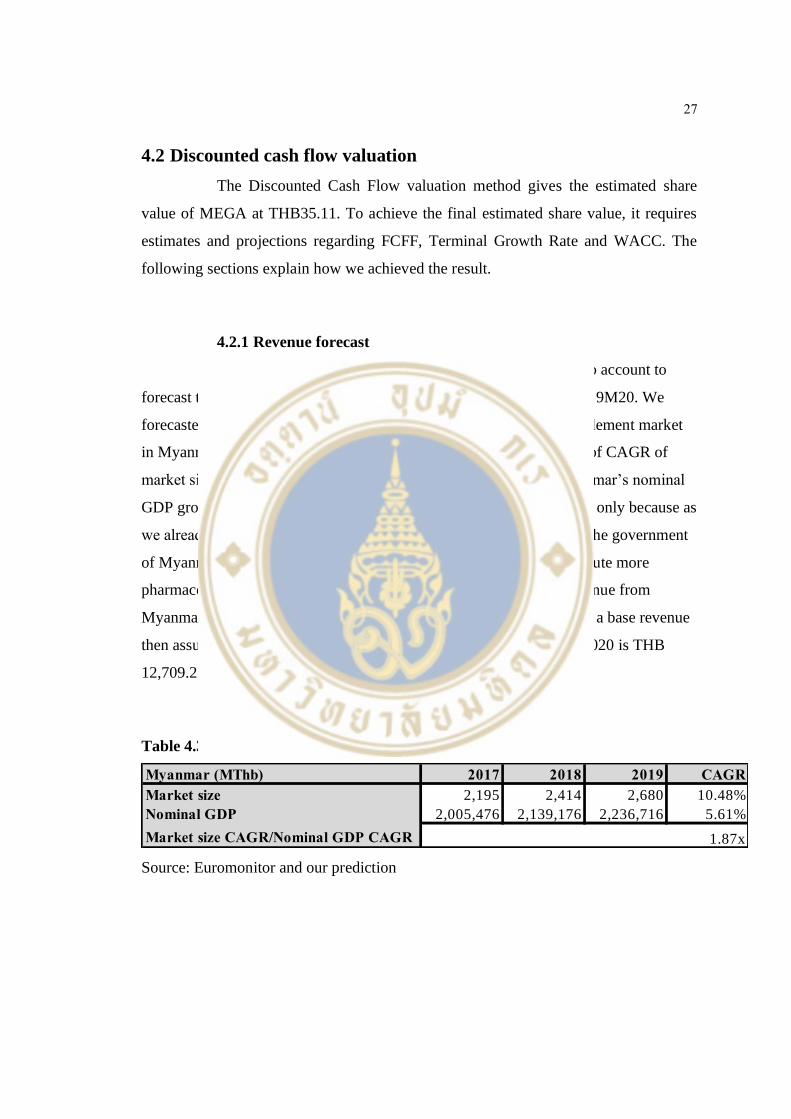
It is apparent that free cash flow of BKL is very fluctuated while MEGA
remain quite constant in the last 5 years and in the latest year MEGA free cash flow to
firm was higher than BKL which means MEGA has higher cash on hand after its
expenses.
Figure 4.5 Free cash flow trend of MEGA and BKL
Source: SETSMART, Reuters and team calculation
0.800.92
1.291.39
1.31
113.98122.08
97.62 98.2
42.97
0
20
40
60
80
100
120
140
0.00
0.20
0.40
0.60
0.80
1.00
1.20
1.40
1.60
2015 2016 2017 2018 2019
EPS
MEGA BKL(LHS)
950 1,185 1,052
904
1,229
2,375
(313)
1,640
1,216
271
(1,000)
(500)
-
500
1,000
1,500
2,000
2,500
3,000
2015 2016 2017 2018 2019
Mth
b
Free Cash Flow
MEGA BKL
27
4.2 Discounted cash flow valuation
The Discounted Cash Flow valuation method gives the estimated share
value of MEGA at THB35.11. To achieve the final estimated share value, it requires
estimates and projections regarding FCFF, Terminal Growth Rate and WACC. The
following sections explain how we achieved the result.
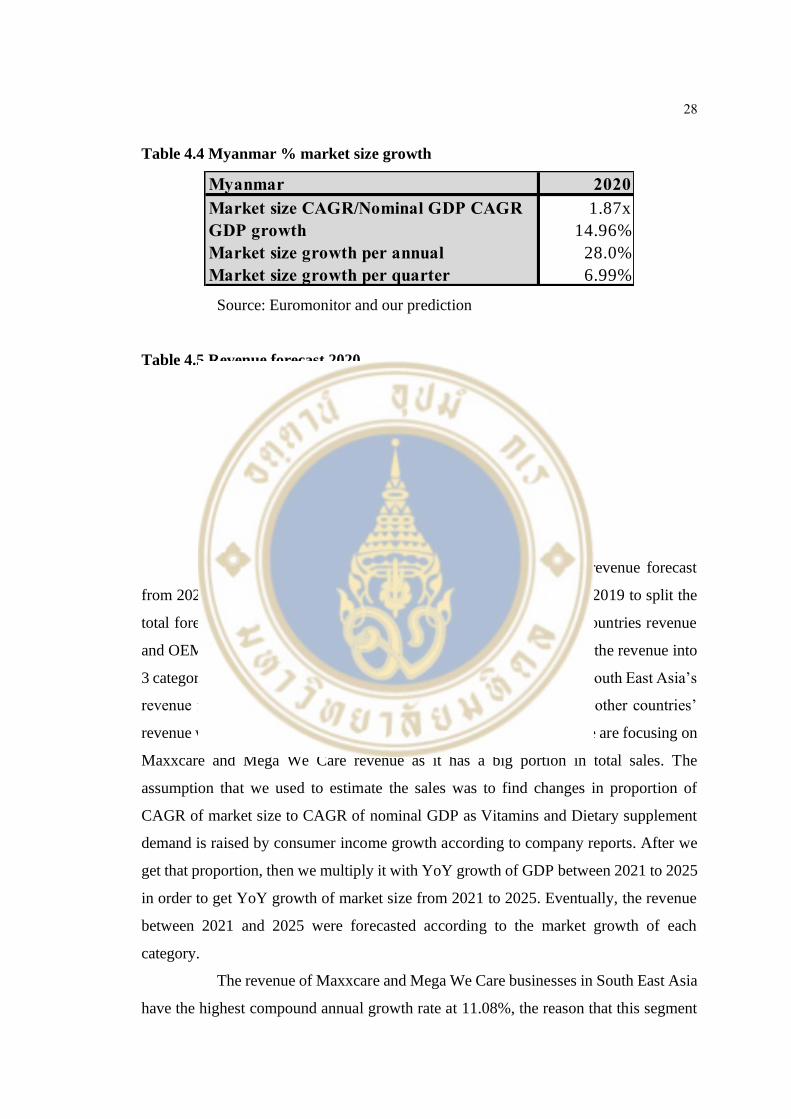
4.2.1 Revenue forecast
To start with the forecast of sale 2020F, we took 9M20 into account to
forecast the whole year. The operation revenue is THB 9,091.64 mn in 9M20. We
forecasted the revenue at Q4 to growth at 6.99% as the growth of supplement market
in Myanmar in 2020 is 28% from multiplied the change in proportion of CAGR of
market size over CAGR of nominal GDP in Myanmar 1.87 with Myanmar’s nominal
GDP growth 14.96%. The reason that we used the data from Myanmar only because as
we already mentioned in the company’s current situation in 2020 that the government
of Myanmar and Vietnam allowed the subsidiaries of MEGA to distribute more
pharmaceutical and consumer goods. Moreover, the proportion of revenue from
Myanmar is the largest. Finally, we forecasted Q420 by using Q320 as a base revenue
then assumed that it would grow at 6.99%, the forecasted revenue of 2020 is THB
12,709.22 mn.
Table 4.3 Myanmar market size CAGR over nominal GDP CAGR
Source: Euromonitor and our prediction
Myanmar (MThb) 2017 2018 2019 CAGR
Market size 2,195 2,414 2,680 10.48%
Nominal GDP 2,005,476 2,139,176 2,236,716 5.61%
Market size CAGR/Nominal GDP CAGR 1.87x
28
Table 4.4 Myanmar % market size growth
Source: Euromonitor and our prediction
Table 4.5 Revenue forecast 2020
Source: Euromonitor and our prediction
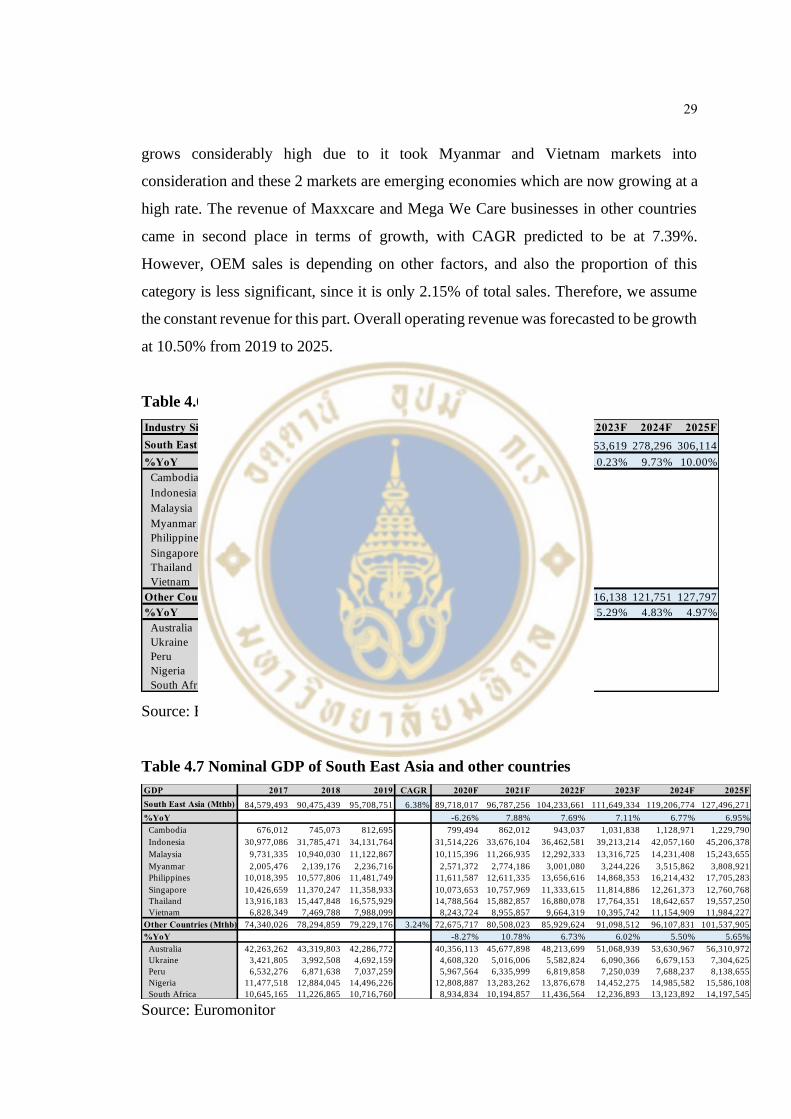
Revenue forecast between 2021 and 2025, we used the revenue forecast
from 2020 as a base year, we simply used the proportion of sale from 2019 to split the
total forecasted revenue of 2020 for South East Asia revenue, other countries revenue
and OEM by 86.9%, 11.0%, 2.2%, respectively. However, we divided the revenue into
3 categories. The first category is South East Asia revenue. It includes South East Asia’s
revenue from Maxxcare and Mega We Care. The second category is other countries’
revenue which is also from Maxxcare and Mega We Care business. We are focusing on
Maxxcare and Mega We Care revenue as it has a big portion in total sales. The
assumption that we used to estimate the sales was to find changes in proportion of
CAGR of market size to CAGR of nominal GDP as Vitamins and Dietary supplement
demand is raised by consumer income growth according to company reports. After we
get that proportion, then we multiply it with YoY growth of GDP between 2021 to 2025
in order to get YoY growth of market size from 2021 to 2025. Eventually, the revenue
between 2021 and 2025 were forecasted according to the market growth of each
category.
The revenue of Maxxcare and Mega We Care businesses in South East Asia
have the highest compound annual growth rate at 11.08%, the reason that this segment
Myanmar 2020
Market size CAGR/Nominal GDP CAGR 1.87x
GDP growth 14.96%
Market size growth per annual 28.0%
Market size growth per quarter 6.99%
MThb 2020 Change %
Q1 3,077.10
Q2 2,633.29 -14.42%
Q3 3,381.25 28.40%
Q4(F) 3,617.58 6.99%
12,709.22
29
grows considerably high due to it took Myanmar and Vietnam markets into
consideration and these 2 markets are emerging economies which are now growing at a
high rate. The revenue of Maxxcare and Mega We Care businesses in other countries
came in second place in terms of growth, with CAGR predicted to be at 7.39%.
However, OEM sales is depending on other factors, and also the proportion of this
category is less significant, since it is only 2.15% of total sales. Therefore, we assume
the constant revenue for this part. Overall operating revenue was forecasted to be growth
at 10.50% from 2019 to 2025.
Table 4.6 Growth of Vitamin and supplement industry
Source: Euromonitor and our prediction
Table 4.7 Nominal GDP of South East Asia and other countries
Source: Euromonitor
Industry Size 2017 2018 2019 CAGR 2020F 2021F 2022F 2023F 2024F 2025F
South East Asia (Mthb) 171,601 186,395 204,497 9.17% 186,098 207,176 230,088 253,619 278,296 306,114
%YoY -9.00% 11.33% 11.06% 10.23% 9.73% 10.00%
Cambodia 918 993 1,079
Indonesia 48,348 49,383 54,176
Malaysia 18,648 21,830 23,477
Myanmar 2,195 2,414 2,680
Philippines 17,163 17,281 18,758
Singapore 11,797 12,561 12,981
Thailand 55,960 63,655 71,370
Vietnam 16,571 18,278 19,978
Other Countries (Mthb) 96,992 101,569 102,588 2.84% 95,130 104,141 110,306 116,138 121,751 127,797
%YoY -7.27% 9.47% 5.92% 5.29% 4.83% 4.97%
Australia 65,995 67,014 64,402
Ukraine 7,299 8,850 11,653
Peru 10,690 11,144 11,485
Nigeria 2,742 3,026 3,329
South Africa 10,265 11,535 11,719
GDP 2017 2018 2019 CAGR 2020F 2021F 2022F 2023F 2024F 2025F
South East Asia (Mthb) 84,579,493 90,475,439 95,708,751 6.38% 89,718,017 96,787,256 104,233,661 111,649,334 119,206,774 127,496,271
%YoY -6.26% 7.88% 7.69% 7.11% 6.77% 6.95%
Cambodia 676,012 745,073 812,695 799,494 862,012 943,037 1,031,838 1,128,971 1,229,790
Indonesia 30,977,086 31,785,471 34,131,764 31,514,226 33,676,104 36,462,581 39,213,214 42,057,160 45,206,378
Malaysia 9,731,335 10,940,030 11,122,867 10,115,396 11,266,935 12,292,333 13,316,725 14,231,408 15,243,655
Myanmar 2,005,476 2,139,176 2,236,716 2,571,372 2,774,186 3,001,080 3,244,226 3,515,862 3,808,921
Philippines 10,018,395 10,577,806 11,481,749 11,611,587 12,611,335 13,656,616 14,868,353 16,214,432 17,705,283
Singapore 10,426,659 11,370,247 11,358,933 10,073,653 10,757,969 11,333,615 11,814,886 12,261,373 12,760,768
Thailand 13,916,183 15,447,848 16,575,929 14,788,564 15,882,857 16,880,078 17,764,351 18,642,657 19,557,250
Vietnam 6,828,349 7,469,788 7,988,099 8,243,724 8,955,857 9,664,319 10,395,742 11,154,909 11,984,227
Other Countries (Mthb) 74,340,026 78,294,859 79,229,176 3.24% 72,675,717 80,508,023 85,929,624 91,098,512 96,107,831 101,537,905
%YoY -8.27% 10.78% 6.73% 6.02% 5.50% 5.65%
Australia 42,263,262 43,319,803 42,286,772 40,356,113 45,677,898 48,213,699 51,068,939 53,630,967 56,310,972
Ukraine 3,421,805 3,992,508 4,692,159 4,608,320 5,016,006 5,582,824 6,090,366 6,679,153 7,304,625
Peru 6,532,276 6,871,638 7,037,259 5,967,564 6,335,999 6,819,858 7,250,039 7,688,237 8,138,655
Nigeria 11,477,518 12,884,045 14,496,226 12,808,887 13,283,262 13,876,678 14,452,275 14,985,582 15,586,108
South Africa 10,645,165 11,226,865 10,716,760 8,934,834 10,194,857 11,436,564 12,236,893 13,123,892 14,197,545
30
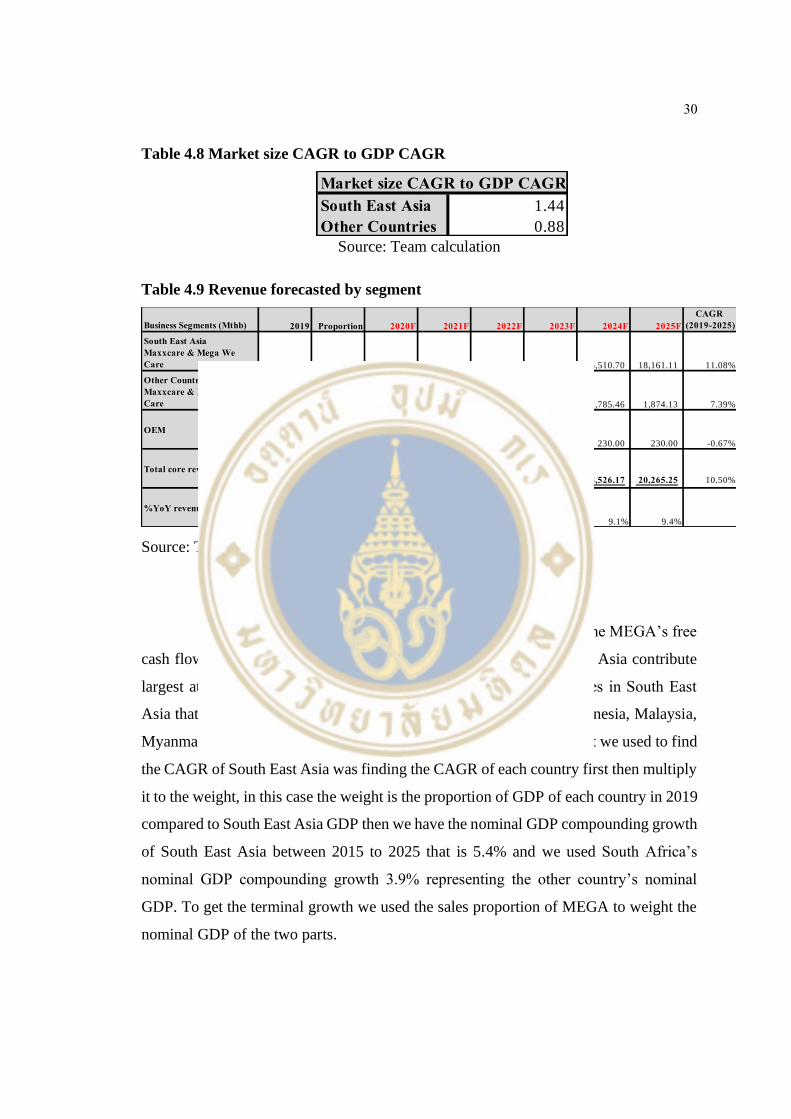
Table 4.8 Market size CAGR to GDP CAGR
Source: Team calculation
Table 4.9 Revenue forecasted by segment
Source: Team forecast
4.2.2 Terminal growth rate
The terminal growth rate at 5.16% is the rate that we assume MEGA’s free
cash flow would grow from 2025 onwards. Since sales of South East Asia contribute
largest at 86.87% to the company’s sales, so we included all countries in South East
Asia that MEGA currently operates which consists of Cambodia, Indonesia, Malaysia,
Myanmar, Philippines, Singapore, Thailand and Vietnam. The way that we used to find
the CAGR of South East Asia was finding the CAGR of each country first then multiply
it to the weight, in this case the weight is the proportion of GDP of each country in 2019
compared to South East Asia GDP then we have the nominal GDP compounding growth
of South East Asia between 2015 to 2025 that is 5.4% and we used South Africa’s
nominal GDP compounding growth 3.9% representing the other country’s nominal
GDP. To get the terminal growth we used the sales proportion of MEGA to weight the
nominal GDP of the two parts.
South East Asia 1.44
Other Countries 0.88
Market size CAGR to GDP CAGR
Business Segments (Mthb) 2019 Proportion 2020F 2021F 2022F 2023F 2024F 2025F
CAGR
(2019-2025)
South East Asia
Maxxcare & Mega We
Care 9,668.70 86.9% 11,040.77 12,291.30 13,650.62 15,046.65 16,510.70 18,161.11 11.08%
Other Countries
Maxxcare & Mega We
Care 1,221.70 11.0% 1,395.07 1,527.22 1,617.62 1,703.15 1,785.46 1,874.13 7.39%
OEM
239.40 2.2% 273.37 230.00 230.00 230.00 230.00 230.00 -0.67%
Total core revenue
11,129.80 100.0% 12,709.22 14,048.52 15,498.24 16,979.80 18,526.17 20,265.25 10.50%
%YoY revenue growth
9.3% 14.2% 10.5% 10.3% 9.6% 9.1% 9.4%
31
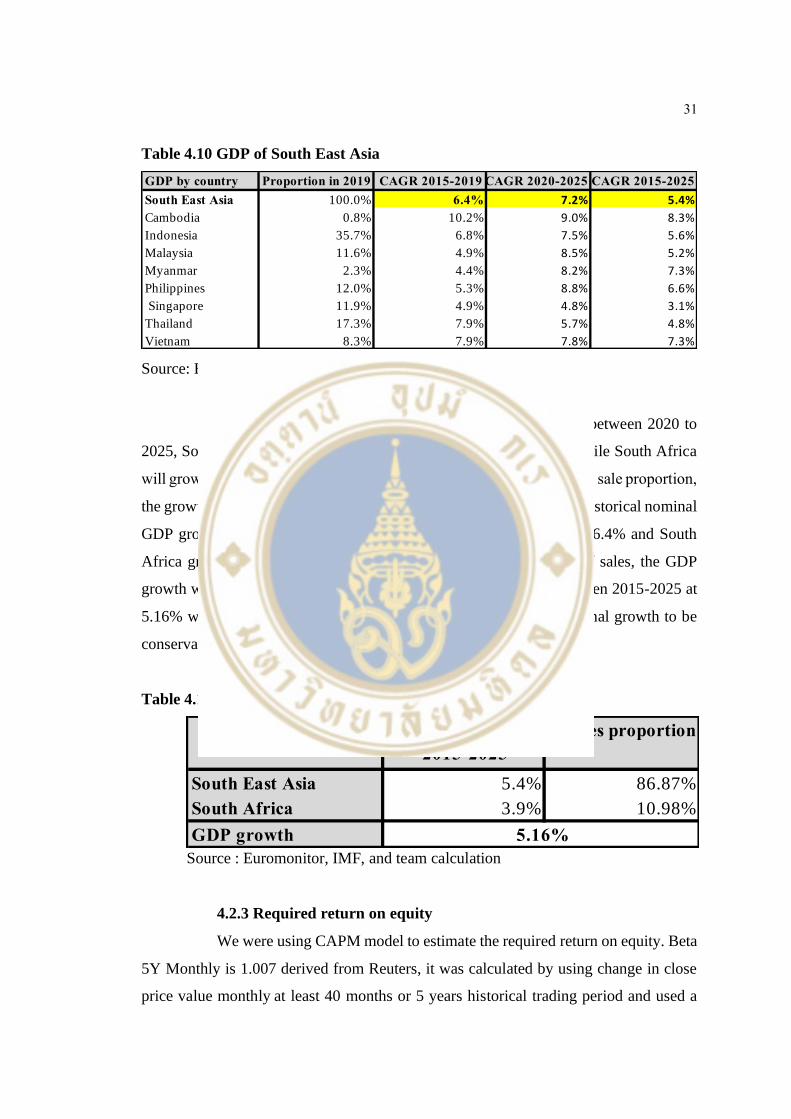
Table 4.10 GDP of South East Asia
Source: Euromonitor and team calculation
In comparison to the nominal GDP growth in the future between 2020 to
2025, South East Asia will grow at significantly high rate at 7.2%, while South Africa
will grow even higher rate at 9.70%. By weighting those to the MEGA’s sale proportion,
the growth would be 7.3%. Another rate that we used to compare was historical nominal
GDP growth between 2015 to 2019, South East Asia growth was at 6.4% and South
Africa growth was at 2.6%, then weight those with the proportion of sales, the GDP
growth would be 5.85%. Therefore, we chose the nominal GDP between 2015-2025 at
5.16% which considers both historical and future rate to be the terminal growth to be
conservative.
Table 4.11 Terminal growth rate of MEGA
Source : Euromonitor, IMF, and team calculation
4.2.3 Required return on equity
We were using CAPM model to estimate the required return on equity. Beta
5Y Monthly is 1.007 derived from Reuters, it was calculated by using change in close
price value monthly at least 40 months or 5 years historical trading period and used a
GDP by country Proportion in 2019 CAGR 2015-2019 CAGR 2020-2025 CAGR 2015-2025
South East Asia 100.0% 6.4% 7.2% 5.4%
Cambodia 0.8% 10.2% 9.0% 8.3%
Indonesia 35.7% 6.8% 7.5% 5.6%
Malaysia 11.6% 4.9% 8.5% 5.2%
Myanmar 2.3% 4.4% 8.2% 7.3%
Philippines 12.0% 5.3% 8.8% 6.6%
Singapore 11.9% 4.9% 4.8% 3.1%
Thailand 17.3% 7.9% 5.7% 4.8%
Vietnam 8.3% 7.9% 7.8% 7.3%
CAGR of GDP
2015-2025
Sales proportion
South East Asia 5.4% 86.87%
South Africa 3.9% 10.98%
GDP growth 5.16%
32
least squares linear regression line estimated the 5Y Monthly beta in order to know the
company’s stock price volatility to market price volatility. Risk-Free rate of 10 years
Thai government bond is 1.44%. The equity risk premium is 7.58%, acquired from
Damodaran. Finally, we have the required return on equity of 9.07%.
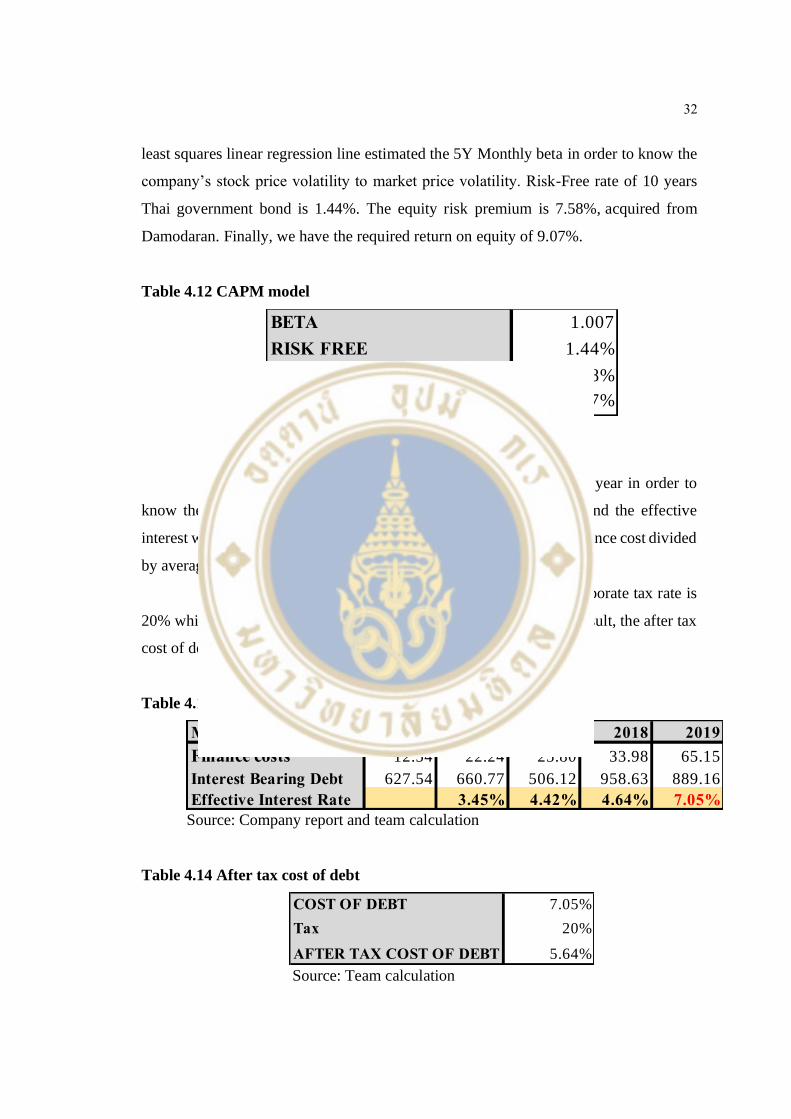
Table 4.12 CAPM model
4.2.4 Cost of debt
We estimated the cost of debt by using recent borrowing year in order to
know the types of default spreads that MEGA would be charged, and the effective
interest was 7.05% in 2019. The way that we calculated it was using finance cost divided
by average of interest bearing debt of current and previous years.
According to the revenue department of Thailand, the corporate tax rate is
20% which will be used to calculate the after tax cost of debt. As a result, the after tax
cost of debt of the company is 5.6%.
Table 4.13 Effective interest rate calculation
Source: Company report and team calculation
Table 4.14 After tax cost of debt
Source: Team calculation
BETA 1.007
RISK FREE 1.44%
EQUITY RISK PREMIUM 7.58%
RQD. RETURN ON EQUITY 9.07%
Mthb 2015 2016 2017 2018 2019
Finance costs 12.54 22.24 25.80 33.98 65.15
Interest Bearing Debt 627.54 660.77 506.12 958.63 889.16
Effective Interest Rate 3.45% 4.42% 4.64% 7.05%
COST OF DEBT 7.05%
Tax 20%
AFTER TAX COST OF DEBT 5.64%
33
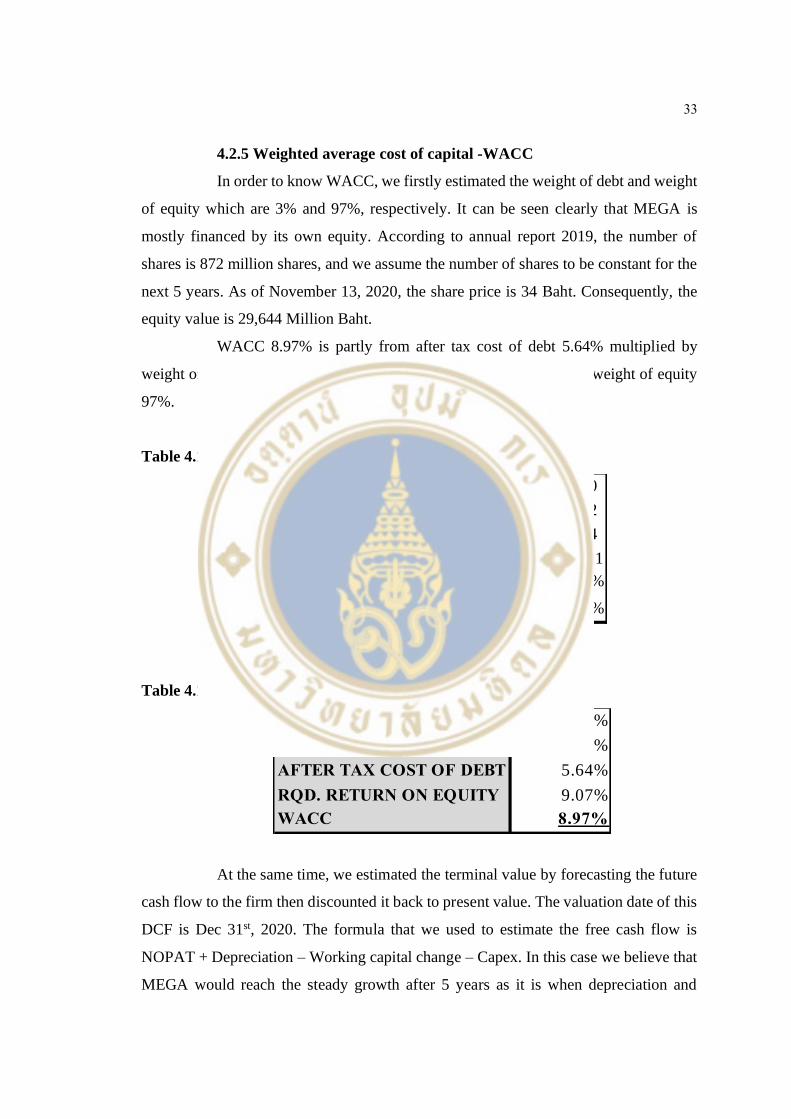
4.2.5 Weighted average cost of capital -WACC
In order to know WACC, we firstly estimated the weight of debt and weight
of equity which are 3% and 97%, respectively. It can be seen clearly that MEGA is
mostly financed by its own equity. According to annual report 2019, the number of
shares is 872 million shares, and we assume the number of shares to be constant for the
next 5 years. As of November 13, 2020, the share price is 34 Baht. Consequently, the
equity value is 29,644 Million Baht.
WACC 8.97% is partly from after tax cost of debt 5.64% multiplied by
weight of debt 3% and required return on equity 9.07% multiplied by weight of equity
97%.
Table 4.15 Weight of debt and equity
Table 4.16 WACC estimation
At the same time, we estimated the terminal value by forecasting the future
cash flow to the firm then discounted it back to present value. The valuation date of this
DCF is Dec 31st, 2020. The formula that we used to estimate the free cash flow is
NOPAT + Depreciation – Working capital change – Capex. In this case we believe that
MEGA would reach the steady growth after 5 years as it is when depreciation and
Share Price 34.00
Number of Shares (Mn) 872
Equity Value (BtMn) 29,644
Interest Bearing Debt (BtMn) 859.31
Weight of Debt 3%
Weight of Equity 97%
COST OF DEBT 7.05%
Tax 20%
AFTER TAX COST OF DEBT 5.64%
RQD. RETURN ON EQUITY 9.07%
WACC 8.97%
34
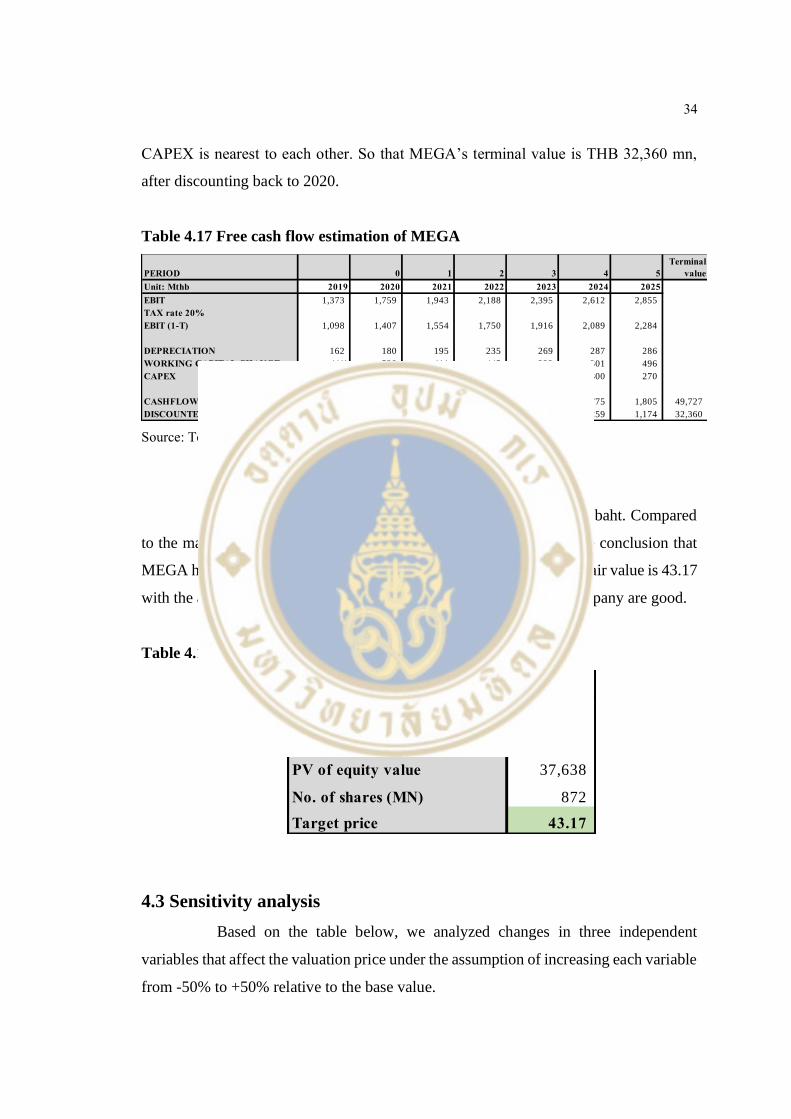
CAPEX is nearest to each other. So that MEGA’s terminal value is THB 32,360 mn,
after discounting back to 2020.
Table 4.17 Free cash flow estimation of MEGA
Source: Team prediction
4.2.6 Valuation summary
Eventually, the outcome of estimated share value is 43.17 baht. Compared
to the market price of 34 baht (As of Nov 13th ,2020), we come to the conclusion that
MEGA has upside of 27.0%. We recommend to BUY this stock as the fair value is 43.17
with the attractive upside of 27%, and the growth prospects of the company are good.
Table 4.18 Target price of MEGA
4.3 Sensitivity analysis
Based on the table below, we analyzed changes in three independent
variables that affect the valuation price under the assumption of increasing each variable
from -50% to +50% relative to the base value.
PERIOD 0 1 2 3 4 5
Terminal
value
Unit: Mthb 2019 2020 2021 2022 2023 2024 2025
EBIT 1,373 1,759 1,943 2,188 2,395 2,612 2,855
TAX rate 20%
EBIT (1-T) 1,098 1,407 1,554 1,750 1,916 2,089 2,284
DEPRECIATION 162 180 195 235 269 287 286
WORKING CAPITAL CHANGE (41) 528 411 445 222 301 496
CAPEX 529 431 408 400 330 300 270
CASHFLOW TO THE FIRM 773 628 930 1,140 1,633 1,775 1,805 49,727
DISCOUNTED CASHFLOW 628 854 960 1,262 1,259 1,174 32,360
2020
PV of firm value 38,497
Interest Bearing debt 859
PV of equity value 37,638
No. of shares (MN) 872
Target price 43.17

35
The cost of equity variable affects the target price the most, as it can be seen
clearly that when cost of equity is changed by -50%, the target price change significantly
to -285.67 baht (decrease 761.8%). On the other hand, changes in terminal growth
affects to price the least by causing the change in value only –35.9% when terminal
growth decreases by 50%.
Table 4.19 Sensitivity analysis in a range of ±50%
According to the table below, the implied WACC will be 9.97% in order to
have current stock price at 34 baht, with the implied cost of equity of 10.10% which is
relatively high. Moreover, when we assumed the terminal growth rate to fall to 3%, the
implied cost of equity changes to 8.02%. In comparison, company’s implied cost of
equity is higher than the MSCI Thailand SMID Cap return in the past 10 years (7.07%).
So, it can be concluded that the company is undervalued.
Table 4.20 Implied WACC and cost of equity
4.4 Valuation recommendation
We recommend to BUY the stock. From our DCF valuation, the stock is
undervalued. Current market price (34 baht) is lower than the estimated intrinsic value
(43.17 baht) with an upside of 27.0%.
Sensitivity Terminal Growth Price Change in value WACC Price Change in value Cost of Equity Price Change in value
-50% 2.58% 27.67 -35.9% 4.49% -255.25 -691.3% 4.53% -285.67 -761.8%
-40% 3.09% 29.66 -31.3% 5.38% 755.75 1650.7% 5.44% 583.98 1252.8%
-30% 3.61% 32.08 -25.7% 6.28% 149.43 246.2% 6.35% 143.01 231.3%
-20% 4.13% 35.02 -18.9% 7.18% 82.44 91.0% 7.26% 81.04 87.7%
-10% 4.64% 38.58 -10.6% 8.08% 56.70 31.3% 8.16% 56.52 30.9%
Base 5.16% 43.17 0.0% 8.97% 43.17 0.0% 9.07% 43.17 0.0%
10% 5.67% 49.15 13.9% 9.87% 34.73 -19.5% 9.98% 34.83 -19.3%
20% 6.19% 57.46 33.1% 10.77% 28.98 -32.9% 10.88% 29.19 -32.4%
30% 6.70% 69.30 60.5% 11.66% 24.87 -42.4% 11.79% 25.04 -42.0%
40% 7.22% 88.46 104.9% 12.56% 21.71 -49.7% 12.70% 21.89 -49.3%
50% 7.73% 122.84 184.6% 13.46% 19.24 -55.4% 13.60% 19.45 -54.9%
Terminal growth 5.16% 3%
Implied cost of equity 10.10% 8.02%
Implied WACC 9.97% 8.18%
36
CHAPTER V
INVESTMENT RISKS
5.1 Price limitation in Vietnam (Source: Annual report)
MEGA could not set the prices of pharmaceutical products in Vietnam as it
is inspected and controlled under the authority of the government of Vietnam. MEGA
must declare the prices, includes import price, wholesale price and retail price publicly
and also have to ask the price approval to the Drug Administration of Vietnam or DAV
before the distribution. Consequently, MEGA could not set the prices as it wishes due
to the limitation of the traditional economic principles. Another risk from distributing
products in this country is that laws and regulations regarding the price control may be
different in the future and it may bring the negative impact to Maxxcare business.
5.2 Real disposable income effects the growth of the company (Source:
Annual report)
An increase in consumer disposable income leads to a raise in demand for
MEGA’s products, as it has happened in the recent years. However, the company cannot
be ensured that disposable income in the countries that MEGA operates in, would
always increase. If a bad scenario occurs, MEGA’s business may not grow as fast as
expected.
5.3 Risk of foreign currency exchange rates (Source: Annual report)
Due to the fact that MEGA operates in various countries, not only in
37
Thailand, there is a high proportion of sales in foreign currency. Nevertheless, the
company always report financial statements and financial conditions in Thai Baht. The
company has to bare the risk of changes in foreign currency exchange rates as it cannot
be passed to customers by increasing the price of product suddenly, which poses a risk
to the profit of the business.
5.4 Interest rates fluctuations affect to company financial performance
(Source: Annual report)
The outstanding loans of the company from financial institutions are
depending on floating interest rates. Any rise in interest rate could increase borrowing
costs which causes a larger interest burden. As a result, company’s profit may decrease
slightly.
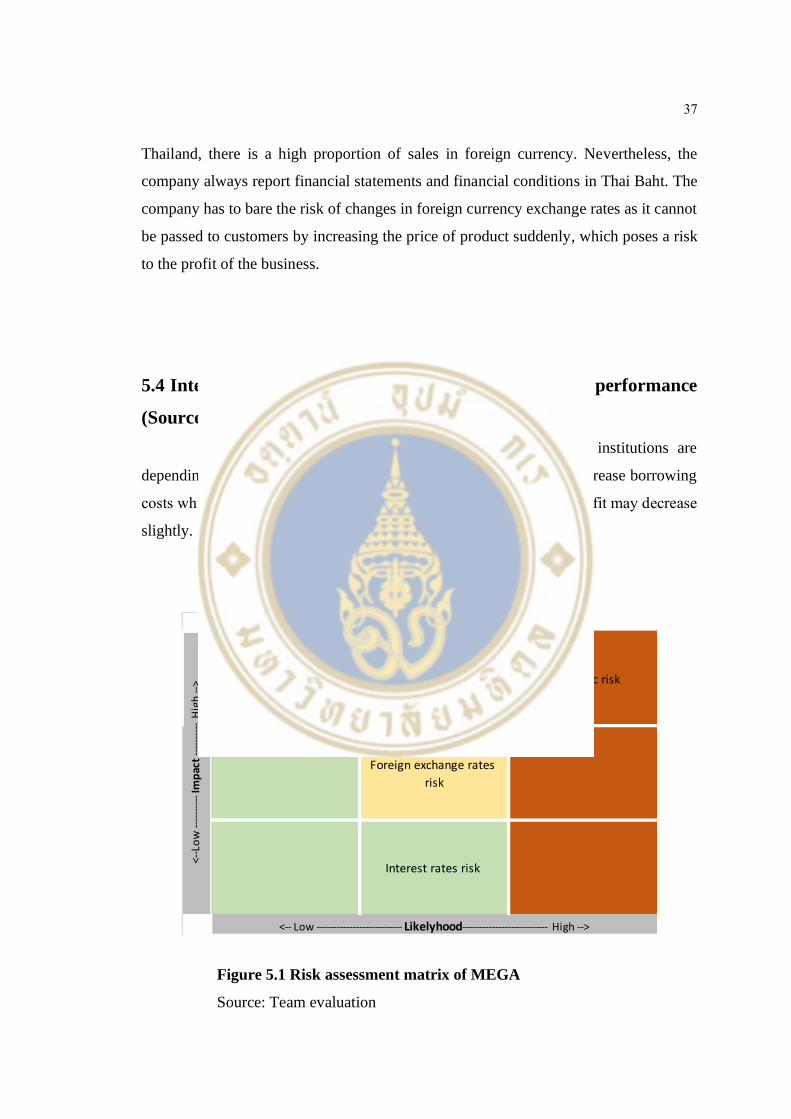
Figure 5.1 Risk assessment matrix of MEGA
Source: Team evaluation
Country operating risk Economic risk
Foreign exchange rates
risk
Interest rates risk
RISK ASSESSMENT MATRIX
<--L
ow
----
----
-- Im
pac
t --
----
----
Hig
h --
>
<-- Low -------------------------- Likelyhood-------------------------- High -->
38
CHAPTER VI
CONCLUSIONS
6.1 Investment recommendation
We recommend investors to BUY this stock. Our target share price is 43.17
baht from the result of our discounted cash flow valuation. The upside is 27.0% from
the current price of 34.00 baht as of Nov 22nd, 2020. (Table 1.3 Target price of MEGA)
6.1.1 3Q20 MEGA had an impressive performance
Recently, MEGA performed excellently, the operating revenue was THB
3,381mn, increased by 18.7% YoY, and 28.40% QoQ as a result of changing in business
structure by targeting to sell more Maxxcare products in Myanmar and Vietnam. Even
though the business restructuring may slightly decrease the gross profit, EBITDA and
net profit remain unchanged because lower SG&A as reported in 9M20 by 4.9% YoY.
6.1.2 MEGA continuously expands the business
Recently, MEGA acquired PT Futamed Pharmaceuticals which is a
manufacturing plant in Indonesia. This action will build the path for MEGA to sell new
drugs and technologies in Indonesian market. Another important move was the
acquisition of Sandoz, a global leader in generic and biosimilar medicines, in Ethiopia
and Myanmar. In the future, the company plans to expand to the new markets, including
Colombia, into its portfolio.
6.2 Triggers for re-assessment
6.2.1 Sensitivity of WACC and terminal growth rate
WACC is the estimated company’s cost of capital. According to sensitivity
of WACC in Chapter 4, it extremely affects the estimated target price. A higher WACC
39
implies investors tend to require higher returns on equity to compensate the risk that
they have taken. Moreover, cost of debt of Mega may be change in the future based on
floating interest rate that the financial institution will charge.
Terminal growth rate is the stable rate that we assume the company’s free
cash flow would grow from 2025 onwards. Change in this factor would also affect to
the target price significantly. According to Mega discounted cash flow valuation, we
used growth rate of nominal GDP from South East Asia and South Africa between 2015-
2025 to be conservative. In the future, MEGA has potential to operate in more various
country, this action may affect to the terminal growth rate based on the valuation date
that we do.
6.2.2 Change in business model
This year, MEGA has changed its business model by raising the proportion
of distribution business or Maxxcare business. As such, the profit margin decreases
because Maxxcare products has lower margin than Mega we care products but the
management of Mega stated that it did not affect to the net profit. However, we cannot
know that the business model of Mega will remain the same in the future or not. If it
happens, the free cash flow may be differed, and it will lead to change in target price
eventually.
6.3 Limitations
The limitation of discounted cash flow valuation is the assumption that has
been used as the company internal information is limited, so the input data was based
on publicly available information only. First of all, DCF valuation is tremendously
sensitive to the input assumption. Second, the free cash flow was projected only for 5
years in this case, so the years after that are unknown. Thirdly, terminal value is
uncertain, and any changes in the perpetual growth rate after 2025 could lead to the
different results, and it also can be change as time goes by. Last but not least, cost of
equity or required return on equity, we assumed it from CAPM model, and we supposed
that the outcome would apply to every investor regarding the return on equity rate that

40
they need. However, in reality, it might be different for each person as it depends on
their personal situation and risk tolerance.
41
REFERENCES
International Monetary Fund. (2020a), World Economic Outlook: A Long and Difficult
Ascent.
https://www.imf.org/en/Publications/WEO/Issues/2020/09/30/worldecono
mic-outlook-october2020
International Monetary Fund. (2020b), World Economic Outlook Database
https://www.imf.org/en/Publications/WEO/weodatabase/2020/October/do
wnload-entire-database
World Bank. (2020). Global Economic Prospects, January 2020: Slow Growth, Policy
Challenges
https://www.worldbank.org/en/publication/global-economic-prospects
Mega Lifesciences Public Company Limited, Annual Report (2019)
http://mega.listedcompany.com/misc/AR/20200305-mega-ar2019-02.pdf
Mega Lifesciences Public Company Limited, Events & Presentations
http://mega.listedcompany.com/webcast.html
Financial statement of Mega Lifesciences Public Company Limited
https://www.setsmart.com/ssm/stockQuotationByStock/MEGA
International Monetary Fund. (2020b). World Economic Outlook Database.
https://www.imf.org/en/Publications/WEO/weodatabase/2020/October/do
wnload-entire-database
The Stable Growth Rate, Aswath Damodaran
http://pages.stern.nyu.edu/~adamodar/New_Home_Page/valquestions/stabl
egrowthrate.htm
The Thai Bond Market Association (ThaiBMA)
http://www.thaibma.or.th/EN/Market/YieldCurve/Government.aspx
Country Default Spreads and Risk Premiums, Aswath Damodaran
http://pages.stern.nyu.edu/~adamodar/New_Home_Page/datafile/ctryprem.
html

42
BIOGRAPHY
NAME Miss Nutthakamol Kamolrat
DATE OF BIRTH 19 December 1994
PLACE OF BIRTH Bangkok, Thailand
INSTITUTIONS ATTENDED Bachelor of Business Administration,
Kasetsart University , 2017
Master of Management, Mahidol University,
2020
RESEARCH GRANTS -
PUBLICATION / PRESENTATION -
HOME ADDRESS 89/19 Prueklada village, Soi. Prachauthit 76,
Thungkru, Thungkru, Bangkok 10140
Thailand
EMPLOYMENT ADDRESS -