relative valuation of mega lifesciences public …
TRANSCRIPT

RELATIVE VALUATION OF MEGA LIFESCIENCES PUBLIC
COMPANY LIMITED
ANUPHAP SARANYOUPRASIT
A THEMATIC PAPER SUBMITTED IN PARTIAL
FULFILLMENT OF THE REQUIREMENTS FOR
THE DEGREE OF MASTER OF MANAGEMENT
COLLEGE OF MANAGEMENT
MAHIDOL UNIVERSITY
2020
COPYRIGHT OF MAHIDOL UNIVERSITY

Thematic paper
entitled
RELATIVE VALUATION OF MEGA LIFESCIENCES PUBLIC
COMPANY LIMITED
was submitted to the College of Management, Mahidol University
for the degree of Master of Management
on
December 27,2020
..............................................................
Mr. Anuphap Saranyouprasit
Candidate
............................................................... ..............................................................
Prof. Dr. Roy Kouwenberg, Simon M. Zaby,
Ph.D., CFA Ph.D.
Advisor Chairperson
............................................................... ..............................................................
Asst. Prof. Duangporn Arbhasil, Dr.Worapong Janyangyuen,
Ph.D. Ph.D.
Dean Committee member
College of Management
Mahidol University

ii
ACKNOWLEDGEMENTS
Writing a paper is tougher than I thought and it gets me a reward more than
I could have ever imagined. None of this would have been possible without my best
friend, Nutthakamol. I would like to thank her because she was the only one who took
me to start a new chapter of my life and stood by me during every struggle. Thank you
for her time to motivate and encourage me when I was unable to solve problems, trying
and doing hard together to achieve the paper, providing me a suggestion for
improvement while being a good listener at the same time. Moreover, I also thank my
friends in the Financial Management program who always supported me and made my
work through a hard time.
To all professors at CMMU, I cannot express enough thanks for their
continued support and encouragement especially Ajarn Roy Kouwenberg, Advisor, for
providing valuable guidance, comments and suggestions throughout the course. I would
specially thank Ajarn Susheel Narula who provided applicable knowledge of valuation
method and Ajarn Piyapas Tharavanij who provided precious knowledge basis of
financial management.
Finally, to my family, thank you for encouraging me every time when I
depressed. The motivation that I received was mean plentifully to me for keeping
forward in every goal of my life
Anuphap Saranyouprasit
iii
RELATIVE VALUATION OF MEGA LIFESCIENCES PUBLIC COMPANY
LIMITED
ANUPHAP SARANYOUPRASIT 6249095
M.M. (FINANCIAL MANAGEMENT)
THEMATIC PAPER ADVISORY COMMITTEE: PROF. DR. ROY
KOUWENBERG, Ph.D., SIMON M. ZABY, Ph.D., DR.WORAPONG
JANYANGYUEN, Ph.D.
ABSTRACT
The purpose of this thematic paper is to evaluate the valuation of Mega Lifesciences
Public Company Limited (MEGA), through the relative valuation method by comparing to the
industry’s peers in term of growth and profitability based on financial and valuation ratios, and
by comparing to the historical past 5 years in relation to itself. In addition, top-down analysis is
included in the paper for additional insight. As MEGA significantly operates and expands
capacity in developing countries, especially in South East Asia, nominal GDP growth and
disposal income of households in those countries is the factor that leads to an increase in demand
for dietary supplement products.
The valuation method used 5 multiple ratios, trailing and forward P/E ratio, trailing
and forward EV/EBITDA ratio, and trailing P/BV ratio, comparing to its peers and itself to
determine the firm’s value. Finally, the target price is estimated by using the average forward P/E
of the peers, which is multiplies by estimated forward earning per share.
The target price of MEGA as of 31 December 2020 approximately equals 37.25
Baht per share with a 15.5% upside from the current price of 32.25 Baht per share. For this reason,
the recommendation is to BUY the stock due to the company has high potential growth in
developing markets and solid financial performance. In Addition, after the COVID-19 crisis,
consumers would be highly conscious of their health by frequently consuming supplementary
food to building a stronger immune system. Therefore, an expected increase in demand from
consumers will support MEGA's products.
KEY WORDS: Relative Valuation/ MEGA/ Dietary Supplement Products/ Pharmaceutical
Industry/ Multiple Band
41 pages

iv
CONTENTS
Page
ACKNOWLEDGEMENTS ii
ABSTRACT iii
LIST OF TABLES vi
LIST OF FIGURES vii
CHAPTER I INTRODUCTION 1
1.1 Company introduction 1
1.2 Recent developments of MEGA 2
1.3 Valuation and investment recommendation summary 3
CHAPTER II BUSINESS DESCRIPTION 4
2.1 Business overview 4
2.2 Corporate strategy and long-term goals 5
2.2.1 Mega vision 5
2.2.2 Mega objective 5
2.2.3 Long term goals 5
2.3 Business segment 5
2.3.1 Mega We CareTM branded products business 5
2.3.2 MaxxcareTM distribution business 5
2.3.3 OEM business 6
2.4 Business Segment Revenue 6
2.5 Value chain 7
2.5.1 Support activities 7
2.5.2 Primary activities 8
2.6 SWOT analysis 8
2.6.1 Strengths 8
2.6.2 Weaknesses 8
2.6.3 Opportunities 8

v
CONTENTS (cont.)
Page
2.6.4 Threats 9
CHAPTER III ANALYSIS OF MACROECONOMY, INDUSTRY AND
COMPETITORS 10
3.1 Macro-economies analysis 10
3.1.1 Global gross domestic product 10
3.1.2 Global inflation 11
3.1.3 Monetary policy rate 12
3.2 Industry analysis 15
3.3 Competition analysis 19
3.3.1 Five force model 19
3.4 Company’s current situation of 9M20 19
CHAPTER IV VALUATION 22
4.1 Financial analysis 22
4.1.1 Dupont’s analysis 22
4.1.2 Growth analysis 23
4.2 Valuation: Relative valuation method 27
4.2.1 Historical multiple bands 27
4.2.2 Peer group multiples 31
4.3 Sensitivity analysis 32
4.4 Valuation recommendation 33
CHAPTER V INVESTMENT RISKS 35
5.1 Price limitation in Vietnam 35
5.2 Real disposable income effects the growth of the company 35
5.3 Risk of foreign currency exchange rates 35
5.4 Interest rates fluctuations affect to company financial performance 36
CHAPTER VI CONCLUSIONS 37
6.1 Investment recommendation 37

vi
CONTENTS (cont.)
Page
6.2 Triggers for re-assessment 37
6.2.1 Change in expected earnings 37
6.2.2 Change in return on equity 38
6.2.3 Change in business structure 38
6.2.4 Accessibility of new competitor 38
6.3 Limitations 38
6.3.1 Difficulty in comparing companies 38
6.3.2 Dependence on correctly valued peers 39
REFERENCES 40
BIOGRAPHY 41

vii
LIST OF TABLES
Table Page
1.1 Market profile 1
1.2 Earnings forecast of MEGA 2
3.1 9M20 performance 20
3.2 3Q20 performance 21
3.3 Revenue by business segment 21
4.1 Dupont’s analysis of MEGA 22
4.2 Dupont’s analysis of BKL 22
4.3 Integrated benchmark corporation and valuation ratios 31
4.4 Integrated benchmark corporation and financial ratios 32
4.5 Sensitivity analysis 33
4.6 Target price 33
4.7 Relative valuation summary 34

viii
LIST OF FIGURES
Figure Page
2.1 Revenue by segments 6
2.2 Revenue by regions 7
3.1 World gross domestic product 11
3.2 Gross domestic product separated into country groups 11
3.3 Global inflation 12
3.4 Advanced economies policy rate 13
3.5 Emerging market economies policy rate 13
3.6 GDP per capita 14
3.7 Dietary supplement expenditure 14
3.8 Global supplement industry sales and growth, 2007-2021 15
3.9 Supplement sales and growth, 2007-2017 16
3.10 Supplement sales by product,2017 17
3.11 Latin American: Supplement sales and growth,2007-2021 18
3.12 Operating revenues 18
4.1 Core revenue trend of MEGA and BKL 23
4.2 Cost of goods sold trend of MEGA and BKL 24
4.3 Net profit trend of MEGA and BKL 25
4.4 EPS trend of MEGA and BKL 26
4.5 Free cash flow trend of MEGA and BKL 26
4.6 MEGA Trailing P/E band for past five years 27
4.7 MEGA Forward P/E band for past five years 28
4.8 MEGA Trailing P/BV band for past five years 29
4.9 MEGA Trailing EV/EBITDA band for past five years 30
4.10 MEGA Forward EV/EBITDA band for past five years 30
5.1 Risk assessment matrix 36

1
CHAPTER I
INTRODUCTION
1.1 Company introduction
MEGA is a leading pharmaceutical and nutraceutical company that involves
in the health and wellness industry in developing countries under its brand “Mega We
Care”. Also, MEGA is a leading distributor of pharmaceutical and OTC products under
its brand “Maxxcare” in Indochina, consisting of Thailand, Myanmar, Vietnam and
Cambodia.
Market capitalization of MEGA’s listed stock is THB 28,117.79 mn, which
is considered to be a mid-cap stock and it is a member of the SET100 index. The average
trading volume within the past 1 year is 2,116,542.37 shares.
Table 1.1 Market profile
Source: Reuters and SET

2
1.2 Recent developments of MEGA
Recently, MEGA acquired PT Futamed Pharmaceuticals which is a
manufacturing plant in Indonesia. This action will build the path for MEGA to sell new
drugs and technologies in the Indonesian market. Another important move was the
acquisition of Sandoz, a global leader in generic and biosimilar medicines, in Ethiopia
and Myanmar.
According to our team earnings forecast, the operating revenue will have a
compound growth rate of 9.8% between 2020 and 2025. Gross profit margin is 40%,
slightly decreased from 2019 due to the fact that the firm changed its business model to
distribute more lower margin products (Maxxcare). SG&A is 26% of operating revenue
as we approximated it according to management discussion of 9M20 that SG&A was
26.3%. From 2020 to 2025, EBIT and net profit compounded growth is expected to be
10.2% and 10.3%, respectively.
Table 1.2 Earnings forecast of MEGA
Source: Reuters and team calculation
Income Statement (Mthb) 2015 2016 2017 2018 2019 2020F 2021F 2022F 2023F 2024F 2025F
Revenue 7,945 8,810 9,597 10,182 11,130 12,709 14,049 15,498 16,980 18,526 20,265
Investment income 28 14 16 22 15 15 15 15 15 15 15
Net foreign exchange gain 101.92 0 0 0 0 0 0 0 0 0 0
Other income 22 18 27 102 34 30 30 30 30 30 30
Total revenue 8,097 8,842 9,640 10,306 11,179 12,754 14,094 15,543 17,025 18,571 20,310
COGS 4,538 5,123 5,277 5,791 6,551 7,653 8,456 9,326 10,215 11,143 12,186
% of revenue 57% 58% 55% 57% 59% 60% 60% 60% 60% 60% 60%
Gross Profit 3,558 3,719 4,363 4,515 4,628 5,102 5,637 6,217 6,810 7,428 8,124
Overall gross margins in 1H20 was 39%. Slight decline was mainly a result of change in revenue mix driven by relatively higher growth in Maxxcare revenue and slightly lowersegmental gross margins, partly due to change in business1model in few markets; adjusted fo
Selling and Administrative Expenses 2,718 2,674 2,965 3,052 3,176 3,343 3,695 4,030 4,415 4,817 5,269
% of revenue 34% 30% 31% 30% 29% 26% 26% 26% 26% 26% 26%
Selling expenses 1,717 1,634 1,856 1,886 1,899 2,006 2,217 2,418 2,649 2,890 3,161
Administrative expenses 1,001 1,041 1,109 1,166 1,278 1,337 1,478 1,612 1,766 1,927 2,108
Net foreign exchange loss - 90 72 15 78 0 0 0 0 0 0
EBIT 841 955 1,327 1,447 1,373 1,759 1,943 2,188 2,395 2,612 2,855
Finance costs 13 22 26 34 65 62 60 62 69 75 83
Share of loss of associates and joint
ventures 0 0 2 4 9 5 5 5 5 5 5
Profit before income tax expense 828 933 1299 1409 1299 1,693 1,878 2,120 2,322 2,531 2,767
Tax expense 132 138 186 203 160 339 376 424 464 506 553
Profit for the year 696 795 1113 1206 1139 1,354 1,502 1,696 1,857 2,025 2,214

3
1.3 Valuation and investment recommendation summary
According to the relative valuation analysis, we recommend buying the
stock based on the target price of 37.25 (see Table 4.6 Target price in Chapter 4) in
2020F implied by the P/E target of 25.0x, with 15.50 % upside. Further, the company
has a high sales growth rate in developing markets such as Myanmar, Vietnam and
Cambodia. MEGA’s P/E is lower than peers’ average P/E ratio, while it has more
outstanding financial performance than average peers based on as ROE, D/E and EPS
growth rate.

4
CHAPTER II
BUSINESS DESCRIPTION
2.1 Business overview
Mega Lifesciences Public Company Limited is an international
manufacturer and distributer of pharmaceutical, nutraceutical products, and fast moving
consumer goods (FMCG). The company was founded by Mr. Kirit Shah, and was
established in 1982 with an initial registered capital of 5 million baht. The business has
started by producing soft gelatin capsules (OEM) with the production capacity of 230
million soft gel capsules annually, and also known as the first manufacturer in Thailand
who produced soft gel at that time.
In 1986, the company started to produce Nifedipine (medicine for
hypertension and chest pain) for Berlin Pharmaceutical Industry Co., Ltd. and became
an exclusive manufacturing partnership because Nifedipine was a very successful
flagship product, and it created a reputation for the company as a pharmaceutical
products manufacturer.
In 1994, this year was the beginning of the branded products business of
Mega We CareTM.
In 1995, the company decided to expand the market to another country by
opening a representative office in Vietnam and set up a subsidiary in Myanmar and
Cambodia. Those actions were for selling its own Mega We CareTM branded products.
In 2000, the company separated its business operations into 2 divisions
which are branded products business (Mega We CareTM trademark), and distribution
business (MaxxcareTM trademark). It also offered the excess capacity to produce the
products under customer’s brand (OEM services)
In 2002, the company expanded its capacity by leased land, building in
Dandenong, Melbourne, Australia to construct a manufacturing plant. This
manufacturing facilities produce packages tablets, hard capsules and powders.

5
2.2 Corporate strategy and long-term goals
2.2.1 Mega vision
Mega’s Vision is to ‘Create a Thinking Organization which will change
before it is forced to Change. An Organization which will live and grow beyond each
one of us’
2.2.2 Mega objective
Mega’s Objective is to create value by marketing and selling medicines and
medicinal supplements in developing countries.
2.2.3 Long term goals
Mega tries to maintain its current market share, expects to double core
business revenue within 5-7 years and to increases the revenue in sub-Saharan Africa to
follow the term of ‘Build Africa’ and penetrates further in the natural herbal products
business. Ultimately, attempting to change the company position to be a health care
company.
2.3 Business segment
MEGA operates 3 business segments as following;
2.3.1 Mega We CareTM branded products business
The company develop, manufactures, markets and sells nutraceutical
products, prescription pharmaceutical products and OTC (Over the counter) products.
2.3.2 MaxxcareTM distribution business
The company markets, sells and distributes diverse branded prescription
pharmaceutical products, OTC (Over the counter) and FMCG (Fast-moving
consumer goods) products. This business operates in three countries, consisting of,

6
Myanmar, Vietnam, and Cambodia. Main clients are leading domestic and international
pharmaceutical and FMCG (Fast-moving consumer goods) companies.
2.3.3 OEM business
Company’s manufacturing facilities in Thailand and Australia offer excess
production capacity to third-party customers.
2.4 Business Segment Revenue
Big portion of revenue comes from Mega We CareTM branded products
business and MaxxcareTM distribution business by 49.1% and 48.4%, respectively, in
fiscal year 2019.
Figure 2.1 Revenue by segments
Source: Company Report 2019
Revenue from key geography regions, namely, Southeast Asia (Thailand,
Myanmar, Vietnam, Cambodia, Malaysia, Philippines, Indonesia and Singapore) and
Africa (Sub-Saharan region).

7
Figure 2.2 Revenue by regions
Source: Company Report 2019
2.5 Value chain
2.5.1 Support activities
2.5.1.1 Infrastructure - Plans to have new product launch at the
right time and plans the production effectively to meet the sufficient inventory level.
2.5.1.2 Human Resource Management - Arranges various
training programs & workshops to employees at Mega Lifesciences, i.e. E-Learning
which can be accessed 24/7 via personal devices.
2.5.1.3 Technology Development - Provides quality products
and services with constant improvement and innovation.
2.5.1.4 Procurement - Procures raw material from suppliers at a
reasonable price in order to maintain the quality and support suppliers in the long run
and to have a long-term partner. Mega We CareTM branded products business and OEM
business rely on 4 types of raw materials. 1.Active ingredients 2. Excipient 3. Packaging
4. Gelatin.
8
2.5.2 Primary activities
2.5.2.1 Inbound Logistics - obtain 4 types of raw materials.
1.Active ingredients 2. Excipient 3. Packaging 4. Gelatin.
2.5.2.2 Operations - Produce Herbal medicines, Probiotics for
life, Eugica (Natural cold & cough care, Medical nutrition, Condition specific vitamins.
2.5.2.3 Outbound Logistics - distribute products across south
east Asia, and Africa to clients, namely, leading domestic and international
pharmaceutical and FMCG (Fast-moving consumer goods) companies.
2.5.2.4 Marketing & Sales – sales products throughout 34
countries and advertises on public television channels.
2.5.2.5 Services - provides company visitation to customer
regularly and provides knowledge building programs by key speakers and other
programs.
2.6 SWOT analysis
2.6.1 Strengths
2.6.1.1 A leader in pharmaceutical and nutraceutical in fast
growing developing markets, particularly in Myanmar where it contributed 70%
proportion in overall Maxxcare business in FY19.
2.6.1.2 A leader in distribution of pharmaceutical and OTC
products in Myanmar, Vietnam and Cambodia.
2.6.2 Weaknesses
2.6.2.1 Expiry in manufacturing license may cause the company
to disrupt the production line.
2.6.3 Opportunities
2.6.3.1 New market in Colombia.

9
2.6.3.2 The governments of Myanmar and Vietnam permitted
MEGA’s subsidiaries to import more pharmaceutical and consumer goods to their
countries. As a result, the proportion of Maxxcare sales increased.
2.6.3.3 The supplement market in Asian countries is growing.
In 2017, the proportion of supplement sales in Asian market was highest compare to the
world. (Source: Nutrition Business Journal)
2.6.4 Threats
2.6.4.1 Consumer real disposable income stalls or decreases
could impact the demand for products.
2.6.4.2 Expiring patents.
2.6.4.3 Changes in laws and regulations, particularly in
Myanmar, Vietnam and Cambodia.
2.6.4.4 Changes in consumer preferences.

10
CHAPTER III
ANALYSIS OF MACROECONOMY, INDUSTRY AND
COMPETITORS
3.1 Macro-economies analysis
3.1.1 Global gross domestic product
Global economy growth is forecasted at -4.4% in 2020 according to world
economy outlook released data from International Monetary Fund. In 2H2020,
developed economies mostly activity resume rapidly more than expected after
lockdowns were reduced, but many countries are still partially re-opened, and some are
reinstating partial lockdowns. Global growth is projected at 5.2% in 2021 recovery
from the previous year with downtrend forecast due to expectation of continued social
distancing. The growth forecasts indicate broad negative production gaps and increased
unemployment rates this year and in 2021 over advanced and emerging market
economics. In the long term, after recovery in 2021 the global growth is gradually slow
about 3.2% as before pandemic level for advanced and emerging market economies.
The pandemic will increase inequality and poverty. People who live with daily wage
probably confront income losses. Moreover, about 90 million people could drop below
the $1.90 a day income. The projection is based on continued social distancing into 2021
and it will gradually fade as vaccines are produced and expanded. Local transmission
would decrease to low level at the end of 2022. The huge impacts of the pandemic will
drag potential productivity growth, investment in physical capital and technology
blending with material of production.

11
Figure 3.1 World gross domestic product
All emerging market and developing economy are expected to contract more
than -4% in 2020 before rebounding about 8% in 2021 (IMF, World Economic Outlook,
October 2020), overview remains uncertain due to the continuing spread of pandemic
and fragile health care systems. The most critically affected countries with large tourist
sectors and the greater dependence on external finance, including remittance.
Figure 3.2 Gross domestic product separated into country groups
3.1.2 Global inflation
Inflation in advanced economies continues below pre-pandemic level,
emerging market and developing economies decreases sharply. Inflation remains low
12
due to consumers increase spending on goods or services that they had been forced to
delay consuming because of lockdowns and restriction on movement. They also highly
perceive risk of joblessness and falling sick by prompted saving. In addition, lenders
have lower leading as borrow service due to the high debt occurred during pandemic
and concerning about the limited of monetary policy’s ability to generate demand (IMF,
World Economic Outlook, October 2020 P.3)
Figure 3.3 Global inflation (average consumer prices)
3.1.3 Monetary policy rate
Many countries in advanced economies confront the prompted challenge of
restraining of the virus spread, improving health system and developing a treatment as
well as stimulating economies from the pandemic (A World Bank Group, Global
Economies Prospects) The central bank in many advanced economies are using
quantitative easing on a huge scale and developing new tools to support demand and
financial market. Advanced economy central banks suddenly ease monetary policy rate
cutting policy rates in most advanced economies close to or below zero at the same time,
the central banks have executed extra measures to ease tight credit markets. In the other
hand, central bank in emerging market and developed economies also response the
pandemic immediately by sharply cutting their policy rate using various monetary and
financial policy to support the flow in financial market. Some have implemented easing

13
program by asset purchase which mostly is government bonds and private bonds to
stabilize yield of long maturity which sharply increase among tight liquidity.
According to management’s discussion in 1H2020, MEGA’s operating
revenues was not impacted by the COVID-19 crisis due to the product characteristics
that support the situation as consumption per capita for dietary supplements is stable in
2020F and expected to increase by CAGR 7.77% till 2025F, according to the forecast
from Euromonitor.
Figure 3.4 Advanced economies policy rate
Figure 3.5 Emerging market economies policy rate

14
Figure 3.6 GDP per capita
Source: Euromonitor and team calculation
Figure 3.7 Dietary supplement expenditure
Source: Euromonitor and team calculation

15
3.2 Industry analysis
Dietary supplement is the greatest section of the Consumer Health market
which contains six main product sections: 1) Vitamins 2) Minerals 3) Herbs 4) Meal
Supplements 5) Sports Nutrition Supplements 6) Specialty Supplement. Consumer
awareness regarding preventative healthcare and aging population are driving the global
dietary supplement market. Moreover, dietary supplement is the key product for Mega
Lifesciences and a key supporter to the Consumer Health Business. According to the
graph, global supplement sales are continuously increasing. We expect the sales to reach
approximately $160,000 in 2021.
Figure 3.8 Global supplement industry sales and growth, 2007-2021
In Asia, overall countries are growing faster than the U.S market. As China,
India, Japan and other Asian countries were spending the money on supplements more
than the U.S. due to consumers access through digital information, increasing their
knowledge of medicine advantages and preventing future illness.

16
Figure 3.9 Supplement sales and growth, 2007-2017
In Africa, vitamins and dietary supplement industry are in an emerging
market which offers high opportunity to grow due to increased health awareness driving
the market, increasing self-medication and new distribution networks. Consumers are
mostly willing to purchase products as part of their daily lives. Therefore, the most
preference is Vitamins, market value of $155 million, due to accessibility of broader
manufacturers and distributors
17
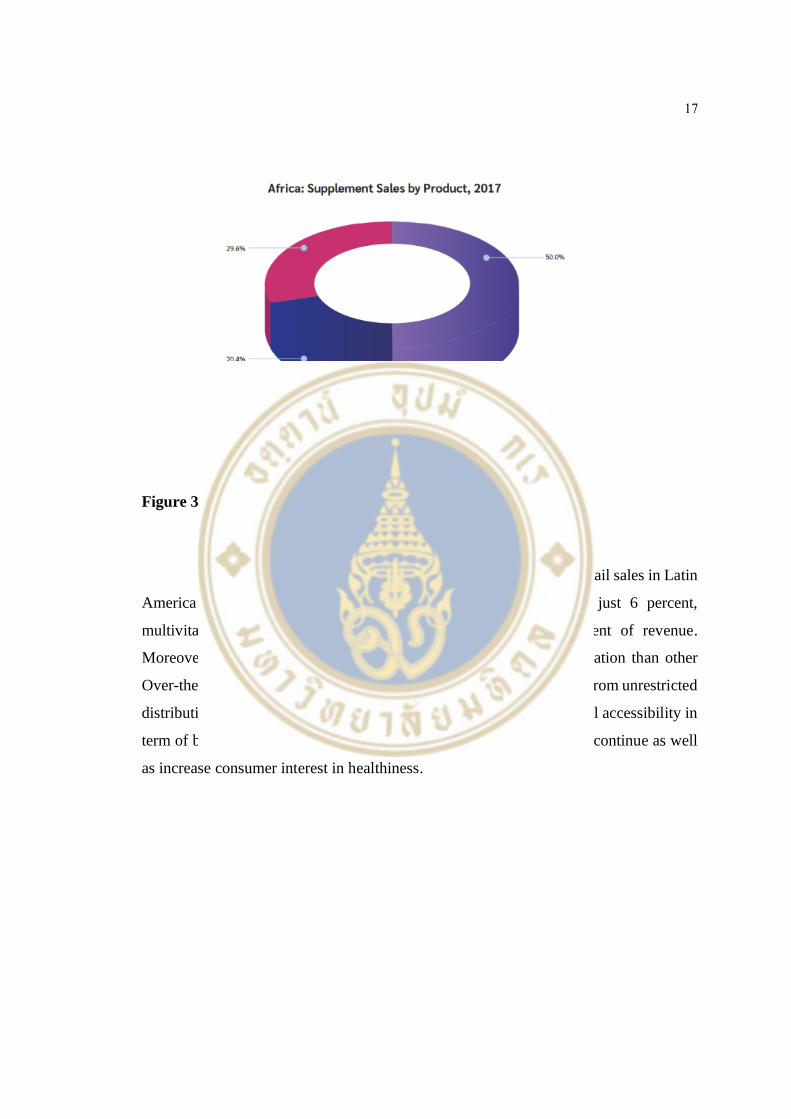
Figure 3.10 Supplement sales by product,2017
In Central and south America, In Q2 2018, overall VMS retail sales in Latin
America grew by 14 percent to $1.7 billion. Despite growth of just 6 percent,
multivitamins remain the largest subcategory, generating 22 percent of revenue.
Moreover, vitamins and dietary supplement are less restrictive legislation than other
Over-the-Counter (OTC) medicine categories. In addition, advantages from unrestricted
distribution regulation and less control approval process cause potential accessibility in
term of barrier of entry in the industry. Strong growth is forecasted to continue as well
as increase consumer interest in healthiness.

18
Figure 3.11 Latin American: Supplement sales and growth,2007-2021
In summary, our operating revenue forecasted shows that the expected
compounding growth rate is approximately 9.78% due to MEGA is operating in the
developing countries which has high potential to grow further in the future. Particularly
in Myanmar, the market size of Myanmar is only 1 to 10 of Thailand, so it has extremely
high potential growth. As Myanmar's supplement market rise, we expect the revenue
of MEGA to increase as well.
Figure 3.12 Operating revenues
Source: Team calculation

19
3.3 Competition analysis
3.3.1 Five force model
3.3.1.1 Buyer power (High) – MEGA’s products are
supplements. Customers may be sensitive to the price as it’s not necessary in daily life.
By raising prices, the company must consider that buyers can compare the price with
the alternative products on the internet easily.
3.3.1.2 Threat of substitutes (Moderate) – Some people may
prefer to consume supplement drinks instead of vitamins. If the company raises
vitamin’s prices, consumers might find it expensive. They switch to consuming
supplement drinks, and this impacts the sales of MEGA.
3.3.1.3 Rivalry within the Industry (High) – MEGA have both
international and domestic rivals. Most of rivals have stayed within the industry for
many years and are well perceived by the customer. Not only dietary supplement has
low product differentiation, but also has low switching costs.
3.3.1.4 Threat of new entrants (Low) – New domestic and
foreign competitors require great investments in research and development, technical
know-how, and distribution. This makes it less likely new companies enter the industry
and bring the negative impact to the business.
3.3.1.5 Supplier power (Moderate) – MEGA do not have long-
term supply agreements with the raw material suppliers which leads to high risk of
shortage in supply and varying market price. In that case, MEGA must acquire raw
materials from different suppliers, who might charge a higher price or provide raw
materials that do not meet expected quality.
3.4 Company’s current situation of 9M20
In 2020, MEGA has change its business structure by increasing sale
proportion of Maxxcare due to the government of Myanmar and Vietnam permitted
MEGA’s subsidiaries to import pharmaceutical and consumer goods to their countries
20
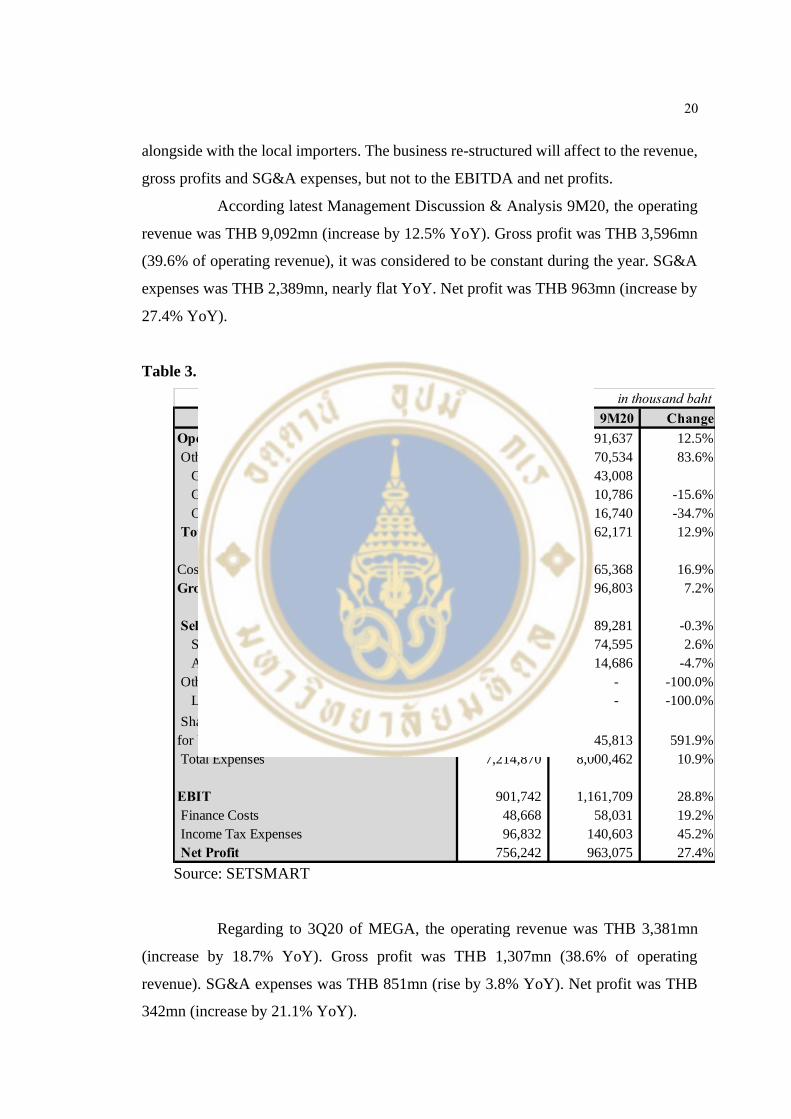
alongside with the local importers. The business re-structured will affect to the revenue,
gross profits and SG&A expenses, but not to the EBITDA and net profits.
According latest Management Discussion & Analysis 9M20, the operating
revenue was THB 9,092mn (increase by 12.5% YoY). Gross profit was THB 3,596mn
(39.6% of operating revenue), it was considered to be constant during the year. SG&A
expenses was THB 2,389mn, nearly flat YoY. Net profit was THB 963mn (increase by
27.4% YoY).
Table 3.1 9M20 performance
Source: SETSMART
Regarding to 3Q20 of MEGA, the operating revenue was THB 3,381mn
(increase by 18.7% YoY). Gross profit was THB 1,307mn (38.6% of operating
revenue). SG&A expenses was THB 851mn (rise by 3.8% YoY). Net profit was THB
342mn (increase by 21.1% YoY).
in thousand baht
9M19 9M20 Change
Operating revenue 8,078,197 9,091,637 12.5%
Other Income 38,415 70,534 83.6%
Gain on Foreign Currency Exchange - 43,008
Gain on Disposal of Investments 12,781 10,786 -15.6%
Other Incomes - Others 25,634 16,740 -34.7%
Total Revenues 8,116,612 9,162,171 12.9%
Cost of goods sold 4,759,857 5,565,368 16.9%
Gross profit 3,356,755 3,596,803 7.2%
Selling and Administrative Expenses 2,396,843 2,389,281 -0.3%
Selling Expenses 1,436,696 1,474,595 2.6%
Administrative Expenses 960,147 914,686 -4.7%
Other Expenses 51,549 - -100.0%
Loss on Foreign Currency Exchange 51,549 - -100.0%
Shares of Losses From Investments Accounted
for Using the Equity Method 6,621 45,813 591.9%
Total Expenses 7,214,870 8,000,462 10.9%
EBIT 901,742 1,161,709 28.8%
Finance Costs 48,668 58,031 19.2%
Income Tax Expenses 96,832 140,603 45.2%
Net Profit 756,242 963,075 27.4%

21
Table 3.2 3Q20 performance
Source: SETSMART
It can be seen clearly from the table that the overall operating revenue was
driven by Maxxcare business.
Table 3.3 Revenue by business segment
Source: Company’s management discussion & analysis Quarter 3/2020
in thousand baht
3Q19 3Q20 Change
Operating revenue 2,848,692 3,381,246 18.7%
Other Income 15,963 8,890 -44.3%
Gain on Foreign Currency Exchange - (634)
Gain on Disposal of Investments 3,067 1,954 -36.3%
Other Incomes - Others 12,896 6,936 -46.2%
Total Revenues 2,864,655 3,390,136 18.3%
Cost of goods sold 1,691,495 2,083,534 23.2%
Gross profit 1,173,160 1,306,602 11.4%
Selling and Administrative Expenses 819,426 850,923 3.8%
Selling Expenses 500,725 544,952 8.8%
Administrative Expenses 318,701 305,971 -4.0%
Other Expenses 12,904 634 -95.1%
Loss on Foreign Currency Exchange 12,904 634 -95.1%
Shares of Losses From Investments
Accounted for Using the Equity Method 2,162 41,206 1805.9%
EBIT 338,668 413,839 22.2%
Finance Costs 17,394 16,925 -2.7%
Income Tax Expenses 39,140 55,246 41.1%
Net Profit 282,134 341,668 21.1%

22
CHAPTER IV
VALUATION
4.1 Financial analysis
4.1.1 Dupont’s analysis
Table 4.1 Dupont’s analysis of MEGA
Source: SETSMART and team calculation
Table 4.2 Dupont’s analysis of BKL
Source: Reuters and team calculation
Due to the fact that Dupont’s analysis is a tool to analyze fundamental
performance of companies, so we use this method to analyze MEGA’s performance in
comparison to its key competitor, BKL. From the past 5 years, return on equity of
MEGA gradually increases to 19.14% from 16.74% (2015), meaning that out of 100
baht of an equity investment, shareholders would get a return back in the form of net
income by 19.14 baht. In terms of earning leverage (EL), it’s a measurement of
company’s net income compared to its net operating profit after tax. MEGA had 94.57%
Dupont's Analysis 2015 2016 2017 2018 2019
ROE 16.74% 24.32% 22.43% 21.99% 19.14%
ROA 9.86% 10.47% 13.65% 13.52% 11.96%
EL 98.51% 97.65% 97.89% 97.36% 94.57%
CSL 172.41% 237.91% 167.88% 167.08% 169.24%
MEGA
Dupont's Analysis 2015 2016 2017 2018 2019
ROE 53.73% 48.85% 37.35% 36.24% 17.37%
ROA 25.93% 22.56% 16.12% 16.24% 7.36%
EL 98.20% 97.74% 97.96% 96.13% 96.19%
CSL 210.97% 221.52% 236.52% 232.17% 245.50%
BKL

23
earning leverage in 2019 which slightly declined by 3.94% from 2015. It means that its
net income was only 94.57% of the net income that it would have had if it has no debt.
For capital structure leverage (CSL), it compares average total assets to an average
equity. MEGA had 169.24% capital structure leverage in 2019 which decreased by
3.17% from 2015. It means that the value of the firm’s total assets is 169.24% that of
the value of the firm’s equity
In contrast, BKL’s return on equity significantly dropped from 53.73%
(2015) to 17.37% (2019) which mean out of 100 baht, the investors get the return back
less than previous for 36.36 baht.
Overall, it seems that in 2019 MEGA was doing better than BKL based on
Dupont’s analysis due to an increase in ROA in the past five years. However, the net
income declined because lower earnings leverage, but it was compensated by low debt
accumulation due to a reduction on capital structure leverage that reflects lower risk.
4.1.2Growth analysis
This section compares the growth of revenue, cost of goods sold, net profit,
EPS and free cash flow between MEGA and its key competitor BKL (Blackmores
Limited).
Figure 4.1 Core revenue trend of MEGA and BKL
Source: SETSMART, Reuters and team calculation
7,945 8,810
9,597 10,182 11,130
15,610 16,763
14,985 15,281
12,351
-
5,000
10,000
15,000
20,000
2015 2016 2017 2018 2019
Mth
b
Core Revenue
MEGA BKL

24
MEGA revenue was in upward trend, CAGR from 2015 to 2019 is 8.79%
while BKL was in a downward trend, CAGR -5.69%. In fiscal year 2019, MEGA
revenue reach to the peak and almost in the same level as BKL who is in the vitamins
and supplement market longer due to MEGA had expanded its business continuously in
the developing countries. Further, the supplement market in Asia is growing more
rapidly than the world market.
business continuously in the developing countries, also supplement market
in Asia is growing more rapid than the world market.
Figure 4.2 Cost of goods sold trend of MEGA and BKL
Source: SETSMART, Reuters and team calculation
According to cost of goods sold chart, it seems that BKL able to manage the
cost better than MEGA. However, MEGA able manage cost as good as previous by
maintaining the cost approximately 54%-59% comparing to sales for all five years.
4,538
5,123 5,277
5,791
6,551
4,794
5,747
6,293
5,911
5,075
2,000
2,500
3,000
3,500
4,000
4,500
5,000
5,500
6,000
6,500
7,000
2015 2016 2017 2018 2019
Mth
b
Cost of Goods Sold
MEGA BKL

25
Figure 4.3 Net profit trend of MEGA and BKL
Source: SETSMART, Reuters and team calculation
In terms of net profit, MEGA has net income more than BKL in the latest
year even when its sales were lower while net profit of BKL was sharply decline in
2019. MEGA strictly control 2 main costs which are cost of goods sold and SG&A as it
can be seen in a last five years that these 2 costs were almost steady. Therefore, as the
revenue went up, net profit went up as well.
696 795
1,113 1,206
1,139
1,960 2,103
1,682 1,693
807
-
500
1,000
1,500
2,000
2,500
2015 2016 2017 2018 2019
Mth
b
Net Profit
MEGA BKL

26
Figure 4.4 EPS trend of MEGA and BKL
Source: SETSMART, Reuters and team calculation
Earnings Per Share of MEGA increase steadily from 2015 with CAGR
12.89%. In contrast, BKL’s earnings per shares decline from 2016 to 2018 and strongly
drop in 2019, its CAGR was -21.64%.
Figure 4.5 Free cash flow trend of MEGA and BKL
Source: SETSMART, Reuters and team calculation
It is apparent that free cash flow of BKL is very fluctuated while MEGA
remain quite constant in the last 5 years and in the latest year MEGA free cash flow to
0.800.92
1.291.39
1.31
113.98122.08
97.62 98.2
42.97
0
20
40
60
80
100
120
140
0.00
0.20
0.40
0.60
0.80
1.00
1.20
1.40
1.60
2015 2016 2017 2018 2019
EPS
MEGA BKL(LHS)
950 1,185 1,052
904
1,229
2,375
(313)
1,640
1,216
271
(1,000)
(500)
-
500
1,000
1,500
2,000
2,500
3,000
2015 2016 2017 2018 2019
Mth
b
Free Cash Flow
MEGA BKL

27
firm was higher than BKL which means MEGA has higher cash on hand after its
expenses.
4.2 Valuation: Relative valuation method
In this section we value the company using relative valuation methods by
comparing to its peers and its own historical trading over past five years with the
following multiples: Trailing P/E, P/BV, EV/EBITDA and Forward P/E, and Forward
EV/EBITDA
4.2.1 Historical multiple bands
Figure 4.6 MEGA Trailing P/E band for past five years
Source: SETSMART and team calculation

28
Figure 4.7 MEGA Forward P/E band for past five years
Source: SETSMART and team calculation
Trailing P/E multiple band in historical trading for past five year has an
average PE at 26x. Overall, the company traded around the mean before it decreased
below -1STD at PE 22x in 2016 to 2017 due to investors adjust their expectation on
earning that declines in 2014 due to high expense on capacity expansion and business
activities in Africa and Myanmar. Afterward it was trading above the mean at PE 35x
(+2STD) in 2018. As of 11 November 2020, current PE is at 22.2x. The virus spread
causes trading approximately at PE 22x (-1STD) returned from -2STD in the beginning
of 2020 when the company was undervalued in relation to itself. Based on the forward
P/E multiple band, as of 11 November 2020, it reaches to nearly around the mean at
approximately forward PE 20.2x which is still below at the average forward PE at 23x.

29
Figure 4.8 MEGA Trailing P/BV band for past five years
Source: Reuters and team calculation
Trailing P/BV multiple in relation to itself for past five years has an average
at 4.85 with a downward trend from 2018 when it was traded at around 7.23 (+2STD).
As of 11 November 2020, P/BV is trading slightly below the average at approximately
4.55. However, the difference of current P/BV compared to five years historical average
is quite small, approximately trading at fair value.

30
Figure 4.9 MEGA Trailing EV/EBITDA band for past five years
Source: Reuters and team calculation
Figure 4.10 MEGA Forward EV/EBITDA band for past five years
Source: Reuters and team calculation
We compare EV/EBITDA to its historical past five years. EV/EBITDA is a
ratio that compares a company’s enterprise value to its earnings before interest, taxes,
31
depreciation and amortization or the ratio means that how many times EBITDA that the
company have to pay to obtain the entire business.
According to exhibit 3, the average Trailing EV/EBITDA for past five years
is 19.67, and the current value EV/EBITDA is 21.53 or close to +1STD. As the current
value is higher than the historical average, in relation to itself the firm is overvalued.
However, in terms of Forward EV/EBITDA, using the current EV divided by estimated
EBITDA of 12 months forward, the ratio is below the historical average by a little at
15.12 compared to the average of 16.57. We conclude that the company value is trading
close to fair value on average, based on forward EV/EBITDA.
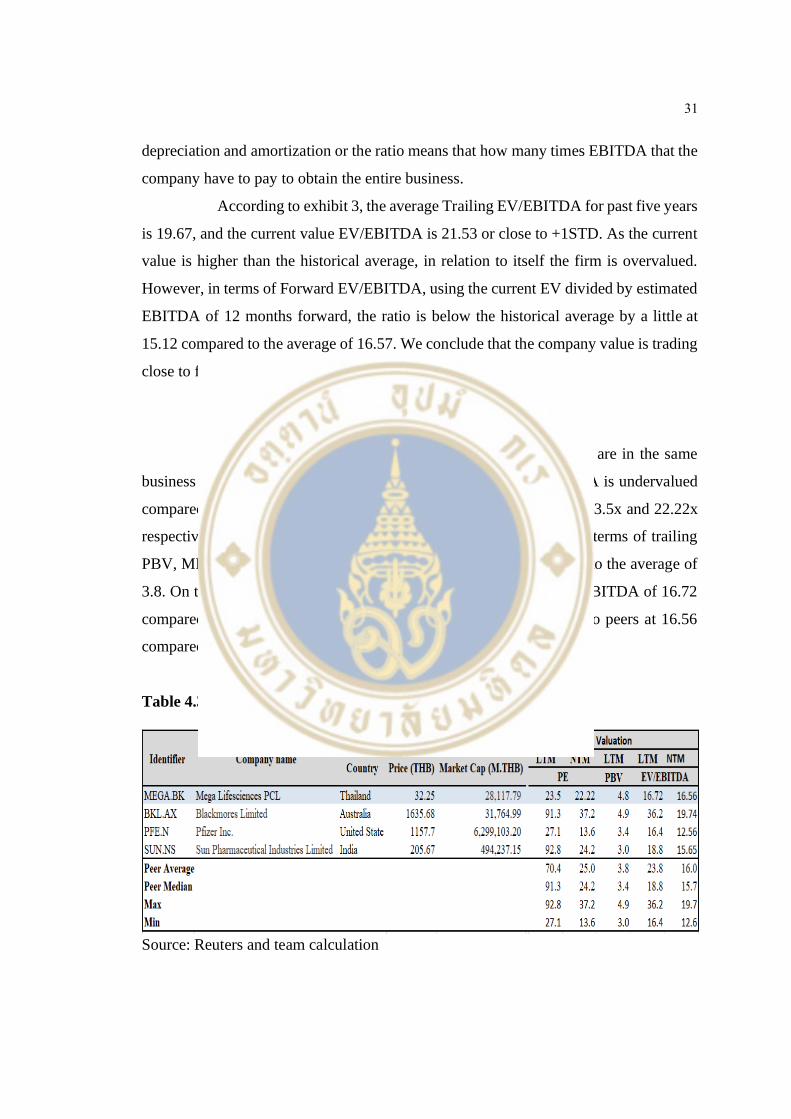
4.2.2 Peer group multiples
In this section we compare MEGA to global peers which are in the same
business and industry based on the latest data for all multiples. MEGA is undervalued
compared to the peer average in terms of trailing and forward PE of 23.5x and 22.22x
respectively which are lower than the average at 70.4x and 25.0x. In terms of trailing
PBV, MEGA is overvalued relative to its peers at PBV 4.8 compared to the average of
3.8. On the other hand, MEGA is undervalued based on trailing EV/EBITDA of 16.72
compared to the average of 23.8, but forward EV/EBITDA is close to peers at 16.56
compared to average of 16.0.
Table 4.3 Integrated benchmark corporation and valuation ratios
Source: Reuters and team calculation
32
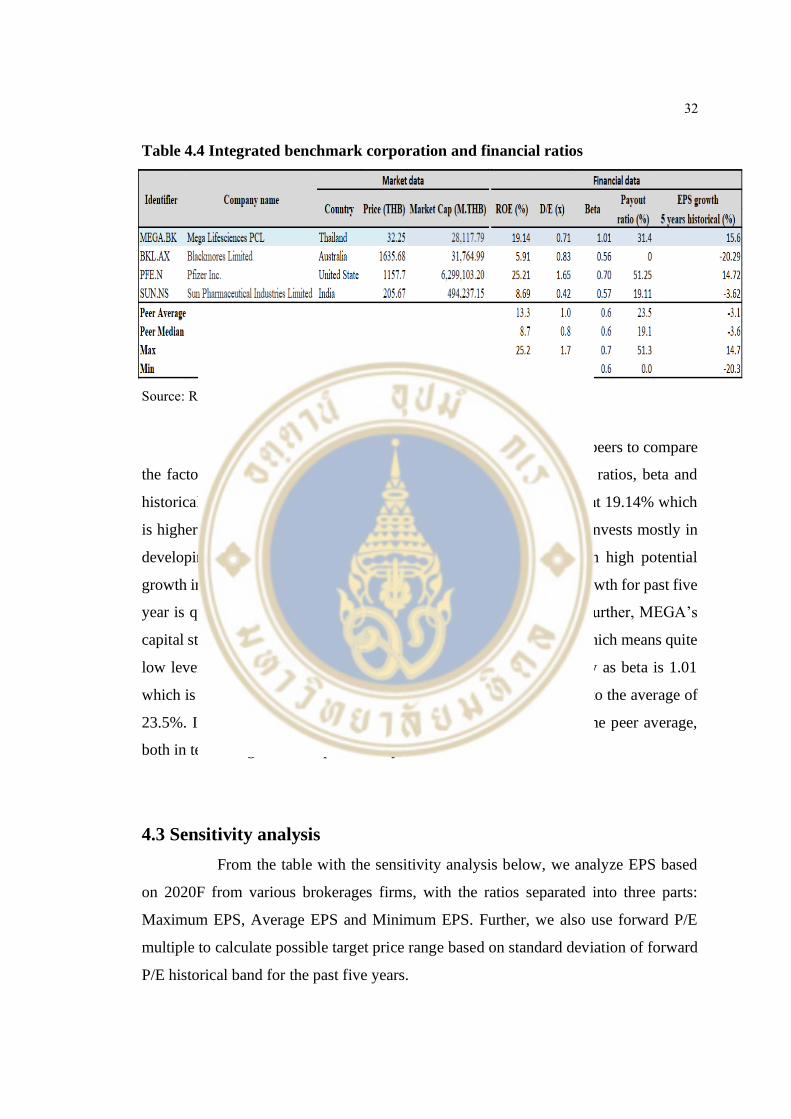
Table 4.4 Integrated benchmark corporation and financial ratios
Source: Reuters and team calculation
The table shows financial data, last fiscal year, among the peers to compare
the factors that may lead to different multiples, including ROE, debt ratios, beta and
historical EPS growth. In terms of ROE, MEGA has expressive ROE at 19.14% which
is higher than an average of 13.3% as the firm expands capacity and invests mostly in
developing markets such as Myanmar, Cambodia and Vietnam with high potential
growth in dietary and supplement markets. For this reason, the EPS growth for past five
year is quite high at 15.6% compared to the peer average of -3.1%. Further, MEGA’s
capital structure is mostly financed by equity with D/E ratio of 0.71, which means quite
low leverage and default risk. However, MEGA has higher volatility as beta is 1.01
which is higher than peers. Dividend payout ratio is 31.4% compared to the average of
23.5%. In summary, in nearly all aspects MEGA has outperformed the peer average,
both in terms of growth and profitability.
4.3 Sensitivity analysis
From the table with the sensitivity analysis below, we analyze EPS based
on 2020F from various brokerages firms, with the ratios separated into three parts:
Maximum EPS, Average EPS and Minimum EPS. Further, we also use forward P/E
multiple to calculate possible target price range based on standard deviation of forward
P/E historical band for the past five years.
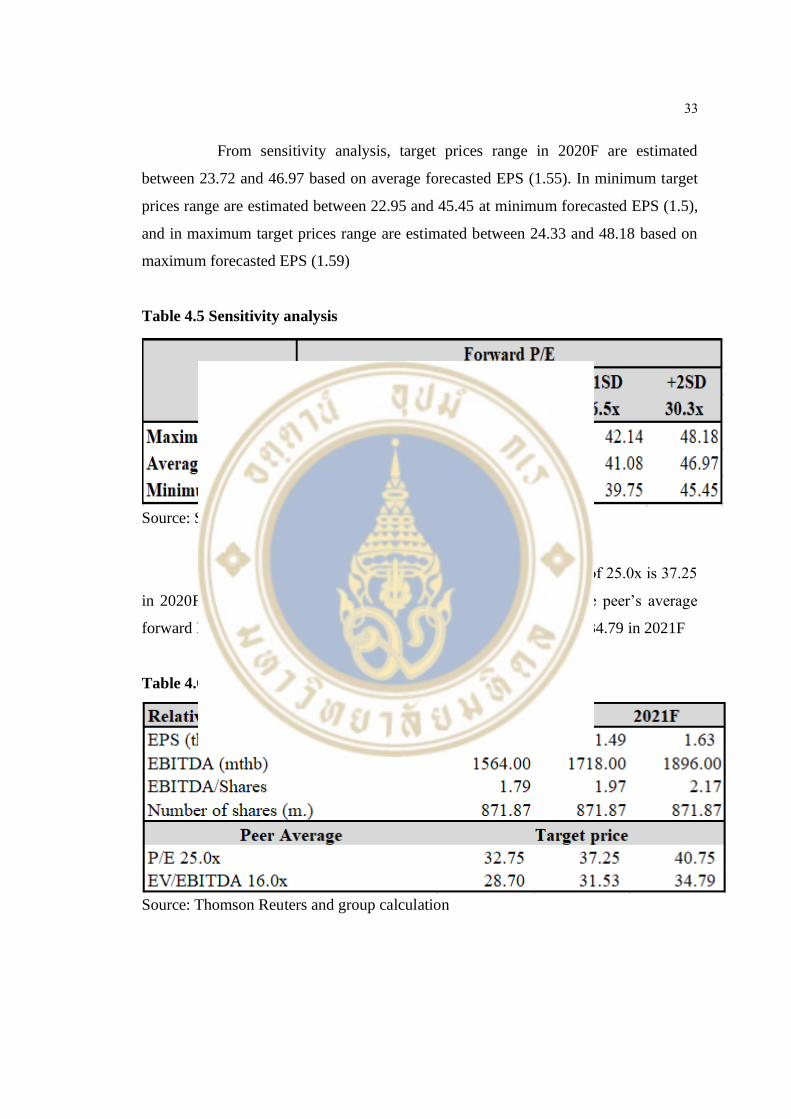
33
From sensitivity analysis, target prices range in 2020F are estimated
between 23.72 and 46.97 based on average forecasted EPS (1.55). In minimum target
prices range are estimated between 22.95 and 45.45 at minimum forecasted EPS (1.5),
and in maximum target prices range are estimated between 24.33 and 48.18 based on
maximum forecasted EPS (1.59)
Table 4.5 Sensitivity analysis
Source: SETTRADE and group calculation
The target price based on the peer’s average forward P/E of 25.0x is 37.25
in 2020F, and 40.75 in 2021F. In terms of target price based on the peer’s average
forward EV/EBITDA of 16.0x, the target price is 31.5. in 2020F, and 34.79 in 2021F
Table 4.6 Target price
Source: Thomson Reuters and group calculation

34
4.4 Valuation recommendation
According to estimated EPS and EBITDA, we recommend buying the stock
based on forward P/E due to high earning growth rate in next 3 years, even though the
current P/E is still higher than 2019 because of the virus effect. MEGA’s P/E is lower
than its peers average PE, which indicates that the stock is undervalued. In terms of
prices, when multiplying forward PE and EPS, the price would increase from 2019 to
2021F based on high EPS growth. In addition, compared to its peers MEGA has
outstanding financial performance, such as higher ROE, lower D/E and better EPS
growth.
Table 4.7 Relative valuation summary
Source: Thomson Reuters and group calculation
Relative Valuation 2019A 2020F 2021F 2022F
Trailing P/E (22.12x) 26 33.0 36.1 39.8
Forward P/E (20.2x) 26 30.1 32.9 36.4
P/BV 26
Trailing EV/EBITDA (21.3x) 26 42.0 46.3 50.8
Forward EV/EBITDA (15.12x) 26 29.8 32.9 36.1
EPS (thb) 1.31 1.49 1.63 1.8
EBITDA (mthb) 1564 1,718 1,896 2,080
EBITDA/Shares 1.79 1.97 2.17 2.39
Number of shares (m.) 871.87 871.87 871.87 871.87
Relative Valuation Summary

35
CHAPTER V
INVESTMENT RISKS
5.1. Price limitation in Vietnam (Source: Annual report)
MEGA could not set the prices of pharmaceutical products in Vietnam as it
is inspected and controlled under the authority of the government of Vietnam. MEGA
must declare the prices, includes import price, wholesale price and retail price publicly
and also have to ask the price approval to the Drug Administration of Vietnam or DAV
before the distribution. Consequently, MEGA could not set the prices as it wishes due
to the limitation of the traditional economic principles. Another risk from distributing
products in this country is that laws and regulations regarding the price control may be
different in the future and it may bring the negative impact to Maxxcare business.
5.2 Real disposable income effects the growth of the company (Source:
Annual report)
Raise in disposable income leads to raise in demand for MEGA’s products
and it has happened in the past recent year. However, the company cannot be ensured
that disposable income in the countries that MEGA operates in, would always
increase. If a bad scenario occurs, MEGA’s business may not grow as expected.
5.3 Risk of foreign currency exchange rates (Source: Annual report)
Due to the fact that MEGA operates in various countries, not only in
Thailand, there is a high proportion of sales in foreign currency. Nevertheless, the
company always report financial statements and financial condition in Thai Baht.
36
The company has to bear the risk of changes in foreign currency exchange rates as
it cannot be passed to customers by increasing the price of product suddenly, which
poses a risk to the profit of the business.
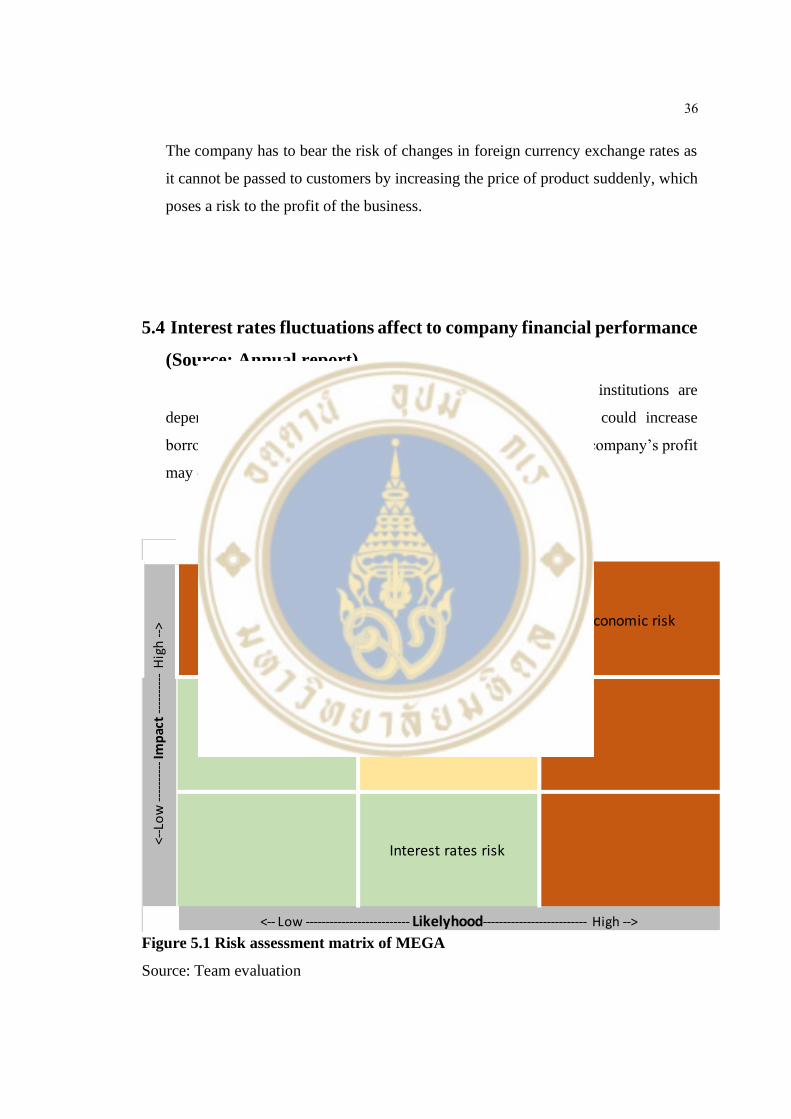
5.4 Interest rates fluctuations affect to company financial performance
(Source: Annual report)
The outstanding loans of the company from financial institutions are
depending on floating interest rates. Any rise in interest rate could increase
borrowing costs which causes a larger interest burden. As a result, company’s profit
may decrease slightly.
Figure 5.1 Risk assessment matrix of MEGA
Source: Team evaluation
Country operating risk Economic risk
Foreign exchange rates
risk
Interest rates risk
RISK ASSESSMENT MATRIX
<--L
ow
----
----
-- Im
pac
t --
----
----
Hig
h --
>
<-- Low -------------------------- Likelyhood-------------------------- High -->

37
CHAPTER VI
CONCLUSIONS
6.1 Investment recommendation
For the relative valuation, we base our conclusion on the P/E multiple as a
measure to value the firm, due to the stable firm earnings growth in this sector that
support P/E valuation. MEGA’s current price is 32.25 compared to our target price 37.25
of 2020F with 15.5% upside (see Table 4.6 Target price in Chapter 4). Therefore, we
recommend buying the firm due to its solid financial performance, in terms of high ROE,
low leverage and high expected EPS growth.
From Damodaran (2020) he estimated the regression model for emerging
market stocks to explain differences in P/E multiples: predicted PE = 13.28 + 80.06
gEPS + 8.24 Payout - 2.72 Beta (R2 = 29.6%). We assume that the company will grow
at the same rate as the five years historical EPS (see Table 4.4 Integrated benchmark
corporation and financial ratios in chapter 4), therefore the predicted PE ratio for MEGA
based on its return on equity of 19.14%, payout ratio of 31.4% and beta of 1.01, would
be 25.6x. Because the current PE ratio for MEGA at the time of the analysis was 23.5,
it was lower than the predicted PE ratio based on MEGA fundamentals. The result also
suggests that the stock is undervalued relative to its peers.
6.2 Triggers for re-assessment
In this section we list the factors that could lead to a change in MEGA’s
multiple ratios, as follows.
6.2.1 Change in expected earnings
According to P/E ratio, it combines earning of the firm compared to its price,
therefore when the market has high expectation on earning it would reflect P/E ratio that
causes P/E ratio higher as increasing on demand for the firm to purchase the stock. On

38
the other hand, a decrease in P/E ratio may occur when future earnings growth is lower
than initial expectation, or return on equity is lower than expected.
6.2.2 Change in return on equity
Return on equity is a measure of profit efficiency as a function of the amount
of capital invested by stockholders. It widely uses as a tool to compare with P/BV ratio
due to a higher book value per share has relatively corresponds high return on equity
and also the firms with high growth rate tend to have high P/BV ratio.
6.2.3 Change in business structure
Mega has changed its business model by raising the proportion of
distribution business or Maxxcare business. Therefore, the profit margin decreases
because Maxxcare products has lower margin than Mega we care products but the
management of Mega stated that it did not affect to the net profit. However, we cannot
know that the business model of Mega will remain the same in the future or not. If it
happens, the earning may be differed and it will lead to change in target price eventually.
6.2.4 Entrance of new competitor
Using relative valuation is based on a comparison to peers. If a new
competitor enters into the market, it could affect the sales growth of MEGA negatively
due to increased competitive pressure. If it is a key competitor with the same business
structure and listed in the stock market, the new competitor could affect the average
multiple ratios of the industry as well.
6.3 Limitations
6.3.1 Difficulty in comparing companies
It is difficult to find the right company for the peer comparison set due to
the differences in the underlying business, especially qualitative data such as superior
product that the company sells, or economy of scales which causes high growth rate and
ROE, making the companies that have an outstanding performance within an industry

39
trade at higher multiple. Moreover, the method requires expertise on the operating and
financial specifies of each peer that cause differences in the valuation of the firms.
6.3.2 Dependence on correctly valued peers
The use of multiples only provides information about relative values, not
absolute values such as discounted cash flow valuations. If the peer group as a whole is
incorrectly valued, for instance it could happen during a bubble stock market, then the
result based on relative multiples will similarly be miss-valued.

40
REFERENCES
International Monetary Fund. (2020a), World Economic Outlook: A Long and Difficult
Ascent.
https://www.imf.org/en/Publications/WEO/Issues/2020/09/30/worldecono
mic-outlook-october-2020
International Monetary Fund. (2020b), World Economic Outlook Database.
https://www.imf.org/en/Publications/WEO/weodatabase/2020/October/do
wnload-entire-database
World Bank. (2020). Global Economic Prospects, January 2020: Slow Growth, Policy
Challenges
https://www.worldbank.org/en/publication/global-economic-prospects
Mega Lifesciences Public Company Limited, Annual Report (2019)
http://mega.listedcompany.com/misc/AR/20200305-mega-ar2019-02.pdf
Damodaran. (2020), Regressions of Multiples on Fundamentals: Market Wide
http://people.stern.nyu.edu/adamodar/New_Home_Page/datafile/MReg20.
html
Relative Valuation, Aswath Damodaran
http://people.stern.nyu.edu/adamodar/pdfiles/country/relval.pdf
Mega Lifesciences Public Company Limited
https://www.setsmart.com/ssm/stockQuotationByStock/MEGA
Relative Valuation, Pros and Cons of the Most Common Form of Valuation
https://einvestingforbeginners.com/relative-valuation-daah/
International Monetary Fund. (2020b). World Economic Outlook Database.
https://www.imf.org/en/Publications/WEO/weodatabase/2020/October/do
wnload-entire-database
The right role for multiples in valuation
https://www.mckinsey.com/business-functions/strategy-and-corporate-
finance/our-insights/the-right-role-for-multiples-in-valuation?cid=eml-web

41
BIOGRAPHY
NAME Mr. Anuphap Saranyouprasit
DATE OF BIRTH 04 June 1995
PLACE OF BIRTH Nonthaburi, Thailand
INSTITUTIONS ATTENDED Bachelor of Science, Kasetsart University,
2017
Master of Management, Mahidol University,
2020
RESEARCH GRANTS -
PUBLICATION / PRESENTATION -
HOME ADDRESS 43/2 Ngamwongwan Road, Bangkhen,
Mueang, Nonthaburi, Thailand 11000
Tel. 0918715498
EMPLOYMENT ADDRESS 87/2 CRC Tower, All Seasons Place, 32nd
Floor, Wireless Road, Pathumwan, Bangkok
10330
E-mail: [email protected]