disaster relief supply chains: network models, algorithm
TRANSCRIPT

Disaster Relief Supply Chains: Network Models,Algorithm, and Case Studies
Anna Nagurney
Isenberg School of ManagementUniversity of Massachusetts
Amherst, Massachusetts 01003
Department of Management ScienceLancaster University, United Kingdom
June 28, 2016
Anna Nagurney Disaster Disaster Relief Supply Chains

Acknowledgments
Many thanks to the Department of Management Science for theinvitation to speak in your seminar series.
Special acknowledgments and thanks to my students andcollaborators who have made research and teaching alwaysstimulating and rewarding.
Anna Nagurney Disaster Disaster Relief Supply Chains

Support for Our Research Has Been Provided by:
Anna Nagurney Disaster Disaster Relief Supply Chains

Outline
I Background and Motivation
I Which Nodes and Links Really Matter?
I The Nagurney-Qiang (N-Q) Network Efficiency / PerformanceMeasure
I A Mean-Variance Disaster Relief Supply Chain Network Modelfor Risk Reduction
I A Game Theory Model for Post-Disaster Humanitarian Relief
Anna Nagurney Disaster Disaster Relief Supply Chains

Background and Motivation
Anna Nagurney Disaster Disaster Relief Supply Chains

Supply chains are the fundamental critical infrastructure for theproduction and distribution of goods and services in our globalizedNetwork Economy.
Supply chain networks also serve as the primary conduit fordisaster preparedness, response, recovery, and reconstruction.
Anna Nagurney Disaster Disaster Relief Supply Chains

Recent disasters have vividly demonstrated the importanceand vulnerability of our transportation and criticalinfrastructure systems
• The biggest blackout in North America, August 14, 2003;
• Two significant power outages in September 2003 – one in theUK and the other in Italy and Switzerland;
• The Indonesian tsunami (and earthquake), December 26, 2004;
• Hurricane Katrina, August 23, 2005;
• The Minneapolis I35 Bridge collapse, August 1, 2007;
• The Sichuan earthquake on May 12, 2008;
• The Haiti earthquake that struck on January 12, 2010 and theChilean one on February 27, 2010;
• The triple disaster in Japan on March 11, 2011;
• Superstorm Sandy, October 29, 2012.Anna Nagurney Disaster Disaster Relief Supply Chains

Hurricane Katrina in 2005
Hurricane Katrina has been called an “American tragedy,” in whichessential services failed completely.
Anna Nagurney Disaster Disaster Relief Supply Chains

The Haitian and Chilean Earthquakes
Anna Nagurney Disaster Disaster Relief Supply Chains

The Triple Disaster in Japan on March 11, 2011
Now the world is reeling from the aftereffects of the triple disasterin Japan with disruptions in the high tech, automotive, and evenfood industries with potential additional ramifications because ofthe radiation.
Anna Nagurney Disaster Disaster Relief Supply Chains
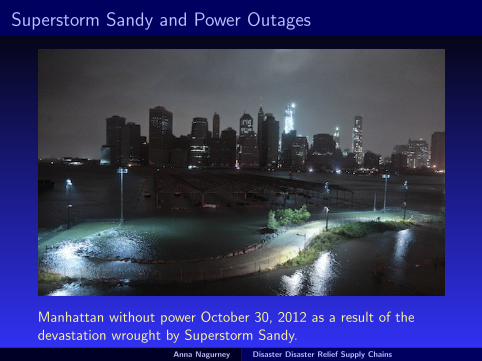
Superstorm Sandy and Power Outages
Manhattan without power October 30, 2012 as a result of thedevastation wrought by Superstorm Sandy.
Anna Nagurney Disaster Disaster Relief Supply Chains

Haiyan Typhoon in the Philippines in 2013
Typhoon Haiyan was a very powerful tropical cyclone thatdevastated portions of Southeast Asia, especially the Philippines,on November 8, 2013. It is the deadliest Philippine typhoon onrecord, killing at least 6,190 people in that country alone. Haiyanwas also the strongest storm recorded at landfall. As of January2014, bodies were still being found. The overall economic lossesfrom Typhoon Haiyan totaled $10 billion.
Anna Nagurney Disaster Disaster Relief Supply Chains

Nepal Earthquake in 2015
The 7.8 magnitude earthquake that struck Nepal on April 25,2015, and the aftershocks that followed, killed nearly 9,000 peopleand injured 22,000 others. This disaster also pushed about 700,000people below the poverty line in the Himalayan nation, which isone of the world’s poorest. About 500,000 homes were madeunlivable by the quakes, leaving about three million peoplehomeless. Much infrastructure was also badly damaged and 1/3 ofthe healthcare facilities devastated. According to The Wall StreetJournal, Nepal needs $6.66 billion to rebuild.
Anna Nagurney Disaster Disaster Relief Supply Chains
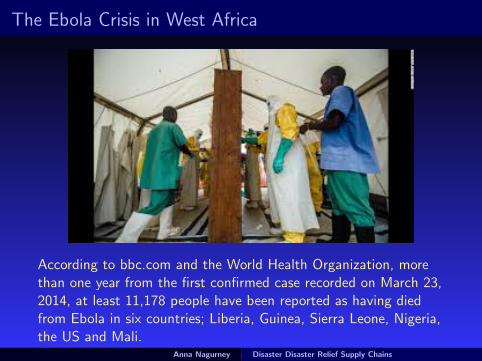
The Ebola Crisis in West Africa
According to bbc.com and the World Health Organization, morethan one year from the first confirmed case recorded on March 23,2014, at least 11,178 people have been reported as having diedfrom Ebola in six countries; Liberia, Guinea, Sierra Leone, Nigeria,the US and Mali.The total number of reported cases is more than 27,275. This isthe largest outbreak since Ebola was first discovered in 1976. Image
thanks to cnn.com.
Anna Nagurney Disaster Disaster Relief Supply Chains

Ms. Debbie Wilson of Doctors Without Borders
On February 4, 2015, the students in my Humanitarian Logisticsand Healthcare class at the Isenberg School heard Debbie Wilson,a nurse, who has worked with Doctors Without Borders, speak onher 6 weeks of experiences battling Ebola in Liberia in Septemberand October 2014.
Anna Nagurney Disaster Disaster Relief Supply Chains

As noted in Nagurney and Qiang (2009), the number of disasters isgrowing as well as the number of people affected by disasters.
Hence, the development of appropriate analytical tools thatcan assist humanitarian organizations and nongovernmentalorganizations as well as governments in the various disastermanagement phases has become a challenge to bothresearchers and practitioners.
Anna Nagurney Disaster Disaster Relief Supply Chains

Disasters have brought an unprecedented impact on human lives inthe 21st century and the number of disasters is growing. FromJanuary to October 2005, an estimated 97,490 people were killedin disasters globally; 88,117 of them because of natural disasters.
Frequency of disasters [Source: Emergency Events Database (2008)]
Anna Nagurney Disaster Disaster Relief Supply Chains

Disasters have a catastrophic effect on human livesand a region’s or even a nation’s resources.
Anna Nagurney Disaster Disaster Relief Supply Chains

Natural Disasters (1975–2008)
Anna Nagurney Disaster Disaster Relief Supply Chains

Which Nodes and Links Really Matter?
Anna Nagurney Disaster Disaster Relief Supply Chains

Some of the Recent Literature on Network Vulnerability
I Latora and Marchiori (2001, 2002, 2004)
I Holme, Kim, Yoon and Han (2002)
I Taylor and Deste (2004)
I Murray-Tuite and Mahmassani (2004)
I Chassin and Posse (2005)
I Barrat, Barthlemy and Vespignani (2005)
I Sheffi (2005)
I DallAsta, Barrat, Barthlemy and Vespignani (2006)
I Jenelius, Petersen and Mattson (2006, 2012)
I Taylor and DEste (2007)
I Nagurney and Qiang (2007, 2008, 2009)
I Qiang and Nagurney (2012)
I Qiang, Nagurney, and Dong (2009)
I Barker, Nicholson, Ramirez-Marquez (2015)
Anna Nagurney Disaster Disaster Relief Supply Chains

Network Centrality Measures
I Barrat et al. (2004, pp. 3748), The identification of the mostcentral nodes in the system is a major issue in networkcharacterization.
I Centrality Measures for Non-Weighted Networks• Degree, betweenness (node and edge), closeness (Freeman(1979), Girvan and Newman (2002))• Eigenvector centrality (Bonacich (1972))• Flow centrality (Freeman, Borgatti and White (1991))• Betweenness centrality using flow (Izquierdo and Hanneman(2006))• Random-work betweenness, Current-flow betweenness(Newman and Girvan (2004))
I Centrality Measures for Weighted Networks (Very Few)• Weighted betweenness centrality (Dall’Asta et al. (2006))• Network efficiency measure (Latora-Marchiori (2001))
Anna Nagurney Disaster Disaster Relief Supply Chains

Supply Chain Network Design Must Capture the Behaviorof Users
Anna Nagurney Disaster Disaster Relief Supply Chains

Behavior on Congested Networks
Flows are routed so as to minimize the total cost to society.
System-Optimized
Centralized Unselfish S–O
vs. vs. vs.��@@
@@��
��@@
@@��
Decentralized Selfish U–O
User-Optimized
Decision-makers select their cost-minimizing routes.
Anna Nagurney Disaster Disaster Relief Supply Chains

Two fundamental principles of travel behavior, due to Wardrop(1952), with terms coined by Dafermos and Sparrow (1969).
User-optimized (U-O) (network equilibrium) Problem – each userdetermines his/her cost minimizing route of travel between anorigin/destination, until an equilibrium is reached, in which no usercan decrease his/her cost of travel by unilateral action (in thesense of Nash).
System-optimized (S-O) Problem – users are allocated among theroutes so as to minimize the total cost in the system, where thetotal cost is equal to the sum over all the links of the link’s usercost times its flow.
The U-O problems, under certain simplifying assumptions, possessoptimization reformulations. But now we can handle costasymmetries, multiple modes of transport, and different classes oftravelers, without such assumptions.
Anna Nagurney Disaster Disaster Relief Supply Chains

We Can State These Conditions Mathematically!
Anna Nagurney Disaster Disaster Relief Supply Chains

The U-O and S-O Conditions
Definition: U-O or Network Equilibrium – Fixed DemandsA path flow pattern x∗, with nonnegative path flows and O/D pairdemand satisfaction, is said to be U-O or in equilibrium, if thefollowing condition holds for each O/D pair w ∈ W and each pathp ∈ Pw :
Cp(x∗)
{= λw , if x∗p > 0,≥ λw , if x∗p = 0.
Definition: S-O ConditionsA path flow pattern x with nonnegative path flows and O/D pairdemand satisfaction, is said to be S-O, if for each O/D pairw ∈ W and each path p ∈ Pw :
C ′p(x)
{= µw , if xp > 0,≥ µw , if xp = 0,
where C ′p(x)=
∑a∈L
∂ca(fa)∂fa
δap, and µw is a Lagrange multiplier.
Anna Nagurney Disaster Disaster Relief Supply Chains

The importance of behavior will now be illustrated through afamous example known as the Braess paradox which demonstrateswhat can happen under U-O as opposed to S-O behavior.
Although the paradox was presented in the context oftransportation networks, it is relevant to other network systems inwhich decision-makers act in a noncooperative (competitive)manner.
Anna Nagurney Disaster Disaster Relief Supply Chains

The Braess (1968) Paradox
Assume a network with a singleO/D pair (1,4). There are 2paths available to travelers:p1 = (a, c) and p2 = (b, d).
For a travel demand of 6, theequilibrium path flows arex∗p1
= x∗p2= 3 and
The equilibrium path travel costisCp1 = Cp2 = 83.
� ��4
� ��2
@@
@@@R
c
� ��3
��
��
�
d
� ��1
��
��
�
a
@@
@@@R
b
ca(fa) = 10fa, cb(fb) = fb + 50,
cc(fc) = fc +50, cd(fd) = 10fd .
Anna Nagurney Disaster Disaster Relief Supply Chains

Adding a Link Increases Travel Cost for All!
Adding a new link creates a newpath p3 = (a, e, d).
The original flow distributionpattern is no longer anequilibrium pattern, since at thislevel of flow the cost on pathp3,Cp3 = 70.
The new equilibrium flow patternnetwork isx∗p1
= x∗p2= x∗p3
= 2.
The equilibrium path travel cost:Cp1 = Cp2 = Cp3 = 92.
� ��4
� ��2
@@
@@@R
c
� ��3
��
��
�
d
-e
� ��1
��
��
�
a
@@
@@@R
b
ce(fe) = fe + 10
Anna Nagurney Disaster Disaster Relief Supply Chains

The 1968 Braess article has been translated from German toEnglish and appears as:
“On a Paradox of Traffic Planning,”
D. Braess, A. Nagurney, and T. Wakolbinger (2005)Transportation Science 39, pp 446-450.
Anna Nagurney Disaster Disaster Relief Supply Chains

The Braess Paradox Around the World
1969 - Stuttgart, Germany - Thetraffic worsened until a newlybuilt road was closed.
1990 - Earth Day - New YorkCity - 42nd Street was closed andtraffic flow improved.
2002 - Seoul, Korea - A 6 laneroad built over theCheonggyecheon River thatcarried 160,000 cars per day andwas perpetually jammed was torndown to improve traffic flow.
Anna Nagurney Disaster Disaster Relief Supply Chains

Anna Nagurney Disaster Disaster Relief Supply Chains

Interview on Broadway for America Revealed on March 15,2011
Anna Nagurney Disaster Disaster Relief Supply Chains
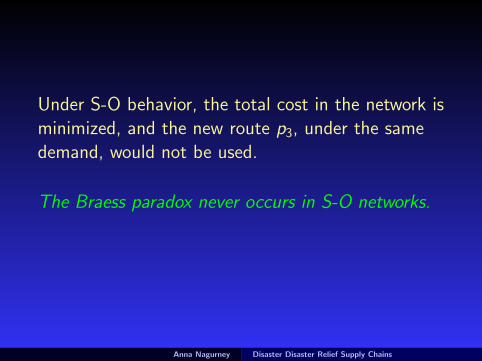
Under S-O behavior, the total cost in the network isminimized, and the new route p3, under the samedemand, would not be used.
The Braess paradox never occurs in S-O networks.
Anna Nagurney Disaster Disaster Relief Supply Chains

� ��4
� ��2
@@
@@@R
c
� ��3
��
��
�
d
-e
� ��1
��
��
�
a
@@
@@@R
b
Recall the Braess network with the added link e.
What happens as the demand increases?
Anna Nagurney Disaster Disaster Relief Supply Chains

For Networks with Time-Dependent Demands
We Use Evolutionary Variational Inequalities
Anna Nagurney Disaster Disaster Relief Supply Chains

Radcliffe Institute for Advanced Study – Harvard University2005-2006
Research with Professor David Parkes of Harvard University andProfessor Patrizia Daniele of the University of Catania, Italy
Anna Nagurney Disaster Disaster Relief Supply Chains

The U-O Solution of the Braess Network with Added Link (Path)and Time-Varying Demands Solved as an Evolutionary VariationalInequality (Nagurney, Daniele, and Parkes, ComputationalManagement Science 4 (2007), pp 355-375).
Anna Nagurney Disaster Disaster Relief Supply Chains

In Demand Regime I, Only the New Path is Used.In Demand Regime II, the travel demand lies in the range [2.58,8.89], and the Addition of a New Link (Path) Makes EveryoneWorse Off!In Demand Regime III, when the travel demand exceeds 8.89, Onlythe Original Paths are Used!
Anna Nagurney Disaster Disaster Relief Supply Chains

The new path is never used, under U-O behavior,when the demand exceeds 8.89, even when thedemand goes out to infinity!
Anna Nagurney Disaster Disaster Relief Supply Chains

Other Networks that Behave like Traffic Networks
The Internet and electric power networks and even supply chains!
Anna Nagurney Disaster Disaster Relief Supply Chains

The Nagurney-Qiang (N-Q)Network Efficiency / Performance Measure
Anna Nagurney Disaster Disaster Relief Supply Chains

The Nagurney and Qiang (N-Q) Network Efficiency /Performance Measure
Definition: A Unified Network Performance MeasureThe network performance/efficiency measure, E(G, d), for a givennetwork topology G and the equilibrium (or fixed) demand vectord, is:
E = E(G, d) =
∑w∈W
dwλw
nW,
where recall that nW is the number of O/D pairs in the network,and dw and λw denote, for simplicity, the equilibrium (or fixed)demand and the equilibrium disutility for O/D pair w, respectively.
Anna Nagurney Disaster Disaster Relief Supply Chains
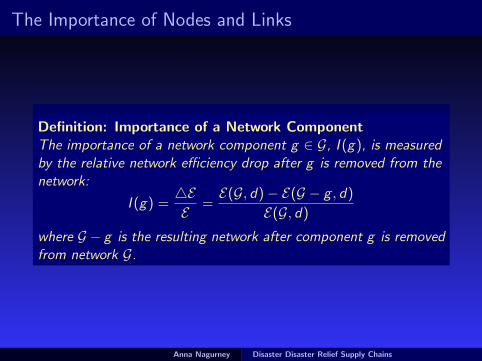
The Importance of Nodes and Links
Definition: Importance of a Network ComponentThe importance of a network component g ∈ G, I (g), is measuredby the relative network efficiency drop after g is removed from thenetwork:
I (g) =4EE
=E(G, d)− E(G − g , d)
E(G, d)
where G − g is the resulting network after component g is removedfrom network G.
Anna Nagurney Disaster Disaster Relief Supply Chains

The Approach to Identifying the Importance of NetworkComponents
The elimination of a link is treated in the N-Q network efficiencymeasure by removing that link while the removal of a node ismanaged by removing the links entering and exiting that node.
In the case that the removal results in no path connecting an O/Dpair, we simply assign the demand for that O/D pair to an abstractpath with a cost of infinity.
The N-Q measure is well-defined even in the case ofdisconnected networks.
Anna Nagurney Disaster Disaster Relief Supply Chains

The Advantages of the N-Q Network Efficiency Measure
• The measure captures demands, flows, costs, and behavior ofusers, in addition to network topology.
• The resulting importance definition of network components isapplicable and well-defined even in the case of disconnectednetworks.
• It can be used to identify the importance (and ranking) of eithernodes, or links, or both.
• It can be applied to assess the efficiency/performance of a widerange of network systems, including financial systems and supplychains under risk and uncertainty.
• It is applicable also to elastic demand networks.
• It is applicable to dynamic networks, including the Internet.
Anna Nagurney Disaster Disaster Relief Supply Chains

Some Applications of the N-Q Measure
Anna Nagurney Disaster Disaster Relief Supply Chains

The Sioux Falls Network
Figure 1: The Sioux Falls network with 24 nodes, 76 links, and 528 O/Dpairs of nodes.
Anna Nagurney Disaster Disaster Relief Supply Chains

Importance of Links in the Sioux Falls Network
The computed network efficiency measure E for the Sioux Fallsnetwork is E = 47.6092. Links 27, 26, 1, and 2 are the mostimportant links, and hence special attention should be paid toprotect these links accordingly, while the removal of links 13, 14,15, and 17 would cause the least efficiency loss.
Figure 2: The Sioux Falls network link importance rankingsAnna Nagurney Disaster Disaster Relief Supply Chains

According to the European Environment Agency (2004), since1990, the annual number of extreme weather and climate relatedevents has doubled, in comparison to the previous decade. Theseevents account for approximately 80% of all economic lossescaused by catastrophic events. In the course of climate change,catastrophic events are projected to occur more frequently (seeSchulz (2007)).
Schulz (2007) applied N-Q network efficiency measure to aGerman highway system in order to identify the critical roadelements and found that this measure provided more reasonableresults than the measure of Taylor and D’Este (2007).
The N-Q measure can also be used to assess which links should beadded to improve efficiency. This measure was used for theevaluation of the proposed North Dublin (Ireland) Metro system(October 2009 Issue of ERCIM News).
Anna Nagurney Disaster Disaster Relief Supply Chains

Figure 3: Comparative Importance of the links for the Baden -Wurttemberg Network – Modelling and analysis of transportationnetworks in earthquake prone areas via the N-Q measure, Tyagunov et al.
Anna Nagurney Disaster Disaster Relief Supply Chains

Mitsakis et al. (2014) applied the N-Q measure to identify theimportance of links in Peloponessus, Greece. The work wasinspired by the immense fires that hit this region in 2007.
The N-Q measure is noted in the ”Guidebook for Enhancing Resilience of
European Road Transport in Extreme Weather Events,” 2014.
Anna Nagurney Disaster Disaster Relief Supply Chains

The N-Q measure has also been used to assess new shipping routesin Indonesia in a report, ”State of Logistics - Indonesia 2015.”
Anna Nagurney Disaster Disaster Relief Supply Chains

An Application to the Braess Paradox
k
k
k k
1
4
2 3AAAAAAU
��
��
���
��
��
���
AAAAAAU
c
a
d
b
k
k
k k
1
4
2 3AAAAAAU
��
��
���
��
��
���
AAAAAAU
-
c
a
d
b
e-
Figure 4: The Braess Network Example
Anna Nagurney Disaster Disaster Relief Supply Chains

An Application to the Braess Paradox
We now apply the unified network efficiency measure E to theBraess network with the link e to identify the importance andranking of nodes and links. The results are reported in the Tables.
Table 1: Link Results for the Braess Network
E Measure E MeasureImportance Importance
Link Value Ranking
a .2069 1
b .1794 2
c .1794 2
d .2069 1
e -.1084 3
Anna Nagurney Disaster Disaster Relief Supply Chains

An Application to the Braess Paradox
Table 2: Nodal Results for the Braess Network
E Measure E MeasureImportance Importance
Node Value Ranking
1 1.0000 1
2 .2069 2
3 .2069 2
4 1.0000 1
Anna Nagurney Disaster Disaster Relief Supply Chains

A Mean-Variance Disaster ReliefSupply Chain Network Model
forRisk Reduction
Anna Nagurney Disaster Disaster Relief Supply Chains

Elements of Our Model
Recently, there has been growing interest in constructingintegrated frameworks that can assist in multiple phases ofdisaster management.
Network-based models and tools, which allow for a graphicaldepiction of disaster relief supply chains and provide the flexibilityof adding nodes and links, coupled with effective computationalprocedures, in particular, offer promise.
Anna Nagurney Disaster Disaster Relief Supply Chains

The Importance of Time in Disaster Relief
The U.S. Federal Emergency Management Agency (FEMA) hasidentified key benchmarks to response and recovery, whichemphasize time and are: to meet the survivors’ initial demandswithin 72 hours, to restore basic community functionality within 60days, and to return to as normal of a situation within 5 years(Fugate (2012)).
Timely and efficient delivery of relief supplies to the affectedpopulation not only decreases the fatality rate but may alsoprevent chaos. In the case of Typhoon Haiyan, slow relief deliveryefforts forced people to seek any possible means to survive. Severalrelief trucks were attacked and had food stolen, and some areaswere reported to be on the brink of anarchy (Chicago Tribune(2013) and CBS News (2013)).
Anna Nagurney Disaster Disaster Relief Supply Chains

This part of the presentation is based on our paper, “AMean-Variance Disaster Relief Supply Chain Network Model forRisk Reduction with Stochastic Link Costs, Time Targets, andDemand Uncertainty,” Anna Nagurney and Ladimer S. Nagurney,in press in Dynamics of Disasters, Kotsireas, Nagurney, andPardalos, editors, Springer International Publishing Switzerland,where many additional references can be found.
Anna Nagurney Disaster Disaster Relief Supply Chains

Inspiration for the Model
The model is inspired by the supply chain network integrationmodel for risk reduction in the case of mergers and acquisitionsdeveloped by Liu and Nagurney, in the paper: “Risk Reduction andCost Synergy in Mergers and Acquisitions via Supply ChainNetwork Integration. Journal of Financial Decision-Making,(2011), 7(2), 1-18, coupled with the integrated disaster reliefframework of Nagurney, Masoumi, and Yu in the paper, “AnIntegrated Disaster Relief Supply Chain Network Model with TimeTargets and Demand Uncertainty,” in Regional Science Matters:Studies Dedicated to Walter Isard, (2015), P. Nijkamp, A. Rose,and K. Kourtit, Editors, Springer, 287-318.
Anna Nagurney Disaster Disaster Relief Supply Chains

Risk Reduction Model of Liu and Nagurney (2011)
RA1
j · · · jRAnA
RRB
1j · · · jRB
nBR
?
HHH
HHj?
���
��� ?
HHH
HHj?
���
���
DA1,2
j · · · jDAnA
D ,2DB1,2
j · · · jDBnB
D ,2
? ? ? ?
DA1,1
j · · · jDAnA
D ,1DB1,1
j · · · jDBnB
D ,1
?
HHHHHj?
������ ?
HHHHHj?
������
MA1
j · · · jMAnA
MMB
1j · · · jMB
nBM
���
@@@R
���
@@@R
jA jBFirm A Firm B
Figure 5: The Pre-Merger Supply Chain Network
Anna Nagurney Disaster Disaster Relief Supply Chains

Risk Reduction Model of Liu and Nagurney (2011)
RA1
h · · · hRAnA
RRB
1h · · · hRB
nBR
?
HHHHj?
��
���
PPPPPPq?
HHHHj
������) ?
��
���
DA1,2
h · · · hDAnA
D ,2DB1,2
h · · · hDBnB
D ,2
? ? ? ?
DA1,1
h · · · hDAnA
D ,1DB1,1
h · · · hDBnB
D ,1
?
HHHHj?
�����
PPPPPPq?
HHHHj
������) ?
�����
MA1
h · · · hMAnA
MMB
1h · · · hMB
nBM
��
@@R
��
@@R
hA hB������
HHHHHj
h0Firm A Firm B
Figure 6: Firms A and B Merge: Demand Points of Either Firm Can Getthe Product from Any Manufacturing Plant Via Any Distribution Center
Synergy measures are developed and the framework is also applicable to
the teaming of organizations as in horizontal collaboration.
Anna Nagurney Disaster Disaster Relief Supply Chains

Integrated Disaster Relief Model of Nagurney, Masoumi,and Yu (2015)
j1Organization
��
��
...@
@@R
ProcurementLinks
~
>
jC1
...
jCnC
-AAAAAAU
...
-�������
TransportationLinks
jS1,1
...
jSnS ,1
-
...
-
StorageLinks
jS1,2
...
jSnS ,2
j-@
@@
@@
@R
...
*-�
��
��
��
TransportationLinks
j
A1
...
j
AnA
-
...
-
ProcessingLinks
j
B1
...
j
BnB
-sAAAAAAU
...
-3
�������
DistributionLinks
j
R1
...
j
RnR
DemandPoints
Figure 7: Network Topology of the Integrated Disaster Relief SupplyChain
Anna Nagurney Disaster Disaster Relief Supply Chains

Inspiration for the Model
The MV approach to risk reduction dates to the work of the Nobellaureate Harry Markowitz (1952, 1959) and is still relevant infinance (Schneeweis, Crowder, and Kazemi (2010)), in supplychains (Chen and Federgruen (2000) and Kim, Cohen, andNetessine (2007)), as well as in disaster relief and humanitarianoperations, where the focus, to-date, has been on inventorymanagement (Ozbay and Ozguven (2007) and Das (2014)).
Anna Nagurney Disaster Disaster Relief Supply Chains
Inspiration for the Model
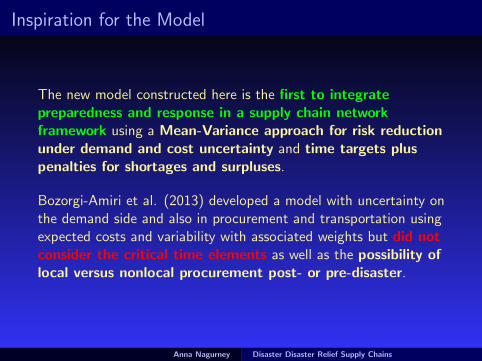
The new model constructed here is the first to integratepreparedness and response in a supply chain networkframework using a Mean-Variance approach for risk reductionunder demand and cost uncertainty and time targets pluspenalties for shortages and surpluses.
Bozorgi-Amiri et al. (2013) developed a model with uncertainty onthe demand side and also in procurement and transportation usingexpected costs and variability with associated weights but did notconsider the critical time elements as well as the possibility oflocal versus nonlocal procurement post- or pre-disaster.
Anna Nagurney Disaster Disaster Relief Supply Chains

Inspiration for the Model
In addition, Boyles and Waller (2009) developed a MV model forthe minimum cost network flow problem with stochastic link costsand emphasized that an MV approach is especially relevant inlogistics and distribution problems with critical implications forsupply chains.
They noted that a solution that only minimizes expectedcost and not variances may not be as reliable and robust asone that does.
Anna Nagurney Disaster Disaster Relief Supply Chains

What We Seek to Achieve with the Model
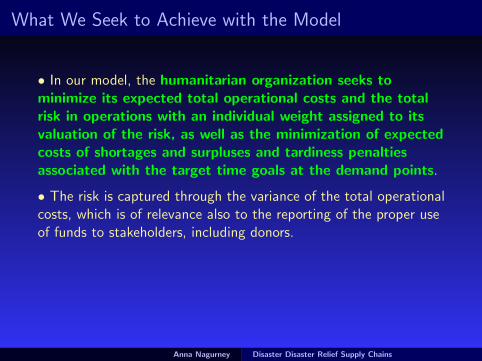
• In our model, the humanitarian organization seeks tominimize its expected total operational costs and the totalrisk in operations with an individual weight assigned to itsvaluation of the risk, as well as the minimization of expectedcosts of shortages and surpluses and tardiness penaltiesassociated with the target time goals at the demand points.
• The risk is captured through the variance of the total operationalcosts, which is of relevance also to the reporting of the proper useof funds to stakeholders, including donors.
• The time goal targets associated with the demand points enableprioritization of demand points as to the timely delivery of reliefsupplies.
Anna Nagurney Disaster Disaster Relief Supply Chains
What We Seek to Achieve with the Model
• In our model, the humanitarian organization seeks tominimize its expected total operational costs and the totalrisk in operations with an individual weight assigned to itsvaluation of the risk, as well as the minimization of expectedcosts of shortages and surpluses and tardiness penaltiesassociated with the target time goals at the demand points.
• The risk is captured through the variance of the total operationalcosts, which is of relevance also to the reporting of the proper useof funds to stakeholders, including donors.
• The time goal targets associated with the demand points enableprioritization of demand points as to the timely delivery of reliefsupplies.
Anna Nagurney Disaster Disaster Relief Supply Chains

What We Seek to Achieve with the Model
• This framework handles both the pre-positioning of reliefsupplies, whether local or nonlocal, as well as theprocurement (local or nonlocal), transport, and distributionof supplies post-disaster. There is growing empirical evidenceshowing that the use of local resources in humanitariansupply chains can have positive impacts (see Matopoulos,Kovacs, and Hayes (2014)). Earlier work on procurement withstochastic components did not distinguish between local ornonlocal procurement (see Falasca and Zobel (2011)).
• The time element in our model is captured through link timecompletion functions as the relief supplies progress alongpaths in the supply chain network. Each path consists of aseries of directed links, from the origin node, which represents thehumanitarian organization, to the destination nodes, which are thedemand points for the relief supplies.
Anna Nagurney Disaster Disaster Relief Supply Chains

j1Organization
��
��
����������
LocalProcurement
NonlocalProcurement
ProcurementLinks
~
>
jC1
...
j
-AAAAAAU
NonlocalTransport
-�������
TransportationLinks
jS1,1
...
j
-
NonlocalStorage
-
StorageLinks
jS1,2
...
j
j-@
@@
@@
@R
...
*-�
��
��
��
TransportationLinks
j
A1
...
j
AnA
-
...
-
ProcessingLinks
j
B1
...
j
BnB
-sAAAAAAU
...
-3
�������
DistributionLinks
j
R1
...
j
RnR
DemandPoints
@@
@R
BBBBBBBBBN
j...
jCnC
QQsj?jQQs
Transport
Processing
Transport-
AAAAAAU
LocalTransport
-�������
j...
jSnS ,1
-
LocalStorage
-
j...
jSnS ,2
Post-Disaster Nonlocal Procurement, Transportation,and Distribution
Post-Disaster Local Procurement, Transportation,and Distribution
Figure 8: Network Topology of the Mean-Variance Disaster Relief Supply Chain
Anna Nagurney Disaster Disaster Relief Supply Chains

Mean-Variance Disaster Relief Supply Chain Model
In the model, the demand is uncertain due to the unpredictabilityof the actual demand at the demand points. The probabilitydistribution of demand might be derived using census data and/orinformation gathered during the disaster preparedness phase. Sincedk denotes the actual (uncertain) demand at destination point k,we have:
Pk(Dk) = Pk(dk ≤ Dk) =
∫ Dk
0Fk(u)du, k = 1, . . . , nR , (1)
where Pk and Fk denote the probability distribution function, andthe probability density function of demand at point k, respectively.Here vk is the “projected demand” for the disaster relief item atdemand point k; k = 1, . . . , nR . The amounts of shortage andsurplus at destination node k are calculated according to:
∆−k ≡ max{0, dk − vk}, k = 1, . . . , nR , (2a)
∆+k ≡ max{0, vk − dk}, k = 1, . . . , nR . (2b)
Anna Nagurney Disaster Disaster Relief Supply Chains

Mean-Variance Disaster Relief Supply Chain Model
The expected values of shortage and surplus at each demand pointare, hence:
E (∆−k ) =
∫ ∞
vk
(u − vk)Fk(u)du, k = 1, . . . , nR , (3a)
E (∆+k ) =
∫ vk
0(vk − u)Fk(u)du, k = 1, . . . , nR . (3b)
The expected penalty incurred by the humanitarian organizationdue to the shortage and surplus of the relief item at each demandpoint is equal to:
E (λ−k ∆−k + λ+
k ∆+k ) = λ−k E (∆−
k ) + λ+k E (∆+
k ), k = 1, . . . , nR .(4)
Anna Nagurney Disaster Disaster Relief Supply Chains

Mean-Variance Disaster Relief Supply Chain Model
We have the following two sets of conservation of flow equations.The projected demand at destination node k, vk , is equal to thesum of flows on all paths in the set Pk , that is:
vk ≡∑p∈Pk
xp, k = 1, . . . , nR . (5)
The flow on link a, fa, is equal to the sum of flows on paths thatcontain that link:
fa =∑p∈P
xp δap, ∀a ∈ L, (6)
where δap is equal to 1 if link a is contained in path p and is 0,otherwise.
Anna Nagurney Disaster Disaster Relief Supply Chains

Mean-Variance Disaster Relief Supply Chain Model
Here we consider total operational link cost functions of the form:
ca = ca(fa, ωa) = ωagafa + gafa, ∀a ∈ L, (7)
where ga and ga are positive-valued for all links a ∈ L. We permitωa to follow any probability distribution and the ωs of differentsupply chain links can be correlated with one another.
The term gafa in (8) represents the part of the total linkoperational cost that is subject to variation of ωa with gafadenoting that part of the total cost that is independent of ωa.
The random variables ωa, a ∈ L can capture various elements ofuncertainty, due, for example, to disruptions because of thedisaster, and price uncertainty for storage, procurements,transport, processing, and distribution services.
Anna Nagurney Disaster Disaster Relief Supply Chains

Mean-Variance Disaster Relief Supply Chain Model
The completion time function associated with the activities on linka is given by:
τa(fa) = tafa + ta, ∀a ∈ L,
where ta and ta are ≥ 0.
The target for completion of activities on paths corresponding todemand point k is given by Tk and is imposed for each demandpoint k by the humanitarian organization decision-maker.
The target for a path p to demand point k is then Tkp = Tk − tp,where tp =
∑a∈L taδap, ∀p ∈ Pk .
Anna Nagurney Disaster Disaster Relief Supply Chains

Mean-Variance Disaster Relief Supply Chain Model
The variable zp is the amount of deviation with respect to thetarget time Tkp associated with the late delivery of relief items tok on path p, ∀p ∈ Pk . We group the sps into the vector z ∈ RnP
+ .
γk(z) is the tardiness penalty function corresponding to demandpoint k; k = 1, . . . , nR .
Anna Nagurney Disaster Disaster Relief Supply Chains

Mean-Variance Disaster Relief Supply Chain Model
The objective function faced by the organization’s decision-maker,which he seeks to minimize, is the following:
E
[∑a∈L
ca(fa, ωa)
]+αVar
[∑a∈L
ca(fa, ωa)
]+
nR∑k=1
(λ−k E (∆−k )+λ+
k E (∆+k ))
+
nR∑k=1
γk(z)
=∑a∈L
E [ca(fa, ωa)]+αVar
[∑a∈L
ca(fa, ωa)
]+
nR∑k=1
(λ−k E (∆−k )+λ+
k E (∆+k ))
+
nR∑k=1
γk(z), (8)
where E denotes the expected value, Var denotes the variance, andα represents the risk aversion factor (weight) for the organizationthat the organization’s decision-maker places on the risk.
Anna Nagurney Disaster Disaster Relief Supply Chains

Mean-Variance Disaster Relief Supply Chain Model
The goal of the decision-maker is, thus, to minimize the followingproblem, with the objective function in (8), in lieu of (7), takingthe form in (9) below:
Minimize∑a∈L
E (ωa)gafa +∑a∈L
gafa + αVar(∑a∈L
ωagafa)
+
nR∑k=1
(λ+k − E (∆−
k ) + λ+k E (∆+
k )) +
nR∑k=1
γk(z) (9)
subject to constraint (6) and the following constraints:
xp ≥ 0, ∀p ∈ P, (10)
zp ≥ 0, ∀p ∈ P, (11)∑q∈P
∑a∈L
taxqδaqδap − zp ≤ Tkp, ∀p ∈ Pk ; k = 1, . . . , nR . (12)
Anna Nagurney Disaster Disaster Relief Supply Chains

Mean-Variance Disaster Relief Supply Chain Model
In view of constraint (6) we can reexpress the objective function in(9) in path flows (rather than in link flows and path flows) toobtain the following optimization problem:
Minimize∑a∈L
E (ωa)ga
∑q∈P
xqδaq + ga
∑q∈P
xqδaq
+αVar(
∑a∈L
ωaga
∑q∈P
xqδaq)+
nR∑k=1
(λ−k E (∆−k )+λ+
k E (∆+k ))+
nR∑k=1
γk(z)
(13)subject to constraints: (10) – (12).Let K denote the feasible set:
K ≡ {(x , z , µ)|x ∈ RnP+ , z ∈ RnP
+ , and µ ∈ RnP+ }, (14)
where µ is the vector of Lagrange multipliers corresponding to theconstraints in (12) with an individual element corresponding topath p denoted by µp.
Anna Nagurney Disaster Disaster Relief Supply Chains

Mean-Variance Disaster Relief Supply Chain Model
Before presenting the variational inequality formulation of theoptimization problem immediately above, we review the respectivepartial derivatives of the expected values of shortage and surplus ofthe disaster relief item at each demand point with respect to thepath flows, derived in Dong, Zhang, and Nagurney (2004),Nagurney, Yu, and Qiang (2011), and Nagurney, Masoumi, and Yu(2012). In particular, they are given by:
∂E (∆−k )
∂xp= Pk
∑q∈Pk
xq
− 1, ∀p ∈ Pk ; k = 1, . . . , nR ,
(15a)and,
∂E (∆+k )
∂xp= Pk
∑q∈Pk
xq
, ∀p ∈ Pk ; k = 1, . . . , nR . (15b)
Anna Nagurney Disaster Disaster Relief Supply Chains

Mean-Variance Disaster Relief Supply Chain Model
Theorem: Variational Inequality FormulationThe optimization problem (13), subject to its constraints (10) –(12), is equivalent to the variational inequality problem: determine(x∗, z∗, µ∗) ∈ K, such that, ∀(x , z , µ) ∈ K:nR∑
k=1
∑p∈Pk
[∑a∈L
(E (ωa)ga + ga)δap + α∂Var(
∑a∈L ωaga
∑q∈P x∗qδaq)
∂xp
+λ+k Pk(
∑q∈Pk
x∗q ) − λ−k (1− Pk(∑q∈Pk
x∗q )) +∑q∈P
∑a∈L
µ∗qgaδaqδap
×[xp − x∗p ] +
nR∑k=1
∑p∈Pk
[∂γk(z∗)
∂zp− µ∗p
]× [zp − z∗p ]
+
nR∑k=1
∑p∈Pk
Tkp + z∗p −∑q∈P
∑a∈L
gax∗qδaqδap
×[µp−µ∗p] ≥ 0. (16)
Anna Nagurney Disaster Disaster Relief Supply Chains

Mean-Variance Disaster Relief Supply Chain Model
Variational inequality (16) can be put into standard form: findX ∗ ∈ K: ⟨
F (X ∗),X − X ∗⟩ ≥ 0, ∀X ∈ K, (17)
with the feasible set K ≡ K , the column vectors X ≡ (x , z , µ), andF (X ) ≡ (F1(X ),F2(X ),F3(X )):
F1(X ) =
[∑a∈L
(E (ωa)ga + ga)δap + α∂Var(
∑a∈L ωaga
∑q∈P xqδaq)
∂xp
+λ+k Pk(
∑q∈Pk
xq)− λ−k (1− Pk(∑q∈Pk
xq)) +∑q∈P
∑a∈L
µqgaδaqδap, p ∈ Pk ; k = 1, . . . , nR
,
F2(X ) =
[∂γk(z)
∂zp− µp, p ∈ Pk ; k = 1, . . . , nR
],
F3(X ) =
Tkp + zp −∑q∈P
∑a∈L
gaxqδaqδap, p ∈ Pk ;∀k
. (18)
Anna Nagurney Disaster Disaster Relief Supply Chains

The Algorithm
At an iteration τ of the Euler method (cf. Dupuis and Nagurney(1993) and Nagurney and Zhang (1996)) one computes:
X τ+1 = PK(X τ − aτF (X τ )), (19)
where PK is the projection on the feasible set K and F is thefunction that enters the variational inequality problem: determineX ∗ ∈ K such that
〈F (X ∗),X − X ∗〉 ≥ 0, ∀X ∈ K, (20)
where 〈·, ·〉 is the inner product in n-dimensional Euclidean space,X ∈ Rn, and F (X ) is an n-dimensional function from K to Rn,with F (X ) being continuous.
Anna Nagurney Disaster Disaster Relief Supply Chains

The Algorithm
As shown in Dupuis and Nagurney (1993); see also Nagurney andZhang (1996), for convergence of the general iterative scheme,which induces the Euler method, among other methods, thesequence {aτ} must satisfy:
∑∞τ=0 aτ = ∞, aτ > 0, aτ → 0, as
τ →∞. Specific conditions for convergence of this scheme can befound for a variety of network-based problems, similar to thoseconstructed here, in Nagurney and Zhang (1996) and thereferences therein.
Anna Nagurney Disaster Disaster Relief Supply Chains

The Algorithm
Explicit Formulae for the Euler Method Applied to theDisaster Relief Supply Chain Network Variational InequalityClosed form expressions for the product path flows, the timedeviations, and the Lagrange multipliers, ∀p ∈ Pk ;∀k:
xτ+1p = max{0, xτ
p + aτ (λ−k (1− Pk(
∑q∈Pk
xτq ))− λ+
k Pk(∑q∈Pk
xτq )
−∑a∈L
(E (ωa)ga + ga)δap − α∂Var(
∑a∈L ωaga
∑q∈P xτ
q δaq)
∂xp
−∑q∈P
∑a∈L
µτqgaδaqδap)}; (21)
zτ+1p = max{0, zτ
p + aτ (µτp −
∂γk(zτ )
∂zp)}, (22)
µτ+1p = max{0, µτ
p + aτ (∑q∈P
∑a∈L
gaxτq δaqδap − Tkp − zτ
p }. (23)
Anna Nagurney Disaster Disaster Relief Supply Chains

The Algorithm
In view of (21), we can define a generalized marginal total cost onpath p; p ∈ P, denoted by GC ′
p, where
GC ′p ≡
∑a∈L
(E (ωa)ga + ga)δap + α∂Var(
∑a∈L ωaga
∑q∈P xqδaq)
∂xp.
(24)
Anna Nagurney Disaster Disaster Relief Supply Chains

Background on the Mexico Case Study
According to the United Nations (2011), Mexico is ranked asone of the world’s thirty most exposed countries to three ormore types of natural disasters, notably, storms, hurricanes,floods, as well as earthquakes, and droughts.
For example, as reported by The International Bank forReconstruction and Development/The World Bank (2012), 41%of Mexico’s national territory is exposed to storms,hurricanes, and floods; 27% to earthquakes, and 29% todroughts.
Anna Nagurney Disaster Disaster Relief Supply Chains

Background on the Mexico Case Study
The hurricanes can come from the Atlantic or Pacific oceans or theCaribbean.
As noted by de la Fuente (2011), the single most costly disaster inMexico were the 1985 earthquakes, followed by the floods in thesouthern state of Tabasco in 2007, with damages of more than 3.1billion U.S. dollars.
Anna Nagurney Disaster Disaster Relief Supply Chains

Mexico Case Study
We consider a humanitarian organization such as the Mexican RedCross, which is interested in preparing for another possiblehurricane, and recalls the devastation wrought by HurricaneManuel and Hurricane Ingrid, which struck Mexico within a24 hour period in September 2013.
Ingrid caused 32 deaths, primarily, in eastern Mexico, whereasManuel resulted in at least 123 deaths, primarily in western Mexico(NOAA (2014)). According to Pasch and Zelinsky (2014), thetotal economic impact of Manuel alone was estimated to beapproximately $4.2 billion (U.S.), with the biggest losses occurringin Guerrero.
Anna Nagurney Disaster Disaster Relief Supply Chains

Mexico Case Study
We assume that the Mexican Red Cross is mainly concerned aboutthe delivery of relief supplies to the Mexico City area and theAcapulco area.
Ingrid affected Mexico City and Manuel affected the Acapulco areaand also points northwest.
Photos of Acapulco post Manuel courtesy The Weather Channel.
Anna Nagurney Disaster Disaster Relief Supply Chains

Mexico Case Study and Variant
j1Organization
��
��
����������
NonlocalProcurement
ProcurementLinks
~jC1
3
jC2
7
-
NonlocalTransport
-
TransportationLinks
j2
4
S1,1
jS2,1
816
17
18
9 10
-
NonlocalStorage
-
StorageLinks
jS1,2
6
5
jS2,2
@@
@@
@@R-
TransportationLinks
jA1 21
11 -
1 ProcessingLinks
jB1
-3
�������
DistributionLinks
j
R1j
R2
DemandPoints12
13
@@
@R jC3
15
QQsj?jQQs
Transport
Processing
Transport- jS3,1
LocalStorage
19
1420- j
S3,2
Post-Disaster Local Procurement, Transportation, andDistribution
Post-Disaster Local Procurement, Transportation, andDistribution
Figure 9: Disaster Relief Supply Chain Network Topology for MexicoExample and its Variant
Anna Nagurney Disaster Disaster Relief Supply Chains

Mexico Case Study
The Mexican Red Cross represents the organization and is denotedby node 1.
There are two demand points, R1 and R2, for the ultimate deliveryof the relief supplies. R1 is situated closer to Mexico City and R2 iscloser to Acapulco.
Nonlocal procurement is done through two locations in Texas, C1
and C2. Because of good relationships with the U.S. and theAmerican Red Cross, there are two nonlocal storage facilities thatthe Mexican Red Cross can utilize, both located in Texas, andrepresented by links 5 and 9 emanating from S1,1 and S2,1,respectively.
Local storage, on the other hand, is depicted by the link emanatingfrom node S3,1, link 19.
The Mexican Red Cross can also procure locally (see C3).Anna Nagurney Disaster Disaster Relief Supply Chains
Mexico Case Study
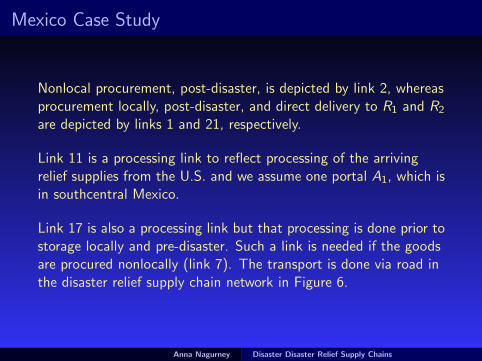
Nonlocal procurement, post-disaster, is depicted by link 2, whereasprocurement locally, post-disaster, and direct delivery to R1 and R2
are depicted by links 1 and 21, respectively.
Link 11 is a processing link to reflect processing of the arrivingrelief supplies from the U.S. and we assume one portal A1, which isin southcentral Mexico.
Link 17 is also a processing link but that processing is done prior tostorage locally and pre-disaster. Such a link is needed if the goodsare procured nonlocally (link 7). The transport is done via road inthe disaster relief supply chain network in Figure 6.
Anna Nagurney Disaster Disaster Relief Supply Chains

Mexico Case Study
The demand for the relief items at the demand point R1 (inthousands of units) is assumed to follow a uniform probabilitydistribution on the interval [20, 40]. The path flows and the linkflows are also in thousands of units. Therefore,
PR1(∑p∈P1
xp) =
∑p∈P1
xp − 20
40− 20=
∑6i=1 xpi − 20
20.
Also, the demand for the relief item at R2 (in thousands of units)is assumed to follow a uniform probability distribution on theinterval [20, 40]. Hence,
PR2(∑p∈P2
xp) =
∑p∈P1
xp − 20
40− 20=
∑12i=7 xpi − 20
20.
Anna Nagurney Disaster Disaster Relief Supply Chains

Mexico Case Study
The time targets for the delivery of supplies at R1 and R2,respectively, in hours, are: T1 = 48 and T2 = 48. The penalties atthe two demand points for shortages are: λ−1 = 10, 000 andλ−2 = 10, 000 and for surpluses: λ+
1 = 100 and λ+2 = 100. The
tardiness penalty function γR1(z) = 3(∑
p∈PR1z2p ) and the
tardiness penalty function γR2(z) = 3(∑
p∈PR2z2p ).
We assume that the covariance matrix associated with the linktotal cost functions ca(fa, ωa), a ∈ L, is a 21× 21 matrix σ2I .
Also, σ2 = 1 and the risk aversion factor α = 10 since thehumanitarian organization is risk-averse with respect to its costsassociated with its operations.
Anna Nagurney Disaster Disaster Relief Supply Chains

Mexico Case Study
The additional data are given in the Tables, where we also reportthe computed optimal link flows via the Euler method, which arecalculated from the computed path flows.
Note that the time completion functions, τa(fa), ∀a ∈ L, are 0.00 ifthe links correspond to procurement, transport, and storage,pre-disaster, since such supplies are immediately available forshipment once a disaster strikes.
Anna Nagurney Disaster Disaster Relief Supply Chains

Mexico Case Study
Table 3: Link Total Cost, Expected Value of Random Link Cost,Marginal Generalized Link Total Cost, and Time Completion Functionsand Optimal Link Flows: α = 10
Link a ca(fa, ωa) E (ωa) g c ′a τa(fa) f ∗a ;σ2 = 1
1 ω16f1 + f1 2 α72σ2f1 + 13 f1 + 15 9.07
2 ω23f2 + f2 2 α18σ2f2 + 7 f2 + 7 2.54
3 ω32f3 + f3 1 α8σ2f3 + 3 0.00 2.57
4 ω43f4 + f4 1 α18σ2f4 + 4 0.00 2.57
5 ω52f5 + f5 1 α8σ2f5 + 3 0.00 2.57
6 ω62f6 + f6 2 α8σ2f6 + 5 2f6 + 10 5.11
7 ω72f7 + f7 1 α8σ2f7 + 3 0.00 8.51
8 ω83f8 + f8 1 α18σ2f8 + 4 0.00 4.36
9 ω92f9 + f9 1 α8σ2f9 + 3 0.00 4.36
Anna Nagurney Disaster Disaster Relief Supply Chains

Mexico Case Study
Table 4: Table continued
10 ω102f10 + f10 1 α8σ2f10 + 3 2f10 + 10 4.36
11 ω11f11 + f11 2 α2σ2f11 + 3 f11 + 2 9.47
12 ω12f12 + f12 2 α2σ2f12 + 3 f12 + 6 17.78
13 ω13f13 + f13 2 α2σ2f13 + 3 f13 + 7 17.64
14 ω14f14 + f14 1 α2σ2f14 + 2 0.00 21.79
15 ω15f15 + f15 1 α2σ2f15 + 2 0.00 21.79
16 ω16f16 + f16 1 α2σ2f16 + 2 0.00 4.15
17 ω17.5f17 + f17 1 ασ2.5f17 + 1.5 0.00 4.15
18 ω18f18 + f18 1 α2σ2f18 + 2 0.00 4.15
19 ω19.5f19 + f19 2 ασ2.5f19 + 1.5 0.00 25.94
20 ω20f20 + f20 2 α2σ2f20 + 2 2f20 + 5 25.94
21 ω216f21 + f21 2 α72σ2f21 + 13 f21 + 14 9.13
Anna Nagurney Disaster Disaster Relief Supply Chains

Results for Mexico Case Study
Table 5: Path Definitions, Target Times, Optimal Path Flows, OptimalPath Time Deviations, and Optimal Lagrange Multipliers
Path Definition (Links) x∗p z∗p µ∗pp1 = (1) 9.07 0.00 0.00p2 = (2, 6, 11, 12) 1.27 34.75 208.53
PR1 : p3 = (3, 4, 5, 6, 11, 12) 1.29 25.26 151.56p4 = (7, 8, 9, 10, 11, 12) 2.18 23.78 142.69p5 = (7, 16, 17, 18, 19, 20, 12) 2.98 50.48 302.85p6 = (14, 15, 19, 20, 12) 10.06 50.48 302.85
p7 = (2, 6, 11, 13) 1.27 35.48 212.88p8 = (3, 4, 5, 6, 11, 13) 1.29 25.99 155.91
PR2 : p9 = (7, 8, 9, 10, 11, 13) 2.18 24.51 147.04p10 = (7, 16, 17, 18, 19, 20, 13) 1.17 51.20 307.19p11 = (14, 15, 19, 20, 13) 11.74 51.20 307.19p12 = (21) 9.13 0.00 0.00
Anna Nagurney Disaster Disaster Relief Supply Chains

Example - Variant 1
In Variant 1, we kept the data as before, but now we assumed thatthe humanitarian organization has a better forecast for the demandat the two demand points. The demand for the relief items at thedemand point R1 again follows a uniform probability distributionbut on the interval [30, 40] so that:
PR1(∑p∈P1
xp) =
∑p∈P1
xp − 30
40− 30=
∑6i=1 xpi − 30
10.
Also, the demand for the relief item at R2 follows a uniformprobability distribution on the interval [30, 40] so that:
PR2(∑p∈P2
xp) =
∑p∈P2
xp − 30
40− 30=
∑12i=7 xpi − 30
10.
Anna Nagurney Disaster Disaster Relief Supply Chains
Results for Example - Variant 1
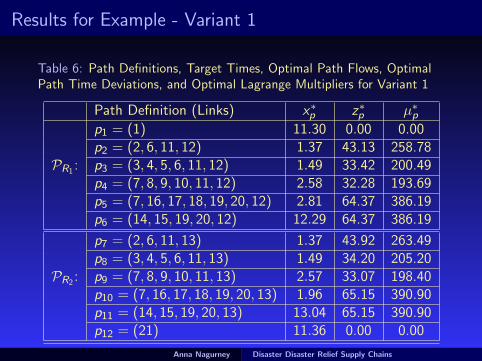
Table 6: Path Definitions, Target Times, Optimal Path Flows, OptimalPath Time Deviations, and Optimal Lagrange Multipliers for Variant 1
Path Definition (Links) x∗p z∗p µ∗pp1 = (1) 11.30 0.00 0.00p2 = (2, 6, 11, 12) 1.37 43.13 258.78
PR1 : p3 = (3, 4, 5, 6, 11, 12) 1.49 33.42 200.49p4 = (7, 8, 9, 10, 11, 12) 2.58 32.28 193.69p5 = (7, 16, 17, 18, 19, 20, 12) 2.81 64.37 386.19p6 = (14, 15, 19, 20, 12) 12.29 64.37 386.19
p7 = (2, 6, 11, 13) 1.37 43.92 263.49p8 = (3, 4, 5, 6, 11, 13) 1.49 34.20 205.20
PR2 : p9 = (7, 8, 9, 10, 11, 13) 2.57 33.07 198.40p10 = (7, 16, 17, 18, 19, 20, 13) 1.96 65.15 390.90p11 = (14, 15, 19, 20, 13) 13.04 65.15 390.90p12 = (21) 11.36 0.00 0.00
Anna Nagurney Disaster Disaster Relief Supply Chains

Results for Example - Variant 1
The projected demands are: vR1 = 31.84 and vR2 = 31.79. Thegreatest percentage increase in path flow volumes occurs on pathsp1 and p6 for demand point R1 and on paths p11 and p12 fordemand point R2, reinforcing the previous results.
For both the Example and its variant the time targets are met forpaths p1 and p2 since µ∗p1
and µ∗p2= 0.00 for both examples.
Hence, direct local procurement post-disaster is effective time-wise,and cost-wise. Mexico is a large country and this result is quitereasonable.
Anna Nagurney Disaster Disaster Relief Supply Chains

A Game Theory Model for Post-Disaster Humanitarian Relief
Anna Nagurney Disaster Disaster Relief Supply Chains

Game Theory and Disaster Relief
Although there have been quite a few optimization modelsdeveloped for disaster relief there are very few game theory models.
Nevertheless, it is clear that humanitarian relief organizations andNGOs compete for financial funds from donors. Within threeweeks after the 2010 earthquake in Haiti, there were 1,000 NGOsoperating in that country. Interestingly, and, as noted by Ortuno etal. (2013), although the importance of donations is a fundamentaldifference of humanitarian logistics with respect to commerciallogistics, this topic has “not yet been sufficiently studied byacademics and there is a wide field for future research in thiscontext.”
Toyasaki and Wakolbinger (2014) developed perhaps the firstmodels of financial flows that captured the strategic interactionbetween donors and humanitarian organizations using game theoryand also included earmarked donations.
Anna Nagurney Disaster Disaster Relief Supply Chains

Game Theory and Disaster Relief
In this part of presentation, we construct what we believe is thefirst Generalized Nash Equilibrium (GNE) model for post-disasterhumanitarian relief, which contains both a financial componentand a supply chain component. The Generalized Nash Equilibriumproblem is a generalization of the Nash Equilibrium problem (cf.Nash (1950, 1951)) in that the players’ strategies, as defined bythe underlying constraints, depend also on their rivals’ strategies.
This part of the presentation is based on the paper, “A GeneralizedNash Equilibrium Network Model for Post-Disaster HumanitarianRelief,” Anna Nagurney, Emilio Alvarez-Flores, and Ceren Soylu.
Anna Nagurney Disaster Disaster Relief Supply Chains

The Network Structure of the Model
� ��
� ��
1
1
� ��
� ��
. . .
. . .
NGOs
i
j
Financial Flows
Demand Points for Humanitarian Relief Post a Disaster
· · ·
· · ·
� ��
� ��
Relief Item Flows
m
n?
JJ
JJ
JJ
JJ
JJ
HHHHHHHH
HHHHHHHHHH
HHj?
�
ZZ
ZZ
ZZ
ZZ
ZZ
ZZ
ZZ~?
��
��
��
��
��
��
��=
��������
����������
���
� II
� ��D
Supersink Node
JJ
JJJ
HHHH
HHHH
HHj
����
����
���
Figure 10: The Network Structure of the Game Theory ModelAnna Nagurney Disaster Disaster Relief Supply Chains

The Game Theory Model
We assume that each NGO i has, at its disposal, an amount si ofthe relief item that it can allocate post-disaster. Hence, we havethe following conservation of flow equation, which must hold foreach i ; i = 1, . . . ,m:
n∑j=1
qij ≤ si . (1)
In addition, we know that the product flows for each i ;i = 1, . . . ,m, must be nonnegative, that is:
qij ≥ 0, j = 1, . . . , n. (2)
Each NGO i encumbers a cost, cij , associated with shipping therelief items to location j , denoted by cij , where we assume that
cij = cij(qij), j = 1, . . . n, (3)
with these cost functions being strictly convex and continuouslydifferentiable.
Anna Nagurney Disaster Disaster Relief Supply Chains

The Game Theory Model
In addition, each NGO i ; i = 1, . . . ,m, derives satisfaction orutility associated with providing the relief items to j ; j = 1, . . . , n,with its utility over all demand points given by
∑nj=1 γijqij . Here
γij is a positive factor representing a measure of satisfaction/utilitythat NGO i acquires through its supply chain activities to demandpoint j . Each NGO i ; i = 1, . . . ,m, associates a positive weight ωi
with∑n
j=1 γijqij , which provides a monetization of, in effect, thiscomponent of the objective function.
Anna Nagurney Disaster Disaster Relief Supply Chains

The Game Theory Model
Finally, each NGO i ; i = 1, . . . ,m, based on the media attentionand the visibility of NGOs at location j ; j = 1, . . . , n, acquiresfunds from donors given by the expression
βi
n∑j=1
Pj(q), (4)
where Pj(q) represents the financial funds in donation dollars dueto visibility of all NGOs at location j . Hence, βi is a parameterthat reflects the proportion of total donations collected for thedisaster at demand point j that is received by NGO i . Expression(4), therefore, represents the financial flow on the link joining nodeD with node NGO i .
Anna Nagurney Disaster Disaster Relief Supply Chains

The Game Theory Model
Each NGO seeks to maximize its utility with the utilitycorresponding to the financial gains associated with the visibilitythrough media of the relief item flow allocations, βi
∑nj=1 Pj(q),
plus the utility associated with the supply chain aspect of deliveryof the relief items,
∑nj=1 γijqij −
∑nj=1 cij(qij). The optimization
problem faced by NGO i ; i = 1, . . . ,m, is, hence,
Maximize βi
n∑j=1
Pj(q) + ωi
n∑j=1
γijqij −n∑
j=1
cij(qij) (5)
subject to constraints (1) and (2).
Anna Nagurney Disaster Disaster Relief Supply Chains

The Game Theory Model
We also have that, at each demand point j ; j = 1, . . . , n:m∑
i=1
qij ≥ d j , (6)
andm∑
i=1
qij ≤ dj , (7)
where d j denotes a lower bound for the amount of the relief items
needed at demand point j and dj denotes an upper bound on theamount of the relief items needed post the disaster at demandpoint j .We assume that
m∑i=1
si ≥n∑
j=1
d j , (8)
so that the supply resources of the NGOs are sufficient to meet theminimum financial resource needs at all the demand pointsfollowing the disaster. Anna Nagurney Disaster Disaster Relief Supply Chains

The Game Theory Model
Each NGO i ; i = 1, . . . ,m, seeks to determine its optimal vector ofrelief items or strategies, q∗i , that maximizes objective function (5),subject to constraints (1), (2), and (6), (7). This is theGeneralized Nash Equilibrium problem for our humanitarian reliefpost disaster problem.
Anna Nagurney Disaster Disaster Relief Supply Chains

The Game Theory Model
Theorem: Optimization Formulation of the Generalized NashEquilibrium Model of Financial Flow of FundsThe above Generalized Nash Equilibrium problem, with eachNGO’s objective function (5) rewritten as:
Minimize − βi
n∑j=1
Pj(q)− ωi
n∑j=1
γijqij +n∑
j=1
cij(qij) (9)
and subject to constraints (1) and (2), with common constraints(6) and (7), is equivalent to the solution of the followingoptimization problem:
Minimize −n∑
j=1
Pj(q)−m∑
i=1
n∑j=1
ωiγij
βiqij +
m∑i=1
n∑j=1
1
βicij(qij) (10)
subject to constraints: (1), (2), (6), and (7).
Anna Nagurney Disaster Disaster Relief Supply Chains

The Game Theory Model
Variational Inequality FormulationThe solution q∗ with associated Lagrange multipliers λ∗k ;k = 1, . . . ,m, for the supply constraints, the Lagrange multipliers:λ1
l∗; l = 1, . . . , n, for the lower bound demand constraints, and the
Lagrange multipliers: λ2l∗; l = 1, . . . , n, for the upper bound
demand constraints, can be obtained by solving the variationalinequality problem: determine (q∗, λ∗, λ1∗, λ2∗) ∈ Rmn+m+2n
+ :
m∑k=1
n∑l=1
− n∑j=1
(∂Pj(q
∗)
∂qkl)− ωkγkl
βk+
1
βk
∂ckl(q∗kl)
∂qkl+ λ∗k − λ1
l∗+ λ2
l∗
× [qkl − q∗kl ]
+m∑
k=1
(sk −n∑
l=1
q∗kl)× (λk − λ∗k) +n∑
l=1
(n∑
k=1
q∗kl − d l)× (λl − λ1l∗)
+n∑
l=1
(dl−m∑
k=1
q∗kl)×(λ2l −λ2
l∗) ≥ 0, ∀(q, λ, λ1, λ2) ∈ Rmn+m+2n
+ ,
(11)where λ is the vector of Lagrange multipliers: (λ1, . . . , λm), λ1 isthe vector of Lagrange multipliers: (λ1
1, . . . , λ1n), and λ2 is the
vector of Lagrange multipliers: (λ21, . . . , λ
2n).
Anna Nagurney Disaster Disaster Relief Supply Chains

The Algorithm
Explicit Formulae for the Euler Method Applied to the GameTheory ModelWe have the following closed form expression for the product flowsk = 1, . . . ,m; l = 1, . . . , n, at each iteration:
qτ+1kl
= max{0, {qτkl+aτ (
n∑j=1
(∂Pj(q
τ )
∂qkl)+
ωkγkl
βkl− 1
βk
∂ckl(qτkl)
∂qkl−λτ
k+λ1lτ−λ2
lτ)}},
the following closed form expressions for the Lagrange multipliersassociated with the supply constraints, respectively, fork = 1, . . . ,m:
λτ+1k = max{0, λτ
k + aτ (−sk +n∑
l=1
qτkl)}.
Anna Nagurney Disaster Disaster Relief Supply Chains

The Algorithm
Explicit Formulae for the Euler Method Applied to the GameTheory ModelThe following closed form expressions are for the Lagrangemultipliers associated with the lower bound demand constraints,respectively, for l = 1, . . . , n:
λ1lτ+1
= max{0, λ1lτ
+ aτ (−n∑
k=1
qτkl + d l)}.
The following closed form expressions are for the Lagrangemultipliers associated with the upper bound demand constraints,respectively, for l = 1, . . . , n:
λ2lτ+1
= max{0, λ2lτ
+ aτ (−dl +m∑
k=1
qτkl)}.
Anna Nagurney Disaster Disaster Relief Supply Chains

Hurricane Katrina Case Study
Making landfall in August of 2005, Katrina caused extensivedamages to property and infrastructure, left 450,000 peoplehomeless, and took 1,833 lives in Florida, Texas, Mississippi,Alabama, and Louisiana (Louisiana Geographic Information Center(2005)).
Given the hurricane’s trajectory, most of the damage wasconcentrated in Louisiana and Mississippi. In fact, 63% of allinsurance claims were in Louisiana, a trend that is also reflected inFEMA’s post-hurricane damage assessment of the region (FEMA(2006)).
Anna Nagurney Disaster Disaster Relief Supply Chains

Hurricane Katrina Case Study
The total damage estimates range from $105 billion (LouisianaGeographic Information Center (2005)) to $150 billion (White(2015)), making Hurricane Katrina not only a far-reaching andcostly disaster, but also a very challenging environment forproviding humanitarian assistance.
We now present a case study on Hurricane Katrina using availabledata.
The Pj functions were as follows:
Pj(q) = kj
√√√√ m∑i=1
qij .
The weights were:ω1 = ω2 = ω3 = 1,
with γij = 950 for i = 1, 2, 3 and j = 1, . . . , 10.
Anna Nagurney Disaster Disaster Relief Supply Chains

Hurricane Katrina Case Study
� ��
� ��
1
1
� ��
� ��
i
NGOs
2
2
Financial Flows
Demand Points
· · ·
� ��
� ��
Relief Item Flows
3
10?
JJ
JJ
JJ
JJ
JJ
HHHHHHHH
HHHHHHHHHH
HHj?
�
ZZ
ZZ
ZZ
ZZ
ZZ
ZZ
ZZ~?
��
��
��
��
��
��
��=
��������
����������
���
� II
� ��D
Supersink Node
JJ
JJJ
HHHH
HHHH
HHj
����
����
���
Figure 11: Hurricane Katrina Relief Network StructureAnna Nagurney Disaster Disaster Relief Supply Chains

Hurricane Katrina Case Study
Hurricane Katrina Demand Point Parameters
Parish Node j kj d j dj pj (in %)
St. Charles 1 8 16.45 50.57 2.4Terrebonne 2 16 752.26 883.82 6.7Assumption 3 7 106.36 139.24 1.9Jefferson 4 29 742.86 1,254.89 19.5Lafourche 5 6 525.53 653.82 1.7Orleans 6 42 1,303.99 1,906.80 55.9Plaquemines 7 30 33.28 62.57 57.5St. Barnard 8 42 133.61 212.43 78.4St. James 9 9 127.53 166.39 1.2St. John theBaptist
10 7 19.05 52.59 6.7
Table 7: Demand Point Data for the Generalized Nash EquilibriumProblem for Hurricane Katrina
Anna Nagurney Disaster Disaster Relief Supply Chains

Hurricane Katrina Case Study
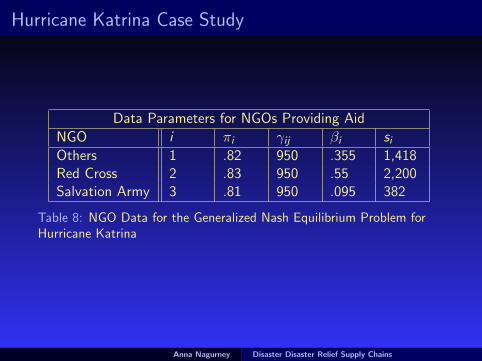
We then estimated the cost of providing aid to the Parishes as afunction of the total damage in the area and the supply chainefficiency of each NGO. We assume that these costs follow thestructures observed by Van Wassenhove (2006) and randomlygenerate a number based on his research with a mean of p = .8
and standard deviation of s =√
.8(.2)3 .
We denote the corresponding coefficients by πi . Thus, each NGO i ;i = 1, 2, 3, incurs costs according the the following functional form:
cij(qij) =(πiqij +
1
1− pj
)2.
Anna Nagurney Disaster Disaster Relief Supply Chains
Hurricane Katrina Case Study
Data Parameters for NGOs Providing Aid
NGO i πi γij βi siOthers 1 .82 950 .355 1,418Red Cross 2 .83 950 .55 2,200Salvation Army 3 .81 950 .095 382
Table 8: NGO Data for the Generalized Nash Equilibrium Problem forHurricane Katrina
Anna Nagurney Disaster Disaster Relief Supply Chains

Hurricane Katrina Case Study
Generalized Nash Equilibrium Product Flows
Demand Point Others Red Cross Salvation Army
St. Charles 17.48 28.89 4.192Terrebonne 267.023 411.67 73.57Assumption 49.02 77.26 12.97Jefferson 263.69 406.68 72.45Lafourche 186.39 287.96 51.18Orleans 463.33 713.56 127.1Plaquemines 21.89 36.54 4.23St. Barnard 72.31 115.39 16.22St. James 58.67 92.06 15.66St. John theBaptist
18.2 29.99 4.40
Table 9: Flows to Demand Points under Generalized Nash Equilibrium
Anna Nagurney Disaster Disaster Relief Supply Chains

Hurricane Katrina Case Study
The total utility obtained through the above flows for theGeneralized Nash Equilibrium for Hurricane Katrina is 9, 257, 899,with the Red Cross capturing 3,022,705, the Salvation Army3,600,442.54, and Others 2,590,973. It is interesting to see that,despite having the lowest available supplies, the Salvation Army isable to capture the largest part of the total utility. This is due tothe fact that the costs of providing aid grow at a nonlinear rate, soeven if the Salvation Army was less efficient and used all of itsavailable supplies, it will not be capable of providing the mostexpensive supplies.
In addition, we have that the Red Cross, the Salvation Army, andOthers receive 2,200.24, 1418.01, and 382.31 million in donations,respectively. Also, notice how the flows meet at least the lowerbound, even if doing so is very expensive due to the damages tothe infrastructure in the region.
Anna Nagurney Disaster Disaster Relief Supply Chains

Hurricane Katrina Case Study
Furthermore, the above flow pattern behaves in a way that, afterthe minimum requirements are met, any additional supplies areallocated in the most efficient way. For example, only theminimum requirements are met in New Orleans Parish, while theupper bound is met for St. James Parish.
Anna Nagurney Disaster Disaster Relief Supply Chains

The Nash Equilibrium Solution
If we remove the shared constraints, we obtain a Nash Equilibriumsolution, and we can compare the outcomes of the humanitarianrelief efforts for Hurricane Katrina under the Generalized NashEquilibrium concept and that under the Nash Equilibrium concept.
Anna Nagurney Disaster Disaster Relief Supply Chains

The Nash Equilibrium Solution
Nash Equilibrium Product Flows
Demand Point Others Red Cross Salvation Army
St. Charles 142.51 220.66 38.97Terrebonne 142.50 220.68 38.93Assumption 142.51 220.66 38.98Jefferson 142.38 220.61 38.74Lafourche 142.50 220.65 38.98Orleans 141.21 219.59 37.498Plaquemines 141.032 219.28 37.37St. Barnard 138.34 216.66 34.59St. James 142.51 220.65 38.58St. John theBaptist
145.51 220.66 38.98
Table 10: Flows to Demand Points under Nash Equilibrium
Anna Nagurney Disaster Disaster Relief Supply Chains

The Nash Equilibrium Solution
Under the Nash Equilibrium, the NGOs obtain a higher utility thanunder the Generalized Nash Equilibrium. Specifically, of the totalutility 10, 346, 005.44, 2,804,650 units are received by the RedCross, 5,198,685 by the Salvation Army, and 3,218,505 arecaptured by all other NGOs.
Under this product flow pattern, there are total donations of3,760.73, of which 2,068.4 are donated to the Red Cross, 357.27to the Salvation Army, and 1,355 to the other players.
Anna Nagurney Disaster Disaster Relief Supply Chains

The Nash Equilibrium Solution
It is clear that there is a large contrast between the flow patternsunder the Generalized Nash and Nash Equilibria. For example, theNash Equilibrium flow pattern results in about $500 million less indonations.
While this has strong implications about how collaboration betweenNGOs can be beneficial for their fundraising efforts, the differencesin the general flow pattern highlights a much stronger point.
Anna Nagurney Disaster Disaster Relief Supply Chains

Additional Insights
Under the Nash Equilibrium, NGOs successfully maximize theirutility. Overall, the Nash Equilibrium solution leads to an increaseof utility of roughly 21% when compared to the flow patternsunder the Generalized Nash Equilibrium. But they do so at theexpense of those in need. In the Nash Equilibrium, each NGOchooses to supply relief items such that costs can be minimized.On the surface, this might be a good thing, but recall that, giventhe nature of disasters, it is usually more expensive to provide aidto demand points with the greatest needs.
Anna Nagurney Disaster Disaster Relief Supply Chains

Additional Insights
With this in mind, one can expect oversupply to the demandpoints with lower demand levels, and undersupply to the mostaffected under a purely competitive scheme. This behavior can beseen explicitly in the results summarized in the Tables.
For example, St. Charles Parish receives roughly 795% of its upperdemand, while Orleans Parish only receives about 30.5% of itsminimum requirements. That means that much of the 21% in‘increased’ utility is in the form of waste.
In contrast, the flows under the Generalized Nash Equilibriumguarantee that minimum requirements will be met and that therewill be no waste; that is to say, as long as there is a coordinatingauthority that can enforce the upper and lower bound constraints,the humanitarian relief flow patterns under this boundedcompetition will be significantly better than under untetheredcompetition.
Anna Nagurney Disaster Disaster Relief Supply Chains
Additional Insights
In addition, we found that changes to the values in the functionalform result in changes in the product flows, but the generalbehavioral differences are robust to changes in the coefficients: βi ,γij , kj , ∀i , j , and the bounds on upper and lower demand estimates.
Anna Nagurney Disaster Disaster Relief Supply Chains

Summary and Conclusions
I In this presentation we first presented a network performance/ efficiency measure that can be used to identify importanceof various network components relevant to disasters alongwith their ranking.
I We then described a Mean-Variance disaster relief supplychain network model for risk reduction with stochastic linkcosts, uncertain demands for the relief supplies and timetargets associated with the demand points. Theoretical resultsand a case study to hurricanes hitting Mexico were given.
Anna Nagurney Disaster Disaster Relief Supply Chains

Summary and Conclusions
I We also presented a Generalized Nash Equilibrium model,with a special case being a Nash Equilibrium model, fordisaster relief with supply chain and financial fund aspects foreach NGO’s objective function. Each NGO obtains utilityfrom providing relief to demand points post a disaster andalso seeks to minimize costs but can gain in financialdonations based on the visibility of the NGOs in terms ofproduct deliveries to the demand points. A case study basedon Hurricane Katrina was discussed.
I All the models were network-based and provide new insights interms of disaster relief and management.
Anna Nagurney Disaster Disaster Relief Supply Chains

THANK YOU!
For more information, see: http://supernet.isenberg.umass.edu
Anna Nagurney Disaster Disaster Relief Supply Chains