“disability and labour market participation”
TRANSCRIPT

1
“Disability and Labour Market Participation”
Brenda Gannon•, Brian Nolan•
Working Paper No. 4
Research Programme on “Health Services, Health Inequalities and Health and
Social Gain”
This programme is supported by the Health Research Board, and is being
carried out by researchers at the Economic and Social Research Institute (ESRI),
University College Dublin and the University of Ulster.
• Economic and Social Research Institute, 4 Burlington Road, Dublin 4, Ireland. Correspondence to: Brenda Gannon, Economic and Social Research Institute, 4 Burlington Road, Dublin 4, Ireland. Email: [email protected]

2
Disability and Labour Market Participation
1. Introduction
People with disabilities face many barriers to full participation in society, not least in
the labour market. The extent and nature of participation in the labour market has a
multitude of direct and indirect effects on living standards and quality of life, and is
thus a critical area for investigation and policy concern. This paper aims to analyse the
factors associated with participation or non-participation in the labour market by
people with disabilities, using currently available data from large-scale representative
surveys.
Two sources of survey data on disability and labour force participation in Ireland are
currently available, namely the Living in Ireland Surveys carried out by the ESRI
from 1994 and a special module attached to the Quarterly National Household Survey
carried out by the Central Statistics Office in 2002. A draft study carried out for the
Equality Authority by the present authors, entitled Disability and Labour Force
Participation in Ireland (Gannon and Nolan 2003), uses these sources to provide a
descriptive account of the employment status of people reporting long-standing or
chronic illness or disability. It shows that between 11% and 16% of the working-age
population in those surveys report a longstanding/chronic illness or disability, and
about 40% of those individuals were in employment. A detailed description of the
way this varies by age, gender, education etc. is also presented. Rather than repeating
that description, this working paper concentrates on econometric analysis of these
relationships.
Internationally, the first generation of econometric studies on the effect of disability
on labour force participation emerged around the late 1970’s. To give some US
examples, Bartel and Taubmann (1979) estimated an OLS model of weekly hours
worked to analyse the effect of health on earnings and labour supply, whereas
Chirokos and Nestel, (1985) estimated a Tobit model relating annual hours worked to
inter alia health history. More recent research has emphasised the importance of the
way health and limitations are captured, with the type of health status variable used
leading to different patterns in terms of labour force participation. Wolfe and Hill
(1985), for example, measure health status using an index of limitation in daily

3
activities, Madden and Walker (1999) measure health in terms of those who report a
longstanding illness or disability, while Mete and Schultz (2002) also measure health
status using a health index. O’Donnell (1998) seeks to distinguish work capacity and
desire to work.
Issues relating to measurement error and potential endogeneity in health status
variables are also coming to the fore in recent research on this topic. Bound (1991) for
example looks at the problem of measurement error, testing several specifications of
labour force participation and health equations. Loprest, Rupp and Sandell (1995),
who use a measure of health status categorised by functional limitations, conclude that
there is a need to model reported disability and labour force participation
simultaneously. This is something we intend to pursue in future work. However, the
aim of the present paper is to produce initial estimates with Irish data of the
relationship between disability and labour force participation, which can serve as the
foundation on which to build more complex models. It is particularly valuable that we
are able to do so first in a cross-sectional context using two independent sources of
data - which allows the results to be validated - and then with a longer time frame
using panel data from the Living in Ireland surveys.
2. Data
Two main sources of data on disability and labour force participation in Ireland are
used in this paper – the Living in Ireland Survey 2000 and Quarterly National
Household Survey 2002. The Living in Ireland Survey is the Irish component of the
European Community Household Panel, conducted by the ESRI for Eurostat. The
survey commenced in 1994, and has been carried out each year up to 2001, but in this
paper we analyse the most recent data currently available, from the 2000 survey. We
wish to focus on individuals of working age, hence we exclude those aged 65 and
over in order to avoid including retirement in the non-participation category. The
youngest individuals in this sample are aged 16 and the number of males and females
are 3968 and 4088 respectively.
In the Living in Ireland survey, detailed information on current labour force status
was obtained, and for current purposes the crucial distinction this allows us to make
is between those who were at work or unemployed but seeking work – who we will

4
count as active in the labour force – and all others, whom we will count as inactive. A
measure of disability can also be constructed from the Living in Ireland survey on the
basis of individuals responding to the following question:
“Do you have any chronic physical or mental health problem, illness or disability?”
It may well be not only the presence of such an illness or disability but also the extent
to which it hampers or restricts a person may be important, so we distinguish
a) those reporting a chronic illness or disability and saying that it
hampers them severely in their daily activities
b) those who report a chronic illness or disability and say it hampers
them to some extent, and
c) those who report such a condition but say it does not hamper them
at all in their daily activities
The extent to which respondents say they are hampered relates to their daily activities
rather than work, but similar measures have been shown to have significant
discriminatory power in terms of labour force participation in research elsewhere (e.g.
Malo 2002). Furthermore, in Table 1 we see that there are different rates of
employment and inactivity for each sub-group, so it is important that we distinguish
between the different levels of disability in our analysis of labour force participation.
Table 1: Labour Force Status by level of restriction for those with Chronic Illness or Disability, age 16-64, Living in Ireland Survey 2000
Severely
Hampered
Hampered to some extent
Not hampered No chronic illness or disability
Employed 23.7 40.5 60.0 69.9 Unemployed 1.0 4.0 6.5 5.1 Inactive 75.3 55.5 33.6 25.0 N 153 548 294 5627
Our other data source is a special module on disability included with the Quarterly
National Household Survey1 in the second quarter of 2002, which focused on the
1 The Quarterly National Household Survey conducted by the CSO replaced the Labour Force Survey from 1997. The main questionnaire gathers personal data and the employment circumstances of each individual in the household for all usual residents aged 15 or over.

5
extent and nature of restriction of activities for people with disabilities and their
labour force status. The data provides a detailed description of any long-standing
health condition, and length and cause of the condition/disability. The sample is also
based on working age 15 to 64. The number of males and females used in this analysis
are 35,116 and 35,495 respectively.
In classifying individuals by labour market status the QNHS adopts various
approaches, but here we once again distinguish those in employment or unemployed
(available for and actively seeking work) versus those who are inactive. In the QNHS
survey, illness and disability is identified from a question framed as follows:
‘Do you have any longstanding health problem or disability?’,
and follow-up questions allow us to distinguish
a) those reporting a longstanding illness or disability that restricts them
severely in the kind of work they can or could do
b) those reporting such an illness or disability that restricts them to some
extent in the kind of work they can or could do, and
c) those reporting a longstanding illness or disability but saying it does not
restrict them in the kind of work they can do
Using these two substantial sources of data on disability and labour force participation
we first look at the overall effects of disability on employment status in a cross-
sectional context, applying the appropriate econometric methodology discussed in the
next section.
3. Methodology for Cross-sectional Analysis
Our dependent variable LFP, is a dichotomous variable distinguishing those in or
actively seeking work from the inactive. We use a maximum likelihood probit model
to estimate the following equation to predict the probability of participating in the
labour force:
iII uXY += β* , where Yi=1 if 0* >iY
0 otherwise.

6
Y* is the underlying latent variable that indexes the measure of labour force
participation, ui is the stochastic error term, normally distributed, IIX is a column
vector of explanatory variables, and β is a column vector of parameters to be
estimated. The estimated co-efficients provide an indication of the direction of effect
of an explanatory variable on this probability.
In order to determine the probabilities in percentage points we present also the partial
effects. Firstly, we determine the probability of labour force participation as
∫∞−
==x
i
i
dzzXLFPPβ
φ )()|1( ,
where z is the probability density function of a standard normal variable and φ is the
cumulative normal distribution. All of our explanatory variables are dichotomous
dummy variables so we then calculate the average effect of Xi on the probability of
labour force participation as
kiI
I
XdXLFPP ββφ )(
)1(=
=∂
These effects may be interpreted as the change in probability of labour force
participation resulting from a change in one category of a variable to another, and we
calculate average effects for discrete variable X as
)0|1(()1|1( ==−== iiii xyPxyP .
So far we are assuming that each of the explanatory variables have constant
differential effects, e.g. we are assuming that if there is a lower probability of labour
force participation for severely disabled, then this is so whether they are young or old.
However, it may be the case that for example individuals aged 45-54 who are severely
disabled may show a lower probability of labour force participation. In other words,
there may be interactions between the two variables severely disabled and age 45-54.
In this case, their effect on our outcome variable, LFP, may not be simply additive,
but multiplicative. For this reason, we test several specifications of our models with
interactions effects. For example, if we model labour force participation as
)*,( 21,2 XXXXfY = the equation changes to

7
iI uXXXXY +++= 3'2
'2
'21
'1
* βββ , where Yi=1 if 0* >iY
0 otherwise.
In this model, X2 affects the impact of X1 and the (average) effects are calculated at
each value of X1;
)()()1(
213212
XXXXYP
∆+∆=∂
=∂ ββ
We test several specifications of our models with interactions effects.
Because the patterns of labour force participation for men and women may be rather
different, we estimate separate equations for each. Firstly we estimate the effect of
disability on labour force participation focusing purely on the categories, (1)
Ill/Disabled with severe limitation (2) Ill/Disabled with some limitation and (3)
Ill/Disabled with no limitation. These effects may be influenced by the age, marital
status and educational qualifications of an individual, and these variables are added as
a second set of explanatory of variables in the second regression. Finally, the age of
children may have an important influence on the labour force participation decision
for women. These variables are included as a final set of explanatory variables in the
third regression. For ease of comparison of the estimates between men and women,
the child variables are included for men also. We then include interaction terms based
on education, age and young children .

8
4. Empirical Results for Probit Model of Labour Force Participation with
Living in Ireland Survey Data
We now estimate the probit model with Living in Ireland survey data for 2000. We
look first at results for men, then for women, and then explore possible interaction
effects.
A/ Results for Men
The key features of the results in relation to illness/disability for men are summarised
in Table 2, with the full set of estimation results presented in the Appendix Table 1.
Before discussing the co-efficients it is interesting to look at the overall explanatory
power of the model and see how it changes as we add in further explanatory variables.
Initially the value of the R2 is only 0.11, meaning that the illness/disability variables
explain only 11% of the variation in labour force participation for men aged 16-64 in
2000. When we add age, marital status and education, this increases to 0.247. The
additional variable relating to children increases the value marginally up to 0.251.
Table 2 shows that when only the three variables capturing chronic illness or
disability are included as explanatory factors, men with a chronic illness or disability
which hampers them severely in their daily activities have on average a 58% lower
probability of being in the labour force than men without a chronic illness or
disability. Men with a chronic illness which hampers them in their daily activities “to
some extent” also have a substantially reduced probability of being in the labour
force, though the reduction - about 40% - is a good deal less than for those who are
severely hampered. Finally, men with a chronic illness that does not hamper them in
their daily activities have a probability of being in the labour force which is only 1%
lower than those without a chronic illness or disability but this is not statistically
significant.
These figures take no account of the fact that those reporting a chronic condition may
also be different from the rest of the sample in other ways that could influence their
labour force participation. They could for example be older or less well educated on
average, and that could help to explain their lower levels of labour force participation.
So the second column of Table 2 shows the key estimation results when the full set of

9
explanatory variables is included in the estimated model, in effect controlling for
differences in age, education etc. between those with and without such a condition.
The effect on labour force participation increases marginally for the severely disabled
but falls for those who are ill/disabled with some limitation. The effect for ill/disabled
with no limitation remains insignificant.
So the presence of a severely hampering chronic condition reduces the probability of
labour force participation by 61% compared to someone with no disability: that effect
is attributable not to the age or education profile of those with such a hampering
condition, but to the condition itself. On the other hand the reduction in the
probability of labour force participation associated with being hampered to some
extent by a chronic condition is now 27%, compared with over 40% before the control
variables were introduced. This is still a substantial reduction, but the gap between
those hampered severely versus to some extent is now a good deal wider. The final
row of Table 2 shows us that men with a non-hampering illness or disability have a
labour force participation rate that is indistinguishable from men of a similar age and
educational background without a chronic illness or disability.
Table 2: Key Results from Probit Model of Labour Force Participation, Men, Living in Ireland Survey 2000 Marginal Effect
with No Controls
Marginal Effect Controlling for Age, Education, Family Status
Chronic illness or disability severely hampering daily activities
-0.58
-0.61
Chronic illness or disability hampering to some extent
-0.36
-0.29
Chronic illness or disability not hampering
-0.01
(not significant)
-0.01
(not significant)
In terms of the other explanatory variables, the full results in Appendix Table 1 show
that labour force participation increases with age up to 34 and continues to do so for
older age groups but at a decreasing rate, compared to those aged 55-64. Married men
are 7% more likely to participate than single men (including widowed and separated).

10
Higher educated men have a greater probability of participating in the labour market,
compared to those with no qualifications. The probability of participation increases
slightly with men who have children aged between 12 and 18.
B/ Results for Women
The overall pattern of the results for women in the Living in Ireland survey is rather
similar to that seen for men, as summarised in Table 3 (with Appendix Table 2
presenting the full results). At a first glance, disability has a greater negative on the
labour force participation probability of men compared to women. On average women
with a chronic illness or disability which hampers them severely in their daily
activities have a probability of being active in the labour force that is 51% lower than
women with no chronic illness or disability. Even when we control for age, education
etc. that reduction is even slightly higher, at 53%. So, although the reduction for
women is less than for men with a severely hampering condition, it is substantial.
Women with a condition which is hampering “to some extent” have a 22% reduction
in their probability of participation, having controlled for other factors. This is again
lower than the effect for men in the same illness/disability situation, and as for men
the inclusion of the controls makes more difference than it did for the severely
hampered. Women with a chronic illness or disability that does not hamper them face
the same probability of being in the labour force as women with no such condition,
when we take their age, education etc. into account.
Table 3: Key Results from Probit Model of Labour Force Participation, Women, Living in Ireland Survey 2000
Marginal Effect
with No Controls
Marginal Effect Controlling for Age, Education, Family Status
Chronic illness or disability severely hampering daily activities
-0.51
-0.52
Chronic illness or disability hampering to some extent
-0.26
-0.22
Chronic illness or disability not hampering
-0.01
-0.06
(not significant)

11
As far as other variables are concerned, similar to the results for men the effects of
age on labour force participation are positive for all age groups, but at a lower rate for
those aged over 35. Younger women have a much higher probability of working,
whereas the probability for men was more evenly distributed across all age groups.
Married women are less likely to participate compared to married men being more
likely to participate. The marginal effects of education appear much higher for
women, and the potential interaction with disability is explored below. As expected
the presence of young children decreases the probability of participation, and this
effect is reduced and insignificant as the youngest child is older.
C/ Testing for Interactions The models presented so far have implicitly assumed that the effect of disability on
labour force participation is constant across for example different age groups or
education levels. However, the impact of disability may in fact be more or less
pronounced depending on the age or education level of the individual affected, and
this could be important in understanding these effects and framing policies to reduce
them. Such inter-relationships can be captured by including interactions between the
explanatory variables in our estimated models, so we also test a variety of such
interactions with the Living in Ireland survey data.
Appendix Table 3 shows the estimated interaction terms for education and
illness/disability, for both men and women. There are very few individuals in the
survey with third level education and a severe limitation, and few women with
secondary education and a severe limitation, so these categories have been excluded.
For men, it turns out that having secondary rather than primary education is
significant, increasing the probability of labour force participation at a given level of
illness/disability. Thus among those reporting a severely limiting illness/disability the
participation probability is 8% higher for those with secondary education, and among
those reporting an illness/disability with some limitation it is 7% higher, than for the
omitted reference category without secondary education. As far as third level
education is concerned, only one of the interaction terms is significant for men. For
women, none of these interaction terms is significant.
12
One might expect that the effects of disability on labour force participation would
vary with age so another interesting interaction is disabled/limitation with age group.
Once again we find that for women there are no significant age interaction effects. For
men, there are some positive terms but the effects are not very large and do not alter
the overall pattern of the estimated effects of illness/disability.
5 Empirical Results for Probit Model of Labour Force Participation with
QNHS Data
We now describe the results obtained when a similar analysis was carried out with the
data from the QNHS special module. The set of variables used to capture illness or
disability now reflect what the respondent said about its impact on their capacity to
work as opposed to their daily activities, as already described. The other explanatory
variables are similar to the previous analysis, except the age of the youngest child was
not available in this dataset.
A/ Results for Men
Once again the estimated impact of illness/disability for men are summarised in Table
4 and the full results are given in the appendix (Appendix Table 4). We see that men
with a longstanding illness or disability that restricts them severely in the amount or
kind of work they can do have on average a probability of being in the labour force
that is 62% lower than men without an illness or disability. Controlling for age,
education and marital status actually increases that impact slightly, to 66%. This is of
the same order of magnitude as the reduction seen in the Living in Ireland survey for
men severely hampered in their daily activities.
The reduction for men with a longstanding illness which limits the amount of work
they can do “to some extent” is very much less than for those who are severely
restricted. That reduction is only 16% after controlling for age, education etc., and the
inclusion of those controls once more increases rather than reduces the estimated
impact. So there is an even sharper divergence between those restricted “severely”
versus “to some extent” than we saw with the illness/disability measures in the Living
in Ireland survey.

13
Table 4: Key Results from Probit Model of Labour Force Participation, Men, Quarterly National Household Survey 2002 Marginal Effect with
No Controls
Marginal Effect Controlling for Age, Education, Family Status
Longstanding illness or disability severely limiting
-0.62
-0.66
Longstanding illness or disability limiting to some extent
-0.11
-0.12
Longstanding illness or disability not limiting
-0.00
(not significant)
-0.01
(not significant)
Finally, for men reporting a longstanding illness that does not limit the amount of
kind of work they can do, there is no significant impact on labour force participation –
with or without the inclusion of the other control variables.
As far as other variables are concerned, the full results shows that those who are aged
15-24 are less likely to participate compared to the older age group of 55-64. This
may be due to lower participation rates overall at this age or the fact that younger
people are still in education. The pattern for older age groups is the same as that
presented for the LII data. Likewise, married men are more likely to participate.
B/ Results for Women
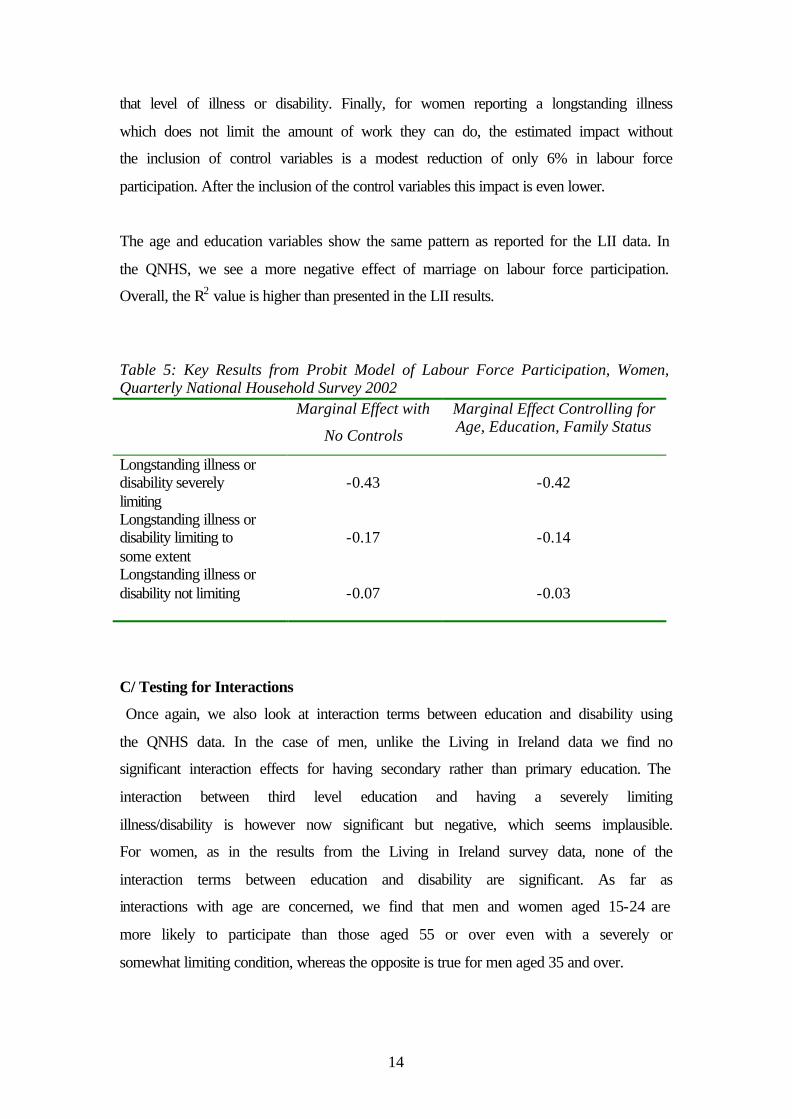
Turning to the results for women, Table 5 shows the iestimated impact of
illness/disability while the full results are once again in Appendix Table 4. Women
with a longstanding illness or disability that restricts them severely in the amount of
work they can do have a probability of being in the labour force that is 44% lower
than men without an illness or disability. Controlling for age, education and marital
status makes little difference to that effect, and it is once again of the same order of
magnitude as the reduction seen in the Living in Ireland survey for women severely
hampered in their daily activities.
Women with a longstanding illness which limits the amount of work they can do “to
some extent” have a reduction of 15% in the probability of labour force participation
after controlling for age, education etc.. This is little different to the impact for men of
14
that level of illness or disability. Finally, for women reporting a longstanding illness
which does not limit the amount of work they can do, the estimated impact without
the inclusion of control variables is a modest reduction of only 6% in labour force
participation. After the inclusion of the control variables this impact is even lower.
The age and education variables show the same pattern as reported for the LII data. In
the QNHS, we see a more negative effect of marriage on labour force participation.
Overall, the R2 value is higher than presented in the LII results.
Table 5: Key Results from Probit Model of Labour Force Participation, Women, Quarterly National Household Survey 2002
Marginal Effect with
No Controls
Marginal Effect Controlling for Age, Education, Family Status
Longstanding illness or disability severely limiting
-0.43
-0.42
Longstanding illness or disability limiting to some extent
-0.17
-0.14
Longstanding illness or disability not limiting
-0.07
-0.03
C/ Testing for Interactions
Once again, we also look at interaction terms between education and disability using
the QNHS data. In the case of men, unlike the Living in Ireland data we find no
significant interaction effects for having secondary rather than primary education. The
interaction between third level education and having a severely limiting
illness/disability is however now significant but negative, which seems implausible.
For women, as in the results from the Living in Ireland survey data, none of the
interaction terms between education and disability are significant. As far as
interactions with age are concerned, we find that men and women aged 15-24 are
more likely to participate than those aged 55 or over even with a severely or
somewhat limiting condition, whereas the opposite is true for men aged 35 and over.
15
6. Empirical Results for Panel Models with Living in Ireland Survey Data
Up to this point, we have concentrated on cross-sectional analysis making use of the
snap-shot picture provided by the 2000 Living in Ireland survey and the 2002 QNHS
special module. However, the Living in Ireland survey also offers the possibility of
analysing the relationship between disability and labour force participation over a
significant period rather than just at a point in time. This is because it is a panel
survey, seeking to follow the same individuals from one year to the next. We now
utilise panel data from that survey for each of the years from 1995-2000. We exclude
1994 because the questions regarding health problems and limitations differed from
1995 and subsequent years). We do not attempt at this point to model transitions in
and out of the labour force, some of which may be related to transitions in and out of
illness/disability. Instead, we make use of the much longer time window available
from the panel to look at the relationship between having been in employment at any
point during the period and having reported a chronic illness or disability. The
detailed specification of the model to be estimated we outline in the next section,
followed by the results.
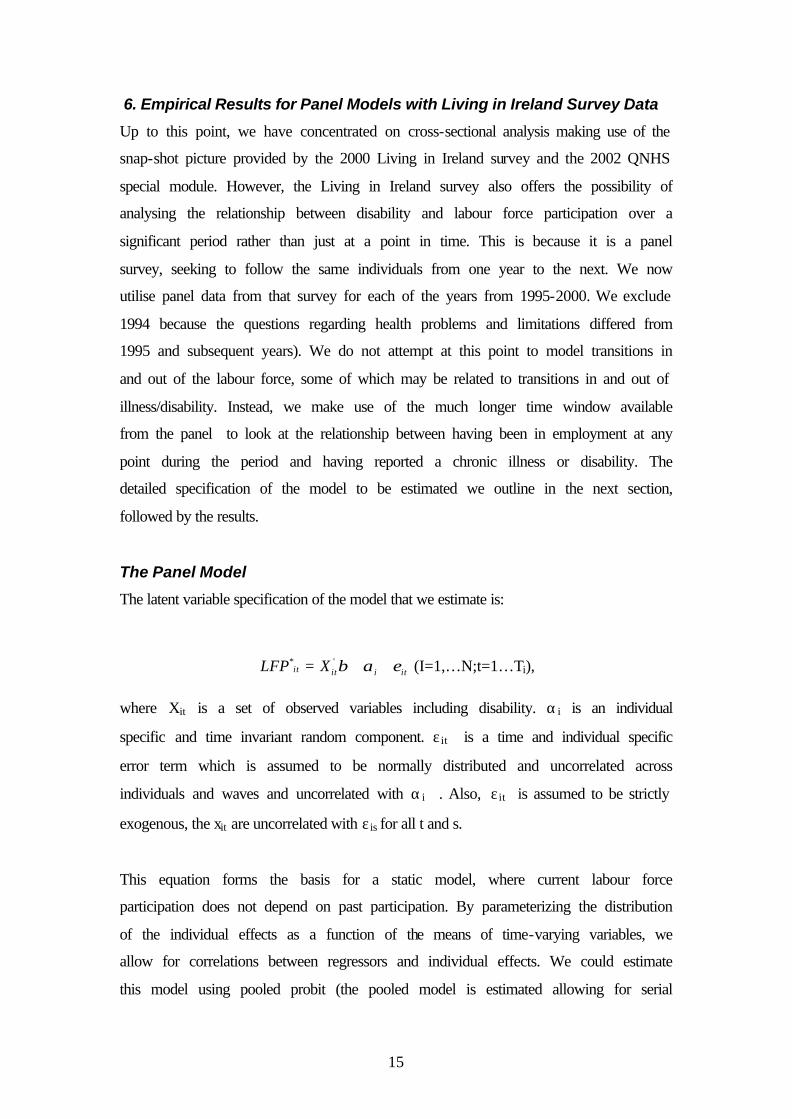
The Panel Model
The latent variable specification of the model that we estimate is:
itiitit XLFP εαβ ++= '* (I=1,…N;t=1…Ti), where Xit is a set of observed variables including disability. αi is an individual
specific and time invariant random component. ε it is a time and individual specific
error term which is assumed to be normally distributed and uncorrelated across
individuals and waves and uncorrelated with αi . Also, ε it is assumed to be strictly
exogenous, the xit are uncorrelated with ε is for all t and s.
This equation forms the basis for a static model, where current labour force
participation does not depend on past participation. By parameterizing the distribution
of the individual effects as a function of the means of time-varying variables, we
allow for correlations between regressors and individual effects. We could estimate
this model using pooled probit (the pooled model is estimated allowing for serial

16
correlation in the errors, by using a robust estimator of the covariance matrix) and
random effects probit estimators but there may be state dependence over time, so we
look at dynamic models:
itiititit hXLFP εαγβ +++= −1''* , (i=1,…N;t=1…Ti),
Following Woodridge (2000), we model the distribution of the unobserved effect
conditional on the initial value and any exogenous variables
iiii uxh +++= '20
'10 αααα
Substituting the above equation for αI, gives a model with a random effects structure,
where the regressors now also include initial labour force participation and means of
time varying regressors.
For this specification, we include unobserved heterogeneity by including Gaussian
random effects, and estimate the model by maximum likelihood using Gauss-Hermite
quadrature with 12 evaluation points (default in Stata). We then test the consistency of
our co-efficients by estimating the likelihood using 8 and 16 evaluation points.
Finally, to test the extent to which unobserved heterogeneity contributes to the error
variance in the LFP equation, we measure the intra-class correlation co-efficient
(ICC) as 2)
2 1/( uu σσ + .
The Panel Results
We firstly estimate pooled probit models over the panel from 1995 to 2000. Pooling
all available data for these years, and estimating a standard probit model, while
allowing for serial correlation between the individual error terms over time, we obtain
estimates from the pooled balanced sample. The results in Table 6 show that the
estimated effects on labour force participation of illness/disability which limits daily
activities are quite similar to those presented earlier for the year 2000 only. However,
for men we now also see illness/disability which is not associated with limitation in
daily activities having a significant albeit small effect on labour force participation.
Over the years 1995 to 2000, men reporting such an illness/disability are significantly

17
different to those with no disability at all, with an 8% less probability of labour force
participation.
Table 6: Panel Models of Labour Force Participation, Living in Ireland 1995-2000 Pooled Model, Balanced Sample
Marginal Effects Men Women
Ill/Disabled with severe limitation -0.5821
(0.0503) -0.3854 (0.0456)
Ill/Disabled with some limitation -0.2830 (0.0309)
-0.1760 (0.0310)
Ill/Disabled with no limitation -0.0807 (0.0267)
-0.0208 (0.0411)
The results of the pooled probit for women show that there is greater likelihood of
participation for those with a severe disability when we look at data for 6 years rather
than just one. Disability and some limitation or no limitation have much the same
effect as we saw earlier in the cross sectional analysis. Women with no limitation are
not significantly different from those with no disability.
The Living in Ireland survey, like other longitudinal surveys, suffered from
substantial attrition from one year to the next, so we also test for any implications for
our panel data models. We first examine whether disability itself is associated with a
high risk of dropping out from the panel. We look in Appendix Tables 6 and 7 at the
probability of dropout for men, based on characteristics in 1995 and then on previous
wave characteristics. Both tables show a similar effect of disability on attrition up to
1999. In 2000, there is no significant effect of disability of any type in 1995 on
attrition by the year 2000. However, when we look at the effect of previous wave
disability, we see that there is a 2% less probability of being in the sample in 2000.
This difference may occur because it is possible that some of the dropouts only started
reporting disability in 1999. In predicting the rate of attrition for women, Appendix
Tables 8 and 9 show a similar pattern of effects from 1995 and previous wave
independent variables.

18
To allow for attrition in the panel model estimates, we then adjust the model using
inverse probability weights. We construct two sets of weights, one based on 1995
independent variables and the second based on previous wave characteristics. Neither
set of weights make any significant changes to the results of our pooled panel probit.
This suggests that although attrition is substantial, the estimation results are not biased
by excess drop-out of those reporting illness/disability.
The model estimated so far does not seek to take unobserved effects into account. We
now estimate a random effects probit model, using a dynamic specification for labour
force participation (by including the lag of labour force participation as an
explanatory variable), and parameterise the unobserved heterogeneity as a function of
means of time varying variables, and the initial value of labour force participation.
In Table 7 we present the effects of disability from the random effects model. In Stata,
we cannot calculate the marginal effects so in order to compare both models we
present the co-efficients from both models below. There is a lower effect of disability
overall for men in the random effects model, while for women the results from this
model are slightly higher. This suggests that it is important to allow for correlation
between the individual effect and explanatory variables. For men, approximately 32%
and for women approximately 11% of the latent error variance is attributable to
unobserved heterogeneity, as measured by the intra class correlation co-efficient.
Table 7: Panel Models, Disability and Labour Force Participation, Living in
Ireland 1995-2000
Pooled Probit Random Effects Panel Probit Co-efficients Co-efficients
Men Women Men Women
Not disabled (reference)
Disabled with severe limitation
-1.8414 (0.1403)
-1.1415 (0.2011)
-0.8470 (0.2595)
-1.3168 (0.2774)
Disabled with some limitation
-1.1068 (0.0889)
-0.4489 (0.0825)
-0.7056 (0.1582)
-0.5146 (0.1268)
Disabled with no limitation
-0.4132 (0.1118)
-0.05217 (0.10310
-0.4713 (0.2126)
-0.2804 (0.1472)

19
Using Quadchk in Stata, we find that the co-efficients are very similar when we use 8,
12 or 16 evaluation points in maximising the likelihood. This shows that overall, the
specification in Table 7 is quite accurate in modelling labour force participation over
time.
7. Conclusions
People with disabilities face many barriers to full participation in the labour market,
with serious implications for living standards and quality of life. This paper has
analysed the factors associated with participation or non-participation in the labour
market by people reporting chronic illness or disability in two Irish large-scale
representative surveys. The results of our cross-section analysis bring out the scale of
the impact on labour force participation of having a long-standing illness which limits
the individual severely in their work or daily life. Working-age men reporting such a
condition were over 60% less likely than others to be active in the labour market,
having controlled for other characteristics such as age and education, while for
women the corresponding figure was lower but still over 40%. For those reporting a
longstanding illness which hampered or limited them to some extent though not
severely, there was also a significant though much smaller impact on the likelihood of
participating in the labour force. For those reporting a longstanding illness or
disability which did not hamper or limit them in their work or daily activities there
was no statistically significant effect on labour force participation. The paper also
presents initial results from analysis of panel data from 1995 to 2000, and further
exploiting the potential of those data is a priority for future work.

20
Table A1: Marginal Effects from Probit model of participation (working or seeking work) – Male 15-64 – Living in Ireland Survey 2000
(1) (2) (3)
Constant
Not disabled (reference) Disabled with severe limitation
-0.5795 (0.0464)
-0.6085 (0.0501)
-0.6105 (0.0501)
Disabled with some limitation
-0.3598 (0.0313)
-0.2993 (0.0327)
-0.2947 (0.0327)
Disabled with no limitation -0.0131 (0.0339)
-0.1333 (0.0302)
-0.0117 (0.0297)
Age 55-64 (reference) 15-24 -0.0067
(0.0227) -0.0148 (0.0245)
25-34 0.1202 (0.0104)
0.1141 (0.0117)
35-44 0.1139 (0.0106)
0.1053 (0.0126)
45-54 0.0945 (0.0106)
0.0865 (0.0119)
Single (reference) Married 0.0942
(0.0175) 0.0735
(0.0206) No Qualifications (reference) Secondary education 0.0810
(0.0156) 0.0817
(0.0155) Third level education 0.0915
(0.0109) 0.0915
(0.0108) Unearned Income -0.000
(0.000) -0.000 (0.000)
No children (reference) Age youngest child <4 0.0405
(0.0255) <12 0.0157
(0.0221) <18 0.0410
(0.0171) Pseudo R2 0.1073 0.2466 0.2485 N observations 3314 3314 3314

21
Table A2: Marginal Effects from Probit model of participation (working or seeking work) – Female age 15-64 – Living in Ireland Survey 2000 Marginal Effect Marginal Effect Marginal Effect
Constant
Not disabled (reference) Disabled with severe limitation
-0.5143 (0.0339)
-0.5123 (0.0406)
-0.5228 (0.0383)
Disabled with some limitation
-0.2603 (0.0296)
-0.2110 (0.0330)
-0.2163 (0.0332)
Disabled with no limitation -0.0126 (0.0405)
-0.0576 (0.0431)
-0.0667 (0.0433)
Age 55-64 (reference) 15-24 0.0761
(0.0364) 0.1302
(0.0363) 25-34 0.2925
(0.0247) 0.3651
(0.0239) 35-44 0.2585
(0.0245) 0.3270
(0.0259) 45-54 0.2375
(0.0247) 0.2631
(0.0255) Single (reference) Married -0.1428
(0.0253) -0.0854 (0.0280)
No Qualifications (reference) Secondary education 0.2185
(0.0243) 0.2239
(0.0243) Third level education 0.3888
(0.0195) 0.3889
(0.0195) Unearned Income -0.0000
(0.0000)
No children (reference) Age youngest child <4 -0.2068
(0.0346) <12 -0.1125
(0.0322) <18 -0.0389
(0.0320) Pseudo R2 0.0311 0.1390 0.1470 N observations 3363 3363 3363

22
Table A3: Average Effects from Probit model of participation (working or seeking work) – with interaction effects for education and disability, age 15-64 – Living in Ireland Survey 2000
Men Women
Constant
Not disabled (reference) Disabled with severe limitation -0.7314
(0.0596) -0.5219 (0.0384)
Disabled with some limitation -0.4071
(0.0501) -0.2597 (0.0585)
Disabled with no limitation -0.0970*
(0.0615) -0.1293
(0.0916) Age 55-64 (reference) 15-24 -0.0106
(0.0229) 0.1143
(0.0359) 25-34 0.1136
(0.0116) 0.3654
(0.0239) 35-44 0.1050
(0.0126) 0.3278
(0.0257) 45-54 0.0870
(0.0119) 0.2587
(0.0255) Single (reference) Married 0.0725
(0.0206) -0.0993 (0.0273)
Unearned Income 0.0000 (0.000)
0.0000 (0.000)
No Qualifications (reference) Secondary education 0.0453
(0.0173) 0.2052
(0.0267) Third level education 0.0801
(0.0128) 0.3838
(0.0209) No children (reference) Age youngest child <4 0.0407
(0.0252) -0.1964 (0.0344)
<12 0.0151 (0.0220)
-0.1067 (0.0321)
<18 0.0401 (0.0172)
-0.0379 (0.0320)
Disabled severe limitation/secondary education 0.0769 (0.0181)
NA
Disabled some limitation/secondary education 0.0676 (0.0157)
0.0855 (0.0703)
Disabled no limitation/secondary education 0.1007 (0.0082)
0.0965 (0.0949)
Disabled some limitation/third level education 0.0780*
(0.0224) -0.0338 (0.1139)
Disabled no limitation/third level education -0.0328 (0.0830)
-0.0781 (0.1708)
Pseudo R2 0.2579 0.1469 N observations 3314 3363

23
Table A4: Probit of labour force participation QNHS - Limited in amount or kind of work – Marginal effects Men Women
Not disabled (reference) Disabled with severe limitation
-0.6179 (0.0093)
-0.6565 (0.0106)
-0.4276 (0.0099)
-0.4165 (0.0117)
Disabled with some limitation
-0.1100 (0.0172)
-0.1227 (0.0171)
-0.1736 (0.0171)
-0.1427 (0.0186)
Disabled with no limitation
-0.0085 (0.0123)
-0.0125 (0.0119)
-0.0741 (0.0139)
-0.0342 (0.0150)
Age 55-64 (reference) 15-24 -0.1525
(0.0101) -0.0889
(0.0114) 25-34 0.1415
(0.0459) 0.2727
(0.0085) 35-44 0.1492
(0.0043) 0.2425
(0.0084) 45-54 0.1260
(0.0043) 0.2222
(0.0085) Single (reference) Married 0.0691
(0.0072) -0.1958
(0.0072) No Qualifications (reference)
Secondary education 0.0989 (0.0049)
0.1686 (0.0073)
Third level education 0.1425 (0.0044)
0.3917 (0.0065)
Pseudo R2 0.0895 0.3119 0.0237 0.1651
N observations 35115 35115 35495 35495
24
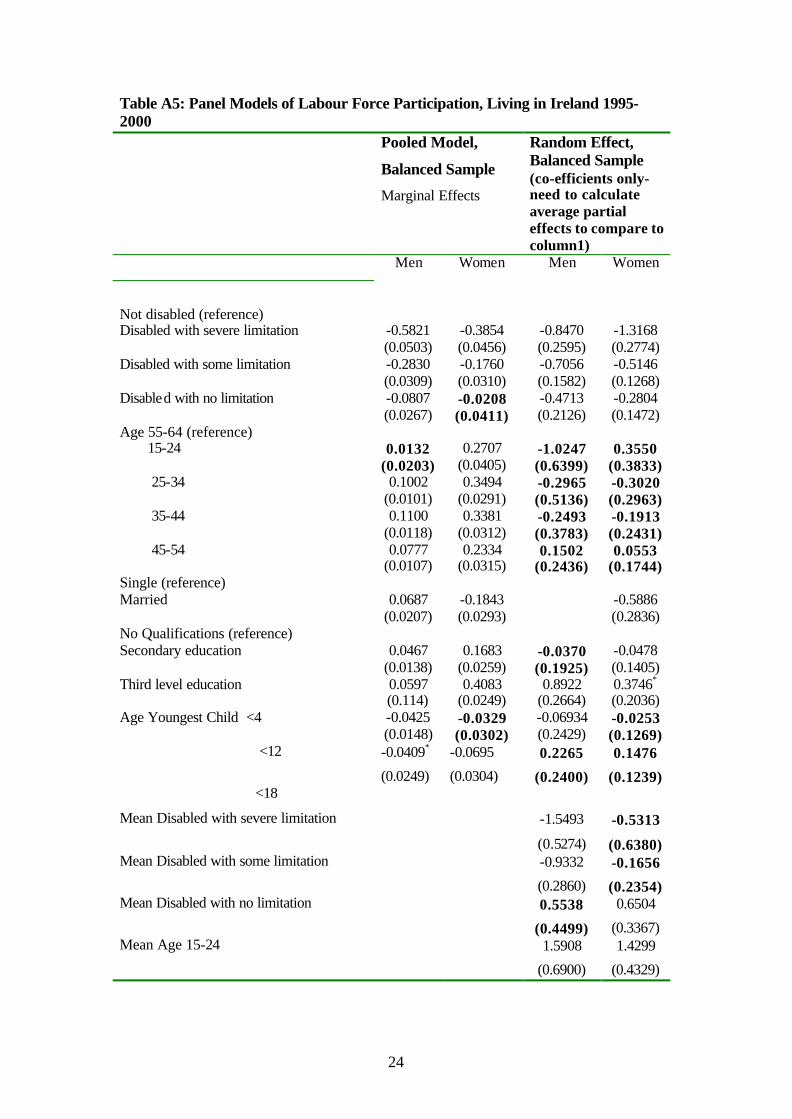
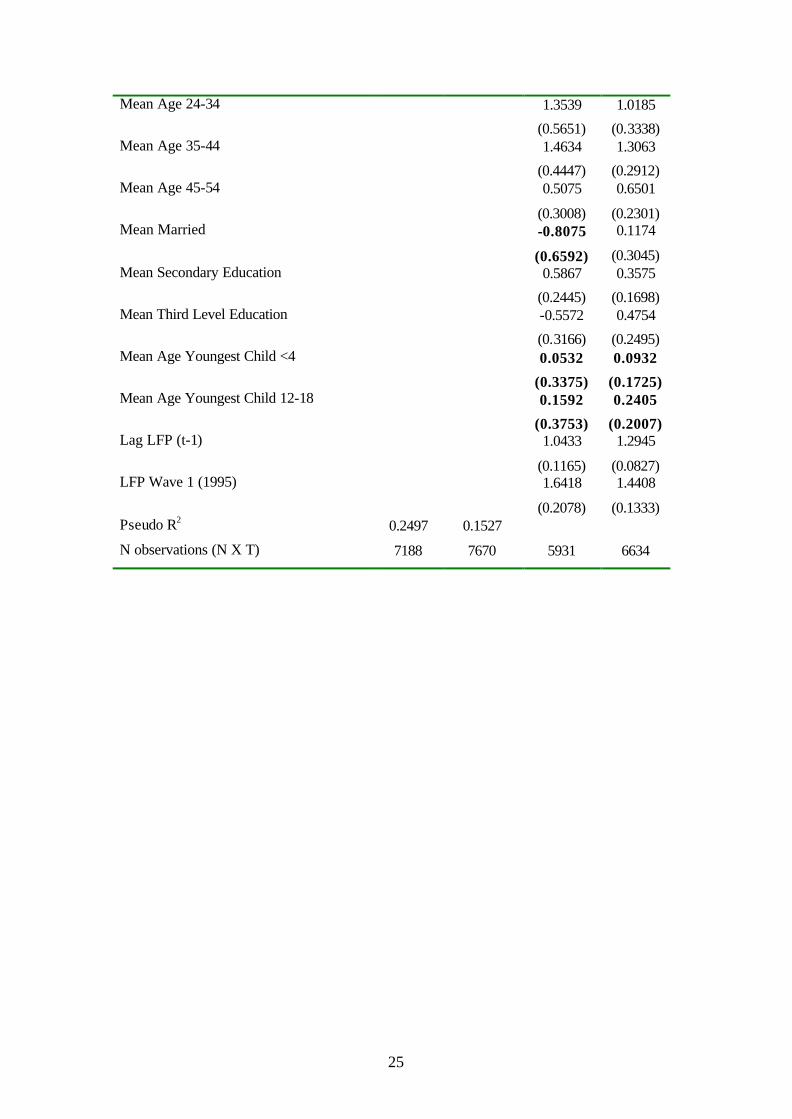
Table A5: Panel Models of Labour Force Participation, Living in Ireland 1995-2000 Pooled Model,
Balanced Sample
Marginal Effects
Random Effect, Balanced Sample (co-efficients only- need to calculate average partial effects to compare to column1)
Men Women Men Women
Not disabled (reference) Disabled with severe limitation -0.5821
(0.0503) -0.3854 (0.0456)
-0.8470 (0.2595)
-1.3168 (0.2774)
Disabled with some limitation -0.2830 (0.0309)
-0.1760 (0.0310)
-0.7056 (0.1582)
-0.5146 (0.1268)
Disabled with no limitation -0.0807 (0.0267)
-0.0208 (0.0411)
-0.4713 (0.2126)
-0.2804 (0.1472)
Age 55-64 (reference) 15-24 0.0132
(0.0203) 0.2707
(0.0405) -1.0247 (0.6399)
0.3550 (0.3833)
25-34 0.1002 (0.0101)
0.3494 (0.0291)
-0.2965 (0.5136)
-0.3020 (0.2963)
35-44 0.1100 (0.0118)
0.3381 (0.0312)
-0.2493 (0.3783)
-0.1913 (0.2431)
45-54 0.0777 (0.0107)
0.2334 (0.0315)
0.1502 (0.2436)
0.0553 (0.1744)
Single (reference) Married 0.0687
(0.0207) -0.1843 (0.0293)
-0.5886 (0.2836)
No Qualifications (reference) Secondary education 0.0467
(0.0138) 0.1683
(0.0259) -0.0370 (0.1925)
-0.0478 (0.1405)
Third level education 0.0597 (0.114)
0.4083 (0.0249)
0.8922 (0.2664)
0.3746*
(0.2036) Age Youngest Child <4 -0.0425
(0.0148) -0.0329 (0.0302)
-0.06934 (0.2429)
-0.0253 (0.1269)
<12 -0.0409*
(0.0249)
-0.0695
(0.0304)
0.2265
(0.2400)
0.1476
(0.1239) <18
Mean Disabled with severe limitation -1.5493
(0.5274)
-0.5313
(0.6380) Mean Disabled with some limitation -0.9332
(0.2860)
-0.1656
(0.2354) Mean Disabled with no limitation 0.5538
(0.4499)
0.6504
(0.3367) Mean Age 15-24 1.5908
(0.6900)
1.4299
(0.4329)
25
Mean Age 24-34 1.3539
(0.5651)
1.0185
(0.3338) Mean Age 35-44 1.4634
(0.4447)
1.3063
(0.2912) Mean Age 45-54 0.5075
(0.3008)
0.6501
(0.2301) Mean Married -0.8075
(0.6592)
0.1174
(0.3045) Mean Secondary Education 0.5867
(0.2445)
0.3575
(0.1698) Mean Third Level Education -0.5572
(0.3166)
0.4754
(0.2495) Mean Age Youngest Child <4 0.0532
(0.3375)
0.0932
(0.1725) Mean Age Youngest Child 12-18 0.1592
(0.3753)
0.2405
(0.2007) Lag LFP (t-1) 1.0433
(0.1165)
1.2945
(0.0827) LFP Wave 1 (1995) 1.6418
(0.2078)
1.4408
(0.1333) Pseudo R2 0.2497 0.1527
N observations (N X T) 7188 7670 5931 6634

26
Table A6: Probit model for response/non response by wave Men, based on 1995 independent variables and individuals who joined sample in 1994 Wave 2
(1996) Wave 3 (1997)
Wave 4 (1998)
Wave5 (1999)
Wave 6 (2000)
Not disabled (reference)
Disabled with severe limitation
-0.0648 - 0.0048 -0.0046 -0.0043
Disabled with some limitation -0.0021 0.0065 0.0078 -0.0133 -0.0046 Disabled with no limitation
-0.0328 0.0068 -0.0192 -0.0079 -0.0075
Age 55-64 (reference) 15-24
-0.0206 -0.0345 -0.0434 -0.0039 0.0111*
25-34
-0.0140 -0.0385 -0.0717 0.0019 0.0047
35-44
-0.0047 0.0131 -0.0000 0.0010 0.0025
45-54
0.0096 0.0046 0.0097 0.0041 0.0054
Single (reference) Married
0.0164 0.0292 0.0495 0.0022 0.0109*
No Qualifications (reference) Secondary education
-0.0030 -0.0224 0.0038 0.0063 -0.0019
Third level education
-0.0001 -0.0320 0.0090 0.0034 0.0034
0.0001 Pseudo R2
0.0439 0.1103 0.1513 0.0852 0.0335
N observations 3199 2709 2484 2087 1657

27
Table A7: Probit model for response/non response by wave Men, based on previous wave independent variables and individuals who joined sample in 1994 Wave 2
(1996) Wave 3 (1997)
Wave 4 (1998)
Wave5 (1999)
Wave 6 (2000)
Not disabled (reference)
Disabled with severe limitation
-0.0648 0.0056 -0.0142 -0.0083 -0.0250*
Disabled with some limitation -0.0021 0.0014 -0.0029 -0.0138* -0.0144*
Disabled with no limitation
-0.0328 -0.0224* - -0.0014 -0.0030
Age 55-64 (reference) 15-24
-0.0206 -0.0131 -0.0174* -0.0053 0.0004
25-34
-0.0140 -0.0149 -0.0339 0.0051 0.0058
35-44
-0.0047 0.0014 0.0008 - 0.0004
45-54
0.0096 0.0061 0.1041 0.0016 -0.0026
Single (reference) Married
0.0164 0.0157 0.0203 0.0058 0.0039
No Qualifications (reference) Secondary education
-0.0030 -0.0191 0.0121 0.0069 0.0040
Third level education
-0.0001 -0.0325 0.0171 0.0014 0.0002
Pseudo R2
0.0439 0.1000 0.1087 0.0447 0.0436
N observations 3199 2854 2470 1809 1913

28
Table A8: Probit model for response/non response by wave Women, based on 1995 independent variables and individuals who joined sample in 1994 Wave 2
(1996) Wave 3 (1997)
Wave 4 (1998)
Wave5 (1999)
Wave 6 (2000)
Not disabled (reference)
Disabled with severe limitation
-0.5400 (0.2582)
0.5074 (0.2454)
0.0501 (0.3473)
- -0.8408 (0.3782)
Disabled with some limitation -0.3036 (0.1488)
-0.1097 (0.1462)
-0.1593 (0.1392)
-0.1510 (0.2242)
-0.5514 (0.2167)
Disabled with no limitation
-0.4586 (0.2377)
0.1179 (0.3004)
0.2998 (0.3215)
-0.0748 (0.4024)
-0.2939 (0.4284)
Age 55-64 (reference) 15-24
-0.4058 (0.1677)
-0.6980 (0.1549)
-0.9115 (0.1550)
-0.2817 (0.2717)
0.1168 (0.3551)
25-34
-0.4472 (0.1563)
-0.6098 (0.1461)
-0.6501 (0.1466)
0.0912 (0.2680)
0.2488 (0.3257)
35-44
0.3665 (0.2361)
0.0451 (0.1807)
0.1558 (0.1975)
0.2889 (0.2882)
0.1490 (0.2773)
45-54
-0.0088 (0.1839)
0.0186 (0.1809)
-0.2015 (0.1634)
0.0404 (0.2391)
0.2592 (0.2959)
Single (reference) Married
0.4491 (0.1189)
0.4520 (0.1072)
0.5265 (0.1072)
-0.0061 (0.1977)
0.1096 (0.2101)
No Qualifications (reference) Secondary education
-0.0793 (0.1370)
-0.0175 (0.1222)
0.0847 (0.1201)
0.1576 (0.1935)
0.0835 (0.2266)
Third level education
-0.5703 (0.1618)
-0.3497 (0.1533)
-0.3505 (0.1490)
0.1579 (0.3054)
-0.1224 (0.3245)
Pseudo R2
0.1099 0.1238 0.1616 0.0213 0.0674
N observations 3339 2961 2662 2199 1810

29
Table A9: Probit model for response/non response by wave Women, based on previous wave independent variables and individuals who joined sample in 1994 Wave 2
(1996) Wave 3 (1997)
Wave 4 (1998)
Wave5 (1999)
Wave 6 (2000)
Not disabled (reference)
Disabled with severe limitation
-0.5400 (0.2582)
-0.3272 (0.2460)
-0.4019 (0.2529)
-0.1358 (0.4171)
-0.7613 (0.3179)
Disabled with some limitation -0.3037 (0.1488)
-0.0053 (0.1665)
0.4034*
(0.2328) -0.2311 (0.1952)
-0.4389 (0.2151)
Disabled with no limitation
-0.4586 (0.2377)
0.2805 (0.2917)
-0.2287 (0.2170)
-0.1802 (0.2973)
-0.0194 (0.4042)
Age 55-64 (reference) 15-24
-0.4058 (0.1677)
0.5753 (0.1689)
-0.7146 (0.1837)
-0.0794 (0.2592)
-0.0761 (0.3190)
25-34
-0.4472 (0.1563)
-0.3994 (0.1605)
-0.0665 (0.1949)
0.0366 (0.2433)
-0.0134 (0.3087)
35-44
0.364 (0.2361)
0.0453 (0.1836)
0.2746 (0.2189)
0.1526 (0.2308)
-0.0322 (0.2824)
45-54
-0.0088 (0.1839)
0.0753 (0.1837)
-0.0711 (0.1714)
0.2666 (0.2448)
-0.1083 (0.2488)
Single (reference) Married
0.4491 (0.1189)
0.2535 0.1326 (0.1318)
0.0048 (0.1759)
0.2116 (0.1955)
No Qualifications (reference) Secondary education
-0.0793 (0.1370)
0.0521 (0.1317)
0.2588*
(0.1417) 0.0190
(0.1865) 0.3095
(0.2191) Third level education
-0.5703 (0.1618)
-0.1464 (0.1704)
0.0035 (0.1891)
-0.0465 (0.2473)
0.3094 (0.2191)
Pseudo R2
0.1099 0.0709 0.0830 0.0131 0.0685
N observations 3339 3047 2778 2439 2127