direct support organizations mid year forecasts … · direct support organizations mid-year...
TRANSCRIPT
DIRECT SUPPORT ORGANIZATIONS
MID-YEAR FORECASTS
FISCAL YEAR 2016
February 25, 2016
DSO Mid-Year Forecasts for FY 2016
INDEX
USF Health Professions Conferencing Corporation .................................................. 2-4
University Medical Services Association, Inc. .......................................................... 5-7
Medical Services Support Corporation, Inc. .............................................................. 8-10
Sun Dome Inc. ............................................................................................................ 11-13
USF Alumni Association, Inc. ................................................................................... 14-16
USF Financing Corporation and USF Property Corporation ..................................... 17-19
USF Research Foundation, Inc. .................................................................................. 20-22
USF Foundation, Inc. ................................................................................................. 23-25
[ 1 ]

Describe Major Forecasted Variances from Financial Plan - Earnings and Cash Flows
The availability of pharmaceutical and device industry grant funding for continuing medical education programming has become very difficult to win given the ever increasing regulation and reporting requirements surrounding industry relationships with practitioners. As a result Continuing Professional Development forecasted revenue is revised down $2.6 million and program expenses are also proportionately reduced.
Additional programming support from UMSA will increase the CAMLS - USF Health Programming line item $1.6 million from Plan.
Projected flat year over year performance from sales, the Innovation Center and grants reduces CAMLS - Industry, Societies, Healthcare by $2.25 million. Program expenses are also proportionately reduced. However, Tampa General Hospital contractual services and international programming have had a positive year over year effect on this line item.
Equipment on loan to HPCC at no cost for use in trainings at CAMLS is no longer available and therefore In Kind Donations revenue and expenses are reduced to $0.
For consistency and comparability of presentation Wages and Benefits are presented at gross and any USF Health provided wage support is presented as revenue under CAMLS - USF Health Programming.
Describe Management's Actions to Correct Unfavorable Forecasted Variances from Financial Plan
Continued UMSA programming support in conjunction with greater utilization of CAMLS capacity will augment other revenue sources.
Leased equipment that is not generating a satisfactory return on investment will be discontinued in FY17 and the space repurposed
USF Health will more fully utilize CAMLS to optimize all programming and space opportunities at the downtown Tampa facility.
USF HEALTH PROFESSIONS CONFERENCING CORPORATIONFY 2016 Mid-Year Forecast
MID-YEAR FORECAST
[ 2 ]

(In thousands) FY 2016 FY 2016 FY 2015 FY 2014MID-YEAR FINANCIAL ACTUAL ACTUALFORECAST PLAN $ % RESULTS RESULTS
REVENUES Continuing Professional Development $4,000 $6,600 $(2,600) (39)% $7,577 $5,920
CAMLS - USF Health Programming 5,500 3,918 1,582 40 % 7,211 5,045
CAMLS - Industry, Societies, Healthcare 8,500 10,750 (2,250) (21)% 6,755 7,059
Other HPCC Divisions 1,600 1,790 (190) (11)% 1,924 2,298
In Kind Donations 0 500 (500) (100)% 773 1,696
Rents, Parking, Rebates, Interest 300 300 0 0 % 471 300
Total Revenues $19,900 $23,858 $(3,958) (17)% $24,711 $22,318
EXPENSESWages and Benefits $4,600 $5,086 $(486) (10)% $4,705 $4,324
Utilities, Leases, Maint., Supplies, Marketing 4,000 4,053 (53) (1)% 3,668 3,691
Direct Program Expense 8,000 10,678 (2,678) (25)% 12,872 9,750
Interest 790 790 0 0 % 831 900
In Kind Expense 0 500 (500) (100)% 773 1,431
Depreciation-Purchased & Donated Assets 2,400 2,400 0 0 % 2,796 4,263
Total Expenses $19,790 $23,507 $(3,717) (16)% $25,645 $24,359
OPERATING PROFIT BEFORE NON-CASH CHANGES $110 $351 $(241) (69)% $(934) $(2,041)
Unrealized Investment Gains (Losses) 0 0 0 % 0 0
Change in Fair Value of Swaps 0 0 0 % 0 0
Total Non-Cash Changes $0 $0 $0 % $0 $0
NET OPERATING PROFIT $110 $351 $(241) (69)% $(934) $(2,041)
USF HEALTH PROFESSIONS CONFERENCING CORPORATIONFY 2016 Mid-Year Forecast
INCOME STATEMENT
Variance
[ 3 ]
(In thousands) FY 2016 FY 2016 FY 2015 FY 2014MID-YEAR FINANCIAL ACTUAL ACTUALFORECAST PLAN $ % RESULTS RESULTS
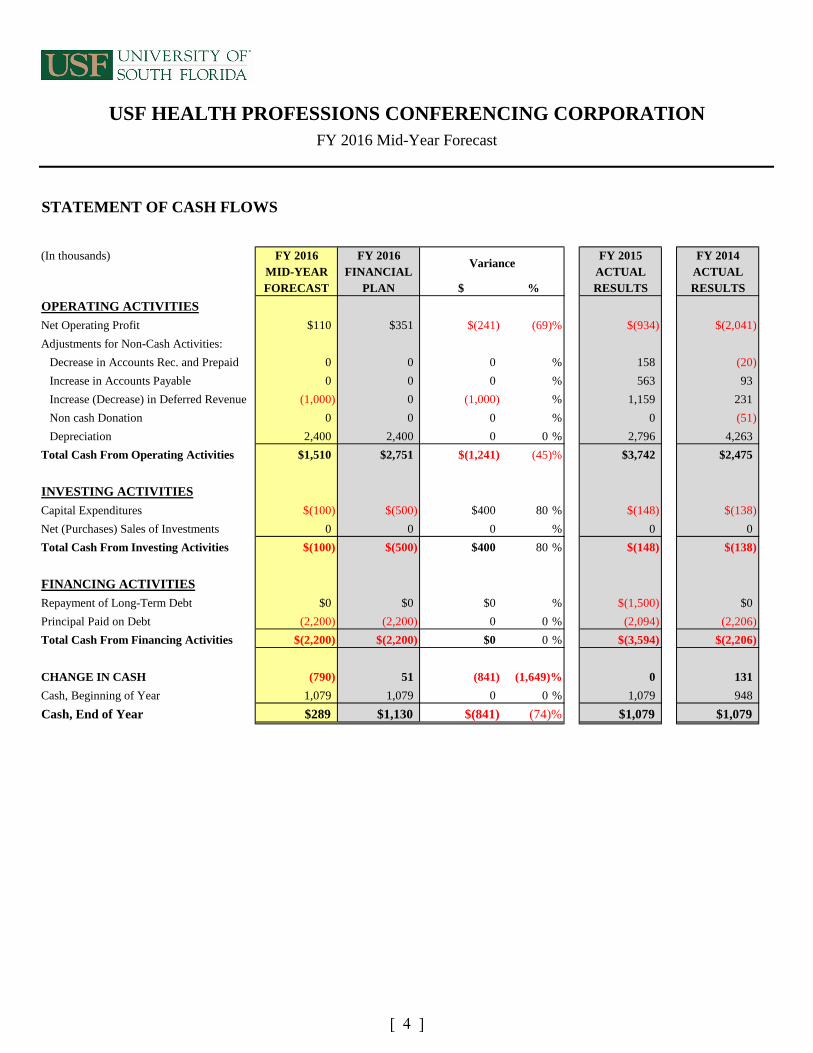
OPERATING ACTIVITIES
Net Operating Profit $110 $351 $(241) (69)% $(934) $(2,041)
Adjustments for Non-Cash Activities:
Decrease in Accounts Rec. and Prepaid 0 0 0 % 158 (20)
Increase in Accounts Payable 0 0 0 % 563 93
Increase (Decrease) in Deferred Revenue (1,000) 0 (1,000) % 1,159 231
Non cash Donation 0 0 0 % 0 (51)
Depreciation 2,400 2,400 0 0 % 2,796 4,263
Total Cash From Operating Activities $1,510 $2,751 $(1,241) (45)% $3,742 $2,475
INVESTING ACTIVITIES
Capital Expenditures $(100) $(500) $400 80 % $(148) $(138)
Net (Purchases) Sales of Investments 0 0 0 % 0 0
Total Cash From Investing Activities $(100) $(500) $400 80 % $(148) $(138)
FINANCING ACTIVITIES
Repayment of Long-Term Debt $0 $0 $0 % $(1,500) $0
Principal Paid on Debt (2,200) (2,200) 0 0 % (2,094) (2,206)
Total Cash From Financing Activities $(2,200) $(2,200) $0 0 % $(3,594) $(2,206)
CHANGE IN CASH (790) 51 (841) (1,649)% 0 131
Cash, Beginning of Year 1,079 1,079 0 0 % 1,079 948
Cash, End of Year $289 $1,130 $(841) (74)% $1,079 $1,079
USF HEALTH PROFESSIONS CONFERENCING CORPORATIONFY 2016 Mid-Year Forecast
STATEMENT OF CASH FLOWS
Variance
[ 4 ]
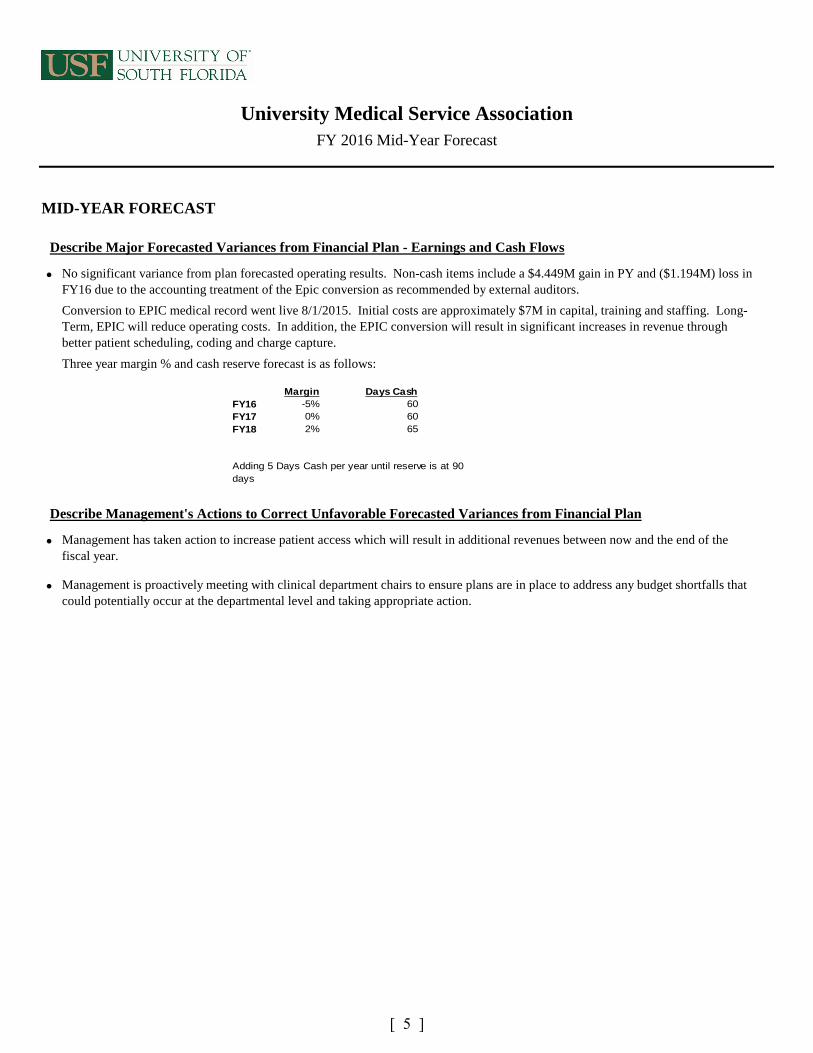
Describe Major Forecasted Variances from Financial Plan - Earnings and Cash Flows
No significant variance from plan forecasted operating results. Non-cash items include a $4.449M gain in PY and ($1.194M) loss in FY16 due to the accounting treatment of the Epic conversion as recommended by external auditors.
Conversion to EPIC medical record went live 8/1/2015. Initial costs are approximately $7M in capital, training and staffing. Long-Term, EPIC will reduce operating costs. In addition, the EPIC conversion will result in significant increases in revenue through better patient scheduling, coding and charge capture.
Three year margin % and cash reserve forecast is as follows:
Describe Management's Actions to Correct Unfavorable Forecasted Variances from Financial Plan
Management has taken action to increase patient access which will result in additional revenues between now and the end of the fiscal year.
Management is proactively meeting with clinical department chairs to ensure plans are in place to address any budget shortfalls that could potentially occur at the departmental level and taking appropriate action.
University Medical Service AssociationFY 2016 Mid-Year Forecast
MID-YEAR FORECAST
Margin Days CashFY16 -5% 60FY17 0% 60FY18 2% 65
Adding 5 Days Cash per year until reserve is at 90 days
[ 5 ]

(In thousands) FY 2016 FY 2016 FY 2015 FY 2014MID-YEAR FINANCIAL ACTUAL ACTUALFORECAST PLAN $ % RESULTS RESULTS
REVENUES Net Patient Service $152,306 $155,306 $(3,000) (2)% $141,424 $130,083
Grants, Contracts & Awards 61,200 57,711 3,489 6 % 53,399 48,350
UPL 6,497 6,583 (87) (1)% 6,396 6,096
Meaningful Use 23 0 23 % 1,107 1,008
Other Revenues 28,200 28,694 (494) (2)% 29,771 25,953
Total Revenues $248,226 $248,293 $(68) (0)% $232,097 $211,490
EXPENSESFaculty Support $122,176 $121,021 $1,154 1 % $110,544 $98,051
Housestaff Support 10,631 11,689 (1,058) (9)% 10,772 $11,543
Other Staff Support 75,224 76,345 (1,121) (1)% 64,255 57,180
Depreciation/Amortization 1,620 1,864 (244) (13)% 1,390 1,397
Other Expenses 46,883 45,620 1,263 3 % 45,528 41,827
Total Expenses $256,533 $256,539 $(6) (0)% $232,489 $209,998
OPERATING PROFIT BEFORE NON-CASH CHANGES $(8,307) $(8,245) $(62) (1)% $(392) $1,492
Unrealized Investment Gains (Losses) 0 0 0 % 169 1,485
Gain (Loss) on Sale/Transfer of Assets 0 0 0 % 0 (4,270)
Change in Fair Value of Swaps (1,194) 0 (1,194) % 4,672
Total Non-Cash Changes $(1,194) $0 $(1,194) % $4,841 $(2,785)
NET OPERATING PROFIT $(9,501) $(8,245) $(1,256) (15)% $4,449 $(1,293)
University Medical Service AssociationFY 2016 Mid-Year Forecast
INCOME STATEMENT
Variance
[ 6 ]

(In thousands) FY 2016 FY 2016 FY 2015 FY 2014MID-YEAR FINANCIAL ACTUAL ACTUALFORECAST PLAN $ % RESULTS RESULTS
OPERATING ACTIVITIES
Net Operating Profit $(8,307) $(8,245) $(62) (1)% $4,449 $(1,293)
Changes in operating assets and liabilities 4,401 3,261 1,140 35 % (5,258) $(11,074)
Adjustments for Non-Cash Activities:
Depreciation / Amortization 1,620 1,864 (244) (13)% 1,390 $1,397
Noncash contributions/costs-Epic 0 % 0 0
Unrealized Gains 0 (265) 265 100 % (169) 2,785
Total Cash From Operating Activities $(2,286) $(3,385) $1,099 32 % $412 $(8,185)
INVESTING ACTIVITIES
Capital Expenditures $(2,500) $(2,000) $(500) (25)% $(2,537) $(2,079)
Purchases (Sales) of Investments 8,800 10,000 (1,200) (12)% 2,552 (1,049)
Total Cash From Investing Activities $6,300 $8,000 $(1,700) (21)% $15 $(3,128)
FINANCING ACTIVITIES
Proceeds of Long-Term Debt $0 $0 $0 % $0 $0
Principal Paid on Debt 0 0 0 % 0 0
Total Cash From Financing Activities $0 $0 $0 % $0 $0
CHANGE IN CASH 4,014 4,615 (601) (13)% 427 (11,313)
Cash, Beginning of Year 10,615 10,615 0 0 % 21,929
Operating Cash, End of Year 14,629 15,230 (601) (4)% 10,615 10,616
Invested Cash 27,250 27,055 195 1 % 36,753 39,629
Cash, End of Year $41,879 $42,285 $(406) (1)% $47,795 $50,245
Days Cash on Hand 60
University Medical Service AssociationFY 2016 Mid-Year Forecast
STATEMENT OF CASH FLOWS
Variance
[ 7 ]

Describe Major Forecasted Variances from Financial Plan - Earnings and Cash Flows
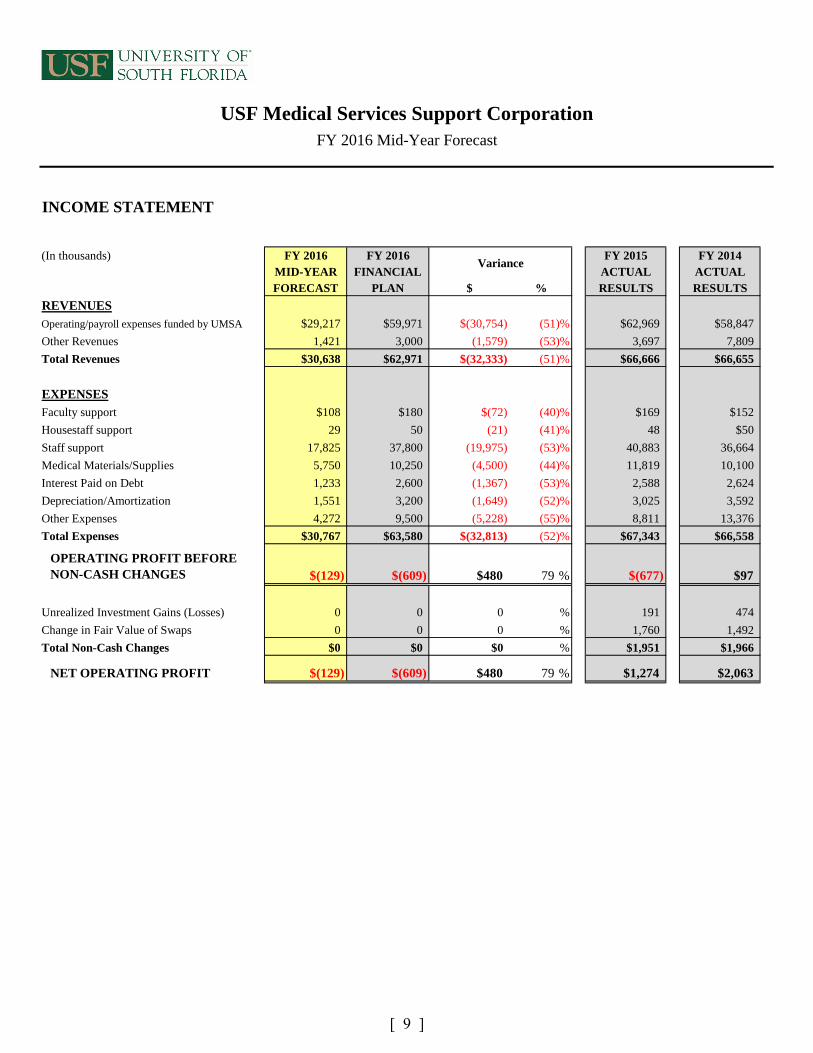
MSSC is set up as a pass-through organization with all funding coming from UMSA. Effective 1/1/16 MSSC is being consolidated with UMSA and all costs will reside on UMSA financial statements.
Describe Management's Actions to Correct Unfavorable Forecasted Variances from Financial Plan
N/A
USF Medical Services Support CorporationFY 2016 Mid-Year Forecast
MID-YEAR FORECAST
[ 8 ]
(In thousands) FY 2016 FY 2016 FY 2015 FY 2014MID-YEAR FINANCIAL ACTUAL ACTUALFORECAST PLAN $ % RESULTS RESULTS
REVENUES Operating/payroll expenses funded by UMSA $29,217 $59,971 $(30,754) (51)% $62,969 $58,847
Other Revenues 1,421 3,000 (1,579) (53)% 3,697 7,809
Total Revenues $30,638 $62,971 $(32,333) (51)% $66,666 $66,655
EXPENSESFaculty support $108 $180 $(72) (40)% $169 $152
Housestaff support 29 50 (21) (41)% 48 $50
Staff support 17,825 37,800 (19,975) (53)% 40,883 36,664
Medical Materials/Supplies 5,750 10,250 (4,500) (44)% 11,819 10,100
Interest Paid on Debt 1,233 2,600 (1,367) (53)% 2,588 2,624
Depreciation/Amortization 1,551 3,200 (1,649) (52)% 3,025 3,592
Other Expenses 4,272 9,500 (5,228) (55)% 8,811 13,376
Total Expenses $30,767 $63,580 $(32,813) (52)% $67,343 $66,558
OPERATING PROFIT BEFORE NON-CASH CHANGES $(129) $(609) $480 79 % $(677) $97
Unrealized Investment Gains (Losses) 0 0 0 % 191 474
Change in Fair Value of Swaps 0 0 0 % 1,760 1,492
Total Non-Cash Changes $0 $0 $0 % $1,951 $1,966
NET OPERATING PROFIT $(129) $(609) $480 79 % $1,274 $2,063
USF Medical Services Support CorporationFY 2016 Mid-Year Forecast
INCOME STATEMENT
Variance
[ 9 ]
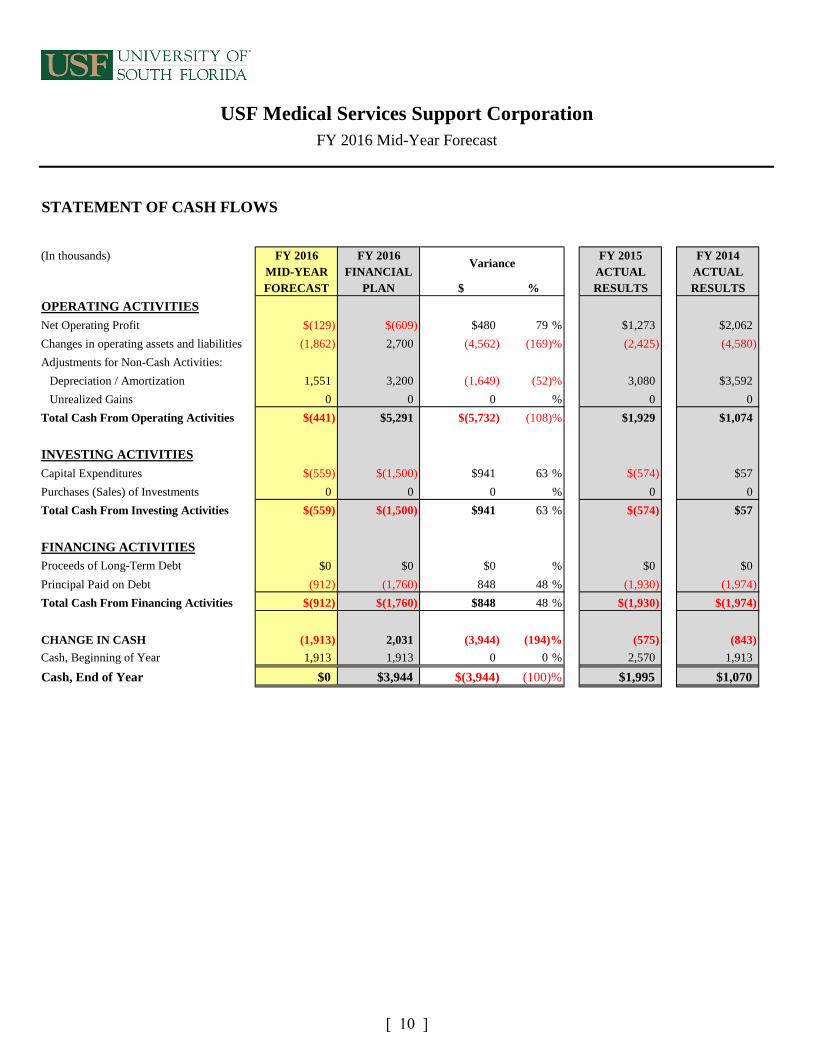
(In thousands) FY 2016 FY 2016 FY 2015 FY 2014MID-YEAR FINANCIAL ACTUAL ACTUALFORECAST PLAN $ % RESULTS RESULTS
OPERATING ACTIVITIES
Net Operating Profit $(129) $(609) $480 79 % $1,273 $2,062
Changes in operating assets and liabilities (1,862) 2,700 (4,562) (169)% (2,425) (4,580)
Adjustments for Non-Cash Activities:
Depreciation / Amortization 1,551 3,200 (1,649) (52)% 3,080 $3,592
Unrealized Gains 0 0 0 % 0 0
Total Cash From Operating Activities $(441) $5,291 $(5,732) (108)% $1,929 $1,074
INVESTING ACTIVITIES
Capital Expenditures $(559) $(1,500) $941 63 % $(574) $57
Purchases (Sales) of Investments 0 0 0 % 0 0
Total Cash From Investing Activities $(559) $(1,500) $941 63 % $(574) $57
FINANCING ACTIVITIES
Proceeds of Long-Term Debt $0 $0 $0 % $0 $0
Principal Paid on Debt (912) (1,760) 848 48 % (1,930) (1,974)
Total Cash From Financing Activities $(912) $(1,760) $848 48 % $(1,930) $(1,974)
CHANGE IN CASH (1,913) 2,031 (3,944) (194)% (575) (843)
Cash, Beginning of Year 1,913 1,913 0 0 % 2,570 1,913
Cash, End of Year $0 $3,944 $(3,944) (100)% $1,995 $1,070
USF Medical Services Support CorporationFY 2016 Mid-Year Forecast
STATEMENT OF CASH FLOWS
Variance
[ 10 ]

Describe Major Forecasted Variances from Financial Plan - Earnings and Cash Flows
Forecasted plan results for revenue on pace to exceed plan due to increased rent charges
Based on event mix, ticket sales may trend to be lower but profitability on events are positively impacted by rental fees. Ticket sales and attendance will impact ancillary revenues
Adjustments to net assets due to customer deposits and deferred revenue for future events
Describe Management's Actions to Correct Unfavorable Forecasted Variances from Financial Plan
Focused initiative to pursue other revenue opportunities through facility income and sponsorships
Continued monitoring of facility expenses to ensure Sun Dome is operating at an efficient level
Sun Dome, Inc.FY 2016 Mid-Year Forecast
MID-YEAR FORECAST
[ 11 ]

(In thousands) FY 2016 FY 2016 FY 2015 FY 2014MID-YEAR FINANCIAL ACTUAL ACTUALFORECAST PLAN $ % RESULTS RESULTS
REVENUES Rent Income $612 $503 $109 22 % $582 $202
Service Income 210 205 5 2 % 207 214
Premium Seating 74 100 (26) (26)% 76 79
Facility Fee 253 307 (54) (18)% 257 274
Sponsorship, Commissions & Royalties 596 667 (71) (11)% 586 725
Parking 390 307 83 27 % 299 276
Other Revenues 218 234 (16) (7)% 991 109
Total Revenues $2,353 $2,323 $30 1 % $2,998 $1,879
EXPENSESSalaries & Wages $666 $678 $(12) (2)% $664 $651
Payroll Taxes & Benefits 187 211 (24) (11)% 186 183
Repairs, Maintenance and Utilities 315 273 42 15 % 284 329
Operating & Administrative 320 363 (43) (12)% 338 194
Management Fees 234 161 73 45 % 293 220
Depreciation 236 236 0 0 % 237 237
Total Expenses $1,958 $1,922 $36 2 % $2,002 $1,814
OPERATING PROFIT BEFORE NON-CASH CHANGES $395 $401 $(6) (1)% $996 $65
Unrealized Investment Gains (Losses) 0 0 0 % 0 0
Change in Fair Value of Swaps 0 0 0 % 0 0
Total Non-Cash Changes $0 $0 $0 % $0 $0
NET OPERATING PROFIT $395 $401 $(6) (1)% $996 $65
Sun Dome, Inc.FY 2016 Mid-Year Forecast
INCOME STATEMENT
Variance
[ 12 ]
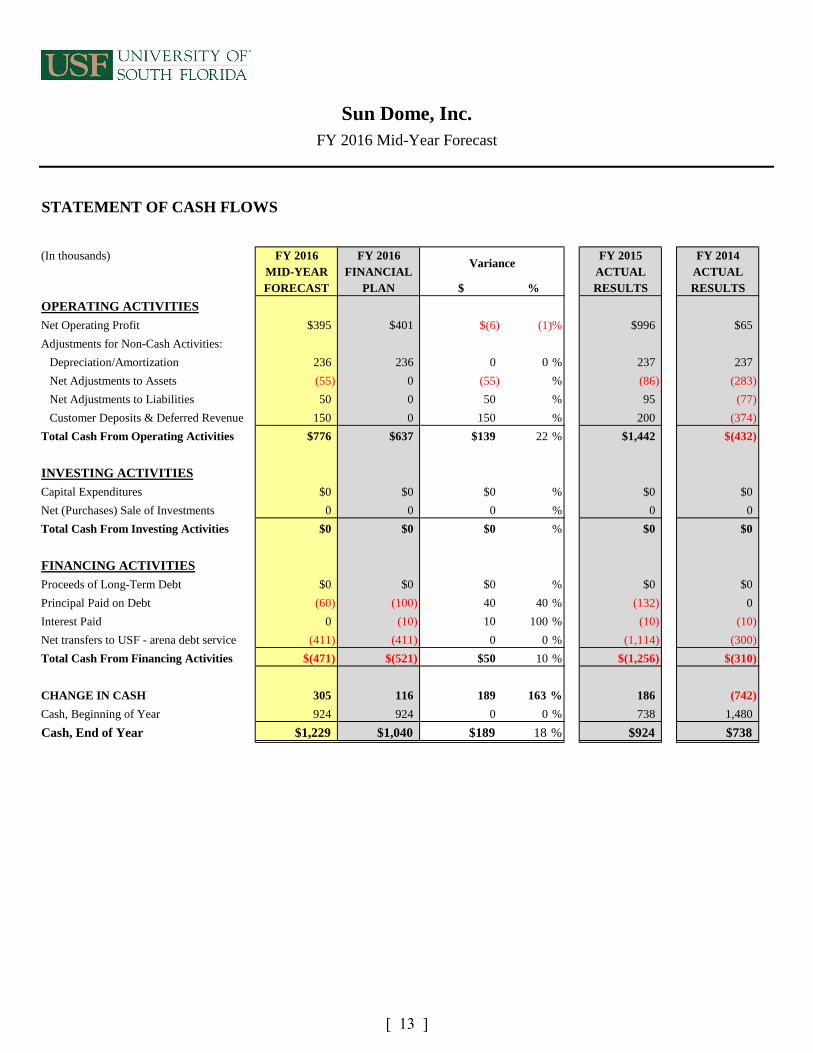
(In thousands) FY 2016 FY 2016 FY 2015 FY 2014MID-YEAR FINANCIAL ACTUAL ACTUALFORECAST PLAN $ % RESULTS RESULTS
OPERATING ACTIVITIES
Net Operating Profit $395 $401 $(6) (1)% $996 $65
Adjustments for Non-Cash Activities:
Depreciation/Amortization 236 236 0 0 % 237 237
Net Adjustments to Assets (55) 0 (55) % (86) (283)
Net Adjustments to Liabilities 50 0 50 % 95 (77)
Customer Deposits & Deferred Revenue 150 0 150 % 200 (374)
Total Cash From Operating Activities $776 $637 $139 22 % $1,442 $(432)
INVESTING ACTIVITIES
Capital Expenditures $0 $0 $0 % $0 $0
Net (Purchases) Sale of Investments 0 0 0 % 0 0
Total Cash From Investing Activities $0 $0 $0 % $0 $0
FINANCING ACTIVITIES
Proceeds of Long-Term Debt $0 $0 $0 % $0 $0
Principal Paid on Debt (60) (100) 40 40 % (132) 0
Interest Paid 0 (10) 10 100 % (10) (10)
Net transfers to USF - arena debt service (411) (411) 0 0 % (1,114) (300)
Total Cash From Financing Activities $(471) $(521) $50 10 % $(1,256) $(310)
CHANGE IN CASH 305 116 189 163 % 186 (742)
Cash, Beginning of Year 924 924 0 0 % 738 1,480
Cash, End of Year $1,229 $1,040 $189 18 % $924 $738
Sun Dome, Inc.FY 2016 Mid-Year Forecast
STATEMENT OF CASH FLOWS
Variance
[ 13 ]

Describe Major Forecasted Variances from Financial Plan - Earnings and Cash Flows
From an unrestricted perspective, revenue for the Association is forecasted $58k below budget. This decrease consists of lower then expected sponsorship within gifts and advertising within program revenue. In order to offset this decrease in revenue, expenses for the Association have been adjusted and are forecasted $62k favorable to budget. This favorability consists of savings associated with salaries and program expenses The Association's unrestricted results for the year are forecasted to be favorable to budget by $4k.
Restricted funds are expected to end the fiscal year $4k higher then the original budget. This is due to an increase in revenue from chapter related events.
Due to the performance of the market, the Association is estimating a 1% increase year over year in unrealized gains. This represents a decrease of 88% from the amount originally budgeted. Ending cash and unrealized investment gains for the Association are determined based on the percentage of ownership in the Foundation's operating and endowment pool, respectively. Therefore, this decrease in estimated unrealized gains are consistent with the Foundation.
Describe Management's Actions to Correct Unfavorable Forecasted Variances from Financial Plan
As described above, unrestricted expenses have been adjusted to reflect the decrease in unrestricted revenue. There is no net income impact. USFAA will continue to focus on increasing revenue through membership additions and new corporate sponsors.
Restricted funds are expected to end the fiscal year $4k higher than the original budget.
University of South Florida Alumni Association, Inc.FY 2016 Mid-Year Forecast
MID-YEAR FORECAST
[ 14 ]

(In thousands) FY 2016 FY 2016 FY 2015 FY 2014MID-YEAR FINANCIAL ACTUAL ACTUALFORECAST PLAN $ % RESULTS RESULTS
REVENUES Program Revenue-Membership $551 $530 $21 4 % $478 $456
Program Revenue 127 151 (24) (16)% 130 156
License Plate Revenue 414 401 13 3 % 390 394
Gifts & Donations 217 274 (57) (21)% 307 306
Investment Income (Loss) 195 195 0 0 % 176 153
Other: Foundation Support 675 675 0 0 % 715 714
Other: Royalties 477 480 (3) (1)% 457 423
Total Revenues $2,656 $2,706 $(50) (2)% $2,653 $2,602
EXPENSESSalaries & Benefits $1,463 $1,475 $(12) (1)% $1,412 $1,372
Scholarships & Fellowships 56 53 3 6 % 88 54
Contractual Services 32 31 1 3 % 24
Materials & Supplies 3 3 0 0 % 21 8
Program Services 879 929 (50) (5)% 894 834
Utilities/Repairs/Maintenance 5 5 0 0 % 5 5
Total Expenses $2,438 $2,496 $(58) (2)% $2,420 $2,297
OPERATING PROFIT BEFORE NON-CASH CHANGES $218 $210 $8 4 % $233 $305
Unrealized Investment Gains (Losses) 48 386 (338) (88)% (127) 562
Change in Fair Value of Swaps 0 0 0 % 0 0
Total Non-Cash Changes $48 $386 $(338) (88)% $(127) $562
NET OPERATING PROFIT $266 $596 $(330) (55)% $106 $867
University of South Florida Alumni Association, Inc.FY 2016 Mid-Year Forecast
INCOME STATEMENT
Variance
[ 15 ]
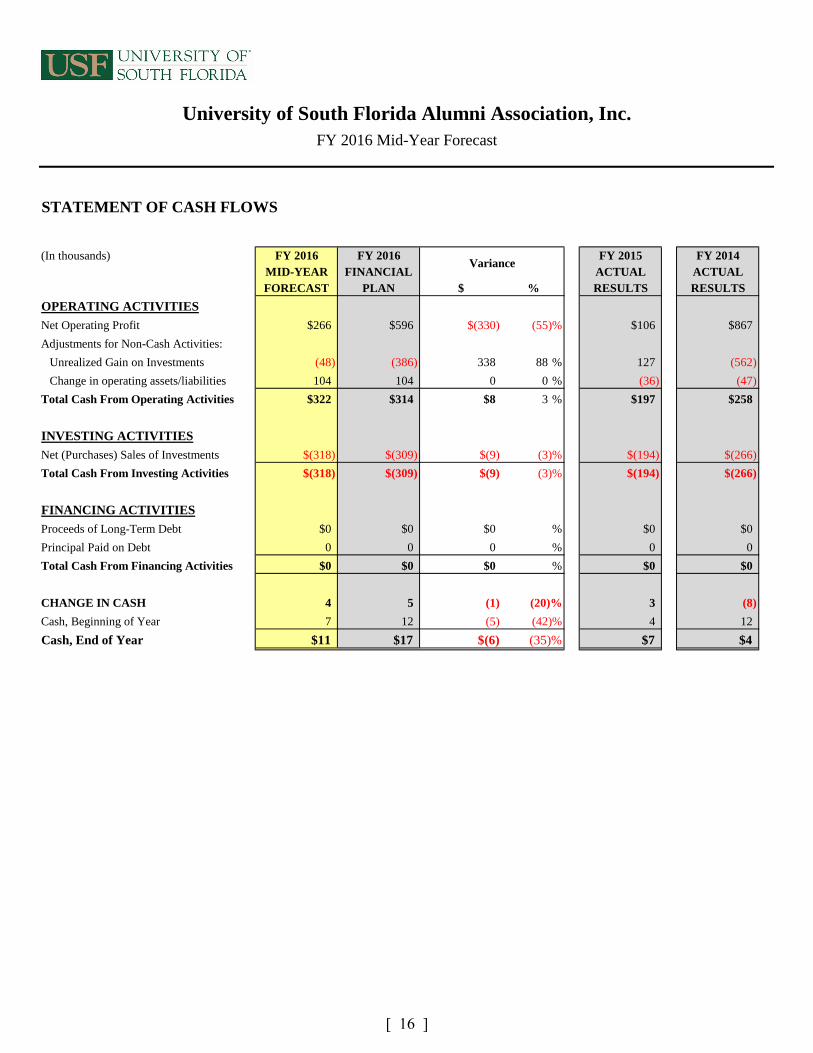
(In thousands) FY 2016 FY 2016 FY 2015 FY 2014MID-YEAR FINANCIAL ACTUAL ACTUALFORECAST PLAN $ % RESULTS RESULTS
OPERATING ACTIVITIES
Net Operating Profit $266 $596 $(330) (55)% $106 $867
Adjustments for Non-Cash Activities:
Unrealized Gain on Investments (48) (386) 338 88 % 127 (562)
Change in operating assets/liabilities 104 104 0 0 % (36) (47)
Total Cash From Operating Activities $322 $314 $8 3 % $197 $258
INVESTING ACTIVITIES
Net (Purchases) Sales of Investments $(318) $(309) $(9) (3)% $(194) $(266)
Total Cash From Investing Activities $(318) $(309) $(9) (3)% $(194) $(266)
FINANCING ACTIVITIES
Proceeds of Long-Term Debt $0 $0 $0 % $0 $0
Principal Paid on Debt 0 0 0 % 0 0
Total Cash From Financing Activities $0 $0 $0 % $0 $0
CHANGE IN CASH 4 5 (1) (20)% 3 (8)
Cash, Beginning of Year 7 12 (5) (42)% 4 12
Cash, End of Year $11 $17 $(6) (35)% $7 $4
University of South Florida Alumni Association, Inc.FY 2016 Mid-Year Forecast
STATEMENT OF CASH FLOWS
Variance
[ 16 ]
Describe Major Forecasted Variances from Financial Plan - Earnings and Cash Flows
Income Statement - Forecasted Revenues - The $0.3 M decrease in Marshall Center Revenues is due to lower debt service costs following the refunding of the Marshall Student Center debt in May 2015.
Income Statement - Forecasted Expenses - The $0.9 M increase in Housing System Operating Expenses reflects Tampa Housing's decision to direct increased funds to renovations and improvements to its existing facilities. The $1.5 M decrease in Depreciation Expense is due to the transfer of the Marshall Student Center to the University in May 2015.
Income Statement - Non-Cash Changes - INTO USF Equity Investment - The $0.5 M increase in the fair value of the INTO USF equity investment, reflects INTO USF's improved net operating profit. The Corporation recognizes 50% of INTO USF's forecasted net operating profit of $4 M.
Income Statement - Non-Cash Changes - Change in Fair Value of Interest Rate Swaps - The $1.3 M decrease in the fair value of interest rate swaps reflects market values as of January 2016.
Statement of Cash Flows - Financing Activities - Security Pledged to Counterparty - The $2.0 M increase in Security Pledged to Counterparty reflects a posting of added collateral in October 2015.
Describe Management's Actions to Correct Unfavorable Forecasted Variances from Financial Plan
The Financing Corporation is not forecasting major unfavorable variances from its Financial Plan. Due to the Corporation's conduit relationship with its USF related parties, changes in operating profit and cash position net to zero.
The University successfully reaffirmed its "AA" credit ratings from Moody's and Standard & Poor's in April 2015. This rating is equal to the highest rating of any university in Florida.
The Corporation plans to refund $41 M of the Series 2013A Health bonds in July 2016. The key objectives are to lock in current lower market rates and reduce risks in the current variable rate bonds. A rate lock agreement was executed on November 25, 2015 with JPMorgan Chase Bank, committing the bank to a 10-year rate of 2.31%. Present value savings will total $7.2 M, or 18.9%, reducing annual debt service payments by approximately $500,000 over the next 10 years.
USF Financing Corporation and USF Property CorporationFY 2016 Mid-Year Forecast
MID-YEAR FORECAST
[ 17 ]

(In thousands) FY 2016 FY 2016 FY 2015 FY 2014MID-YEAR FINANCIAL ACTUAL ACTUALFORECAST PLAN $ % RESULTS RESULTS
REVENUES USF housing system gross revenues $42,032 $41,873 $159 0 % $42,937 $38,752
USF Marshall Center lease revenue 2,064 2,449 (385) (16)% 2,749 2,661
USF athletics system lease revenue 1,992 1,940 52 3 % 2,003 1,957
Arena revenue 918 1,011 (93) (9)% 1,000 960
MSSC lease revenue 4,612 4,629 (17) (0)% 4,600 4,761
HPCC (CAMLS) lease revenue 1,853 1,858 (5) (0)% 1,856 1,857
Total Revenues $53,471 $53,760 $(289) (1)% $55,145 $50,948
EXPENSESUSF housing system operating expenses $21,819 $20,928 $891 4 % $20,955 $19,739
Management fee 665 526 139 26 % 680 532
Interest expense 15,138 15,124 14 0 % 16,047 15,312
Amortization of deferred charges 90 92 (2) (2)% 84 82
Depreciation expense 7,811 9,396 (1,585) (17)% 9,124 9,380
General and administrative expenses 528 584 (56) (10)% 568 621
Total Expenses $46,051 $46,650 $(599) (1)% $47,458 $45,666
OTHER REVENUES (EXPENSES)Transfers (to) from DSOs/auxiliaries $(7,424) $(7,114) $(310) (4)% $(7,575) $(4,948)
Loss on debt extinguishment 0 0 0 % (118) (338)
Interest income 4 4 0 0 % 6 4
Total Other Expenses $(7,420) $(7,110) $(310) (4)% $(7,687) $(5,282)
OPERATING PROFIT BEFORE NON-CASH CHANGES $0 $0 $0 % $0 $0
INTO USF investment - unrealized gain 2,028 1,489 539 36 % 1,562 41
Change in fair value of swaps (1,312) 0 (1,312) % 4,614 3,413
Transfers (to) from DSOs to offset swaps 1,312 0 1,312 % (4,614) (3,413)
Total Non-Cash Changes $2,028 $1,489 $539 36 % $1,562 $41
NET OPERATING PROFIT $2,028 $1,489 $539 36 % $1,562 $41
USF Financing Corporation and USF Property CorporationFY 2016 Mid-Year Forecast
INCOME STATEMENT
Variance
[ 18 ]

(In thousands) FY 2016 FY 2016 FY 2015 FY 2014MID-YEAR FINANCIAL ACTUAL ACTUALFORECAST PLAN $ % RESULTS RESULTS
OPERATING ACTIVITIES
Net Operating Profit $2,028 $1,489 $539 36 % $1,562 $41
Adjustments for Non-Cash Activities:
Amortization of Deferred Charges 90 92 (2) (2)% 84 82
Loss on Debt Extinguishment 0 0 0 % 118 338
Depreciation Expense 7,811 9,396 (1,585) (17)% 9,124 9,380
Net Amortization of Premiums / Discounts (87) (103) 16 16 % (100) (102)
Change in Fair Value of Swaps 1,312 0 1,312 % (4,614) (3,413)
Change in Fair Value of Equity Investment (2,028) (1,489) (539) (36)% (1,562) (41)
Adjustments for Changes in
Operating Assets and Liabilities 14,422 12,545 1,877 15 % 27,410 20,275
Total Cash From Operating Activities $23,548 $21,930 $1,618 7 % $32,022 $26,560
INVESTING ACTIVITIES
Capital Expenditures $0 $0 $0 % $(873) $(450)
Debt Proceeds - Reimbursement to USF 0 0 0 % 0 (20,000)
Net (Purchases) Sales of Investments (1,360) (1,728) 368 21 % 711 (1,997)
Total Cash From Investing Activities $(1,360) $(1,728) $368 21 % $(162) $(22,447)
FINANCING ACTIVITIES
Cash Paid for Debt Issuance Costs $0 $0 $0 % $(940) $(193)
Proceeds of Long-Term Debt 0 0 0 % 0 20,000
Debt Proceeds - Refunding 0 0 0 % 149,822 62,505
Principal Payments - Refunding 0 0 0 % (151,955) (62,505)
Principal Payments (7,040) (7,040) 0 0 % (10,815) (9,801)
Interest Payments (13,148) (13,162) 14 0 % (18,302) (15,449)
Security Pledged to Counterparty (2,000) 0 (2,000) % 330 1,330
Total Cash From Financing Activities $(22,188) $(20,202) $(1,986) (10)% $(31,860) $(4,113)
CHANGE IN CASH 0 0 (0) % 0 0
Cash, Beginning of Year 3 3 0 % 3 3
Cash, End of Year $3 $3 $(0) % $3 $3
Variance
USF Financing Corporation and USF Property CorporationFY 2016 Mid-Year Forecast
STATEMENT OF CASH FLOWS
[ 19 ]
MID-YEAR FORECAST
Operating Revenue, Expenses and Cash Flows are tracking favorably to Financial Plan through the six month period ended December 31, 2015. No significant unfavorable variances from FY16 financial plan are anticipated at this time. Operating Profit is forecasted at $839K for an increase of $129K (+18%) from Financial Plan; the increase is primarily attributed to forecasted cost savings.
The FY16 financial plan for Investment Earnings included 8% expected return on investments managed by the Foundation Endowment Fund and 5% expected return on SunTrust Investment Services. Based on actual market returns to date for FY16 and outlook for FY16, our mid-year forecast has reduced earnings on investments to an overall 1% return for FY16. The reduced earnings forecast is a reduction of $1.565M. The reduction to non-operating income has no effect on cash flow.
The exiting of Draper Laboratory from USF Connect building in early FY16 resulted in non-operating income and expense that was not considered in our FY16 Financial Plan. A lease settlement was reached with the tenant that resulted in non-forecasted income and cash flow of $551K. Draper's early exit caused the sale of certain equipment by Hillsborough County at a loss of $270K to USFRF; the loss (non-cash expense) is equal to the remaining book value of that equipment. A non-cash expense has also been recorded to write-off $284K remaining deferred rent associated with the Draper lease. The net amount of $3K is reported as non-operating income. Effect on cash flow is favorable $551K.
Describe Management's Actions to Correct Unfavorable Forecasted Variances from Financial Plan
Administrative Finance committee will continue to monitor asset allocation of investment portfolio.
FY 2016 Mid-Year Forecast
USF Research Foundation, Inc.
Describe Major Forecasted Variances from Financial Plan - Earnings and Cash Flows
[ 20 ]

(In thousands) FY 2016 FY 2016 FY 2015 FY 2014MID-YEAR FINANCIAL ACTUAL ACTUALFORECAST PLAN $ % RESULTS RESULTS
REVENUES Rental Revenue $8,014 $8,018 $(4) (0)% $7,526 $7,755
Intellectual Property (IP) Revenue 2,497 2,500 (3) (0)% 2,697 2,431
Less - IP Revenue (on behalf of USF) (600) (600) (0) (0)% (376) (1,030)
Incubator Program Revenue 1,672 1,676 (4) (0)% 1,637 1,521
NMR License Revenue 244 244 0 0 % 307 390
Economic Development Grant - - - % 120 262
Other Revenues 185 161 24 15 % 181 171
Total Revenues $12,011 $11,998 $13 0 % $12,091 $11,500
EXPENSESSalaries & Benefits $1,302 $1,302 $(0) (0)% $1,184 $1,044
Contractual Services 211 212 (0) (0)% 145 149
Program Expense- IP, Incubator & Univ Support 1,655 1,694 (39) (2)% 1,391 1,578
Operations- Utilities/ Repairs/Maintenance 3,348 3,381 (33) (1)% 2,973 2,972
Other Operating Expenses 46 46 (0) (0)% 42 62
Interest Expense 1,733 1,733 0 0 % 1,816 1,887
Depreciation & Amortization 2,876 2,920 (44) (2)% 2,923 2,823
Total Expenses $11,172 $11,288 $(116) (1)% $10,474 $10,517
OPERATING PROFIT BEFORE NON-OPERATING $839 $710 $129 18 % $1,617 $984
Investment Gains (Losses) 277 1,842 (1,565) (85)% 998 3,373
Other Non-Operating Income (Loss) (3) - (3) % - 435
Total Non-Operating Income (Loss) $274 $1,842 $(1,568) (85)% $998 $3,808
NET INCOME $1,112 $2,551 $(1,439) (56)% $2,616 $4,792
USF Research Foundation, Inc.
FY 2016 Mid-Year Forecast
INCOME STATEMENT
Variance
[ 21 ]

(In thousands) FY 2016 FY 2016 FY 2015 FY 2014MID-YEAR FINANCIAL ACTUAL ACTUALFORECAST PLAN $ % RESULTS RESULTS
OPERATING ACTIVITIES
Net Income $1,112 $2,551 $(1,439) (56)% $2,616 $4,792
Adjustments for Non-Cash Revenue/Expenses:
Depreciation / Amortization Expense 2,876 2,920 (44) (2)% 2,923 2,823
Non Cash Expenses 712 158 554 350 % 152 401
Non Cash Investment Loss (Gain) (277) (1,842) 1,565 85 % (998) (3,373)
Non Cash Revenue (7) (244) 237 97 % (366) (762)
Change in Assets and Liabilities (net) - - - % (119) (668)
Total Cash From Operating Activities $4,417 $3,544 $873 25 % $4,208 $3,212
INVESTING ACTIVITIES
Capital Expenditures $(1,202) $(1,202) $0 0 % $(804) $(1,159)
Net Sales (Purchases) of Investments - - - % (641) -
Transfer from Venture Investment Fund 300 300 - 0 % 150 420
Seed Capital Funding (300) (300) - 0 % (150) (420)
Total Cash Used for Investing Activities $(1,202) $(1,202) $0 0 % $(1,445) $(1,159)
FINANCING ACTIVITIES
Principal Paid on Debt $(1,680) $(1,680) $0 0 % $(1,630) $(1,580)
Total Cash Used for Financing Activities $(1,680) $(1,680) $0 0 % $(1,630) $(1,580)
CHANGE IN CASH 1,536 663 873 132 % 1,133 473
Cash, Beginning of Year 3,403 3,403 - 0 % 2,270 1,797
Cash, End of Year $4,939 $4,066 $873 21 % 3,403 $2,270
Variance
USF Research Foundation, Inc.
FY 2016 Mid-Year Forecast
STATEMENT OF CASH FLOWS
[ 22 ]

Describe Major Forecasted Variances from Financial Plan - Earnings and Cash Flows
Amounts in the fiscal year 2016 financial plan for gifts & donations revenue and gift in kind transfer expense were adjusted based on the restatement of amounts related to an in-kind contribution recorded in prior years. In addition, amounts included in university support revenue and fundraising and operating salaries expense were adjusted to reflect the effects of the new accounting standard ASU 2013-06 related to the recognition of services received from personnel of an affiliate. These adjustments had no effect on the forecasted net operating profit or the net operating profit previously reported.
Gifts & donations revenue is projected slightly lower than the financial plan due to the Foundation being named as a beneficiary in several revocable planned gifts that were anticipated to be irrevocable gift instruments.
Based on the recent negative performance of the market, the Foundation is projecting a positive return of 1% for the fiscal year.
Describe Management's Actions to Correct Unfavorable Forecasted Variances from Financial Plan
The Foundation's Investment Committee continues to actively monitor the performance and liquidity of our asset allocation and investment managers and take action when appropriate to enhance the growth and benefit of the endowment to USF over a long-term horizon. Our long-term returns are consistently in the top quartile amongst our peers.
The second phase of the Foundation's fundraising campaign will continue to focus on opportunities for our students and faculty by strengthening the academic environment, support research and making the dream of college more affordable.
The budget reductions experienced by the USF System have led to fluctuations in the utilization of Foundation funds. Foundation sources represent a small percentage of the System's overall budget, however, this source is critical for many University programs while providing a funding catalyst for others to achieve the University's goals and aspirations.
FY 2016 Mid-Year Forecast
MID-YEAR FORECAST
USF Foundation, Inc.
[ 23 ]

(In thousands) FY 2016 FY 2016 FY 2015 FY 2014MID-YEAR FINANCIAL ACTUAL ACTUALFORECAST PLAN $ % RESULTS RESULTS
REVENUES Gifts & Donations $43,094 $48,094 $(5,000) (10)% $50,389 $27,760
Investment Income (Loss) 6,023 6,023 0 0 % 5,814 5,432
Campaign Support 3,683 3,683 0 0 % 3,184 3,286
University Support 9,216 9,216 0 0 % 9,415 0
Other Revenues 2,110 2,110 0 0 % 2,553 2,417
Total Revenues $64,126 $69,126 $(5,000) (7)% $71,355 $38,895
EXPENSESProgram Services
Salaries & Benefits $16,926 $16,250 $676 4 % $22,008 $17,936
Scholarship & Fellowships 6,690 6,694 (4) (0)% 6,996 7,020
Service & independent contractors 4,196 4,459 (263) (6)% 5,982 3,576
Supplies 3,284 3,015 269 9 % 1,996 4,002
Gift in kind transfers 846 1,012 (166) (16)% 795 2,368
Other Transfers & Expenses 9,644 10,572 (928) (9)% 11,406 24,473
Total Program Service Expense 41,586 42,002 (416) (1)% 49,183 59,375
Fundraising & Operating Expenses
Salaries & Benefits $11,827 $11,827 $0 0 % $12,078 $3,426
Service & independent contractors 918 918 0 0 % 1,000 1,079
Other Transfers & Expenses 4,293 4,293 0 0 % 3,031 4,337
Total Fundraising & Operating Expenses 17,038 17,038 0 0 % 16,109 8,842
Total Expenses $58,624 $59,040 $(416) (1)% $65,292 $68,217
OPERATING PROFIT BEFORE NON-CASH CHANGES $5,502 $10,086 $(4,584) (45)% $6,063 $(29,322)
Unrealized Investment Gains (Losses) 4,466 36,081 (31,615) (88)% 8,460 69,521
Change in Fair Value of Swaps 0 0 0 % 0 0
Total Non-Cash Changes $4,466 $36,081 $(31,615) (88)% $8,460 $69,521
NET OPERATING PROFIT $9,968 $46,167 $(36,199) (78)% $14,523 $40,199
USF Foundation, Inc.FY 2016 Mid-Year Forecast
INCOME STATEMENT
Variance
[ 24 ]
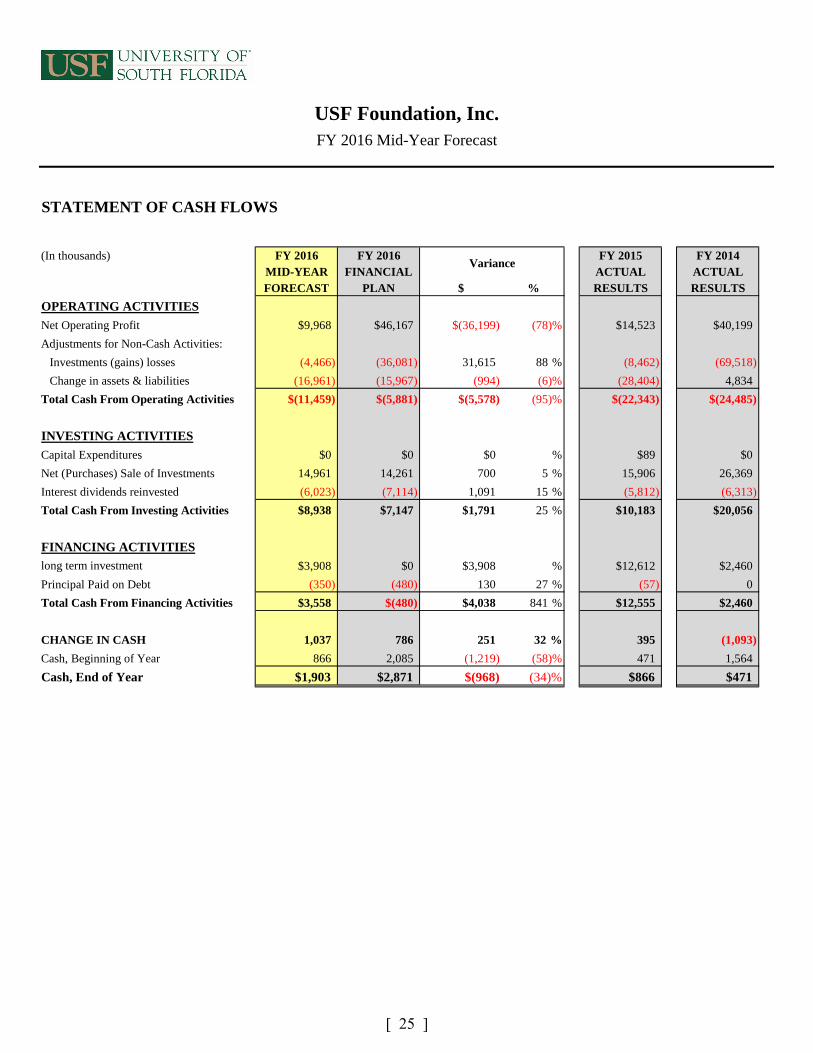
(In thousands) FY 2016 FY 2016 FY 2015 FY 2014MID-YEAR FINANCIAL ACTUAL ACTUALFORECAST PLAN $ % RESULTS RESULTS
OPERATING ACTIVITIES
Net Operating Profit $9,968 $46,167 $(36,199) (78)% $14,523 $40,199
Adjustments for Non-Cash Activities:
Investments (gains) losses (4,466) (36,081) 31,615 88 % (8,462) (69,518)
Change in assets & liabilities (16,961) (15,967) (994) (6)% (28,404) 4,834
Total Cash From Operating Activities $(11,459) $(5,881) $(5,578) (95)% $(22,343) $(24,485)
INVESTING ACTIVITIES
Capital Expenditures $0 $0 $0 % $89 $0
Net (Purchases) Sale of Investments 14,961 14,261 700 5 % 15,906 26,369
Interest dividends reinvested (6,023) (7,114) 1,091 15 % (5,812) (6,313)
Total Cash From Investing Activities $8,938 $7,147 $1,791 25 % $10,183 $20,056
FINANCING ACTIVITIES
long term investment $3,908 $0 $3,908 % $12,612 $2,460
Principal Paid on Debt (350) (480) 130 27 % (57) 0
Total Cash From Financing Activities $3,558 $(480) $4,038 841 % $12,555 $2,460
CHANGE IN CASH 1,037 786 251 32 % 395 (1,093)
Cash, Beginning of Year 866 2,085 (1,219) (58)% 471 1,564
Cash, End of Year $1,903 $2,871 $(968) (34)% $866 $471
USF Foundation, Inc.FY 2016 Mid-Year Forecast
STATEMENT OF CASH FLOWS
Variance
[ 25 ]