direct measurement of homovanillic, vanillylmandelic and 5-hydroxyindoleacetic acids in urine by...
TRANSCRIPT

Journal of Chromatography A, 871 (2000) 341–350www.elsevier.com/ locate /chroma
Direct measurement of homovanillic, vanillylmandelic and5-hydroxyindoleacetic acids in urine by capillary electrophoresis
a b c a ,*´ ¨ ´A. Garcıa , M. Heinanen , L.M. Jimenez , C. Barbasa ´ ´ ´Facultad de CC Experimentales y Tecnicas, Universidad San Pablo-CEU Urbanizacion Monteprıncipe, Ctra. Boadilla del Monte,
km 5,3, 28668 Madrid, SpainbAnalytical Chemistry Department, Helsinki University, Helsinki, Finland
c ´Virgen del Rocıo Hospital, Seville, Spain
Abstract
Separation conditions in CE, with a neutral coated capillary and reversed polarity, have been optimised to make directmeasurement of vanillylmandelic acid, homovanillic acid and 5-hydroxyindoleacetic acid possible in urine samples withoutpre-treatment. The method developed has been validated, presenting adequate parameters for linearity, accuracy andprecision. Detection limits range from 0.03 to 2.5 mM. Finally the method has been applied to urine samples taken frompatients, both adults and children, in hospital. Some of them were also measured by immunoassay and HPLC–electrochemical detection and results have been compared. 2000 Elsevier Science B.V. All rights reserved.
Keywords: Homovanillic acid; Vanillylmandelic acid; Hydroxyindoleacetic acid; Organic acids; Catecholamines
1. Introduction secrete large amounts of serotonin, are often discov-ered by the enhanced urinary excretion of 5-hydroxy-
Homovanillic (HVA) and vanillylmandelic (VMA) indoleacetic acid (HIA) [6].acids, the major metabolites of catecholamines, are Different high-performance liquid chromatographyoften tested in urine for neurologic diagnosis and for (HPLC) methods have been described mainly em-monitoring the response to therapy in illnesses like ploying ion-pair reversed-phase chromatographyphaeochromocytoma and neuroblastoma [1–3]. with electrochemical [7–9] or fluorimetric detection
Low-cost methods are necessary to satisfy the [6,10], but all of them include sample pretreatmentrising demand for mass screening in childhood [4] with solid-phase or liquid extraction, which is timebecause, if detected early enough, neuroblastoma is a consuming and a source of errors, as can be seen incurable tumour. Moreover, a second area of clinical the recoveries shown in the aforementioned studies.pathology that involves the cardiovascular system Although initial capillary gas chromatographic(hypertension, hypotension) is also related to these methods [11] were substituted by HPLC, which ismetabolites [5] and so the demand for their measure- simpler and does not need derivatisation, the increas-ment is increasing. ing introduction of mass spectrometry (MS) with
On the other hand, intestinal tumours, which greater specificity and selectivity than other detectionmethods has enlarged GC–MS use with this applica-tion [12–14].*Corresponding author. Fax: 134-91-3510-475.
E-mail address: [email protected] (C. Barbas) Recently, immunoassay has replaced many of the
0021-9673/00/$ – see front matter 2000 Elsevier Science B.V. All rights reserved.PI I : S0021-9673( 99 )00994-2

´342 A. Garcıa et al. / J. Chromatogr. A 871 (2000) 341 –350
chromatographic methods, but crossed reactivity adults and infants in good or bad health. Some ofoften makes the determinations semi-quantitative them were also measured by immunoassay and[15] and monoclonal antibodies are expensive. HPLC–electrochemical detection (ED) and results
The use of capillary electrophoresis (CE) in have been compared.routine clinical laboratory work is increasing and itprovides an alternative with advantages such assimplicity, low volume reagent consumption, low 2. Materials and methodsvolume sample requirements and the possibility ofanalysing without sample pretreatment in many 2.1. Chemicals and samplescases, with the corresponding automation and de-creased technician costs. Most of the evaluation of The organic acids used as standards were fromCE as a clinical tool has been focused on serum Sigma (St. Louis, MO, USA), phosphoric acid andproteins [16], but there are many areas where CE can sodium hydroxide were from Panreac (Barcelona,replace the conventional methodology. Spain) and methanol and acetic acid were from
Isaaq et al. [17] have previously described a Scharlau (Barcelona, Spain). Monoclonal Enzyme-capillary zone electrophoresis (CZE) method for linked Immunoabsorbent Assay Kits for HVA andHVA and VMA measurement in infant urine samples VMA were from Yamasa Shoyu (Chiba, Japan).after extraction with ethyl acetate. Since the con- The calibration urine for method development andcentration in the urine samples of healthy infants is validation was from 10 healthy volunteers in ourless than the detection limit, a concentration step is own laboratory, pooled together, and stored atalso necessary with this method. Caslavska et al. [18] 2208C until analysis. The standards, in the levelshave developed a method based on micellar electro- indicated below, were added to this urine to obtainkinetic capillary chromatography (MECC) for urin- the test sample.ary indole derivatives and catecholamine metaboliteswith fluorescence detection by direct injection of 2.2. Instrumentation and methodplain or diluted samples. The fluorescence detectorhas a higher sensitivity, although it costs more than a The separation was performed on a P/ACE CEUV detector, and the paper does not give much data system (Beckman, Palo Alto, CA, USA) with UVabout validation parameters. On the other hand, detection at 192 nm. The injection was by pressureShirao et al. [19] recently published another micellar (3.3 bar) for 5 s and a neutral coated capillaryelectrokinetic chromatographic method including (Beckman, Madrid, Spain) of 37 cm350 mm I.D. atVMA and HVA, but not HIA. Reproducibility re- 210 kV potential was used. The remaining con-quires capillary conditioning and anyway the relative ditions were optimised during method development.standard deviations (RSDs) of the peak areas are not Finally, conditions where peaks appear with enoughvery good. Correlation coefficients, in linearity resolution from other peaks in real samples to permitassay, do not reach 0.99 for some analytes and quantification were 0.170 M phosphate–0.050 Mrecoveries are not shown. As only spiked samples acetate buffer made up to pH 4.4 to 4.2 with NaOHare treated the method is intended for detecting and with 10% (v/v) methanol added and 4.3 to 4.2clearly pathological situations during routine mass with 5% (v/v) methanol.screening of pheochromocytoma and neuroblastoma.
The aim of the present work was to optimise the 2.3. ValidationpH of the running buffer in CE, evaluating also theneed to add organic modifiers to make possible direct Individual stock solutions of each organic acid 200measurement of VMA, HVA and HIA in urine mM in water were prepared and stored at 2208Csamples in both normal and pathological values, with this concentration. On the day of the analysiswithout pre-treatment and separating vanillic acid they were diluted as needed.(VA) as usual interference. The method developed Linearity of response for standards was tested byhas been validated and applied to urine samples from assaying in triplicate six levels of concentrations,

´A. Garcıa et al. / J. Chromatogr. A 871 (2000) 341 –350 343
ranging from normal to medium pathological, that is a strong anionic exchange column (Hema-100 Bio-from 3 mM to 98 mM. Linearity of response for Q) instead of alumina.samples was tested in the same way but replacingwater with urine.
Recovery was estimated comparing the values 3. Results and discussionfound in the study of linearity of the calibrationurine, with those of the standards linearity, taking The electrolyte buffer is one of the most importantinto account the endogenous urinary concentrations, and flexible variables in CZE. The pH, the con-which had been previously quantified. centration, the type of buffer and the presence of
Within-day precision was tested both to check the modifiers can all significantly influence the selectivi-constancy of instrumental response to a given analyte ty, sensitivity, the efficiency, and the speed ofand the concentration and migration time repetitive- separation [20]. Previous studies in our laboratoryness, since the latter is a key parameter for peak with short-chain organic acids [21,22] had shownassignment. For this purpose, the assay was per- that neutral capillaries yield superior reproducibilityformed with 10 solutions of standards and 10 of in migration times and a more steady baseline thansamples, in the medium concentration of the cali- fused-silica capillaries. Moreover, phosphate provedbration curve 12 mM for all the compounds. For to be the best option as a background electrolyte dueintermediate precision, different persons measured to its pK , which makes work in the widest pH rangea
three or four standards and samples on different days possible and due to its transparency in the low UVup to a total number of 22. region. However, when working around pH 4, the
Limits of detection were calculated by extrapolat- buffer capacity of phosphate is minimal, so a smalling to zero concentration the standard deviations of amount of acetic acid was added to improve it,the last three points of linearity in both standards and without greatly increasing the background absor-samples and interpolating this value in the corre- bance at 200 nm. During the development of previ-sponding equation. When differences between stan- ous works, quoted above, ionic strength of thedards and samples appeared, the higher value was electrolyte buffer was adjusted to get a highertaken. sensitivity and efficiency with different urine sam-
ples, making use of a possible stacking effect.2.4. Measurement of samples Therefore, only a small quantity of phosphate has
been substituted by acetate. Finally, when it was´The Virgen del Rocıo Hospital (Seville, Spain) observed that only a small increase in resolution was
kindly provided us with urine samples from patients, needed, the addition of small amounts of methanolboth adults and infants and the assay received the was also assayed as it is known to reduce theapproval of the ethics committee. Samples were electroosmotic flow and this could result in a bettercollected for 24 h with 10 ml of 6 M HCl added per resolution.litre and stored at 2208C until the analysis. The pH separation conditions were first optimised
On the day of the analysis samples were defrosted, for standards. Fig. 1 shows the mobility of the threevortexed, centrifuged at 3000 g for 5 min and diluted analytes plus VA vs. pH. VA was added mainly1:1 with purified water. They were then injected because it is a frequent interference coming fromtwice and they were measured the same day as the intake. In Fig. 1 it can be seen that at pH 8.0 only VAstandards corresponding to the medium point of the is resolved and from pH 8.0 to pH 5.0 some of themcalibration graph. always overlap. Around pH 5 there are different pH
In order to compare results the same samples were values where all the analytes are separated, while atalso analysed by HPLC–ED following the method of pH 4.0 some of them overlap again. Moreover, the
´Brandsteterova et al. [8] with minor modifications migration times of HVA and HIA at pH 4.0 are tooand with enzyme immunoassay (EIA). The main high (over 40 min), because their pK values are 4.3a
modification in the HPLC method was sample and 4.7, respectively [23] and at this pH, compoundspretreatment which was carried out, in this case, with are very weakly ionised. Hence, the range from pH

´344 A. Garcıa et al. / J. Chromatogr. A 871 (2000) 341 –350
Fig. 1. Standards mobility vs. pH. Electrolyte buffer: 0.170 M phosphoric acid made up to the corresponding pH with NaOH from pH 8.0 topH 6.0 and 0.170 M phosphoric acid–0.050 M acetic acid made up to pH with NaOH for pH 5.0 and 4.0. UV detection at 192 nm and 210kV applied potential. s: AV, h: AVM, n: AHV and 3: AHI.
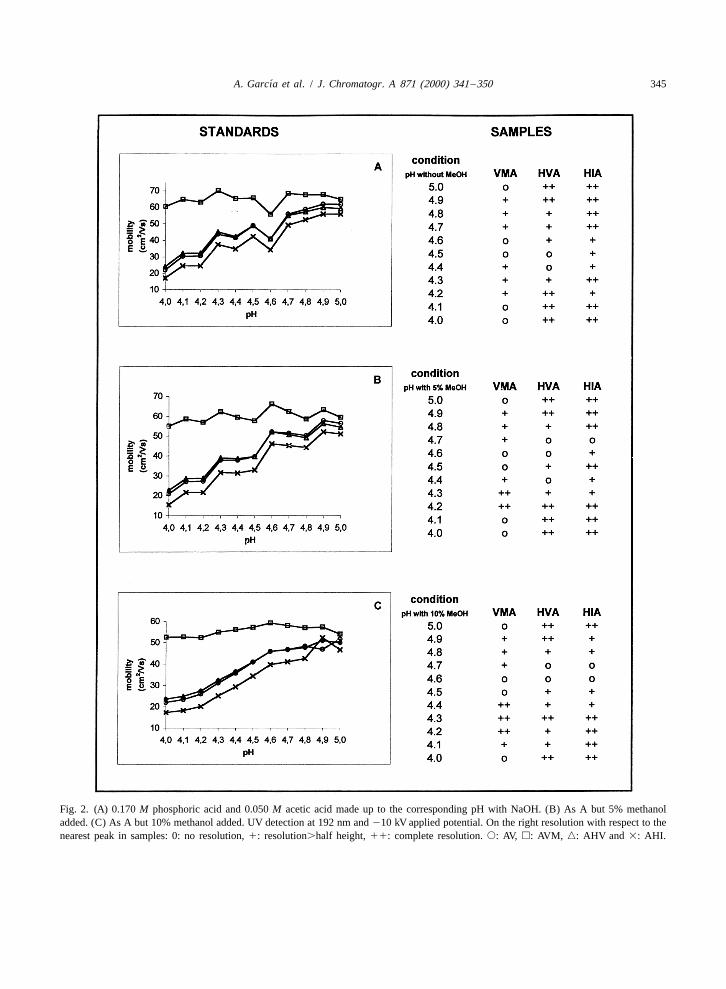
5.0 to pH 4.0 was assayed in more detail. Increments changes in the buffer near the pK value of weaka
of 0.1 in pH were processed and results can be seen acidic solutes is significant and the elution orderin Fig. 2A. As could be expected, samples present could change. Analyte peaks in samples were iden-different interferences, so that at this stage a pool of tified both by retention times and by spiking. To sumurine samples were processed in parallel with the up, the conditions in which peaks appear withstandards and at the same time the samples with enough resolution from other peaks in samples tostandards added were also processed for a more sure permitquantificationwere0.170M phosphate–0.050Midentification of the peaks. Resolutions between each acetate buffer made up to pH 4.4 to 4.2 with NaOHanalyte and other peaks in the sample are found in and with 10% (v/v) methanol added as well as 4.3 toFig. 2 in parallel with standards. As an example, the 4.2 with 5% (v/v) methanol. For validation pH 4.4gradual development of VMA separation in samples, with 10% (v/v) methanol was chosen, because itwhich is the problematic, is shown in Fig. 3 for pH presented the better resolution to time of analysis4.6 to 4.4 with 10% methanol added. ratio. Under such conditions separation is shown in
Electrolytes were phosphate–acetate and they Fig. 5 for, firstly, a pool of urine samples frommade up the corresponding pH with NaOH, on its healthy people, secondly, standards and, finally, aown or with 5% (Fig. 2B) and 10% methanol (Fig. sample of the same urine pool with standards added.2C). It is worth noting here the importance of the There is a small range of conditions yielding goodinformation obtained by this scanning of pH, when resolution, so the accuracy in buffer pH is critical forfor example, apparently pure peaks split into two or the separation.even three when varying pH, as could be seen in Fig.3 or by adding methanol as can be observed in Fig. 3.1. Validation4. As could be expected, the addition of methanol asa modifier increases retention times, but, in some As shown in Table 1, standards fit the linearcases, as here, it gives a better resolution. For each model (r.0.99) for the three organic acids and nopH, standards were run individually to ensure of bias was found, except for VMA. Although it hastheir position, because the impact of small pH statistical significance, it has no practical conse-
´A. Garcıa et al. / J. Chromatogr. A 871 (2000) 341 –350 345
Fig. 2. (A) 0.170 M phosphoric acid and 0.050 M acetic acid made up to the corresponding pH with NaOH. (B) As A but 5% methanoladded. (C) As A but 10% methanol added. UV detection at 192 nm and 210 kV applied potential. On the right resolution with respect to thenearest peak in samples: 0: no resolution, 1: resolution.half height, 11: complete resolution. s: AV, h: AVM, n: AHV and 3: AHI.

´346 A. Garcıa et al. / J. Chromatogr. A 871 (2000) 341 –350
Fig. 3. Development of VMA separation in samples from pH 4.6 to pH 4.4 with 10% methanol added. Electrolyte buffer: 0.170 Mphosphoric acid and 0.050 M acetic acid made up to the corresponding pH with NaOH. UV detection at 192 nm and 210 kV appliedpotential.
Fig. 4. Effect of methanol addition on VMA peak resolution in urine samples at pH 4.4. Electrolyte buffer: 0.170 M phosphoric acid and0.050 M acetic acid made up to the corresponding pH with NaOH. UV detection at 192 nm and 210 kV applied potential.

´A. Garcıa et al. / J. Chromatogr. A 871 (2000) 341 –350 347
Fig. 5. Electropherograms of a pool of urine from 10 healthy people, standards and the same urine pool with the standards added.Electrolyte buffer: 0.170 M phosphoric acid and 0.050 M acetic acid made up to pH 4.4 with NaOH and 10% methanol added. UV detectionat 192 nm and 210 kV applied potential.
Table 1Main validation parameters of the method
VMA HVA HIA
Standards linearity Intercept 211 62467942 61462044 24126879Slope 18396113 2147642 1343619r 0.995 0.9995 0.9997
Range (mM) 3–98 3–98 3–98
Sample linearity Intercept 211 62463012 211 91665614 23718610 120Slope 18396113 23976178 15786254r 0.995 0.995 0.99
Accuracy Standards 105 97 103Recovery (%) RSD 12 6 10
Samples 104 98 110RSD 10 7 10
Precision (mM)Intra-assay Mean 39 84 65(n510) RSD 7 5 3
Inter-assay Mean 38 82 67(n522) RSD 7 6 4
Limits of detection (mM) 0.03 1.8 2.5

´348 A. Garcıa et al. / J. Chromatogr. A 871 (2000) 341 –350
quences as can be seen in the recoveries that are near samples when following the progress of patientsunder treatment.100% in the whole range.
Samples also showed a good linearity, with corre-lation coefficients over 0.99. For accuracy, re-
3.2. Urine samples measurementcoveries ranged from 98 to 110% and they did notstatistically differ from 100%.
The results of pathological samples are shown inWhen running 10 runs per day of both standardsTable 2 which also includes values of VMA andand samples, daily RSDs in concentrations are lowHVA measured with HPLC–ED and EIA in theenough to consider the method acceptable (3 to 7%).
´Virgen del Rocıo Hospital. Fig. 6 shows the elec-The intermediate precision evaluated on differenttropherogram of a urine sample from a healthydays and with different operators with a total of 22person as compared with one from a patient withruns provided RSD values slightly superior to intra-pathological levels of this acid, and here the greatassay precision (4 to 7%), as could be expected.increase in the peak can be seen. Fig. 7 presents theDetection limits are 0.03 mM for VMA, 1.8 mM forcorrelation of the CE method with HPLC and EIAHVA and 2.5 mM for HIA. Mean values described infor both VMA and HVA. For VMA, CE vs. HPLCthe bibliography as normal for these acids, vary overhas an equation y51.2x169 and r50.8 and CE vs.a wide range even when working with the sameEIA y50.98x149 with r50.8. For HVA, the correla-technique, that is from 11.6 to 28.7 mM for VMA,tion is better; CE vs. HPLC has an equation y5from 8.2 to 41 mM for HVA and from 17.8 to 58.30.9x117, r50.97 and CE vs. EIA y50.5x112, r5mM for HIA [7,24]. Detection limits provided by the0.96 which means that CE values are similar topresent method are under these values, so it wouldHPLC and EIA values for both acids as the slopesbe applicable to the measurement of all kind of
Table 2Values of VMA and HVA in urine samples from patients measured by three different methods (samples from 1 to 6 are from children andfrom 6 to 19 from adults)
Measurement of VMA in urine samples from patients (mM) Measurement of HVA in urine samples from patients (mM)
No. CE HPLC EIA No. CE HPLC EIA
m1 134.5 248.7 186.6 m1 243.0 240.1 125.8m2 136.1 543.9 474.6 m2 207.8 228.0 120.0m3 18.4 219.0 88.2 m4 24.3 134.0 86.4m4 59.8 174.6 93.8 m5 44.5 68.1 43.9m5 73.4 192.7 147.7 m6 56.0 52.7 29.0m6 63.0 141.8 138.9 m7 79.2 102.7 58.4m7 30.3 86.3 78.5 m8 30.4 45.6 26.2m8 67.8 108.5 77.9 m9 48.5 48.3 39.7m9 66.3 95.3 87.6 m10 55.7 25.8 15.8m10 23.3 82.2 69.1 m11 119.1 136.8 90.5m11 600.8 1824.9 1069.7 m12 6.7 30.8 16.6m12 24.4 110.0 68.1 m13 8.9 50.5 23.3m13 18.2 79.7 51.4 m14 36.4 64.8 39.2m14 41.4 144.8 122.8 m15 61.4 61.0 34.5m15 41.3 155.9 89.6 m16 17.9 111.5 66.5m16 27.1 118.1 78.8 m17 11.0 20.9 13.7m17 35.1 102.9 69.8 m18 20.9 52.7 19.9m18 24.2 139.2 112.9 m19 12.4 22.5 18.3m19 38.8 73.7 63.9

´A. Garcıa et al. / J. Chromatogr. A 871 (2000) 341 –350 349
Fig. 6. Comparison of VMA peaks in control and pathological samples. Electrolyte buffer: 0.170 M phosphoric acid and 0.050 M aceticacid made up to pH 4.4 with NaOH and 10% methanol added. UV detection at 192 nm and 210 kV applied potential.
are near 1, except for HVA which are lower with CE primary method, because of its simplicity and anthan with EIA. When comparing HPLC with EIA, orthogonal technique as HPLC to confirm the posi-values are always lower with HPLC as shown by the tive results if necessary.slopes, which are 0.6 for VMA and 0.5 for HVA, butcorrelation is always very positive (r50.98).
Recently Fauler et al. [13] proposed HPLC as 4. Conclusionroutine method and GC–MS as a control to retestsamples with high values, in order to rule out results In view of its analytical characteristics, the CEdue to interferences. Now, we can propose CE as a method developed for the direct determination of
Fig. 7. Correlation of VMA and HVA values by CE and (a) HPLC–ED or (b) EIA.

´350 A. Garcıa et al. / J. Chromatogr. A 871 (2000) 341 –350
[7] M. Radjaipour, H. Raster, H.M. Liebich, Eur. J. Clin. Chem.VMA, HVA and HIA in urine represents a newClin. Biochem. 32 (1994) 609.solution to satisfy the rising demand for measure-
´ ´[8] E. Brandsteterova, P. Kubalec, I. Skacai, I. Balazovjech,ment of these analytes with simple, low-cost meth-Neoplasma 41 (1994) 205.
ods. The key advantages are automatisation, mini- [9] N.C. Parker, C.B. Levtzow, P.W. Wright, L.L. Woodard, J.F.mising sample treatment with the following saving of Chapman, Clin. Chem 32 (1986) 1473.
[10] T. Tokuda, T. Tokieda, A. Anazawa, M. Yoshioka, J.time, and low consumption of reactives. It could helpChromatogr. 530 (1990) 418.to rationalise the use of CE in clinical laboratories as
[11] M. Tuchman, C. Auray-Blais, R. Ramnaraine, J. Neglia, W.samples could be run overnight.Krivit, B. Lemieux, Clin. Biochem. 20 (1987) 173.
[12] J.A. Seviour, A.C. McGill, A.W. Craft, L. Parker, S. Bell, M.Cole, J. Smith, E. Hawkins, J. Brown, A.D. Gordon, Am. J.Pediat. Hematol. /Oncol. 14 (1992) 332.
Acknowledgements [13] G. Fauler, H.J. Leis, E. Huber, Ch. Schellauf, R. Kerbl, Ch.Urban, H. Gleispach, J. Mass Spectrom. 32 (1997) 507.
[14] M. Tuchman, B. Lemieux, C. Auray-Blais, L.L. Robison, R.The present study has been supported by Uni-Giguere, M.T. McCann, W.G. Woods, Pediatrics 86 (1990)versidad S. Pablo-CEU project No. 6 /98. We are765.
grateful to all the persons who have provided urine ´[15] F. Taran, H. Bernard, A. Valleix, C. Creminon, J. Grassi, D.samples, to Mr. E. Torija and Mr. J.J. Gragera for Olichon, J.R. Deverre, P. Pradelles, Clin. Chim. Acta 264their technical support, and to Dr. Gayoso for always (1997) 177.
[16] R.O. Oda, R. Clarck, J. Katzmann, J.P. Landers, Electro-being available.phoresis 18 (1997) 1715.
[17] H.J. Issaq, K. Delviks, G.M. Janini, G.M. Muschik, J. Liq.Chromatogr. 15 (1992) 3193.
[18] J. Caslavska, E. Gassmann, W. Thormann, J. Chromatogr. AReferences 709 (1995) 147.
[19] M.K. Shirao, S. Suzuki, J. Kobayashi, N. Hiroyuki, E.Mochizuki, J. Chromatogr. B 693 (1997) 463.[1] J.L. Young, L.G. Ries, E. Silverber, J.W. Horm, R.W. Miller,
[20] D. Li, S. Fu, C.A. Lucy, Anal. Chem. 71 (1999) 687.Cancer 58 (1986) 598.[21] C. Barbas, N.A.R. Adeva, M. Rosillo, T. Rubio, M. Castro,[2] O. Schweisguth, J. Pediatr. Surg. 3 (1968) 118.
Clin. Chem. 44 (1998) 1340.[3] M. Tuchman, C.L. Morris, M.L. Ramnaraine, Pediatrics 75´[22] A. Garcıa, C. Barbas, R. Aguilar, M. Castro, Clin. Chem. 44(1985) 324.
(1998) 1905.[4] J.A. Seviour, A.C. McGill, G. Dale, A.W. Craft, J. Chroma-[23] T. Hanai, K.C. Tran, J. Hubert, J. Chromatogr. 239 (1982)togr. 432 (1988) 273.
385.[5] R.C. Clauson, Research Methods in Neurochemistry, Vol. 6,[24] A.R. Bonfigli, G. Coppa, R. Testa, I. Testa, G. De Sio, Eur.Plenum, New York, 1985.
J. Clin. Chem. Clin. Biochem. 35 (1997) 57.[6] J.P.M. Wielders, J.K. Mink, J. Chromatogr. 310 (1984) 379.