dirco expenditure report 2013/14 quarter 3 presentation to the portfolio committee
DESCRIPTION
DIRCO Expenditure report 2013/14 Quarter 3 Presentation to the Portfolio Committee Date: 25 February 2014. Table of contents. DIRCO Expenditure report Summary Expenditure per programme African Renaissance fund (ARF) Budget allocation List of Committed projects. - PowerPoint PPT PresentationTRANSCRIPT
DIRCO Expenditure report 2013/14DIRCO Expenditure report 2013/14
Quarter 3 Quarter 3
Presentation to the Portfolio Committee
Date: 25 February 2014

Table of contents
2
A. DIRCO Expenditure report1. Summary
2. Expenditure per programme
B. African Renaissance fund (ARF)1. Budget allocation
2. List of Committed projects

3
Vote Expenditure per programme (R’000)
Programmes Vote Approriation
Quarter 3
Projection Actual % of Actual to projection Variance
Administration 1 327 802 1 027 824 842 833 82.0% 18.0%International Relations 2 761 000 2 086 257 2 086 879 100.0% 0.0%International Cooperation 459 003 341 610 320 178 93.7% 6.3%Public Diplomacy and Protocol 254 468 185 778 207 740 111.8% -11.8%International Transfers 952 373 773 376 670 439 86.7% 13.3%Total 5 754 646 4 414 845 4 128 069 93.5% 6.5%
Economic Classification Compensation of employees 2 354 273 1 717 193 1 764 747 102.8% -2.8%Goods and services 2 075 307 1 625 205 1 483 728 91.3% 8.7%Transfer payments 952 373 776 738 681 567 87.7% 12.3%Payments for capital assets 372 693 295 709 198 027 67.0% 33.0%Total 5 754 646 4 414 845 4 128 069 93.5% 6.5%
Expenditure/projection as % of total budget 76.7% 71.7%
Vote Expenditure continued…
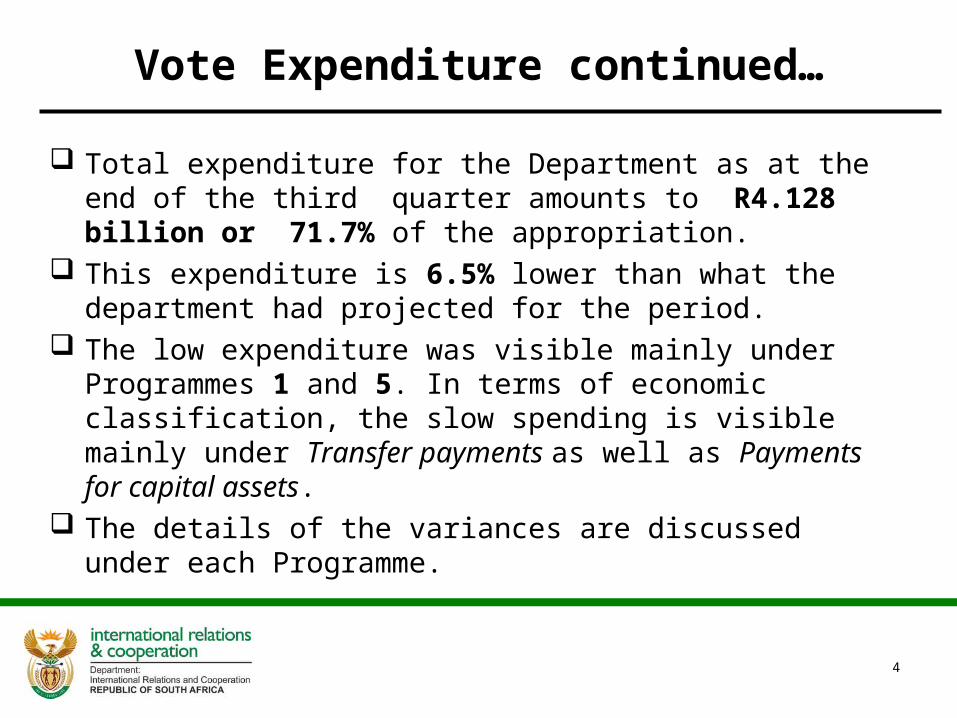
Total expenditure for the Department as at the end of the third quarter amounts to R4.128 billion or 71.7% of the appropriation.
This expenditure is 6.5% lower than what the department had projected for the period.
The low expenditure was visible mainly under Programmes 1 and 5. In terms of economic classification, the slow spending is visible mainly under Transfer payments as well as Payments for capital assets.
The details of the variances are discussed under each Programme.
4
5
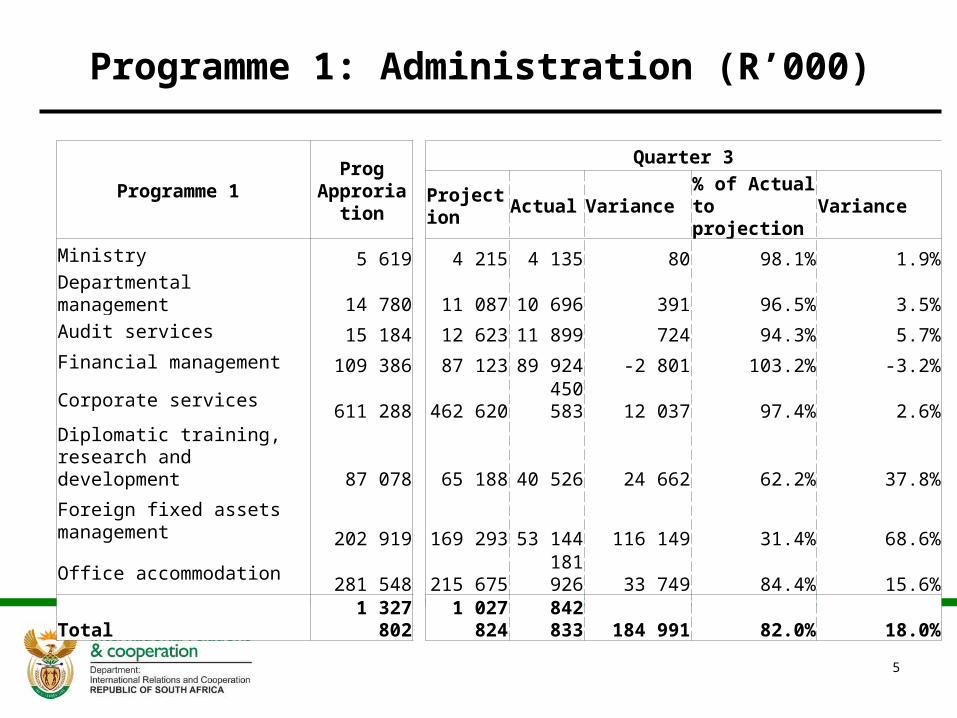
Programme 1: Administration (R’000)
Programme 1 Prog Approriation
Quarter 3
Projection Actual Variance % of Actual to projection Variance
Ministry 5 619 4 215 4 135 80 98.1% 1.9%Departmental management 14 780 11 087 10 696 391 96.5% 3.5%Audit services 15 184 12 623 11 899 724 94.3% 5.7%Financial management 109 386 87 123 89 924 -2 801 103.2% -3.2%Corporate services 611 288 462 620 450 583 12 037 97.4% 2.6%
Diplomatic training, research and development 87 078 65 188 40 526 24 662 62.2% 37.8%
Foreign fixed assets management 202 919 169 293 53 144 116 149 31.4% 68.6%Office accommodation 281 548 215 675 181 926 33 749 84.4% 15.6%
Total 1 327 802 1 027 824 842 833 184 991 82.0% 18.0%

6
Programme 1 – Econ Classification (R’000)
Programme 1 - Econ Class Prog Approriation
Quarter 3
Projection Actual Variance % of Actual to projection Variance
Econonic Classification Compensation of employees 329 718 247 593 245 618 1 975 99.2% 0.8%Goods and services 666 847 511 779 412 304 99 475 80.6% 19.4%Transfer payments 980 980 980 0 100.0% 0.0%Payments for capital assets 330 257 267 472 183 931 83 541 68.8% 31.2%Total 1 327 802 1 027 824 842 833 184 991 82.0% 18.0%
Expenditure/projection as % of total
budget 77.4% 63.5%
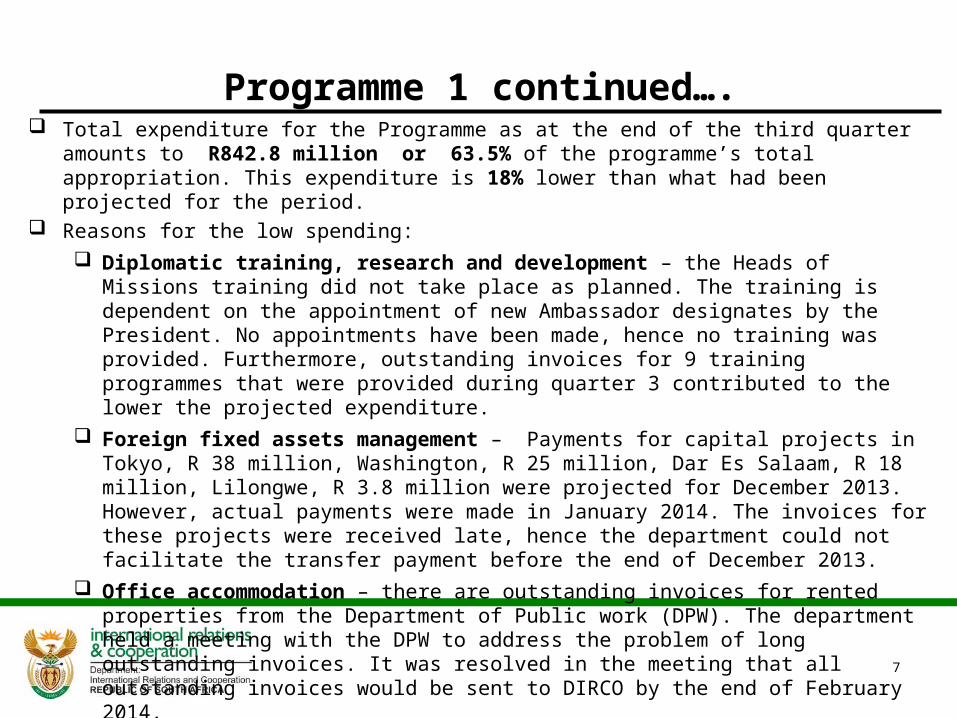
Total expenditure for the Programme as at the end of the third quarter amounts to R842.8 million or 63.5% of the programme’s total appropriation. This expenditure is 18% lower than what had been projected for the period.
Reasons for the low spending:
Diplomatic training, research and development – the Heads of Missions training did not take place as planned. The training is dependent on the appointment of new Ambassador designates by the President. No appointments have been made, hence no training was provided. Furthermore, outstanding invoices for 9 training programmes that were provided during quarter 3 contributed to the lower the projected expenditure.
Foreign fixed assets management – Payments for capital projects in Tokyo, R 38 million, Washington, R 25 million, Dar Es Salaam, R 18 million, Lilongwe, R 3.8 million were projected for December 2013. However, actual payments were made in January 2014. The invoices for these projects were received late, hence the department could not facilitate the transfer payment before the end of December 2013.
Office accommodation – there are outstanding invoices for rented properties from the Department of Public work (DPW). The department held a meeting with the DPW to address the problem of long outstanding invoices. It was resolved in the meeting that all outstanding invoices would be sent to DIRCO by the end of February 2014.
7
Programme 1 continued….
8
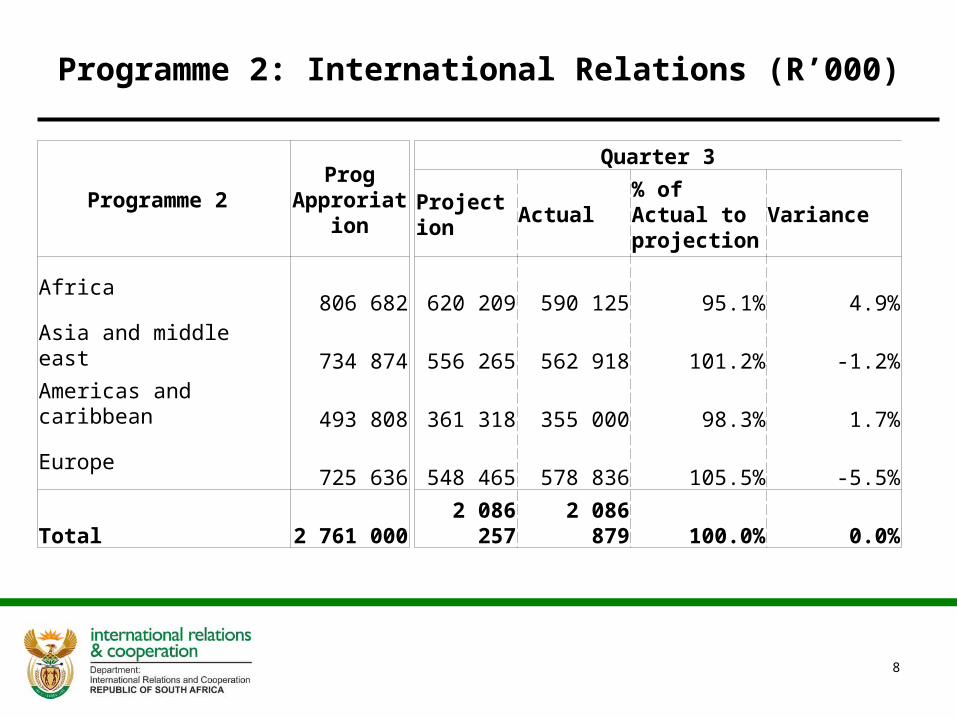
Programme 2: International Relations (R’000)
Programme 2 Prog Approriation
Quarter 3
Projection Actual % of Actual to projection Variance
Africa806 682 620 209 590 125 95.1% 4.9%
Asia and middle east734 874 556 265 562 918 101.2% -1.2%
Americas and caribbean493 808 361 318 355 000 98.3% 1.7%
Europe725 636 548 465 578 836 105.5% -5.5%
Total 2 761 000 2 086 257 2 086 879 100.0% 0.0%
9
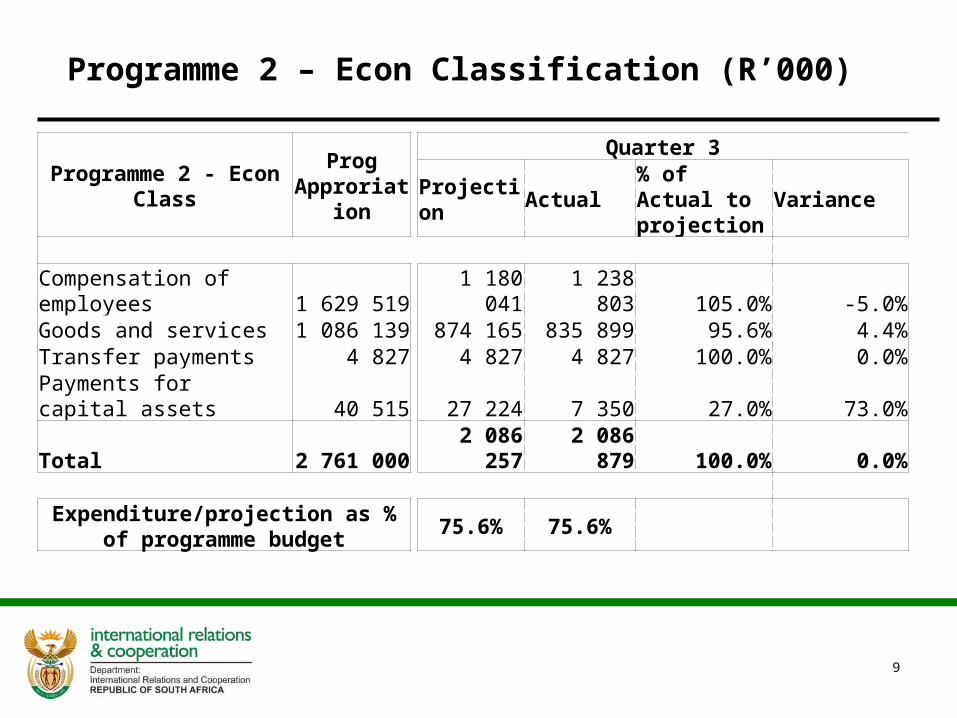
Programme 2 – Econ Classification (R’000)
Programme 2 - Econ Class Prog Approriation
Quarter 3
Projection Actual % of Actual to projection Variance
Compensation of employees 1 629 519 1 180 041 1 238 803 105.0% -5.0%Goods and services 1 086 139 874 165 835 899 95.6% 4.4%Transfer payments 4 827 4 827 4 827 100.0% 0.0%Payments for capital assets 40 515 27 224 7 350 27.0% 73.0%Total 2 761 000 2 086 257 2 086 879 100.0% 0.0%
Expenditure/projection as % of programme budget 75.6% 75.6%

Total expenditure for the Programme as at the end of the third quarter amounts to R2.087 billion or 75.6% of the programme’s total appropriation.
The expenditure is in line with what was projected for the period.
10
Programme 2 continued….
11
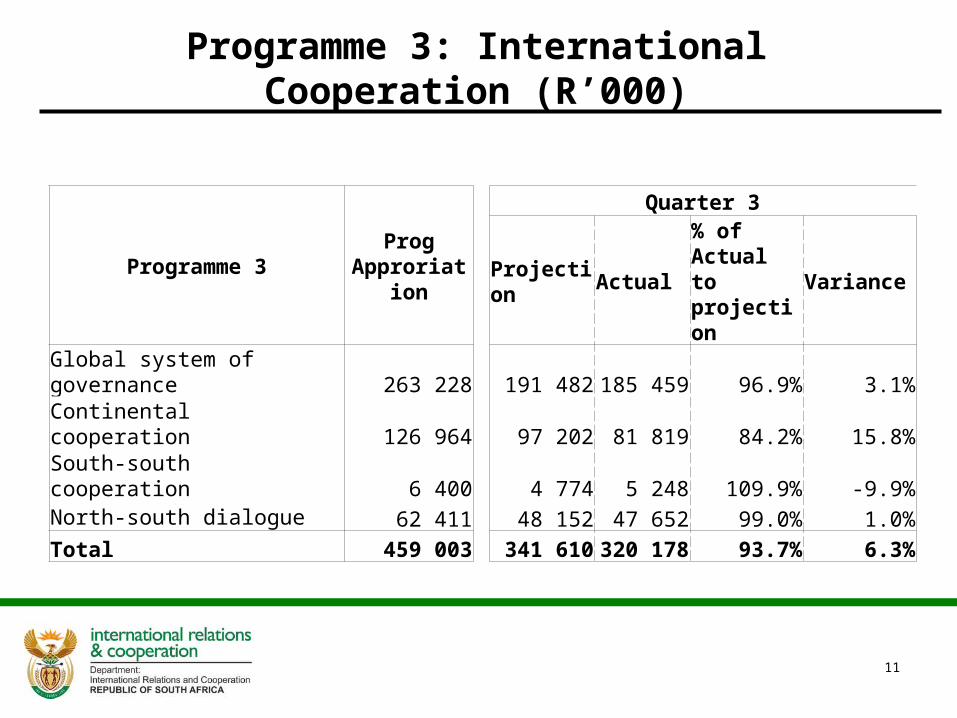
Programme 3: International Cooperation (R’000)
Programme 3 Prog Approriation
Quarter 3
Projection Actual % of Actual to projection
Variance
Global system of governance 263 228 191 482 185 459 96.9% 3.1%Continental cooperation 126 964 97 202 81 819 84.2% 15.8%South-south cooperation 6 400 4 774 5 248 109.9% -9.9%North-south dialogue 62 411 48 152 47 652 99.0% 1.0%Total 459 003 341 610 320 178 93.7% 6.3%

12
Programme 3 – Econ Classification (R’000)
Programme 3 - Econ Class Prog Approriation
Quarter 3
Projection Actual % of Actual to projection
Variance
Compensation of employees 271 640 196 973 193 938 98.5% 1.5%Goods and services 184 987 143 169 119 563 83.5% 16.5%Transfer payments 895 895 895 0.0% 0.0%Payments for capital assets 1 481 573 5 782 1009.1% -909.1%Total 459 003 341 610 320 178 93.7% 6.3%
Expenditure/projection as % of programme budget 74.4% 69.8% 4.7%

Total expenditure for the Programme as at the end of the first quarter amounts to R320.1 million or 69.8% of the programme’s total appropriation.
This expenditure is 6.3% lower than what the Programme had projected for the period.
The lower than projected expenditure was mainly under the subprogramme Continental Cooperation, which was 15.8% lower than projections as a result of major meetings that were not convened in the during the third quarter, including African Union Peace and Security Council (AUPSC) Summit and ministerial meetings; AU African Chiefs of Defence and Security Meeting, and New Partnership for Africa’s Development (NEPAD) summits, working group meetings, amongst others.
The overspending on Payments for capital assets is due to procurement of office furniture and equipment for officials that were seconded to the African Union Commission to Support the Chairperson, H.E Nkosazana Dlamini-Zuma.
13
Programme 3 continued….

14
Programme 4: State Protocol and Public Diplomatic
Programme 4 Prog Approriation
Quarter 3
Projection Actual % of Actual to projection
Variance
Public Diplomacy 61 871 48 714 55 739 114.4% -14.4%Protocol Services 192 597 137 064 152 001 110.9% -10.9%Total 254 468 185 778 207 740 111.8% -11.8% 100.0%Economic Classification Compensation of employees 123 396 92 586 86 388 93.3% 6.7%Goods and services 126 205 88 325 115 961 131.3% -31.3%Transfer payments 4 427 4 427 4 427 100.0% 0.0%Payments for capital assets 440 440 964 219.1% -119.1%Total 254 468 185 778 207 740 111.8% -11.8% Expenditure/projection as % of programme budget 73.0% 81.6% -8.6%
Total expenditure for the Programme as at the end of the first quarter amounts to R207.7 million or 81.6% of the programme’s total appropriation.
Expenditure for this programme is 11.8% higher than what had been projected for the period. This is mainly due expenditure incurred by the department for facilitating State Visits and providing protocol services during the funeral of the late and Former President Nelson Mandela.
The expenditure was not budgeted, it was unforeseen.
15
Programme 4 continued….

16
Programme 5: International Transfers
Programme 5 Prog Approriation
Quarter 3
Projection Actual % of Actual to projection Variance
Departmental agencies 513 942 480 692 476 949 99.2% 0.8%Membership contribution 438 431 292 684 193 490 66.1% 33.9%Total 952 373 773 376 670 439 86.7% 13.3%Economic Classification Transfer payments 952 373 773 376 670 438 86.7% 13.3%Total 952 373 773 376 670 438 86.7% 13.3%
Expenditure/projection as % of programme budget 81.2% 70.4%
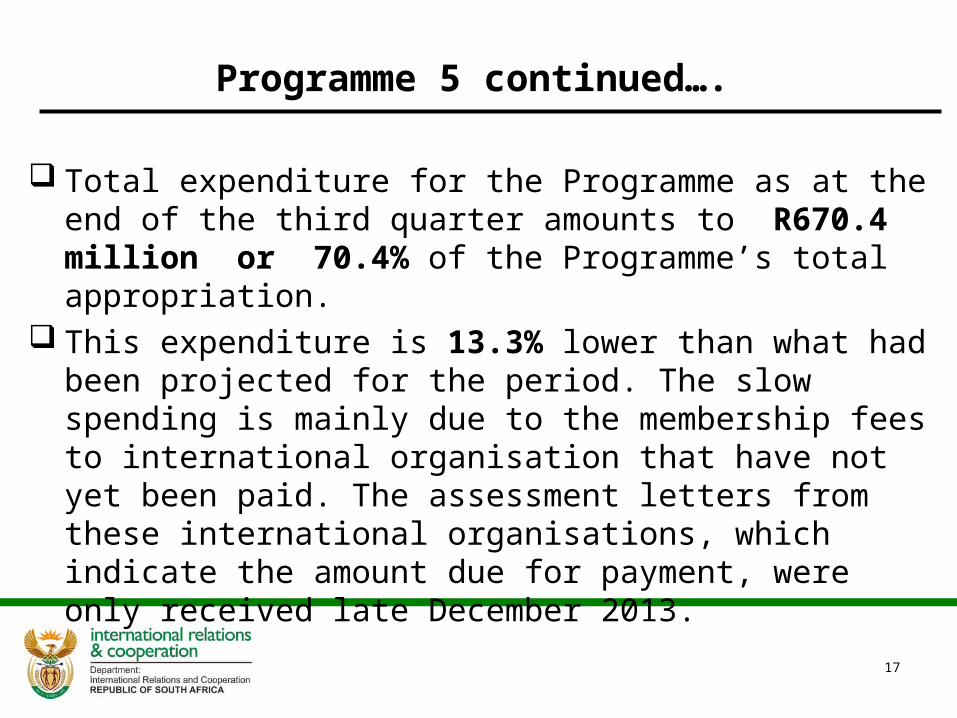
Total expenditure for the Programme as at the end of the third quarter amounts to R670.4 million or 70.4% of the Programme’s total appropriation.
This expenditure is 13.3% lower than what had been projected for the period. The slow spending is mainly due to the membership fees to international organisation that have not yet been paid. The assessment letters from these international organisations, which indicate the amount due for payment, were only received late December 2013.
17
Programme 5 continued….
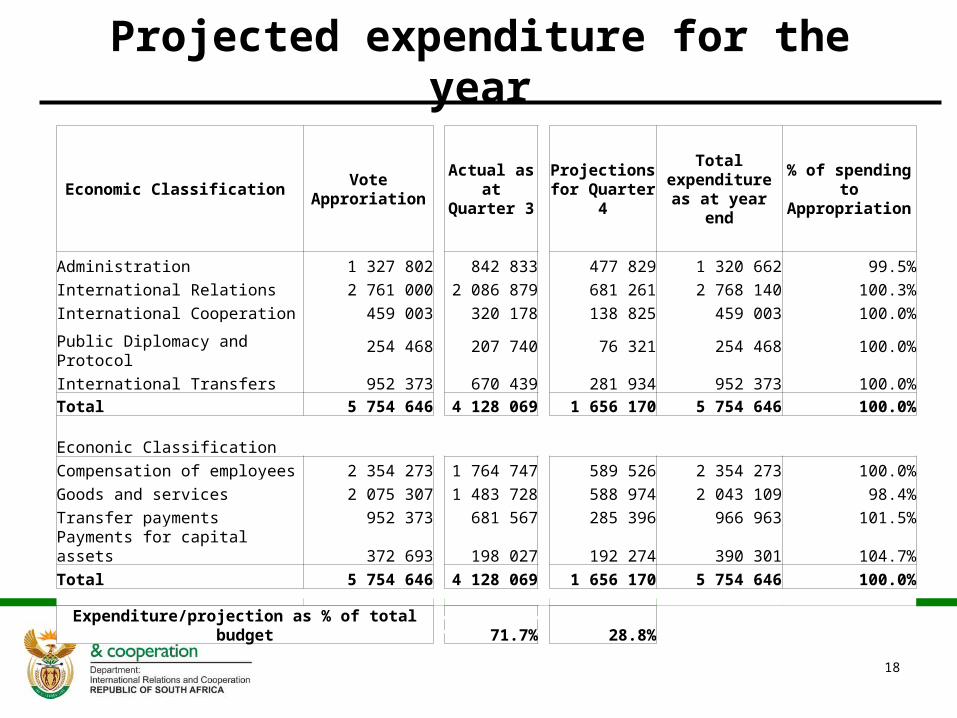
Projected expenditure for the year
Economic Classification Vote Approriation
Actual as at Quarter 3
Projections for
Quarter 4Total expenditure
as at year end% of spending to
Appropriation
Administration 1 327 802 842 833 477 829 1 320 662 99.5%International Relations 2 761 000 2 086 879 681 261 2 768 140 100.3%International Cooperation 459 003 320 178 138 825 459 003 100.0%
Public Diplomacy and Protocol254 468 207 740 76 321 254 468 100.0%
International Transfers 952 373 670 439 281 934 952 373 100.0%Total 5 754 646 4 128 069 1 656 170 5 754 646 100.0%
Econonic Classification
Compensation of employees 2 354 273 1 764 747 589 526 2 354 273 100.0%Goods and services 2 075 307 1 483 728 588 974 2 043 109 98.4%Transfer payments 952 373 681 567 285 396 966 963 101.5%Payments for capital assets 372 693 198 027 192 274 390 301 104.7%Total 5 754 646 4 128 069 1 656 170 5 754 646 100.0%
Expenditure/projection as % of total budget 71.7% 28.8%
18
African Renaissance Fund (ARF)
19
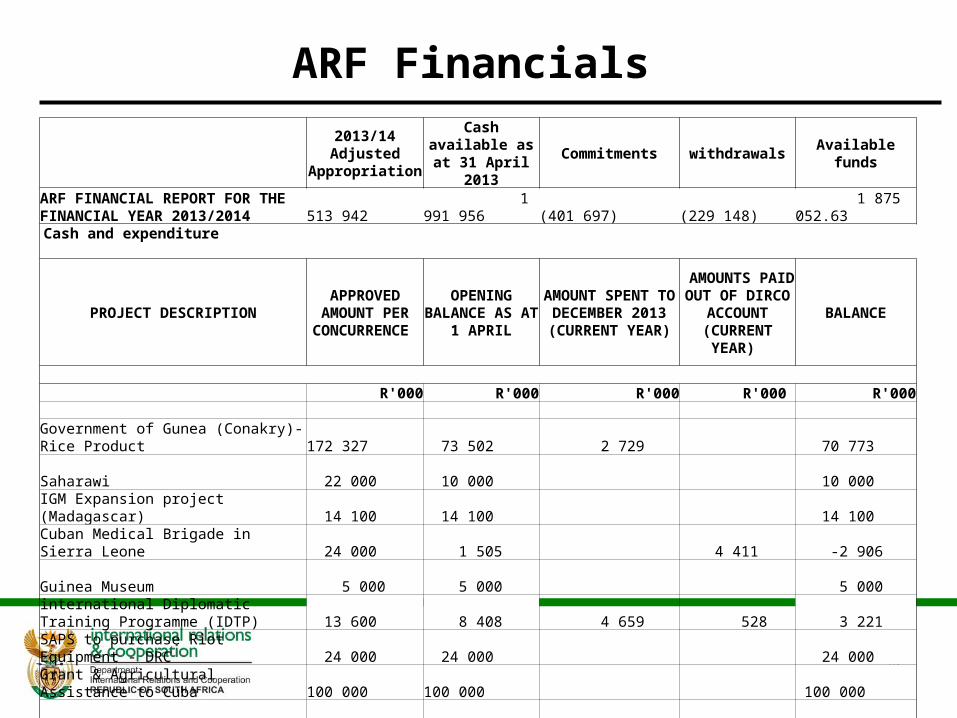
ARF Financials
20
2013/14 Adjusted Appropriation
Cash available as at 31 April 2013 Commitments withdrawals Available funds
ARF FINANCIAL REPORT FOR THE FINANCIAL YEAR 2013/2014 513 942 1 991 956 (401 697) (229 148) 1 875 052.63
Cash and expenditure
PROJECT DESCRIPTIONAPPROVED
AMOUNT PER CONCURRENCE
OPENING BALANCE AS AT 1
APRIL
AMOUNT SPENT TO DECEMBER 2013 (CURRENT YEAR)
AMOUNTS PAID OUT OF DIRCO
ACCOUNT (CURRENT YEAR)
BALANCE
R'000 R'000 R'000 R'000 R'000
Government of Gunea (Conakry)-Rice Product 172 327 73 502 2 729 70 773 Saharawi 22 000 10 000 10 000 IGM Expansion project (Madagascar) 14 100 14 100 14 100 Cuban Medical Brigade in Sierra Leone 24 000 1 505 4 411 -2 906 Guinea Museum 5 000 5 000 5 000 international Diplomatic Training Programme (IDTP) 13 600 8 408 4 659 528 3 221 SAPS to purchase Riot Equipment - DRC 24 000 24 000 24 000 Grant & Agricultural Assistance to Cuba 100 000 100 000 100 000 -

21
Cash and expenditure
PROJECT DESCRIPTION APPROVED AMOUNT PER CONCURRENCE
OPENING BALANCE AS AT 1 APRIL
AMOUNT SPENT TO DECEMBER 2013 (CURRENT YEAR)
AMOUNTS PAID OUT OF DIRCO ACCOUNT
(CURRENT YEAR) BALANCE
R'000 R'000 R'000 R'000 R'000PROJECTS APPROVED IN THE FINANCIAL YEAR 2012/2013 -
-
South Africa's Participation at the SADC Observer Mission 2012/2013 (AU AND SADC ELEC) 5 000 1 957 1 957 -
Humanitarian assistance to Niger (NIGER) 96 000 9 336 4 237 5 100 VIP Protection Training to the DRC Protection Unit SAPS 647 647 647 DPSA DRC Census (DRC ELEC) 10 000 5 827 4 000 1 827 Electoral Assistance to Guinea Bissau (1 Million Euros) 11 325 5 735 5 735
The African Capacity Building Foundation (ACBF) 3 900 2 422 2 422
South Africa's Intervention in Sahel Region 250 000 135 550 1 884 133 666
African Ombudsman Research Centre (AORC) 21 200 14 100 14 100 Government of Malawi (US$ 35Million) 308 634 229 148 229 148 0
South African Humanitarian assistance in Somalia 39 900 67 67 - PROJECTS APPROVED IN THE FINANCIAL YEAR 2013/2014
-
Budget Support to Seychelles 7 714 7 714 7 714 - South Africa's Participation at the SADC Observer Mission 2013/2014 (AU AND SADC ELEC) 17 000 17 000 3 055 13 945 TOTAL 666 019 246 730 17 592 401 697
22
Thank you