digitalization of data analysis tools as the key …
TRANSCRIPT
ACCESS Journal:
Access to Science, Business, Innovation in Digital Economy
ISSN 2683-1007 (Online)
2021, 2(3), 222-233, https://doi.org/10.46656/access.2021.2.3(2) https://journal.access-bg.org/
222
DIGITALIZATION OF DATA ANALYSIS TOOLS AS THE KEY FOR
SUCCESS IN THE ONLINE TRADING MARKETS
Andrii Roskladka1, Roman Baiev2
1,2Kyiv National University of Trade and Economics, Kyiv, Ukraine
E-mails: [email protected], [email protected]
Received: 10 July 2021; Accepted: 04 August 2021; Online Published: 07 August 2021
ABSTRACT:
Digitalization is the process, which takes places in the contemporary world, severe competition in all markets, growing
demand for new and easy technologies, changing software user preferences, and much more. For the past decades of
years, the share of online forex trades that had place in the world accounted for more than 90% of all forex deals. This
article discusses the main points of the online trading, the prospects of this industry and key factors that may affect the
industry; also, the crucial attention was paid to the online trading tools segment, as a part of the immense market in
general and as a tool in the portfolio of every modern online trading specialist. The online commerce industry is one of
the largest and fastest growing sectors of the world economy. It creates jobs and assets, makes people richer and provides
truly equal access for all. An analysis of existing online trading tools, such as the MT4 platform, was conducted. The
main characteristics of online trade in European countries and the problems of its development in Ukraine are studied.
The main components of trade in the supply area were studied in detail. Based on the research of the authors, the
algorithmic rules of the automated trading system (expert advisor) were described and its software implementation is
created. Similar automated systems are especially helpful when specialists need to work with many charts and timeframes
at once, because the system might indicate the proper market situation better, and the system won’t have any human-
biased feelings, just pure strategies and algorithms.
Keywords: innovation, online trading, algorithmic trading, strategies, stocks, forex, digital economics
JEL classification: C190, G150, F370
Citation:
Roskladka, A., Baiev, R. (2021). Digitalization of data analysis tools as the key for success in the online trading markets.
Access to science, business, innovation in digital economy, ACCESS Press, 2(3): 222-233.
https://doi.org/10.46656/access.2021.2.3(2)
INTRODUCTION
The online trading tools are the possible key to make a decent fortune off the online markets of shares and
investments. According to the most trusted magazines, every prosperous entrepreneur, CEO or Head manager
nowadays possesses at least some assets in shares and short-term or long-term investments. Therefore, it might
not amaze that the online trading or online investments are ones of the most popular and most profitable and
at the same time ones of the most risky industries.
In this paper, we will pay thorough attention to the online trading market and the automated systems and
tools which are called to facilitate people who are willing to start off on these markets or who are seeking for
new methods to scale up their portfolios or bankrolls.
ACCESS Journal:
Access to Science, Business, Innovation in Digital Economy
ISSN 2683-1007 (Online)
2021, 2(3), 222-233, https://doi.org/10.46656/access.2021.2.3(2) https://journal.access-bg.org/
223
Human life is full of a variety of emotions, but not all of them are directly derived from the basic emotion
and might be helpful to establish the proper market conditions to make entries. Many academic papers
scientifically research human-biased emotions while they are trading (M.Douglas, 1995).
The online trading industry has been gaining its power for the past decades and to help us understand the
current conditions better we will review some latest studies from trusted broker research. (BN Research Report,
2018 & 2021)
The “robots” known as the automated trading systems (further in this article you might see the word
“system” which relates to the trading system with some predefined algorithms, acronym is “ATS”) are
controlling more and more financial operations, so the development works in this article tend to be actually in
step with the times (CNBC, Guy De Blonay, 2018)
Goals and objectives of the study. To be adaptive is one of the most demanded traits in our society at
present. People’s inherent behavior is often built on the two main factors as cues that might measure your
wealth, such as money and power, although, we are living in the modern era, where human qualities are being
treated accordingly, but a lot of us are willing to establish their own independent fund. The main purposes of
this work are to explore the markets of online trading and investments and develop new and successful
automated tools for these markets.
Results and Discussion. As of 2021, online trading industry is one of the most dynamically developing
sectors of the global economy, it creates jobs and assets, it makes people richer, and it provides truly equal
access for everyone.
Why this market is so crucial and needs more our attentions, considering the data from the study published
by the Contentworks Agency in 2019, only the global forex trading market worth is estimated to be around 2.4
quadrillion USD.(Contentworks Agency, 2021)
This example should suffice to prove the contention as per Visual Capitalist studies, money can make you
happier and can provide you more items of your wish. (Charted: Money Can Buy Happiness After All, 2021.
The most significant highlights from the online trading market are listed and described beneath:
1. According to BIS’s 2019 triennial survey, trading in FX markets reached an incredible $6.6 trillion per
day in April 2019. It’s comparable to the entire GDP for a year of Germany and Italy combined.
2. The worth of the entire global forex trading market is estimated to approximately $2.4 quadrillion – in
other words, around $2409 trillion.
3. Over 85% of the global forex market transactions happen on just 7 major pairs GBPUSD, EURUSD,
USDJPY, AUDUSD, NZDUSD, USDCHF, USDCAD. The automated trading system which was built
conceives all these currency pairs and analyzes them best. During the development and testing work vast
majority of time the system was run on these pairs and showed positive results.
4. Only about 15% of forex traders make a profit. When the authors first viewed this number, it was
perceived as a challenge to create a special tool that will be performing positive on the markets and making
ACCESS Journal:
Access to Science, Business, Innovation in Digital Economy
ISSN 2683-1007 (Online)
2021, 2(3), 222-233, https://doi.org/10.46656/access.2021.2.3(2) https://journal.access-bg.org/
224
profits off the currency pairs or stokes the tool would be applied to (Forex Statistics & Trader Results From
Around the World, 2020).
5. The most popular trading platform is still the classic MT4, which is used by 85% of traders. The second
most popular platform is the MT5, which is used by only 6% of traders (BIS-2019 Quarterly Review, 2019).
6. There are approximately 10 million forex traders in the world in 2017 and over 14 million in 2020 (BN
Research Report, 2021).
7. The US Dollar is the most popular forex trading currency – with 88.3% of global trades involving the
ever-reliable greenback (Forex Trading Industry Statistics and Facts, 2020).
8. The second most popular currency in the forex market is the Euro – accounting for 32.3% of trades
(Forex Trading Industry Statistics and Facts, 2020).
Taking into consideration the facts listed, it was decided to think about developing the strategy and the
trading tool which will be suitable with the most popular pairs, from the fifth item it was decided to establish
the strategy for the MT4 trading accounts. The MT4 platform can be trusted as it makes possible placing trades
within seconds, the average response time which was counted during the strategy testing is less than 2 seconds,
when all factors are set properly.
The trading strategy all above should be connected to as many trading instruments (currency pairs, and
contiguous instruments as following: stocks, options, indices, etc.) as possible.
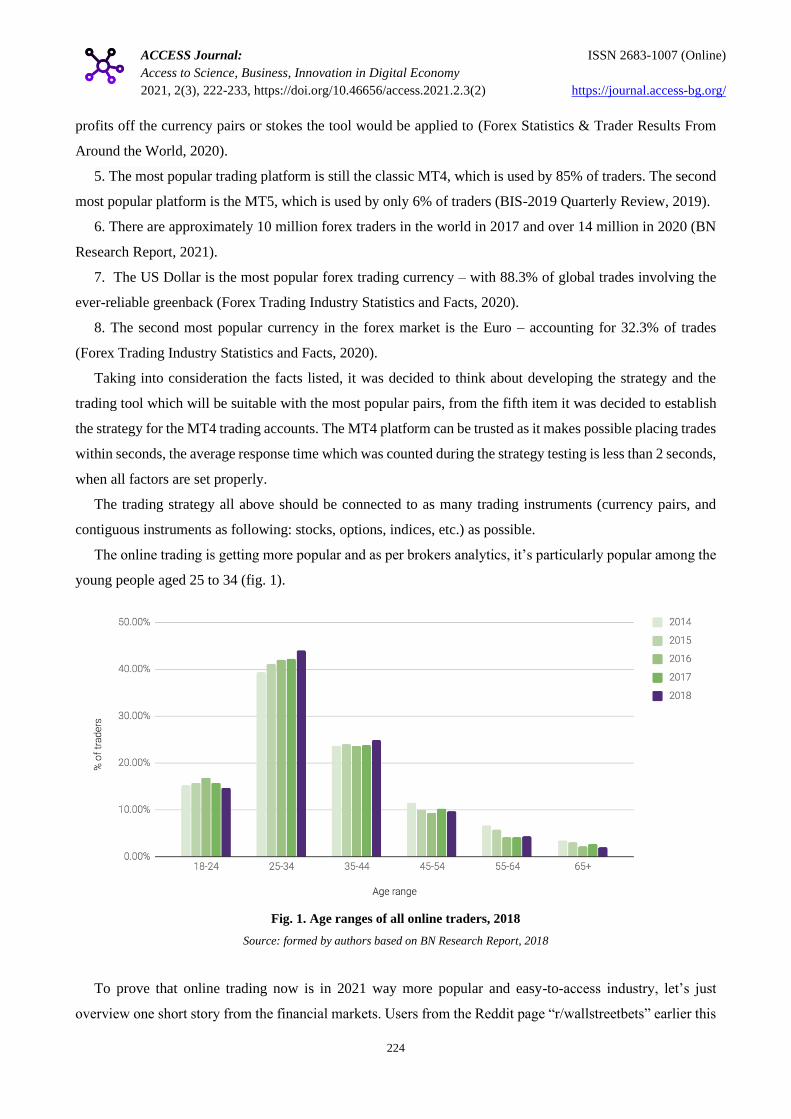
The online trading is getting more popular and as per brokers analytics, it’s particularly popular among the
young people aged 25 to 34 (fig. 1).
Fig. 1. Age ranges of all online traders, 2018
Source: formed by authors based on BN Research Report, 2018
To prove that online trading now is in 2021 way more popular and easy-to-access industry, let’s just
overview one short story from the financial markets. Users from the Reddit page “r/wallstreetbets” earlier this

ACCESS Journal:
Access to Science, Business, Innovation in Digital Economy
ISSN 2683-1007 (Online)
2021, 2(3), 222-233, https://doi.org/10.46656/access.2021.2.3(2) https://journal.access-bg.org/
225
year gobbled up stock from floundering chain GameStop, sending the price soaring and forcing institutional
investors who bet against the company to back out -- performing what's known as a "short squeeze." [8]
For several days, lots of big investors and huge hedge funds might have lost millions of dollars due to the
common work of the young traders, Reddit-users.
The industry clearly gains its popularity, in 2017 there were around 9.5 million registered online traders
with real trading accounts, whereas in 2021, there are over 13.9 million registered online traders, according to
The Modern Trader study and research papers, the 45% growth for mere 4 years. Not every industry is capable
to show such development over the past years.
Fig. 2. Number of registered online trading participants for the past 5 years, in millions
Source: created by authors based on BN Research Report, 2020.
According to the data above (Fig.2) we are able to spot the proper tendency on the financial markets, the
number of registered online traders who hold trading accounts with real money has been constantly growing
and the number will only keep raising as the financial market itself does.
The problem which arises: how to be prosperous in the field of online trading? Per the trading broker
research, only 15% of traders make constant profit off the online markets, and over one third of traders are
breaking even, which means they have neither significant losses nor profits for months or even years.
ACCESS Journal:
Access to Science, Business, Innovation in Digital Economy
ISSN 2683-1007 (Online)
2021, 2(3), 222-233, https://doi.org/10.46656/access.2021.2.3(2) https://journal.access-bg.org/
226
And since about 15% of forex traders make constant profit, we have decided to think through and configure
the trading tool for online traders to help them profit more frequently from their daily trading transactions,
openings and closings. (Forex Statistics & Trader Results from Around the World, 2020)
For almost 3 years, one of article's authors had worked in one of the biggest trading brokers as a strategy
tester & customer care advocate. He operated close with clients, regular workers who started trading as a side
hustle, as well as with fund admins who had tens of years of experience in the markets. Therefore, author
started gaining more valuable understanding from the real experience communicating with real traders
throughout the world, from the USA to Germany, from China to Nigeria, he started analyzing the market and
feeling traders’ main wishes.
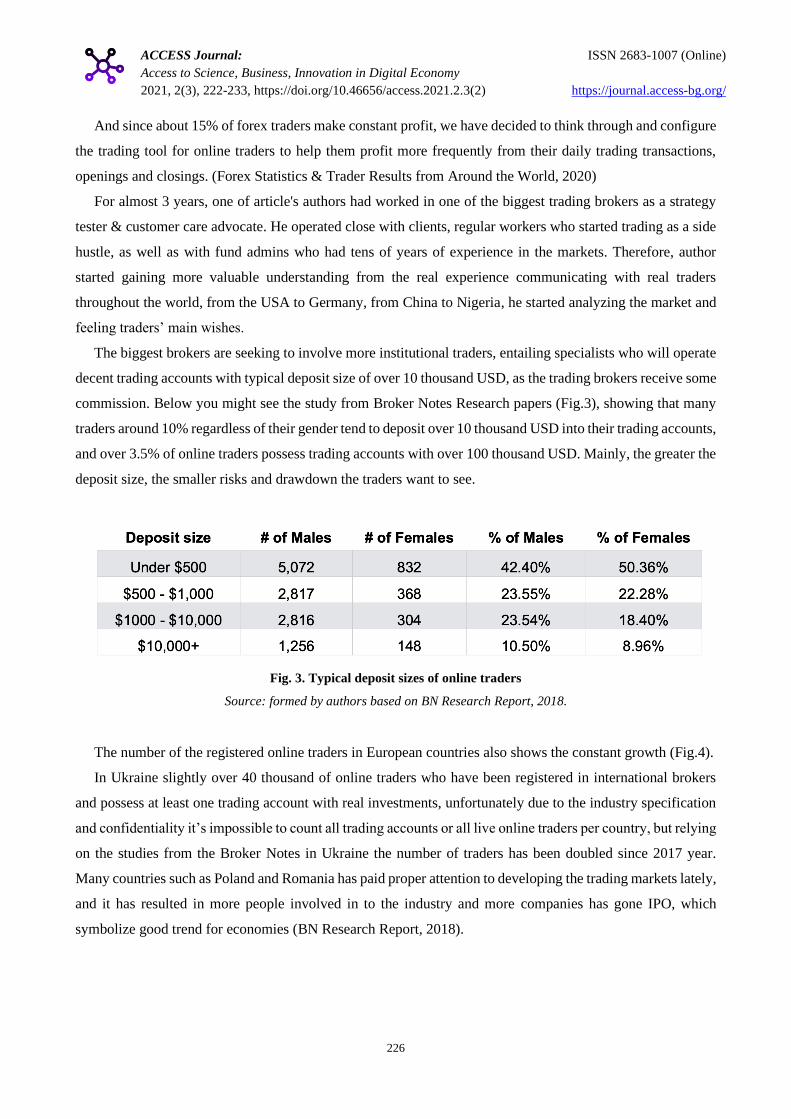
The biggest brokers are seeking to involve more institutional traders, entailing specialists who will operate
decent trading accounts with typical deposit size of over 10 thousand USD, as the trading brokers receive some
commission. Below you might see the study from Broker Notes Research papers (Fig.3), showing that many
traders around 10% regardless of their gender tend to deposit over 10 thousand USD into their trading accounts,
and over 3.5% of online traders possess trading accounts with over 100 thousand USD. Mainly, the greater the
deposit size, the smaller risks and drawdown the traders want to see.
Fig. 3. Typical deposit sizes of online traders
Source: formed by authors based on BN Research Report, 2018.
The number of the registered online traders in European countries also shows the constant growth (Fig.4).
In Ukraine slightly over 40 thousand of online traders who have been registered in international brokers
and possess at least one trading account with real investments, unfortunately due to the industry specification
and confidentiality it’s impossible to count all trading accounts or all live online traders per country, but relying
on the studies from the Broker Notes in Ukraine the number of traders has been doubled since 2017 year.
Many countries such as Poland and Romania has paid proper attention to developing the trading markets lately,
and it has resulted in more people involved in to the industry and more companies has gone IPO, which
symbolize good trend for economies (BN Research Report, 2018).

ACCESS Journal:
Access to Science, Business, Innovation in Digital Economy
ISSN 2683-1007 (Online)
2021, 2(3), 222-233, https://doi.org/10.46656/access.2021.2.3(2) https://journal.access-bg.org/
227
Fig. 4. Number of online traders in European countries, “K” means a thousand on this map, as per 2019.
Source: created by authors based on BN Research Report, 2021
Considering the data from the image above (Fig.4), we might see that the United Kingdom is in the first
place in Europe with more than 730 thousand online traders, the runner-up in Europe is with around 380
thousand of online traders.
For the past years, especially after the Brexit deal, two new trading hubs have been highlighted in Europe,
such as Amsterdam and Frankfurt, therefore, in the forthcoming reports, it’s expected to see intensive growth
of traders and deposited sums for the Netherlands and Germany.
Practical realization of the automated trading system. After diligent investigations in the area of the
automated trading systems and their strategies, it was determined to build the system on a foundation of the
demand and supply methods. Supply and demand trading is a trading method where the idea is to find points
in the market where the price has made a strong advance or decline and mark these areas as supply and demand
zones using rectangles, which are shown in the image, orange rectangles for sell-positions and blue rectangles
for buy-positions.
ACCESS Journal:
Access to Science, Business, Innovation in Digital Economy
ISSN 2683-1007 (Online)
2021, 2(3), 222-233, https://doi.org/10.46656/access.2021.2.3(2) https://journal.access-bg.org/
228
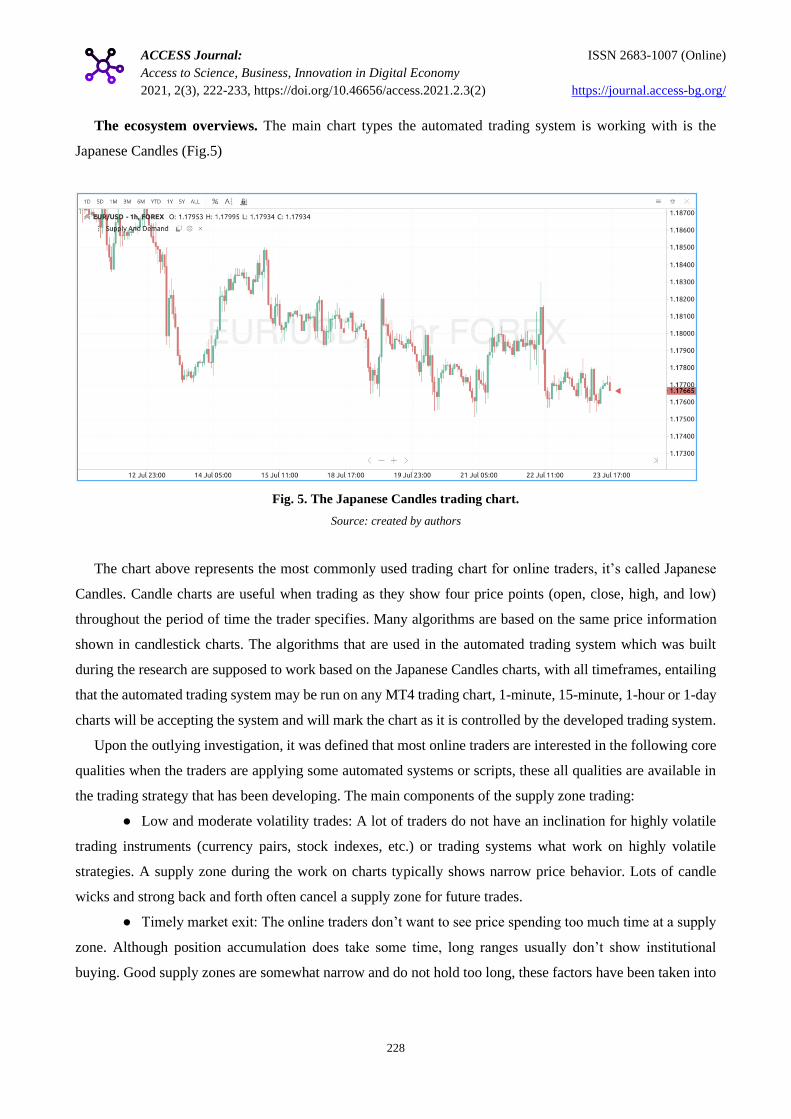
The ecosystem overviews. The main chart types the automated trading system is working with is the
Japanese Candles (Fig.5)
Fig. 5. The Japanese Candles trading chart.
Source: created by authors
The chart above represents the most commonly used trading chart for online traders, it’s called Japanese
Candles. Candle charts are useful when trading as they show four price points (open, close, high, and low)
throughout the period of time the trader specifies. Many algorithms are based on the same price information
shown in candlestick charts. The algorithms that are used in the automated trading system which was built
during the research are supposed to work based on the Japanese Candles charts, with all timeframes, entailing
that the automated trading system may be run on any MT4 trading chart, 1-minute, 15-minute, 1-hour or 1-day
charts will be accepting the system and will mark the chart as it is controlled by the developed trading system.
Upon the outlying investigation, it was defined that most online traders are interested in the following core
qualities when the traders are applying some automated systems or scripts, these all qualities are available in
the trading strategy that has been developing. The main components of the supply zone trading:
● Low and moderate volatility trades: A lot of traders do not have an inclination for highly volatile
trading instruments (currency pairs, stock indexes, etc.) or trading systems what work on highly volatile
strategies. A supply zone during the work on charts typically shows narrow price behavior. Lots of candle
wicks and strong back and forth often cancel a supply zone for future trades.
● Timely market exit: The online traders don’t want to see price spending too much time at a supply
zone. Although position accumulation does take some time, long ranges usually don’t show institutional
buying. Good supply zones are somewhat narrow and do not hold too long, these factors have been taken into

ACCESS Journal:
Access to Science, Business, Innovation in Digital Economy
ISSN 2683-1007 (Online)
2021, 2(3), 222-233, https://doi.org/10.46656/access.2021.2.3(2) https://journal.access-bg.org/
229
consideration during the development works of the automated trading system. A shorter accumulation zone
works better for finding re-entries during pullbacks that are aimed at picking up open interest.
Good supply zones are somewhat narrow and do not hold too long. A shorter accumulation zone works better
for finding re-entries during pullbacks that are aimed at picking up open interest.
● The false springs on the charts: The projected automated system doesn’t count few candles on the
chart, the algorithms tries to annihilate wrong entries, which doesn’t result in many open positions after false
springs on the trading charts.
● Strong force leaving the zone: This point is one of the most important, which I have explored during
speaking sessions with traders and trading broker clients. At one point, price leaves the supply zone and starts
trending. A strong imbalance between buyers and sellers leads to strong and explosive price movements. As a
rule of thumb, remember that the stronger the breakout, the better the demand zone and the more open interest
will usually still exist – especially when the time spent at the accumulation was relatively short.
When price goes from selling off to a strong bullish trend, there had to be a significant amount of buy
interest entering the market, absorbing all sell orders and then driving price higher – and vice versa. Always
look for extremely strong turning points; they are often high probability price levels.
When should we consider using this automated trading system, which is built on the concept of supply and
demand?
When we know the support and resistance zones. Supply and demand zones are natural support and
resistance levels, and it pays off to have them on your charts for numerous reasons. Combining traditional
support and resistance concepts with supply and demand can help traders understand price movements in a
much clearer way. The concepts of trading level support and resistance are undoubtedly two of the most highly
discussed attributes of technical analysis in trading. Part of analyzing chart patterns, these terms are used by
traders to refer to price levels on charts that tend to act as barriers, preventing the price of an asset from getting
pushed in a certain direction. Support levels are usually lows on the charts, and resistance levels are highs.
While applying the system, supply and demand zones can be easily found just below/above support and
resistance levels.
When we are interested in having automatically populated Stop Loss and Take Profit points. When it comes
to profit placement, supply and demand zones can be a great tool. The developed system always places the
profit target ahead of a zone so that the traders who apply it don’t risk giving back all profits when the open
interest in that zone is filled.
Discovery of the new supply and demand technology has been the best practicalities for the change on the
markets. Since the very beginning of applying the strategy, it has been a great help for the online traders and
trading institutions who may operate millions of dollars.
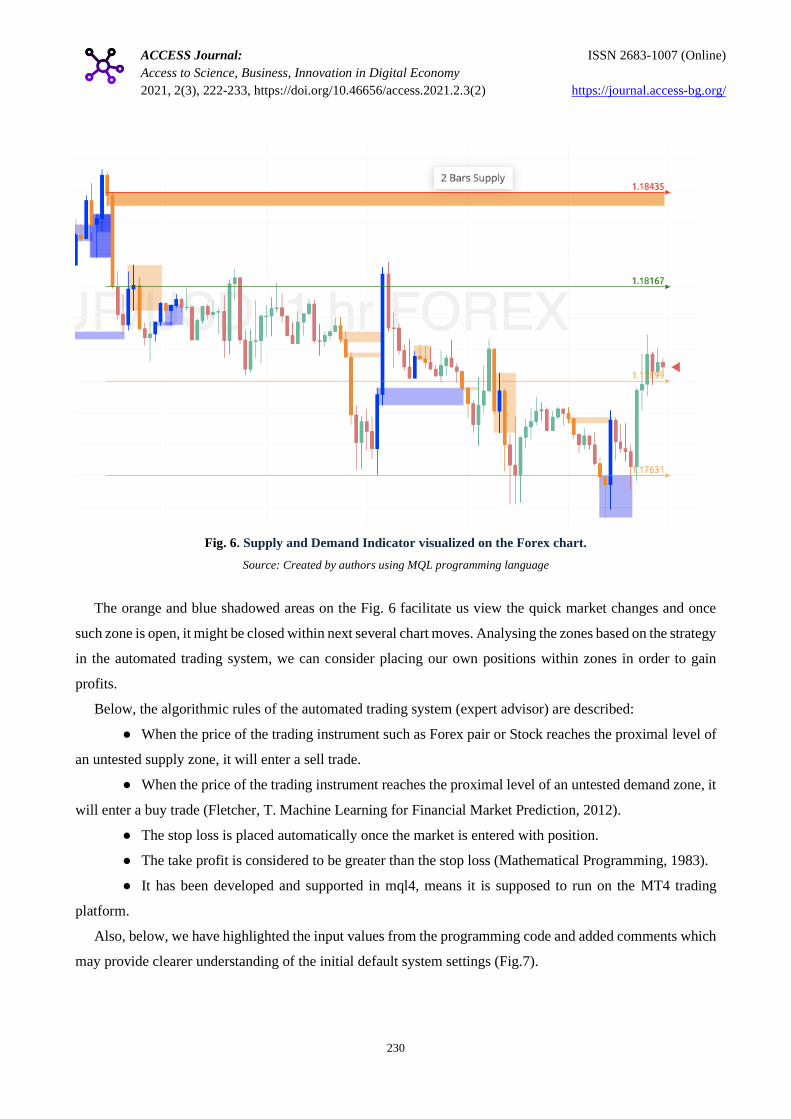
The Supply and Demand indicator which has been build during the development works visualized on the
Forex chart using the MT4 trading account (Fig.6). The indicators also shows red and green lines, which might
be interpreted as suitable places for opening, closing, and keeping open the market positions.
ACCESS Journal:
Access to Science, Business, Innovation in Digital Economy
ISSN 2683-1007 (Online)
2021, 2(3), 222-233, https://doi.org/10.46656/access.2021.2.3(2) https://journal.access-bg.org/
230
Fig. 6. Supply and Demand Indicator visualized on the Forex chart.
Source: Created by authors using MQL programming language
The orange and blue shadowed areas on the Fig. 6 facilitate us view the quick market changes and once
such zone is open, it might be closed within next several chart moves. Analysing the zones based on the strategy
in the automated trading system, we can consider placing our own positions within zones in order to gain
profits.
Below, the algorithmic rules of the automated trading system (expert advisor) are described:
● When the price of the trading instrument such as Forex pair or Stock reaches the proximal level of
an untested supply zone, it will enter a sell trade.
● When the price of the trading instrument reaches the proximal level of an untested demand zone, it
will enter a buy trade (Fletcher, T. Machine Learning for Financial Market Prediction, 2012).
● The stop loss is placed automatically once the market is entered with position.
● The take profit is considered to be greater than the stop loss (Mathematical Programming, 1983).
● It has been developed and supported in mql4, means it is supposed to run on the MT4 trading
platform.
Also, below, we have highlighted the input values from the programming code and added comments which
may provide clearer understanding of the initial default system settings (Fig.7).

ACCESS Journal:
Access to Science, Business, Innovation in Digital Economy
ISSN 2683-1007 (Online)
2021, 2(3), 222-233, https://doi.org/10.46656/access.2021.2.3(2) https://journal.access-bg.org/
231
input double lotSize = 0.01; //Lot Size
input Switch Buy = 0; //Buy
input Switch Sell = 0; //Sell
input Switch Strategy1 = 0; //Strategy1
input Switch Strategy2 = 0; //Strategy2
input Switch Strategy3 = 0; //Strategy3
input int Limit = 3; //Limit
input Switch takeProfit = 0; //Take Profit by Pips
extern double pipsAmount = 100; //Pips Amount for Take Profit
input trailEnum Trailing = 0; //Trailing Stop
input double addLotSize = 0.01; //Lot Size Step Increase
input int maxSteps = 3; //Max Steps
input Switch TwoBar = 0; //2 Bar
input Switch Trap = 0; //Trap
input Switch Major = 0; //Major Turn
input string tradeComment = "SD Custom"; //Trade Comment
input int Magic = 556; //Magic
Fig. 7. Input details in the code of the automated trading system.
Source: Created by authors for the MT4 Trading Platform
The input details can be adjusted as the system is starting. While using the automated trading system, it’s
easy to change the values for Take Profit or Stop Loss entries. (Fletcher, T. Machine Learning for Financial
Market Prediction, 2021)
The system has been designed to be able to determine the best zones on the trading charts to enter the
market with new positions.
The main premise of supply and demand strategy which is built in the automated trading system is when
the market makes a sharp move up or down the large institutions i.e. banks/hedge funds are not able to get
their entire trade placed into the market, therefore they leave pending orders to buy or sell at the zone with the
expectation the market will return to the zone and the rest of their trading position will be filled.
Strategy testing results have displayed strong leaning for placing the proper market positions on the charts.
During trial runs on different timeframes and charts, the developed Supply and Demand strategy has shown
positive performance. The system works best with 1-hour and 4-hour timeframes, as it’s mainly developed
using this timeframe to avoid any high-volatility and high-liquidity zones.

ACCESS Journal:
Access to Science, Business, Innovation in Digital Economy
ISSN 2683-1007 (Online)
2021, 2(3), 222-233, https://doi.org/10.46656/access.2021.2.3(2) https://journal.access-bg.org/
232
As follows, the automated trading system built on the Supply and Demand strategy has shown strong
positive performance on main currency pairs and other trading instruments, thus the system might be applied
to a versatile portfolio and for different investment types, might it be short-term as well as long-term runs.
CONCLUSIONS
More and more automated trading systems are being launched on the financial markets, over 80% of all trades
are under the control of such systems, thus it’s particularly important to get the topic well sorted out (CNBC,
2018). Similar automated systems are especially helpful when specialists need to work with many charts and
timeframes at once, because the system might indicate the proper market situation better, and the system won’t
have any human-biased feelings, just pure strategies and algorithms.
Many thoughts from the market leaders have been construed during the work on the article and the
automated trading system in order to receive the best practices. As regards the forthcoming prospects, the
automated system and algorithms will handle more and more trading operations and market specialists will
seek for the best options for their funds.
Conflict of interests
The authors declare no conflict of interest.
References
ABC News, (2021). GameStop Timeline [Electronic resource] Access mode: https://abcn.ws/2Vc1X2C
Bennett, M. J. (1986). Proving Correctness of Asynchronous Circuits Using Temporal Logic [Electronic resource] Access
mode: https://bit.ly/3eW3dxO
Bennett, M. J. (2014). Data Mining with Markowitz Portfolio Optimization in Higher Dimensions, [Electronic resource]
Access mode: https://bit.ly/3BEp6eX
BIS, (2019). Quarterly Review, International banking and financial market developments [Electronic resource] Access
mode: https://www.bis.org/publ/qtrpdf/r_qt1912.pdf
Bodie, Z., Kane, A., Marcus, A. (2013). Investments, Tenth Edition. McGraw-Hill, September.
Broker Notes Research Report, (2018). THE MODERN TRADER Edition 2018 [Electronic resource] Access mode:
https://bit.ly/3rxZls9
Broker Notes Research Report, (2021). THE MODERN TRADER Edition 2021 [Electronic resource] Access mode:
https://bit.ly/2UREfJ4
Carmona, R. (2004). Statistical Analysis of Financial Data in S-Plus, Springer Texts in Statistics.
CNBC, Guy De Blonay (2018). Sell-offs could be down to machines that control 80% of the US stock market [Electronic
resource] Access mode: https://cnb.cx/3eWfgv8
Contentworks Agency, (2019). Forex Statistics Study Portfolio [Electronic resource] Access mode: https://bit.ly/3yc4A3i
Douglas, M. (1995). Trading in the Zone: Master the Market with Confidence, Discipline and a Winning Attitude. [Book]
Pp.5-14
Eddelbuettel, D., Sanderson, C. (2014). RcppArmadillo: Accelerating R with High-Performance C++ Linear Algebra.
Computational Statistics and Data Analysis, Volume 71.

ACCESS Journal:
Access to Science, Business, Innovation in Digital Economy
ISSN 2683-1007 (Online)
2021, 2(3), 222-233, https://doi.org/10.46656/access.2021.2.3(2) https://journal.access-bg.org/
233
Fletcher, T. (2012). Machine Learning for Financial Market Prediction, Ph.D. Thesis, University College of London,
[Electronic resource] Access mode: https://bit.ly/3yaNX7W
Fletcher, T., Hussain, Z., Shawe-Taylor, J. (2010). Multiple Kernel Learning on the Limit Order Book. JMLR
Proceedings, 11: pp. 167–74. [Electronic resource] Access mode: https://bit.ly/3eW7HVh
Forex.com, (2020). Forex Trading Industry Statistics and Facts [Electronic resource] Access mode:
https://bit.ly/3BAhhXH
ForexSchool, (2020) Forex Statistics & Trader Results from Around the World [Electronic resource] Access mode:
https://bit.ly/36ZvFKK
FT. (2019). 2019 Forex Trading Stats for Marketers [Electronic resource] Access mode: https://bit.ly/2UFnSzx
Goldfarb, D., Idnani, A. (1983). A Numerically Stable Dual Method for Solving Strictly Convex Quadratic Programs.
Mathematical Programming. 27: pp. 1–33.
GoogleFinance.com (2021), Titanium Metals Corp (NYSE:TIE), July 2021. [Electronic resource] Access mode:
www.google.com/finance
Morandat, F., Hill, B., Osvald, L., Vitek, J. (2012). Evaluating the Design of the R Language, ECOOP 2012-Object-
Oriented Programming, 104-131.
Shreve, S. (2004). Stochastic Calculus for Finance I, The Binomial Asset Pricing Model. New York: Springer.
Shreve, S. (2004). Stochastic Calculus for Finance II, Continuous Time Models. New York: Springer.
Stern NY, (2010). Damodaran, A. Notes from New York University Stern School of Business, [Electronic resource]
Access mode: https://bit.ly/3zyTsO3
Visual Capitalist, C. (2021). Charted: Money Can Buy Happiness After All [Electronic resource] Access mode:
https://www.visualcapitalist.com/chart-money-can-buy-happiness-after-all/
About the authors Andrii ROSKLADKA
Doctor of Sciences in Economics, Professor,
Head of the Digital Economics and System Analysis Department, Kyiv
National University of Trade and Economics, Ukraine.
Research interests: Data Science, Data Mining, Business Intelligence,
Statistical Analysis, Forecasting methods, Mathematical and Computer
Modelling
ORCID ID: https://orcid.org/0000-0002-1297-377X
Roman BAIEV
PhD Student, Faculty of Information Technologies, Kyiv National University
of Trade and Economics, Ukraine.
Research interests: Data analysis, financial analysis, statistics, visualization,
financial trading markets, statistical maps and studies, programming.
Practical activities: QA Strategy Tester and Customer Care for one of world’s
biggest trading brokers, Technical Project Manager for international IT-
company
ORCID ID: https://orcid.org/0000-0001-5803-2257
Copyright © 2020 by author(s) and ACCESS Publishing Press This work is licensed under the
Creative Commons Attribution International License (CC BY)