digital three-dimensional …d-scholarship.pitt.edu/8154/1/gornickmatthewc_2011.pdf5.1.1 3dmdface...
TRANSCRIPT
DIGITAL THREE-DIMENSIONAL PHOTOGRAMMETRY: ACCURACY AND PRECISION OF FACIAL MEASUREMENTS OBTAINED FROM TWO
COMMERCIALLY-AVAILABLE IMAGING SYSTEMS
by
Matthew Charles Gornick
BS, Duquesne University, 2004
DMD, University of Pittsburgh, 2008
Submitted to the Graduate Faculty of
School of Dental Medicine in partial fulfillment
of the requirements for the degree of
Master of Dental Science
University of Pittsburgh
2011

ii
UNIVERSITY OF PITTSBURGH
SCHOOL OF DENTAL MEDICINE
This thesis was presented
by
Matthew Charles Gornick
It was defended on
April 29th, 2011
and approved by
Richard Doerfler, DMD, MA, MS, MDS, Assistant Clinical Professor, Department of
Orthodontics and Dentofacial Orthopedics
Mark Mooney, PHD, Department Chair and Professor, Department of Oral Biology
Thesis Director: Seth Weinberg, PHD, Assistant Professor, Department of Oral Biology

iii
Copyright © by Matthew Charles Gornick
2011

iv
Traditionally, direct anthropometry, two-dimensional (2D) photogrammetry and cephalometry
have served as primary methods to quantify craniofacial characteristics. Stereophotogrammetry,
a more recent method, is able to capture a three-dimensional (3D) image of a subject’s facial
surface almost instantaneously. This image can then later be measured in a variety ways,
allowing the calculation of linear distances and the quantification of angles, surface areas and
volumes. Several 3D stereophotogrammetric systems are commercially available and although
some systems have been independently validated, little is known about how measurement data
generated by different systems compare. The objective of this study is to evaluate the accuracy
and precision of craniofacial measurements obtained using different 3D stereophotogrammetry
systems (3dMDface and Vectra 3D) by comparing their values to each other and to
measurements obtained using a Microscribe mechanical digitizer. The study sample consisted of
18 mannequin heads, pre-labeled with 28 anthropometric landmarks. All possible inter-
landmark distances (n = 378) were calculated and several error magnitude statistics were used to
compare facial measurement techniques: mean absolute difference (MAD), relative error
magnitude (REM), technical error of measurement (TEM) and intraclass correlation coefficient
(ICC). Overall, measurements across all three facial measurement techniques were highly
comparable. Over 99% of MAD values were less than 1 mm and over 99% of REM scores were
DIGITAL THREE-DIMENSIONAL PHOTOGRAMMETRY: ACCURACY AND PRECISION OF FACIAL MEASUREMENTS OBTAINED FROM TWO
COMMERCIALLY-AVAILABLE IMAGING SYSTEMS
Matthew Charles Gornick, D.M.D, M.D.S.
University of Pittsburgh, 2011
v
deemed excellent or very good (REM < 4%). Similarly, 100% of TEM values were less than 1
mm and the average ICC across all 378 measures was above 0.99 for all possible method
comparisons. Based on the constructed confidence intervals, none of the observed MAD, REM,
TEM or ICC values for any of the 378 variables significantly exceeded our predefined error
thresholds (p > 0.05). Thermal maps depicting 3D surface-to-surface comparisons also showed
negligible differences, with an average Root Mean Squared value across all 18 3D models of
0.197 mm. Results indicate that measurements derived from the Vectra-3D and 3dMDface
imaging systems are virtually identical. Furthermore, both systems demonstrated similarly high
levels of accuracy when compared to the Microscribe digitizer. Both imaging systems produce
facial measurements sufficiently similar to allow for their data to be combined or compared
statistically.

vi
TABLE OF CONTENTS
PREFACE .................................................................................................................................. XII
1.0 INTRODUCTION ...................................................................................................... 13
2.0 REVIEW OF THE LITERATURE .......................................................................... 16
2.1 MEASURING FACIAL SURFACE FEATURES .......................................... 16
2.2 VALIDATION OF 3D PHOTOGRAMMETRY ............................................ 18
2.3 DIRECT COMPARISON OF 3D SYSTEMS ................................................. 25
3.0 STATEMENT OF THE PROBLEM AND STUDY OBJECTIVES ..................... 28
4.0 MATERIALS AND METHODS .............................................................................. 30
4.1 SAMPLE DESCRIPTION ................................................................................ 30
4.2 DATA ACQUISITION ...................................................................................... 30
4.3 QUANTITATIVE ANALYSIS ......................................................................... 42
5.0 RESULTS ................................................................................................................... 47
5.1 ACCURACY ...................................................................................................... 47
5.1.1 3dMDface system versus Microscribe digitizer .......................................... 47
5.1.2 Vectra 3D System versus Microcribe Digitizer ........................................... 59
5.2 PRECISION ....................................................................................................... 70
5.2.1 3dMDface system versus Vectra 3D system ................................................ 70
5.3 QUALITATIVE IMPRESSIONS .................................................................... 86

vii
6.0 DISCUSSION ............................................................................................................. 88
BIBLIOGRAPHY ....................................................................................................................... 93
viii
LIST OF TABLES
Table 1. Landmark definitions ...................................................................................................... 33
Table 2. Frequency of REM values by error category across the three main comparisons .......... 49
Table 3. Error statistics for 3dMD versus Microscribe averaged across all 378 linear distances 49
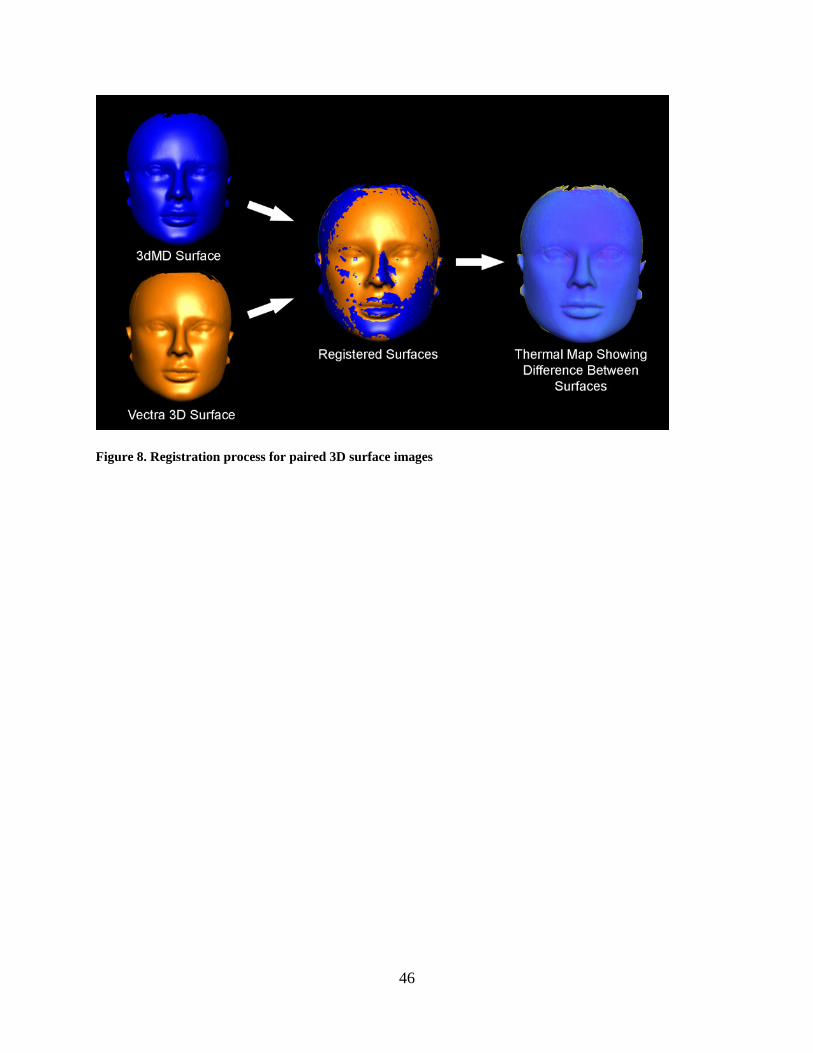
Table 4. 3dMD versus Microscribe: the ten linear distances associated with the highest degree of
error for each of the four different error magnitude statistics ....................................................... 50
Table 5. Error statistics for Vectra versus Microscribe averaged across all 378 linear distances 60
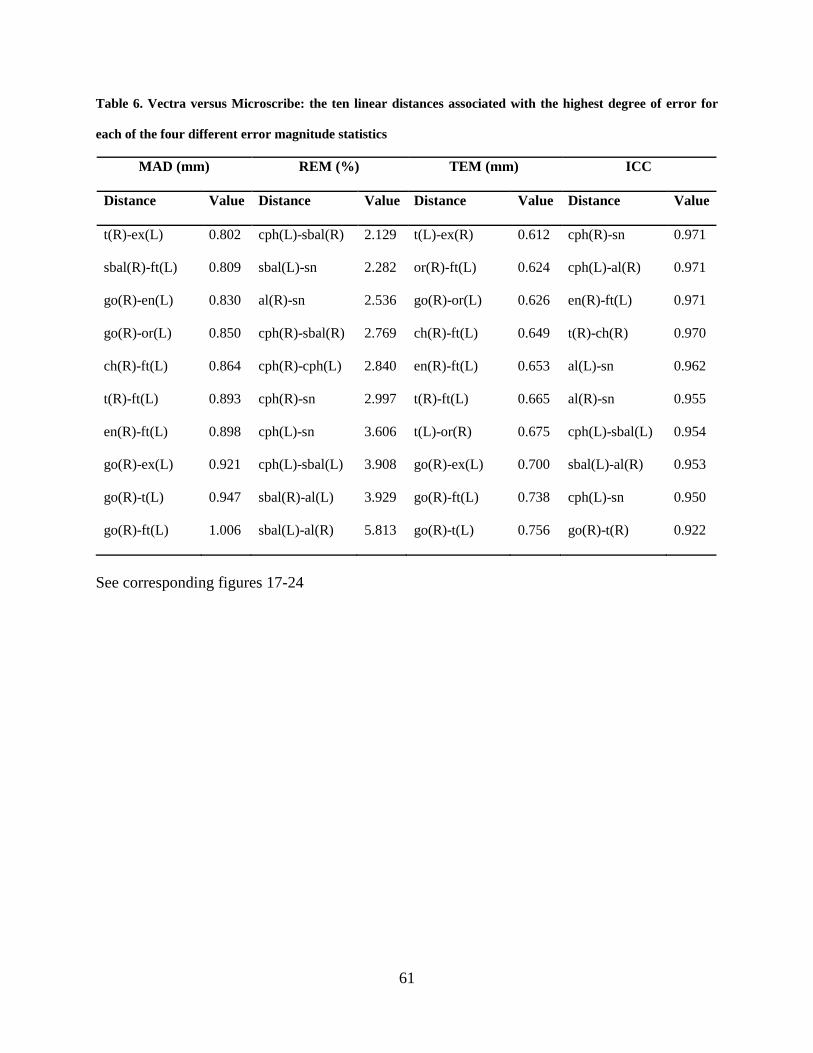
Table 6. Vectra versus Microscribe: the ten linear distances associated with the highest degree of
error for each of the four different error magnitude statistics ....................................................... 61
Table 7. Error statistics for 3dMD versus Vectra averaged across all 378 linear distances ......... 71
Table 8. 3dMD versus Vectra: the ten linear distances associated with the highest degree of error
for each of the four different error magnitude statistics ............................................................... 72
Table 9. Surface Registration Statistics Comparing 3dMD and Canfield Vectra 3D Models ...... 82
ix
LIST OF FIGURES
Figure 1. Sample mannequin head with order and abbreviation of landmarks labeled ................ 32
Figure 2. Custom tripod mount ..................................................................................................... 36
Figure 3. Commercial angle meter for recording mannequin sagittal head orientation ............... 36
Figure 4. 3dMDface system prepared for mannequin head image acquisition ............................. 37
Figure 5. Vectra 3D Imaging system ............................................................................................ 38
Figure 6. Example of a 3dMD 3D image ...................................................................................... 39
Figure 7. Microscribe 3DX 3-dimensional digitizer with custom-built holding device ............... 41
Figure 8. Registration process for paired 3D surface images ....................................................... 46
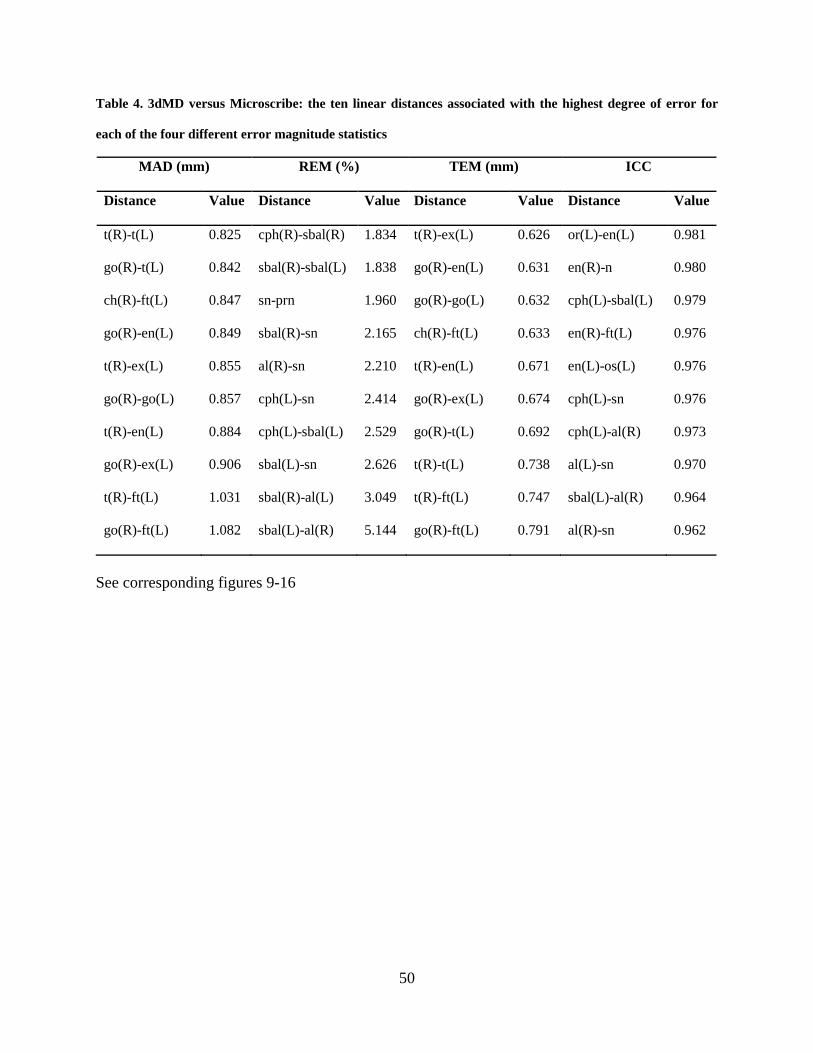
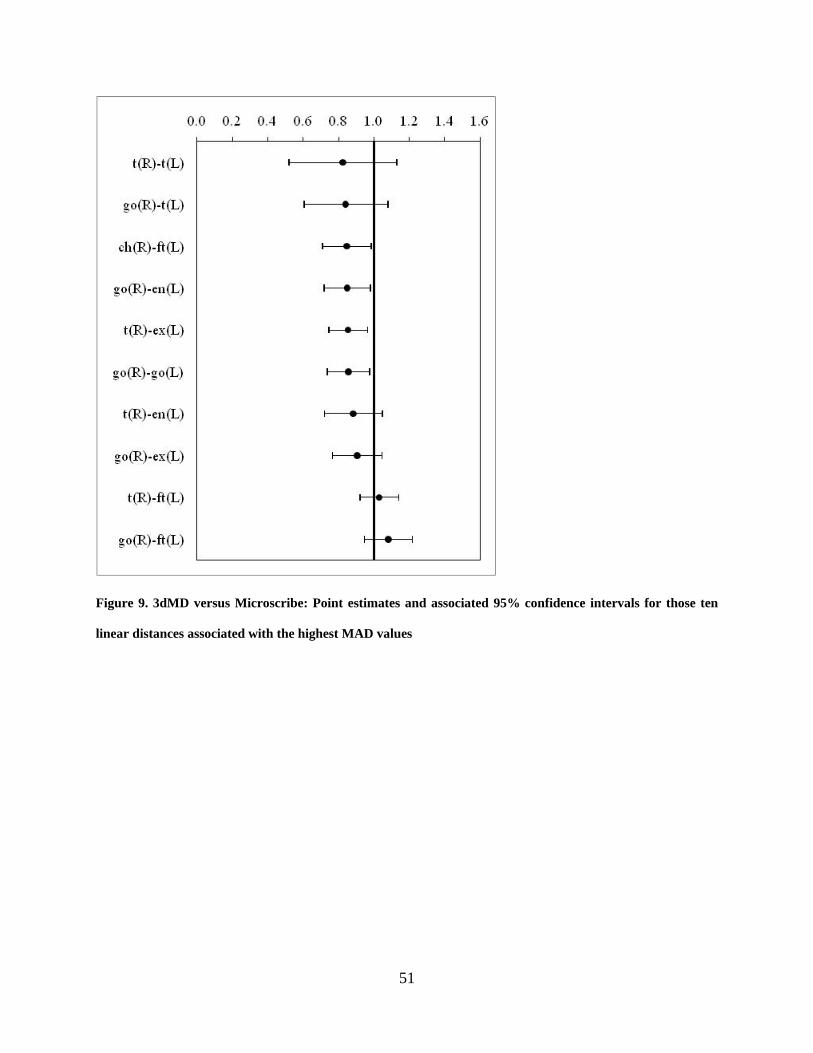
Figure 9. 3dMD versus Microscribe: Point estimates and associated 95% confidence intervals for
those ten linear distances associated with the highest MAD values ............................................. 51
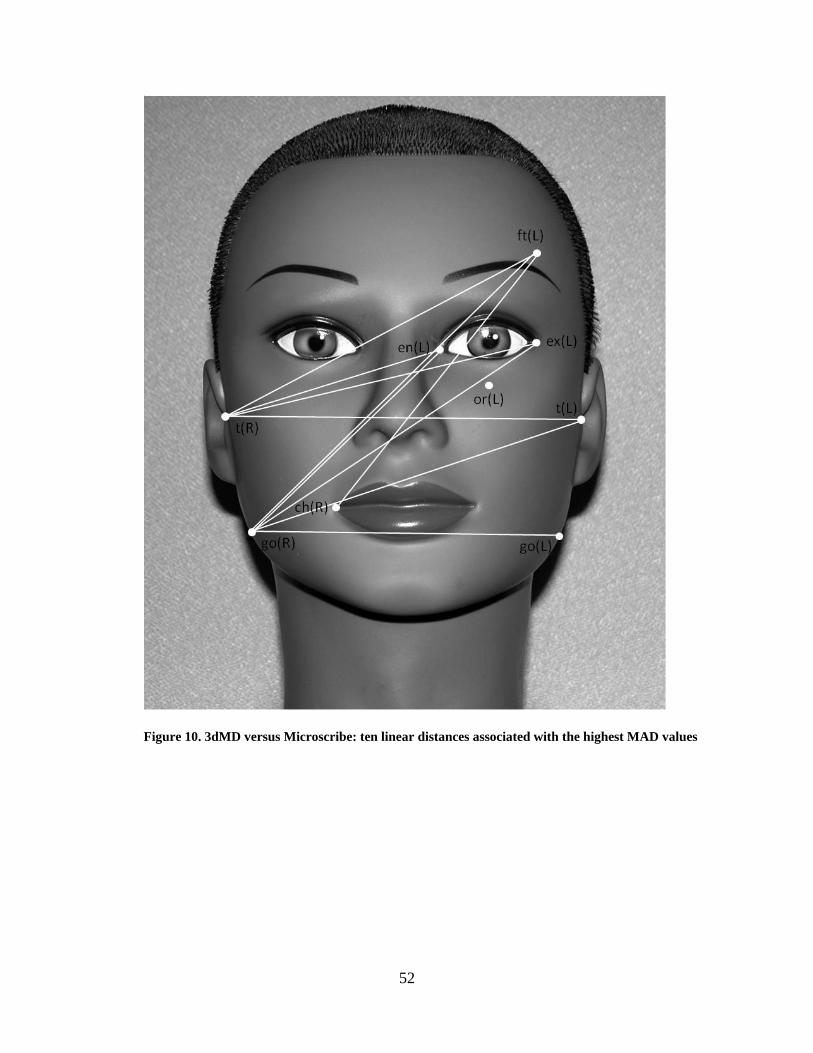
Figure 10. 3dMD versus Microscribe: ten linear distances associated with the highest MAD
values ............................................................................................................................................ 52
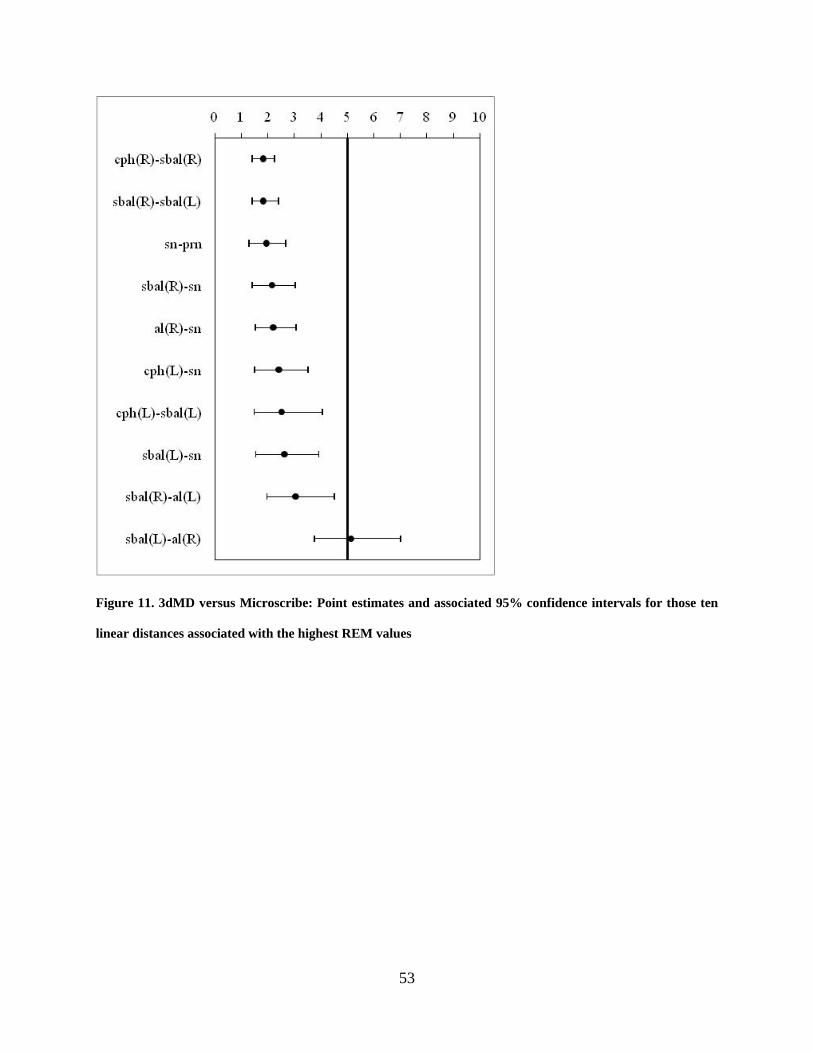
Figure 11. 3dMD versus Microscribe: Point estimates and associated 95% confidence intervals
for those ten linear distances associated with the highest REM values ........................................ 53
Figure 12. 3dMD versus Microscribe: ten linear distances associated with the highest REM
values ............................................................................................................................................ 54

x
Figure 13. 3dMD versus Microscribe: Point estimates and associated 95% limits of agreement
for those ten linear distances associated with the highest TEM values ........................................ 55
Figure 14. 3dMD versus Microscribe: ten linear distances associated with the highest TEM
values ............................................................................................................................................ 56
Figure 15. 3dMD versus Microscribe: Point estimates and associated 95% confidence intervals
for those ten linear distances associated with the lowest ICC values ........................................... 57
Figure 16. 3dMD versus Microscribe: ten linear distances associated with the lowest ICC values
....................................................................................................................................................... 58
Figure 17. Vectra versus Microscribe: Point estimates and associated 95% confidence intervals
for those ten linear distances associated with the highest MAD values ....................................... 62
Figure 18. Vectra versus Microscribe: ten linear distances associated with the highest MAD
values ............................................................................................................................................ 63
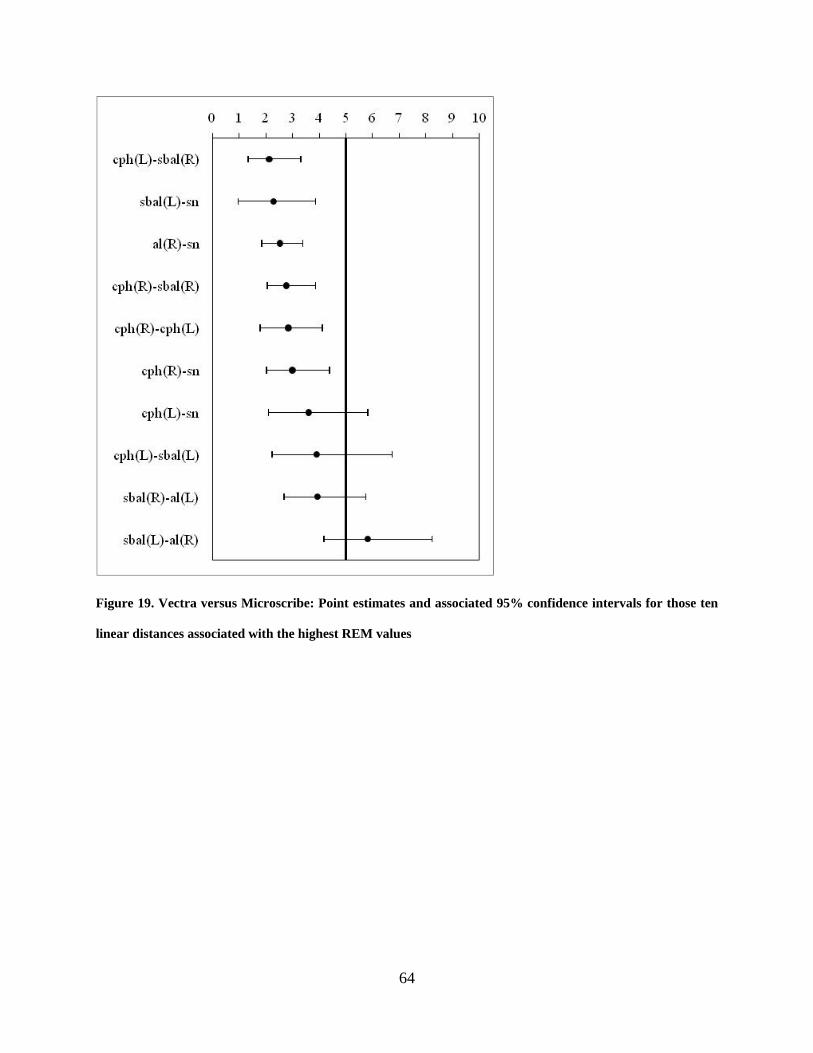
Figure 19. Vectra versus Microscribe: Point estimates and associated 95% confidence intervals
for those ten linear distances associated with the highest REM values ........................................ 64
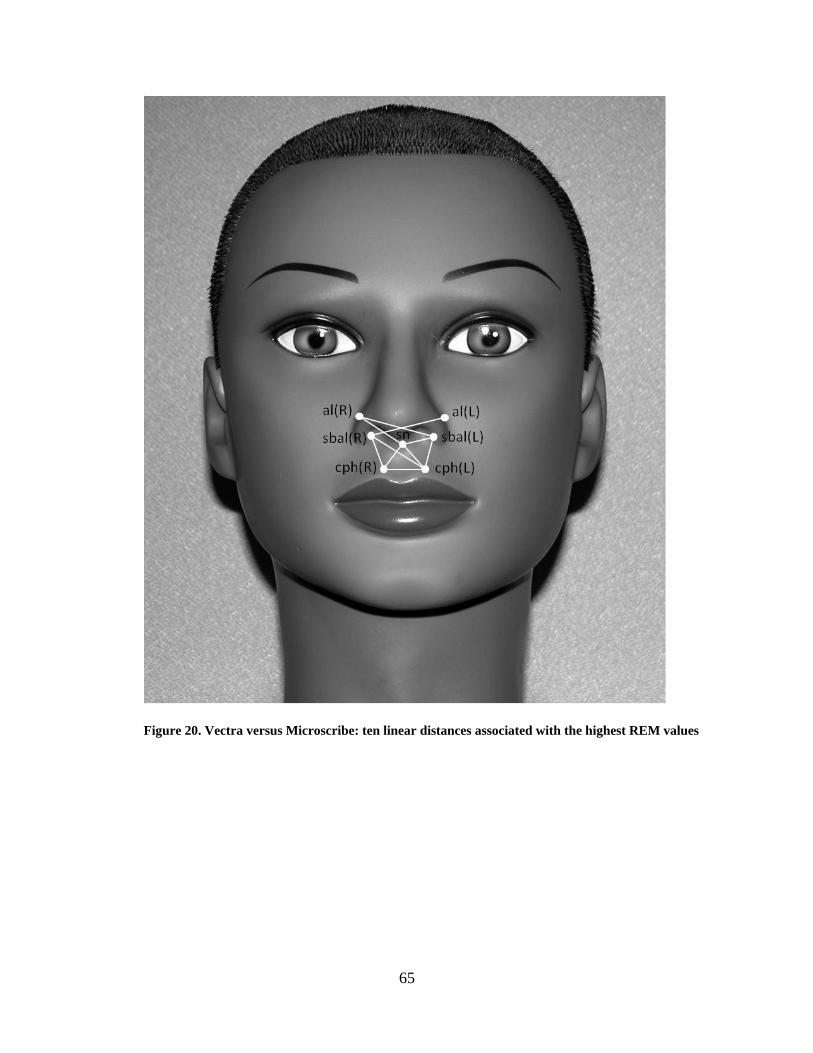
Figure 20. Vectra versus Microscribe: ten linear distances associated with the highest REM
values ............................................................................................................................................ 65
Figure 21. Vectra versus Microscribe: Point estimates and associated 95% limits of agreement
for those ten linear distances associated with the highest TEM values ........................................ 66
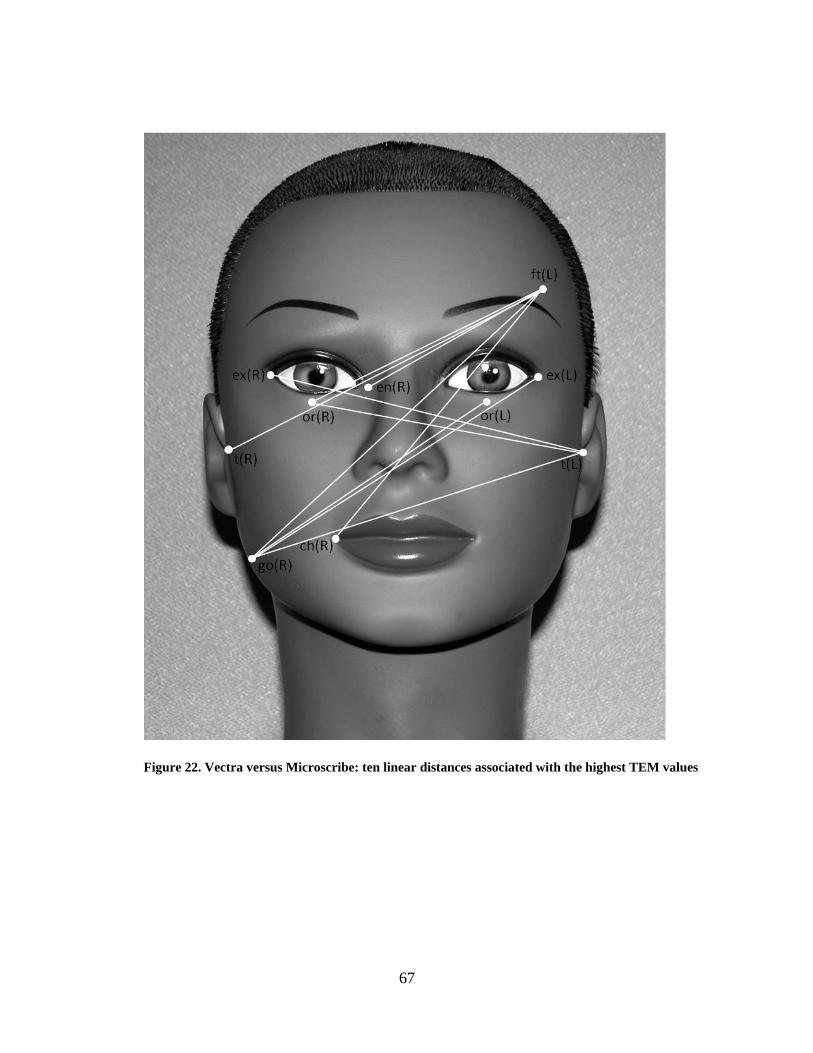
Figure 22. Vectra versus Microscribe: ten linear distances associated with the highest TEM
values ............................................................................................................................................ 67
Figure 23. Vectra versus Microscribe: Point estimates and associated 95% confidence intervals
for those ten linear distances with the lowest ICC values ............................................................ 68

xi
Figure 24. Vectra versus Microscribe: ten linear distances associated with the lowest ICC values
....................................................................................................................................................... 69
Figure 25. 3dMD versus Vectra: Point estimates and associated 95% confidence intervals for
those ten linear distances associated with the highest MAD values ............................................. 73
Figure 26. 3dMD versus Vectra: ten linear distances associated with the highest MAD values . 74
Figure 27. 3dMD versus Vectra: Point estimates and associated 95% confidence intervals for
those ten linear distances associated with the highest REM values .............................................. 75
Figure 28. 3dMD versus Vectra: ten linear distances associated with the highest REM values .. 76
Figure 29. 3dMD versus Vectra: Point estimates and associated 95% limits of agreement for
those ten linear distances associated with the highest TEM values .............................................. 77
Figure 30. 3dMD versus Vectra: ten linear distances associated with the highest TEM values .. 78
Figure 31. 3dMD versus Vectra: Point estimates and associated 95% confidence intervals for
those ten linear distances associated with the lowest ICC values ................................................. 79
Figure 32. 3dMD versus Vectra: ten linear distances associated with the lowest ICC values ..... 80
Figure 33. Thermal map composite of mannequin heads 1001 through 1009 .............................. 83
Figure 34. Thermal map composite of mannequin heads 1010 through 1018 .............................. 84
Figure 35. Enlarged thermal maps of three specific mannequin heads ........................................ 85
Figure 36. Examples of unclear or distorted landmarks from the 3D images .............................. 87

xii
PREFACE
I would like to thank my major advisor Dr. Seth Weinberg. His insight and mentorship were
paramount to the success of my project. I would also like to thank the remainder of my thesis
committee, Dr. Mark Mooney and Dr. Richard Doerfler for their guidance and encouragement
throughout the thesis process.
I would like to recognize and thank the following individuals for their contributions: Dr.
Xiaojing Wang and Maureen A. May from the University of Pittsburgh, Dr. Anne Burrows from
Duquesne University and Dr. John Kolar, Tatyana Bessmertnaya and Max Sturdivant from the
Craniofacial Clinic at Medical City Children’s Hospital, Dallas.
Most importantly, I would like to thank my parents, Art and Cathy, and my wife, Jayme,
for their love and support. I would not be where I am today without you!

13
1.0 INTRODUCTION
As knowledge continues to build in the fields of genetics and molecular biology the complexities
of phenotypic variability are beginning to be revealed. Known disorders or syndromes can
produce wide phenotypic variation attributable to environmental influences as well as varying
degrees of penetrance or expressivity. In order to fully understand the continuum that translates
genotype into phenotype, the progress that has been made in genetics and molecular biology
must be matched by equally rigorous methods of capturing phenotypic data (Aldridge et al.
2005). Digital three-dimensional (3D) photogrammetry, also known as stereophotogrammetry,
is a relatively new method allowing for the capture of quantitative information about the
craniofacial complex. This type of imaging method is designed to acquire 3D representations of
the facial surface, from which measurements can be obtained. Since the method is completely
photogrammetric, no lasers are used in the acquisition process and capture speeds can be
extremely fast. In addition to allowing for the calculation of linear distances, major advantages
of this technique are that the resulting digital 3D surface can be quantified in terms of angles,
surface areas and volumes. Furthermore, x, y, z coordinate data can be extracted in order to
perform a wide variety of statistical shape analyses. Thus, digital 3D photogrammetry has the
potential to provide a more in-depth assessment of a patient’s facial phenotype than traditional
anthropometric methods.
14
Many of the other advantages that 3D photogrammetry has to offer are related to the fact
that it is a form of indirect anthropometry. Indirect anthropometry, as the name implies, is a
form of indirect measurement where in all measurements are calculated from the patient’s 3D
surface image, requiring no physical contact with the patient. In contrast, some direct
measurements, such as those performed around the eyes, can be uncomfortable for the patient
and even pose a risk for injury. Furthermore, physical contact of direct anthropometric
instruments with pliable tissues can cause the tissues to deform slightly, leading to a possible
source of error. Other advantages of 3D photogrammetry are its ability to capture a 3D surface
image very quickly (on the order of several milliseconds) and the fact that a permanent archival
record of the subject’s face is generated. Using specialized software, 3D surfaces can be rotated
and enlarged, rendered in various ways and measured. This eliminates the need to locate the
same landmarks multiple times for different sets of direct measurements and allows the
investigator to collect measurements after data acquisition. As a result, the amount of
measurement time needed for both the subject and investigator is reduced. The decreased
amount of patient interaction time makes indirect measurement particularly more attractive for
use with children and patients with developmental disabilities where behavior and cooperation
could prove difficult.
3D photogrammetry also has clinical and academic applications in orthodontics and
dentofacial orthopedics. There has recently been a paradigm shift in which the patient’s soft-
tissue characteristics are emphasized in treatment planning decisions (Proffit et. al. 2007).
Formerly, most treatment decisions were dictated by the stone dental models and radiographic
lateral cephalometric analyses. Most orthodontists now treatment plan with soft tissue goals in
mind, however organizations like the American Board of Orthodontics still largely evaluate
15
treatment outcomes from stone models and cephalometric tracing superimpositions.
Stereophotogrammetry offers great opportunity for three-dimensional assessment of both growth
and treatment effects by superimposing the entire 3D surface. A visual representation of the
magnitude and direction of change between the two registered surfaces can be displayed through
a color-coded thermal map. Rather than assessing treatment results by observing the soft tissue
profile on a lateral cephalometric radiograph, clinicians and researchers alike could evaluate soft
tissue changes in all three dimensions and accurately quantify these changes.
In recent years, multiple digital 3D photogrammetric devices have come onto the market.
These machines vary greatly with regard to capture method and cost, as well as their
accompanying imaging hardware and software. Although some systems have been
independently validated in terms of measurement error, few attempts have been made to directly
compare measurements obtained from different 3D photogrammetric systems (Weinberg et al.
2006). Knowledge of how alternative systems compare is essential, since it cannot be assumed
that different investigators will always have the same technology available. Both the ability to
compare and the potential to merge independent 3D data sets collected with different imaging
systems requires an intimate understanding of system compatibility. To give just one example,
this issue is directly relevant to current efforts to create multi-center normative 3D databases.
The main objective of this study is to evaluate the accuracy and precision of 3D surface-derived
facial measurements obtained on a common set of realistic mannequin heads via two
commercially-available digital 3D photogrammetric systems.

16
2.0 REVIEW OF THE LITERATURE
2.1 MEASURING FACIAL SURFACE FEATURES
Anthropometry is defined as the science of measuring the size, weight, and proportions of the
human body. Craniofacial anthropometry is carried out by measuring distances between well-
defined landmarks located on the surface of the head, face and ears (Kolar and Salter, 1997).
Anthropometry allows researchers and clinicians alike to quantify facial characteristics and
assess phenotypic variability. Traditionally, anthropometric data has been collected through the
direct physical evaluation of a subject using calipers or metric tape to measure distances or arcs
between landmarks (Farkas, 1994). Although still widely used, direct anthropometry has several
disadvantages when dealing with living subjects. Direct measurements are time consuming in
nature and require significant patient cooperation, thus, evaluation of young children or patients
with developmental disabilities can be painstaking for the investigator and the subject.
Furthermore, direct anthropometry does not allow the creation of an archival record of a patient’s
craniofacial surface morphology. According to Farkas et al. (1980), two-dimensional (2D)
photogrammetry and lateral cephalometry overcome some of the limitations of direct
measurement through advantages such as rapid acquisition, archival capabilities, simplicity, and
low cost. However, both of these techniques have their own set of disadvantages. Cephalometry
exposes subjects to radiation and has relatively high measurement error resulting from subjective
17
analysis, overlapping structures, magnification, and variation in head orientation (Baumrind and
Frantz, 1971). 2D photogrammetry has been shown to be highly inaccurate resulting from
variations in lighting, parallax, and subject-to-camera distances (Farkas et al. 1980). Moreover,
both of these techniques have the inherent issue of giving 2D representations of 3D objects. 3D
space digitizers have been shown to collect very accurate 3D coordinate data on inanimate
objects, however, the inability of human subjects to sit completely motionless results in data with
significant motion error (Aldridge et al. 2005).
3D surface imaging systems provide a number of distinct advantages over the
aforementioned techniques. 3D imaging systems entail no physical contact with a subject and
have the ability to rapidly acquire a 3D archival record of the patient’s craniofacial morphology.
Specialized software programs allow the investigator to obtain more sophisticated measurements
such as the quantification of angles, surface areas and volumes. Furthermore, these
measurements can be performed after the subject has been dismissed, decreasing the amount of
time a subject must remain still and cooperative for evaluation. A laser surface scanner is one
type of 3D imaging system that has been shown to be reasonably reliable and accurate for
identifying craniofacial landmarks (Baca et al. 1994). However, image capture can be slow (up
to 20 seconds) and thus results in motion artifacts (Wong et al. 2008). There are also patient
concerns about the use of lasers, namely risks associated with use of lasers around the eyes. 3D
photogrammetry is another method for capturing 3D surface images (Lane and Harrell, 2008).
3D photogrammetric systems work through the use of two or more synchronized digital cameras
which capture images simultaneously from different angles and then reconstructs a digital 3D
image. The image is visualized as a point cloud, or a collection of points in 3D space, resulting
from the reconstructed craniofacial surface. Newer generations of 3D photogrammetric devices

18
are compact machines capable of acquiring full-frame digital 3D images virtually
instantaneously (on the order of several milliseconds) in high-resolution color. This near
instantaneous image capture minimizes error from motion artifact, and thus is a major advantage
of photogrammetry over laser surface scanning (Weinberg et al. 2004, Wong et al. 2008).
2.2 VALIDATION OF 3D PHOTOGRAMMETRY
Although 3D photogrammetry presents many potential advantages over more traditional
anthropometric techniques, these advantages prove meaningless if this technology cannot obtain
reliable and accurate measurement data. According to Weinberg et al. (2004), “reliability and
accuracy are perhaps the most important criteria upon which to evaluate any measurement
technology.” Therefore, a number of studies have set out to evaluate the reliability and accuracy
of various 3D photogrammetry systems. Accuracy, as it pertains to anthropometric validation
studies, is the agreement or correlation between a given measurement and its “true” value. If a
measurement deviates from its “true” value and this deviation has directionality, the
measurement is considered biased. Reliability is defined as the consistency of a set of
measurements. In this context, reliability is analogous to precision, or the difference between
repeated measures of the same entity (Weinberg et al. 2004, Aldridge et al. 2005).
A study by Meintjes et al. (2002) investigated the use of stereophotogrammetry as
method to evaluate the dysmorphology of children in the diagnosis of fetal alcohol syndrome.
The study population consisted of 44 children obtained from sample of 156 children shown to
exhibit signs of growth retardation during a fetal alcohol syndrome screening. The faces of the
children were photographed in a control frame simultaneously by a pair of high-resolution digital
19
cameras. These paired photographs were loaded into a software program designed to calibrate
the images and then compute 3D object-space coordinates of any point on the face from a
measurement point on the left image and right image. Measurements of palpebral fissure length,
inner canthal distance and interpupillary distance obtained using the photogrammetric software
were compared to the same clinical measurements performed directly with traditional
anthropometry by two dysmorphologists. The results showed that measurements obtained using
the stereophotogrammetric technique were highly repeatable. The data also revealed that no
significant difference existed between the two methods for palpebral fissure length. The authors
attributed discrepancies in inner canthal- and interpupillary distances to parallax and possible eye
movement of subjects during direct measurement (Meintjes et al. 2002).
A study by Ayoub et al. (2003) examined the accuracy of another 3D photogrammetry
system, the C3D imaging system. Full-face alginate impressions, taken on 21 infants with cleft-
lip, were used to construct stone models. Five anthropometric points were marked on each cast.
3D images of the casts, acquired using the C3D imaging system, were evaluated to extract x, y
and z coordinate data for the five anthropometric points. 3D coordinates for the five points were
also obtained directly from the casts using a Ferranti co-ordinate measuring machine (CMM).
Operator error, defined as discrepancies due to repeated location of the same landmarks, was on
average 0.20 mm. Capture error, defined as discrepancies due to multiple images of the same
cast, was on average 0.48 mm. Comparison between the C3D imaging systems values and those
obtained with the CMM displayed an average difference of 0.83 mm. These results led the
authors to conclude that measurements obtained using C3D photogrammetric images is a valid
and reproducible method for recording facial morphology (Ayoub et al. 2003).

20
A study by Weinberg et al. (2004) evaluated both the precision and accuracy of the
Genex Rainbow 3D photogrammetry system. Nineteen standardized craniofacial measurements
were obtained on 20 subjects by way of direct measurement using calipers and indirect
measurement from 3D images. All measurements were first performed without facial landmarks
labeled and then again after landmarks were labeled with black dots using liquid eyeliner.
Evaluation for precision revealed that 3D images were clearly more precise than direct
anthropometry, and that measurements of labeled landmarks were more precise than those of
unlabeled landmarks for both measurement methods. Evaluation of accuracy exhibited fairly
good congruence between means derived from 3D photos when compared to those obtained from
caliper measurement. Although seven variables displayed statistically significant mean
differences, the magnitude of most of these differences was less than two mm and likely
clinically insignificant. The authors concluded that the Genex digital 3D photogrammetry
system is sufficiently precise and accurate for the anthropometric needs of most medical and
craniofacial research designs (Weinberg et al. 2004).
A study by Aldridge et al. (2005) evaluated measurement error associated with
anthropometric landmark coordinate data acquired from 3D digital photogrammetric images
(3dMDface system) in a sample of children and adults. Precision was calculated for the
localization of all landmarks in all three axes. Results showed that the mean precision for
landmark placement was only 0.827 mm. Less than 1% of observed variance was attributable to
digitization error (i.e. differences from multiple data collection episodes of the same image).
Similarly, 1.5% of the total observed variance was explained by error attributable to the imaging
system itself (i.e. differences in multiple images of the same subject). Repeatability exceeded
95% for most linear distances evaluated in the study. Comparison of between-subject variance
21
to within-subject variance revealed a significant difference, indicating that error due to imaging
and digitization were insufficient to obscure differences between individuals. The authors
concluded that measurements performed on 3D images created using 3dMDface system are
highly repeatable and precise, and thus useful in clinical evaluation of craniofacial
dysmorphology and analysis of complex phenotypes (Aldridge et al. 2005).
A further study by Wong et al. (2008) evaluated validity and reliability of the same 3D
photogrammetric system. Two sets of linear facial anthropometric distances were measured
directly on 20 normal adult subjects and then measured again on 3D images acquired using the
3dMDface digital photogrammetry system. The results of this study showed that digital
measurements displayed excellent test-retest reliability as well as precision equal to direct
measurement, with all mean absolute differences equaling less than one millimeter. Seventeen
of 18 linear distances obtained from 3D images were deemed accurate as compared to direct
anthropometry, and 15 of the 18 measurements were unbiased. The author concluded that
craniofacial measurements derived from the 3dMDface system are both accurate and reliable
(Wong et al. 2008).
A study by Winder et al. (2008) evaluated the technical performance of a Di3D
stereophotogrammetric imaging system for geometric accuracy and maximum field of view. A
mannequin head was prepared for imaging by applying red paint for visual texture and by
marking 18 anatomical landmarks with black ink dots. The mannequin head was imaged 10
times to assess the repeatability of the 3D surface capture. Mean error for the repeated measures
was 0.057 mm with a mean variance of the errors of 0.003 mm. 20 linear distance measurements
were performed directly on the mannequin head with digital calipers and also on the 3D images
using the system software. The mean difference between the direct caliper measurements and
22
the 3D image measurements was 0.62 mm. Examination of field of view revealed the proportion
of circumference in the horizontal plane was 170.5º and in the vertical plane was 102.0º.
Therefore, the results show that the Di3D imaging systems is highly repeatable, accurate and
produces a field of view that is sufficient for imaging the head, neck, and face (Winder et al.
2008).
A different type of 3D imaging device was evaluated for accuracy, precision and
reliability by Ma et al. (2009). This newly designed structured light 3D scanner can acquire an
image of a subject’s face from left to right in a single capture, by the use of a rotary mirror.
Nineteen landmarks were labeled on a plaster model of a subject’s face. The plaster model was
scanned three separate times and all landmarks were recorded by three observers on three
occasions, totaling 27 measurement coordinates for each landmark. The coordinates of all
landmarks were also recorded using a coordinate measuring machine (CMM) three times in one
week by one observer. Accuracy of the scanning system, determined by the difference between
the measurement results from the 3D images and the CMM, was calculated to have a mean value
of 0.93 mm. Precision of the scanning system, defined as the ability of the system to produce the
same measurement results from a series of repeated measures, was calculated to have a mean
value of 0.79 mm. All intra-observer errors were less than 1 mm and all inter-observer errors
were less than 1.5 mm. Reliability was examined by scanning ten different human subjects five
times under identical conditions by one observer. The mean deviation for reliability was 0.20
mm. The authors concluded that their results suggest that the structured light scanning systems
was accurate, precise and reliable to record 3D facial morphology for both clinical and academic
purposes (Ma et al. 2009).
23
Heike et al. (2009) assessed the reliability of three-dimensional stereophotogrammetry
(3dMDface system) for measurement of craniofacial characteristics on living subjects. The
study population consisted of 40 individuals, 20 without craniofacial conditions and 20 with
22q11.2 deletion syndrome. Thirty craniofacial measurements obtained from 3D
photogrammetric images were compared to the same measurements taken using direct
anthropometry. Intra-rater reliability correlation coefficients for the three-dimensional images
were greater than or equal to 0.95 for 26 of the 30 measurements and mean absolute differences
(MAD) were less than 1 mm for most interlandmark distances. Intrarater relative error
magnitude (REM) estimates were less than 1 percent and the technical error of measurement
(TEM) was less than 1 mm for the majority of measurements. Evaluation of inter-rater
reliability, although slightly less reliable than intrarater, still produced high over-all reliability
estimates for most measurements. Inter-method reliability estimates comparing direct
anthropometry to three-dimensional image based measurements exhibited Pearson correlation
coefficients greater than 0.9 for most distances, suggesting high inter-method reliability. The
authors concluded that their reliability estimates were consistent with similar studies, suggesting
that indirect measurements taken on 3D images captured using the 3dMDface system are reliable
for most facial measurements (Heike et al. 2009).
A recent study by Menezes et al. (2010) examined the accuracy and reproducibility of the
Vectra 3D stereophotogrammetric imaging system for the measurement of facial soft tissues of
healthy subjects. Accuracy was assessed by taking 3D images of a 6-cm cubic box and these
images were compared to known measurements including a 10 mm linear distance, a 90º angle
and a 1-cm2 area. Sixteen linear measurements were computed between pre-labeled landmarks,
with the exception of biocular width (Ex-Ex) and mouth width (Ch-Ch), which were not pre-

24
labeled. Calibration error was assessed by acquiring two sets of images of the same subjects
with system calibration before each acquisition. Intra-rater reproducibility was assessed by
capturing two set images of the same subjects positioned differently between each acquisition.
Inter-rater reproducibility was assessed by having two separate operators collect the same
measurements. No systematic errors were found for all performed tests (P > 0.05, paired t test).
These results led authors to conclude that the Vectra 3D photogrammetric system was accurate
and reproducible for facial measurements on a population of healthy human subjects.
Another recent study by Schaaf et al. (2010) evaluated the accuracy of head
measurements from 3D photogrammetric images of subjects with non-synostotic cranial
deformities. One hundred randomly selected children were classified into groups according to
their characteristic deformity: plagiocephaly, brachycephaly, or a combination of both. Direct
oblique head measurements (diagonal A and B) were performed five separate times with metric
spreading calipers. Using 3D images acquired with the 3dMD cranial systems, five clinicians
independently performed the same oblique measurements five times each. Intra-rater and inter-
rater variability were assessed for both reproducibility and repeatability. Bland-Altman plots
were used to analyze differences between indirect 3D photogrammetric and direct caliper
measurements. The inter-rater and intra-rater agreements of the 3D measurements had low
variability in the variance component analysis. Measurements obtained from the 3D
photogrammetric images resulted in a slight over-estimation when compared to caliper
measurements, which were approximately 2% smaller. Authors concluded that 3D
photogrammetric imaging is a potentially reliable tool for anthropometric measurement of
children with cranial deformities.

25
The studies reviewed above used a wide variety of methodologies in the validation of 3D
stereophotogrammetry. Despite the use of inconsistent terminology in the literature, criteria
upon which this technology was evaluated mainly include: intra- and inter-rater reliability,
device-related reliability and accuracy. Although the study design and choice of statistics for
reporting error vary greatly, most studies report that measurements obtained using 3D
photogrammetry exhibit high overall accuracy and reliability. Consequently, many authors
conclude that 3D stereophotogrammetry is a viable tool for indirect anthropometry for most
clinical and academic purposes.
2.3 DIRECT COMPARISON OF 3D SYSTEMS
As summarized above, numerous independent studies have shown that measurements derived
from 3D images demonstrate high reliability. This finding was consistent across a variety of
different 3D photogrammetric platforms. What cannot be concluded from these studies,
however, is that facial measurements produced using alternative 3D systems are directly
compatible. Unfortunately, only a handful of studies have directly compared measurements
obtained from alternative 3D surface imaging systems. Schwenzer-Zimmerer et al. (2008)
compared measurements derived from a 3D laser scanner to those from 3D photogrammetry.
These devices were tested by comparing their data to calibrated inanimate objects. Although the
accuracy of both systems was in the sub-millimeter range, the laser scanner displayed more
deviation and all distance measures were biased towards being too small. The 3D
photogrammetric system was also more precise; however, the authors pointed out that the
precision of both devices may be sufficient depending on the task. The main advantages the

26
authors discussed regarding the laser scanner were its ease of use and robust self-calibrating
design. On the other hand, the authors noted that the shorter scanning time (0.2 s) with 3D
photogrammetry make it more ideal for capturing facial surface data on living subjects
(Schwenzer-Zimmerer et al. 2008).
Another study, by Fourie et al. (2010) evaluated the accuracy and reliability of
measurements obtained using multiple 3D imaging modalities. The different imaging systems
included: a laser surface scanning system (Minolta Vivid 900), cone beam computed tomography
(CBCT) and a 3D stereo-photogrammetry system (Di3D system). The study sample consisted of
seven cadaver heads, from which twenty-one standardized, linear measurements were derived
from fifteen landmarks. All measurements were recorded on the cadaver heads directly using
digital calipers and then the same measurements were performed indirectly on the digital images
reproduced by the different imaging systems. Reliability was evaluated by means of intraclass
correlation coefficients (ICCs). All three imaging modalities were determined to be very
reliable, displaying ICCs greater than 0.923 to 0.999 when compared to direct measurement
which displayed ICCs from 0.964 to 0.999. Accuracy was examined by calculating the absolute
error (AE) and the absolute percentage error (APE) between the direct physical measurements
and the measurements obtained with the three different imaging systems. Only one measurement
from the CBCT and the Di3D displayed an AE of greater than 1.5 mm. The authors concluded
that measurements recorded using all three 3D imaging systems studied, appeared to be
sufficiently accurate and reliable for research and clinical purposes (Fourie et al. 2010).
To date, only a single study has actually directly compared measurements derived from
two different 3D photogrammetry systems. Weinberg et al. (2006) compared the anthropometric
precision and accuracy of the Genex FaceCam 250 and 3dMDface systems to one another and to
27
direct anthropometry. Twelve linear distances were measured on a sample of 18 mannequin
heads by the three different methods: 1) directly on the heads with 150 mm digital calipers 2)
from 3D surface images acquired with a Genex FaceCam 250 imaging system 3) from 3D
surface images acquired from a 3dMDface imaging system. Direct comparison of the different
3D imaging systems to one another displayed statistically significant differences in 9 of the 12
variables, however, the magnitude of the mean differences were less than 1 mm. Intra-observer
precision was very high for all three methods and no significant differences were noted.
Technical error of measurement (TEM), used to quantify the magnitude of imprecision was also
determined to be very small, less than 1 mm. The authors suggested that the overall mean
differences across these three methods were so small that they were likely clinically
insignificant. Therefore, the authors concluded that data collected from images acquired using
the Genex and 3dMD imaging systems are sufficiently concordant, accurate and precise to be
compared or combined statistically (Weinberg et al. 2006). Because this study was the only one
of its kind at the time, the author recognized the need for further investigations in order to make
more generalized conclusions regarding 3D photogrammetric technology.
28
3.0 STATEMENT OF THE PROBLEM AND STUDY OBJECTIVES
Quantification of craniofacial characteristics is not only important for academic purposes, but
also has direct clinical implications in fields such as oral and maxillofacial surgery, plastic
surgery, orthodontics and many others. Objective evaluation of the soft tissue of the face allows
the clinician to form an effective treatment plan and also allows post-surgical outcome
assessment. Traditionally, direct anthropometry, two-dimensional (2D) photogrammetry and
cephalometry have served as the primary sources of information used for diagnosis and treatment
planning, as well as for analysis of phenotype in craniofacial research. Two-dimensional
photogrammetry and cephalometry have a number of drawbacks, and performing direct
measurements on young children or patients with developmental disabilities can be tedious and
time consuming for both the subject and the investigator. Analysis of a three-dimensional
surface images acquired through the use of digital stereophotogrammetry offers a number of
distinct advantages over earlier techniques. A 3D archival record of a subject’s face can be
captured almost instantaneously which can then be landmarked and analyzed later. Furthermore,
a wide variety of measurements can easily be performed on the 3D image, such as quantification
of angles, surface areas and volumes.
Because anthropometric data acquired with unvalidated technology could potentially
contain unacceptably high levels of measurement error, evaluation of reliability and accuracy are
essential (Weinberg et al. 2004). While many 3D photogrammetric systems have been evaluated
29
individually for validity and reliability, few attempts have been made to directly compare
measurements acquired by two different 3D photogrammetric systems. This comparison is
critical to allow the creation of multi-center normative databases and to facilitate collaborative
efforts between institutions with different 3D photogrammetric systems.
To address this deficit, the present study will (1) evaluate the accuracy of craniofacial
measurements obtained using two commercially available 3D stereophotogrammetry systems
(3dMDface and Vectra 3D) by comparing their values to measurements obtained using a
Microscribe 3DX 3D mechanical digitizer and (2) evaluate inter-system precision by directly
comparing measurements obtained with the different 3D photogrammetric systems.

30
4.0 MATERIALS AND METHODS
4.1 SAMPLE DESCRIPTION
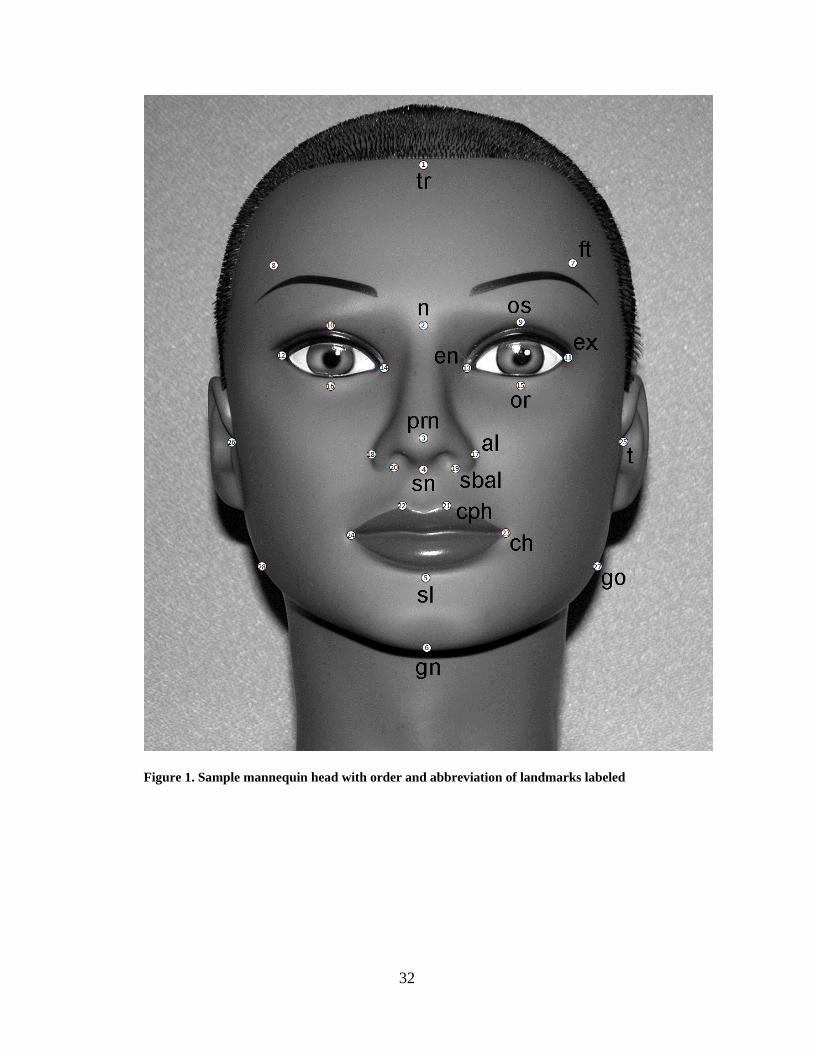
The study sample was comprised of 18 life-like mannequin heads, each pre-labeled in permanent
ink with 28 standard anthropometric surface landmarks (Figure 1) chosen to provide broad facial
coverage. Table 1 outlines the definition of all landmarks used. All extraneous hair was
removed from the heads prior to imaging. Each mannequin head was unique, ensuring the
presence of adequate facial variation in the sample.
4.2 DATA ACQUISITION
The 18 heads were imaged using two different 3D stereophotogrammetry systems: the
3dMDface system (3dMD, Atlanta, GA) and the Vectra 3D system (Canfield Scientific,
Fairfield, NJ). Both the 3dMDface and Vectra 3D systems are fully automated digital 3D
stereophotogrammetric devices capable of 3D, high-resolution color surface captures of the face
in fewer than five milliseconds. The systems consist of multiple precisely synchronized digital
cameras set at fixed angles. 3D geometry is captured by projecting a random light pattern (i.e.,
unstructured) onto an object’s surface, while simultaneously obtaining digital images with
overlapping views of the target. Software algorithms are then utilized to combine the various

31
images into a single unified 3D point cloud. To enhance visualization, points comprising the
surface are linked by vertices creating a 3D polygonal mesh, and these polygons can be filled in
to create an “air-tight” surface.
32
Figure 1. Sample mannequin head with order and abbreviation of landmarks labeled

33
Table 1. Landmark definitions
Order Landmark Abbreviation Type Definition 1 Trichion tr Midline Midpoint of the hairline. 2 Nasion n Midline The midpoint of the nasofrontal suture. 3 Pronasale prn Midline The most protruded point of the nasal tip.
4 Subnasale sn Midline The junction between the lower border of the nasal septum, the partition which divides the nostrils, and the cutaneous portion of the upper lip in the midline.
5 Sublabiale sl Midline It is located on the skin below the vermillion 6 Gnathion gn Midline The lowest point in the midline on the lower border of the chin. 7, 8 Frontotemporale ft Bilateral The most medial point on the temporal crest of the frontal bone.
9, 10 Orbitale superius os Bilateral The highest point on the margin of the orbit.
11, 12 Exocanthion ex Bilateral The outer corner of the eye fissure where the eyelids meet. 13, 14 Endocanthion en Bilateral The inner corner of the eye fissure where the eyelids meet. 15, 16 Orbitale or Bilateral The lowest point on the margin of the orbit. 17, 18 Alare al Bilateral The most lateral point on the nasal ala.
19, 20 Subalare sbal Bilateral The point on the lower margin of the base of the nasal ala where the ala disappears into the upper lip skin.
21, 22 Crista philtri cph Bilateral The point on the crest of the philtrum, the vertical groove in the median portion of the upper lip, just above the vermilion border.
23,24 Cheilion ch Bilateral The outer corner of the mouth where the outer edges of the upper and lower vermilions meet.
25, 26 Tragion t Bilateral
Located at the notch above the tragus of the ear, the cartilaginous projection in front of the external auditory canal, where the upper edge of the cartilage disappears into the skin of the face.
27, 28 Gonion go Bilateral The most lateral point at the angle of the mandible.
34
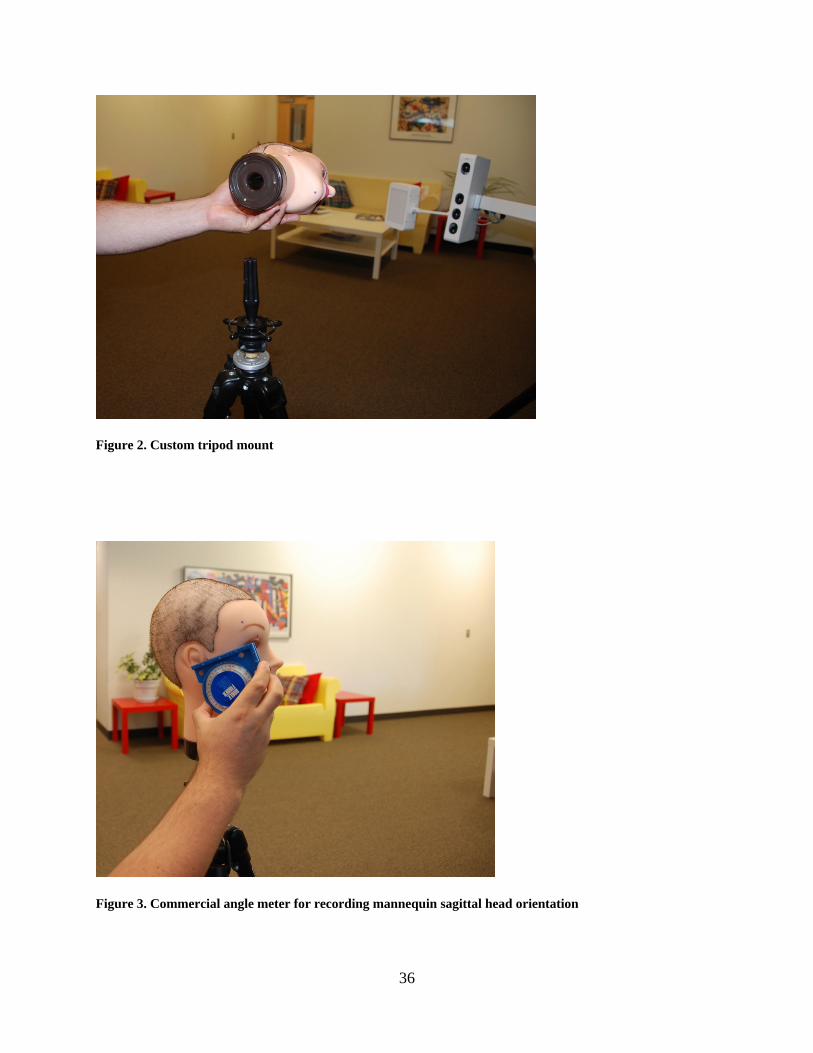
Color and texture information are then mapped onto the underlying geometry to give life-
like rendering. Imaging with the 3dMDface system was carried out at the University of
Pittsburgh’s Center for Craniofacial and Dental Genetics. Prior to image acquisition, each head
was fixed with a custom mount to a tripod (Figure 2) and tilted up approximately 10 degrees
relative to Frankfort horizontal, ensuring that the subnasal region will be adequately captured.
The sagittal orientation of each head was recorded (Figure 3) using a commercial angle meter
(Dasco Pro Products, Rockford, IL). Figure 4 displays a mounted mannequin head along with
the 3dMDface system prepared for image capture.
Imaging of the same 18 heads with the Vectra 3D system was carried out within the
Craniofacial Clinic at Medical City Children’s Hospital in Dallas, TX (Figure 5). The same
protocol for image capture along with the same sagittal head orientation was used. Image files
(.obj format) were then sent to the University of Pittsburgh for landmark data collection.
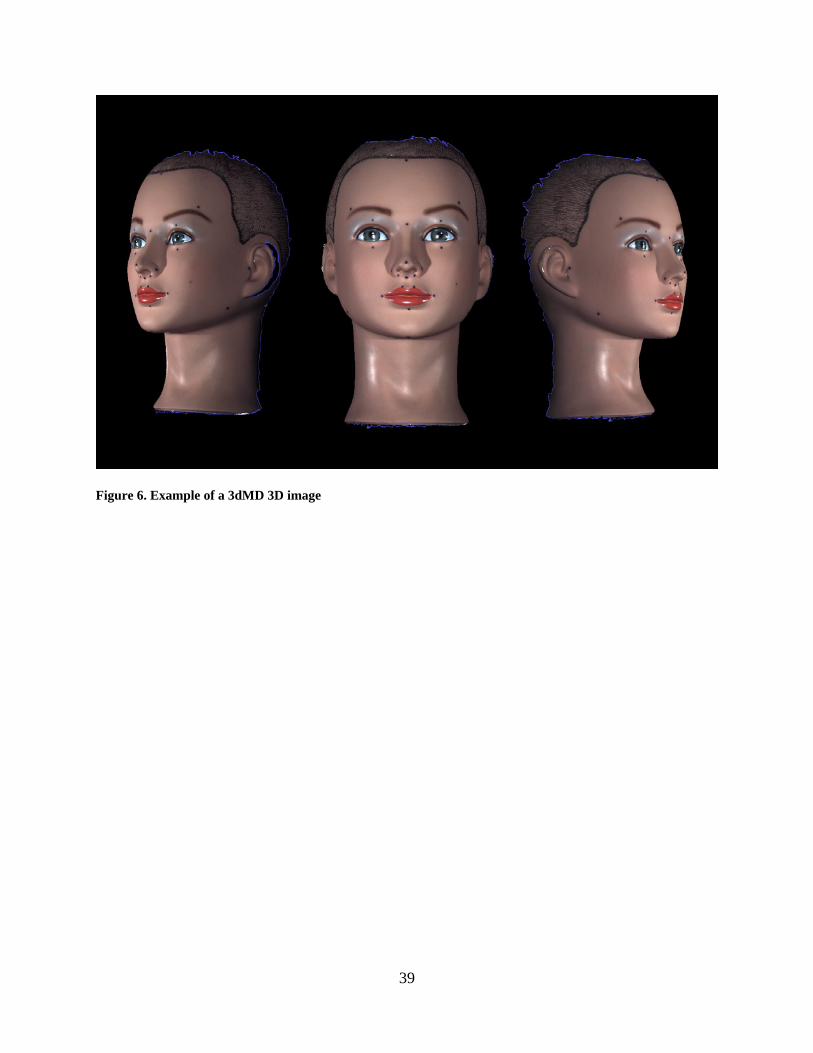
3dMDpatient software was used to collect 3D coordinates associated with the pre-labeled
landmarks from each image captured using 3dMDface system. This software allowed the 3D
images to be moved, rotated and enlarged to aid in the inspection and identification of surface
landmarks. An example of a 3D 3dMD image can be seen in Figure 6. All 28 landmarks were
collected following a strict predefined sequence, illustrated in Figure 1 and Table 1. The
software program MeshLab v1.3.0 (Visual Computing Laboratory - ISTI - CNR;
http://meshlab.sourceforge.net/) was used to collect 3D coordinates from .obj images that were
captured using the Vectra 3D system. The MeshLab program has surface manipulation and
landmarking capabilities similar to those described above for the 3dMDpatient software.

35
All landmarks were collected twice from each 3D surface scan and the coordinate data was
averaged prior to comparison. 3D landmark coordinates were also recorded on each head using a
Microscribe 3DX 3D digitizer at Duquesne University, Pittsburgh PA.
36
Figure 2. Custom tripod mount
Figure 3. Commercial angle meter for recording mannequin sagittal head orientation

37
Figure 4. 3dMDface system prepared for mannequin head image acquisition

38
Figure 5. Vectra 3D Imaging system
39
Figure 6. Example of a 3dMD 3D image

40
The 3D digitizer consists of a mechanical pivot arm which terminates with a stylus
(Figure 7). Within a given radius, the stylus can be positioned virtually anywhere in space. The
user simply touches the stylus to any point on an object’s surface and records the 3D coordinates
associated with that point onto a portable computer. For our purposes, the digitizer served as a
reference standard, since it is a well-established and validated method of data collection (Corner
et al. 1992, Hildebolt and Vannier 1988, Williams and Richtsmeier 2003, Ayoub et al. 2003, Ma
L et al. 2009) and is commonly used in engineering and design applications where a high degree
of accuracy is required. Prior to data collection, the mannequin heads were oriented face up and
secured in place using a custom-built holding device (Figure 7) to ensure no movement of the
heads during digitization. The digitization process was carried out twice on each head and the
resulting coordinate data averaged prior to comparison.

41
Figure 7. Microscribe 3DX 3-dimensional digitizer with custom-built holding device
42
4.3 QUANTITATIVE ANALYSIS
The term “accuracy” is used here to describe the degree to which a measurement deviates from
its "true" value (Habicht et al. 1979, Mueller et al. 1988). In the context of this study, accuracy
was calculated by comparison of measurements obtained from the 3D photogrammetric images
to the “true” value measurements obtained with the 3D digitizer. The term “precision” is used
here to describe the degree of difference between repeated measures taken on the same subject or
object (Habicht et al. 1979, Mueller et al. 1988). This study focuses on “device-related”
precision, which was examined by comparing measurements obtained from images captured with
the 3dMD system and comparing them to the same measurements obtained from images
captured with the Vectra 3D system.
For each coordinate data set (per head/per method) all possible inter-landmark distances
were calculated, resulting in 378 unique measurements. These measurements were then
averaged across the sample of 18 heads according to method (3dMD, Vectra 3D, Microscribe).
Accuracy and precision estimates were carried out by calculating several well-known error
magnitude statistics: mean absolute difference (MAD), relative error magnitude (REM),
technical error of measurement (TEM) and intraclass correlation coefficients (ICC). When
evaluating two measurements of the same object, MAD is simply defined as the average of the
absolute difference between the values at time 1 and 2 (or method 1 and method 2) across all
members of a sample (Utermohle and Zegura 1982, Utermohle et al. 1983, Gordon et al. 1989,
Gordon and Bradtmiller 1992, Weinberg et al. 2004). Values for MAD remain in the same units
as the original measurement data. Thus, it is a relatively simple and intuitive measure of error
magnitude. REM can be calculated by dividing the MAD for a given variable by the grand mean
for that variable and multiplying the result by 100 (Weinberg et al. 2004). Thus, REM is
43
expressed as a percentage and represents an estimate of error magnitude relative to the size of the
measurement. This information is valuable because error magnitude scores, by themselves, can
be misleading. For example, a MAD value of 3 mm for a mean measurement of 230 mm gives a
REM of 1.3%. On the other hand, the same MAD value for a mean measurement of 23 mm
gives a REM of 13%.
Another commonly used error magnitude estimate is TEM, also called the method error
statistic (Malina et al. 1973, Utermohle and Zegura 1982, Utermohle et al. 1983, Cameron 1986,
Mueller and Martorell 1988, Gordon et al. 1989, Frisancho 1990, Ward and Jamison 1991,
Gordon and Bradtmiller 1992, Ulijaszek and Lourie 1994, Ulijaszek and Kerr 1999, Vegelin et
al. 2003, Weinberg et al. 2004). According to Ward and Jamison (1991), TEM “provides a
standard deviation-like measure of the magnitude of error, and it is in the original units of
measurement.” The formula for TEM when two measurements are involved is:
TEM = ∑ ND 2/)( 2
where D represents the difference between the first and second measurement and N represents
the number of individuals measured. The TEM is conceptually similar to the MAD, but was
included to facilitate comparison with other studies because it is a widely used estimate of
measurement error. The final error estimate used was the intraclass correlation coefficient (ICC)
(Fleiss 1986, McGraw and Wong 1996). ICC values range from 0 to 1 and represent the
proportion of between-subject variance free from measurement error; a value of 0 would indicate
that all of the between-subject variation was due to measurement error, where as a value of 1
would indicate that there was no measurement error. Therefore, ICC values closer to 1 represent
higher precision (Weinberg et al. 2004).
44
In addition to point estimates, for each linear distance, 95% confidence intervals were
calculated for the MAD, REM and ICC statistics. Similarly, for the TEM statistic, the 95%
limits of agreement was calculated (Hopkins, 2000). For each variable in the analysis, the
reported confidence intervals were compared to pre-established error thresholds, chosen based on
either clinical or practical relevance. For example, for the MAD and TEM statistics, the
threshold for acceptable error was set at 1 mm. If the lower bound of the MAD or TEM 95%
confidence interval for a given variable exceeded this 1 mm threshold value, then this variable
was flagged as demonstrating a statistically significant degree of measurement error.
Alternatively if the threshold value was contained within the bounds of the confidence interval,
then we would conclude that there is no statistical evidence that the observed point estimate was
significantly greater than 1 mm. For the REM statistic, the threshold was set at 5%. In addition,
following Weinberg et al. (2004), REM scores were divided into 5 agreement categories: < 1% =
excellent, 1% to 3.9% = very good, 4% to 6.9% = good, 7% to 9.9% = moderate and > 10% =
poor. Finally, for ICC values, the threshold was set at 0.80. MAD, REM and TEM error
statistics were calculated using Excel (Redmond, WA) and SPSS v17 (Chicago, IL) statistical
software. ICCs were calculated in the R v2.13 statistical programming environment (Vienna,
Austria).
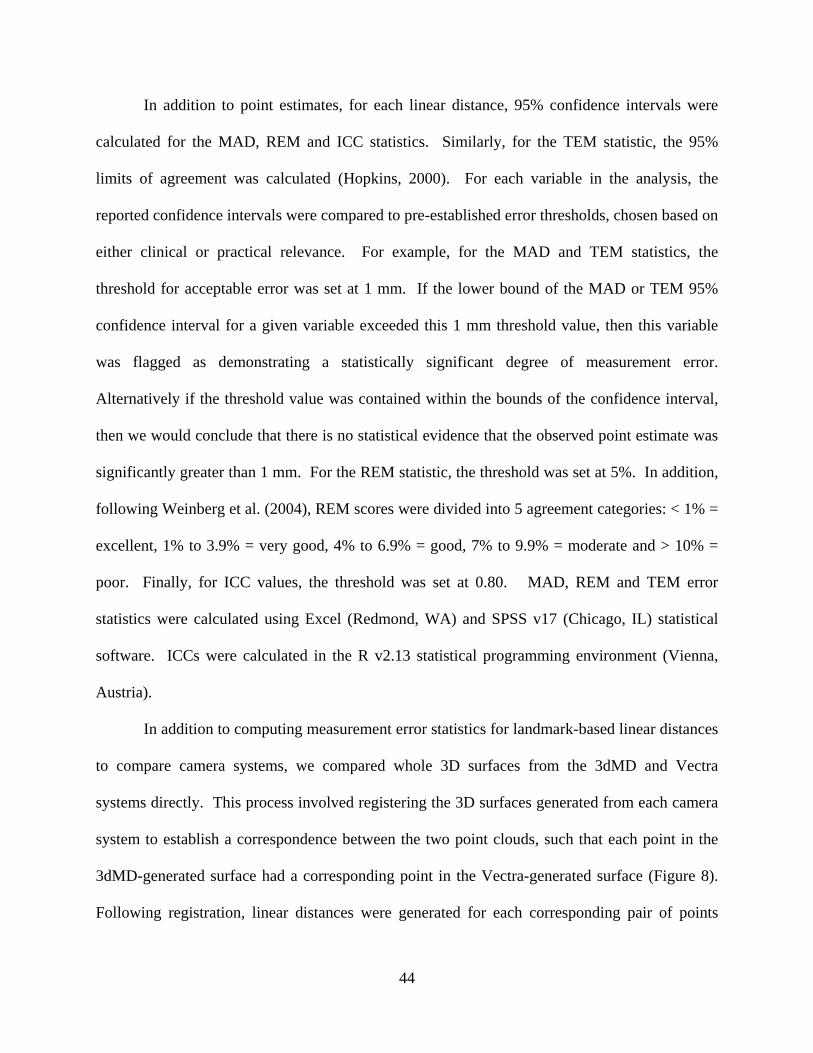
In addition to computing measurement error statistics for landmark-based linear distances
to compare camera systems, we compared whole 3D surfaces from the 3dMD and Vectra
systems directly. This process involved registering the 3D surfaces generated from each camera
system to establish a correspondence between the two point clouds, such that each point in the
3dMD-generated surface had a corresponding point in the Vectra-generated surface (Figure 8).
Following registration, linear distances were generated for each corresponding pair of points

45
belonging to the two surfaces. For our sample of facial surfaces, the number of computed linear
distances ranged from approximately 28,000 to 42,000. Each distance was then color-coded to
produce a thermal or heat map to visually represent the magnitude and direction of the
differences between the two registered surfaces. This process was repeated 18 times, once for
each corresponding pair of 3D facial surfaces. To quantify the magnitude of the difference
between each pair of surfaces on a global level, the Root Mean Square (RMS) and mean
difference (signed) were calculated.
46
Figure 8. Registration process for paired 3D surface images

47
5.0 RESULTS
5.1 ACCURACY
5.1.1 3dMDface system versus Microscribe digitizer
Of all 378 inter-landmark distances measured, 376 measurements displayed a MAD less than 1
mm. The MAD grand mean across all measurements was 0.1925 mm with a standard error of
0.0035 mm. The minimum MAD was 0.1399 mm and the maximum MAD was 1.0817 mm,
exhibiting a range of 0.9418 mm. For REM scores, 87.8% were deemed excellent (error
magnitude less than 1% of the mean), 11.9% were very good (1% to 3.9% of the mean) and 0.3%
were good (4% to 6.9% of the mean). No REM values were determined to be moderate or poor
(Table 2). The REM grand mean across all measurements was 0.6517% with a standard error of
0.0240%. The minimum REM was 0.1352% and the maximum REM was 5.1436%, exhibiting a
range of 5.0084%. All 378 TEM values were less than 1 mm. The TEM grand mean across all
measurements was 0.2994 mm with a standard error of 0.0064 mm. The minimum TEM was
0.1205 mm and the maximum TEM was 0.7910 mm, exhibiting a range of 0.6705 mm. The ICC
grand mean was 0.9944 with a standard error of 0.0003. The minimum ICC was 0.9616 and the
maximum ICC was 0.9996, exhibiting a range of 0.0379. Based on the constructed confidence
intervals, none of the observed MAD, REM, TEM or ICC values for any of the 378 variables

48
significantly exceeded our predefined error thresholds (p > 0.05). Grand mean statistics for the
3dMDface system versus the Microscribe digitizer are presented in Table 3. Table 4 displays the
ten linear distances associated with highest degree of error for each statistic. The point estimates
and associated 95% confidence intervals for the distances listed in Table 4 are represented in
Figures 9, 11, 13 and 15. The same variables are also depicted in Figures 10, 12, 14 and 16.

49
Table 2. Frequency of REM values by error category across the three main comparisons
Categories1
3dMD vs
Microscibe
Vectra 3D vs
Microscribe
3dMD vs
Vectra 3D
Excellent 332 (87.8%) 330 (87.3%) 363 (96.0%)
Very Good 45 (11.9%) 47 (12.3%) 15 (4.0%)
Good 1 (0.3%) 1 (0.3%) 0
Moderate 0 0 0
Poor 0 0 0
1See text for category explanation
Table 3. Error statistics for 3dMD versus Microscribe averaged across all 378 linear distances
Grand Mean Standard Error Minimum Maximum Range
MAD 0.358 0.009 0.140 1.082 0.942
REM 0.652 0.024 0.135 5.144 5.008
TEM 0.299 0.006 0.121 0.791 0.671
ICC 0.994 0.0003 0.962 0.999 0.038
50
Table 4. 3dMD versus Microscribe: the ten linear distances associated with the highest degree of error for
each of the four different error magnitude statistics
MAD (mm) REM (%) TEM (mm) ICC
Distance Value Distance Value Distance Value Distance Value
t(R)-t(L) 0.825 cph(R)-sbal(R) 1.834 t(R)-ex(L) 0.626 or(L)-en(L) 0.981
go(R)-t(L) 0.842 sbal(R)-sbal(L) 1.838 go(R)-en(L) 0.631 en(R)-n 0.980
ch(R)-ft(L) 0.847 sn-prn 1.960 go(R)-go(L) 0.632 cph(L)-sbal(L) 0.979
go(R)-en(L) 0.849 sbal(R)-sn 2.165 ch(R)-ft(L) 0.633 en(R)-ft(L) 0.976
t(R)-ex(L) 0.855 al(R)-sn 2.210 t(R)-en(L) 0.671 en(L)-os(L) 0.976
go(R)-go(L) 0.857 cph(L)-sn 2.414 go(R)-ex(L) 0.674 cph(L)-sn 0.976
t(R)-en(L) 0.884 cph(L)-sbal(L) 2.529 go(R)-t(L) 0.692 cph(L)-al(R) 0.973
go(R)-ex(L) 0.906 sbal(L)-sn 2.626 t(R)-t(L) 0.738 al(L)-sn 0.970
t(R)-ft(L) 1.031 sbal(R)-al(L) 3.049 t(R)-ft(L) 0.747 sbal(L)-al(R) 0.964
go(R)-ft(L) 1.082 sbal(L)-al(R) 5.144 go(R)-ft(L) 0.791 al(R)-sn 0.962
See corresponding figures 9-16
51
Figure 9. 3dMD versus Microscribe: Point estimates and associated 95% confidence intervals for those ten
linear distances associated with the highest MAD values
52
Figure 10. 3dMD versus Microscribe: ten linear distances associated with the highest MAD values
53
Figure 11. 3dMD versus Microscribe: Point estimates and associated 95% confidence intervals for those ten
linear distances associated with the highest REM values

54
Figure 12. 3dMD versus Microscribe: ten linear distances associated with the highest REM values

55
Figure 13. 3dMD versus Microscribe: Point estimates and associated 95% limits of agreement for those ten
linear distances associated with the highest TEM values

56
Figure 14. 3dMD versus Microscribe: ten linear distances associated with the highest TEM values

57
Figure 15. 3dMD versus Microscribe: Point estimates and associated 95% confidence intervals for those ten
linear distances associated with the lowest ICC values

58
Figure 16. 3dMD versus Microscribe: ten linear distances associated with the lowest ICC values
59
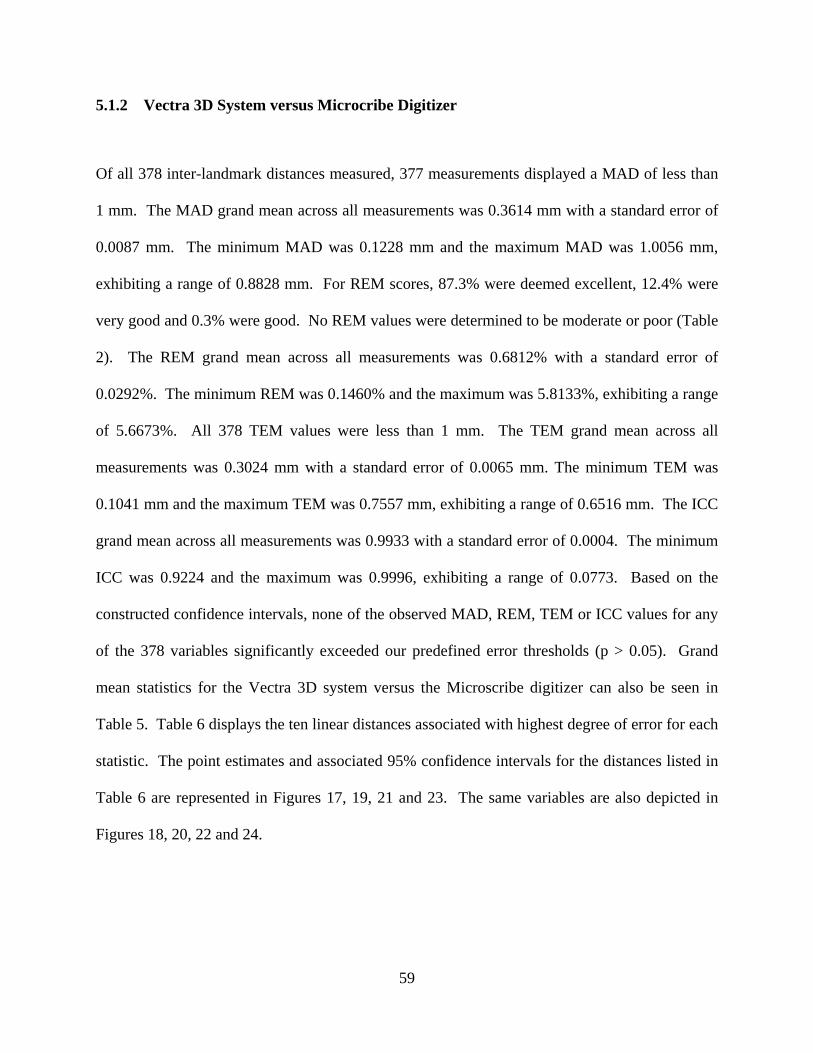
5.1.2 Vectra 3D System versus Microcribe Digitizer
Of all 378 inter-landmark distances measured, 377 measurements displayed a MAD of less than
1 mm. The MAD grand mean across all measurements was 0.3614 mm with a standard error of
0.0087 mm. The minimum MAD was 0.1228 mm and the maximum MAD was 1.0056 mm,
exhibiting a range of 0.8828 mm. For REM scores, 87.3% were deemed excellent, 12.4% were
very good and 0.3% were good. No REM values were determined to be moderate or poor (Table
2). The REM grand mean across all measurements was 0.6812% with a standard error of
0.0292%. The minimum REM was 0.1460% and the maximum was 5.8133%, exhibiting a range
of 5.6673%. All 378 TEM values were less than 1 mm. The TEM grand mean across all
measurements was 0.3024 mm with a standard error of 0.0065 mm. The minimum TEM was
0.1041 mm and the maximum TEM was 0.7557 mm, exhibiting a range of 0.6516 mm. The ICC
grand mean across all measurements was 0.9933 with a standard error of 0.0004. The minimum
ICC was 0.9224 and the maximum was 0.9996, exhibiting a range of 0.0773. Based on the
constructed confidence intervals, none of the observed MAD, REM, TEM or ICC values for any
of the 378 variables significantly exceeded our predefined error thresholds (p > 0.05). Grand
mean statistics for the Vectra 3D system versus the Microscribe digitizer can also be seen in
Table 5. Table 6 displays the ten linear distances associated with highest degree of error for each
statistic. The point estimates and associated 95% confidence intervals for the distances listed in
Table 6 are represented in Figures 17, 19, 21 and 23. The same variables are also depicted in
Figures 18, 20, 22 and 24.

60
Table 5. Error statistics for Vectra versus Microscribe averaged across all 378 linear distances
Grand Mean Standard Error Minimum Maximum Range
MAD 0.361 0.009 0.123 1.006 0.883
REM 0.681 0.029 0.146 5.813 5.667
TEM 0.302 0.007 0.104 0.756 0.652
ICC 0.993 0.0004 0.922 0.999 0.077
61
Table 6. Vectra versus Microscribe: the ten linear distances associated with the highest degree of error for
each of the four different error magnitude statistics
MAD (mm) REM (%) TEM (mm) ICC
Distance Value Distance Value Distance Value Distance Value
t(R)-ex(L) 0.802 cph(L)-sbal(R) 2.129 t(L)-ex(R) 0.612 cph(R)-sn 0.971
sbal(R)-ft(L) 0.809 sbal(L)-sn 2.282 or(R)-ft(L) 0.624 cph(L)-al(R) 0.971
go(R)-en(L) 0.830 al(R)-sn 2.536 go(R)-or(L) 0.626 en(R)-ft(L) 0.971
go(R)-or(L) 0.850 cph(R)-sbal(R) 2.769 ch(R)-ft(L) 0.649 t(R)-ch(R) 0.970
ch(R)-ft(L) 0.864 cph(R)-cph(L) 2.840 en(R)-ft(L) 0.653 al(L)-sn 0.962
t(R)-ft(L) 0.893 cph(R)-sn 2.997 t(R)-ft(L) 0.665 al(R)-sn 0.955
en(R)-ft(L) 0.898 cph(L)-sn 3.606 t(L)-or(R) 0.675 cph(L)-sbal(L) 0.954
go(R)-ex(L) 0.921 cph(L)-sbal(L) 3.908 go(R)-ex(L) 0.700 sbal(L)-al(R) 0.953
go(R)-t(L) 0.947 sbal(R)-al(L) 3.929 go(R)-ft(L) 0.738 cph(L)-sn 0.950
go(R)-ft(L) 1.006 sbal(L)-al(R) 5.813 go(R)-t(L) 0.756 go(R)-t(R) 0.922
See corresponding figures 17-24

62
Figure 17. Vectra versus Microscribe: Point estimates and associated 95% confidence intervals for those ten
linear distances associated with the highest MAD values

63
Figure 18. Vectra versus Microscribe: ten linear distances associated with the highest MAD values
64
Figure 19. Vectra versus Microscribe: Point estimates and associated 95% confidence intervals for those ten
linear distances associated with the highest REM values
65
Figure 20. Vectra versus Microscribe: ten linear distances associated with the highest REM values

66
Figure 21. Vectra versus Microscribe: Point estimates and associated 95% limits of agreement for those ten
linear distances associated with the highest TEM values
67
Figure 22. Vectra versus Microscribe: ten linear distances associated with the highest TEM values

68
Figure 23. Vectra versus Microscribe: Point estimates and associated 95% confidence intervals for those ten
linear distances with the lowest ICC values

69
Figure 24. Vectra versus Microscribe: ten linear distances associated with the lowest ICC values
70
5.2 PRECISION
5.2.1 3dMDface system versus Vectra 3D system
All 378 inter-landmark distances measured, displayed a MAD of less than 1 mm. The MAD
grand mean across all measurements was 0.1925 mm with a standard error of 0.0035 mm. The
minimum MAD was 0.0837 mm and the maximum MAD was 0.4617 mm, exhibiting a range of
0.3780 mm. For REM scores, 96.0% were deemed excellent and 4.0% were very good. No
REM values were determined to in the good, moderate or poor categories (Table 2). The REM
grand mean across all measurements was 0.3985% with a standard error of 0.0195%. The
minimum REM was 0.0746% and the maximum was 3.4655%, exhibiting a range of 3.3909%.
All 378 TEM values were less than 1 mm. The TEM grand mean across all measurement was
0.2994 mm with a standard error of 0.0064 mm. The minimum TEM was 0.0743 mm and the
maximum TEM was 0.3877 mm, exhibiting a range of 0.3143 mm. The ICC grand mean across
all measurements was 0.9969 with a standard error of 0.0003. The minimum ICC was 0.9224
and the maximum was 0.9999, exhibiting a range of 0.0775. Based on the constructed
confidence intervals, none of the observed MAD, REM, TEM or ICC values for any of the 378
variables significantly exceeded the predefined error thresholds (p > 0.05). Grand mean statistics
for the 3dMDface system versus the Vectra 3D system are presented in Table 7. Table 8
displays the ten linear distances associated with highest degree of error for each statistic. The
point estimates and associated 95% confidence intervals for the distances listed in Table 8 are
represented in Figures 25, 27, 29 and 31. The same variables are also depicted in Figures 26, 28,
30 and 32.
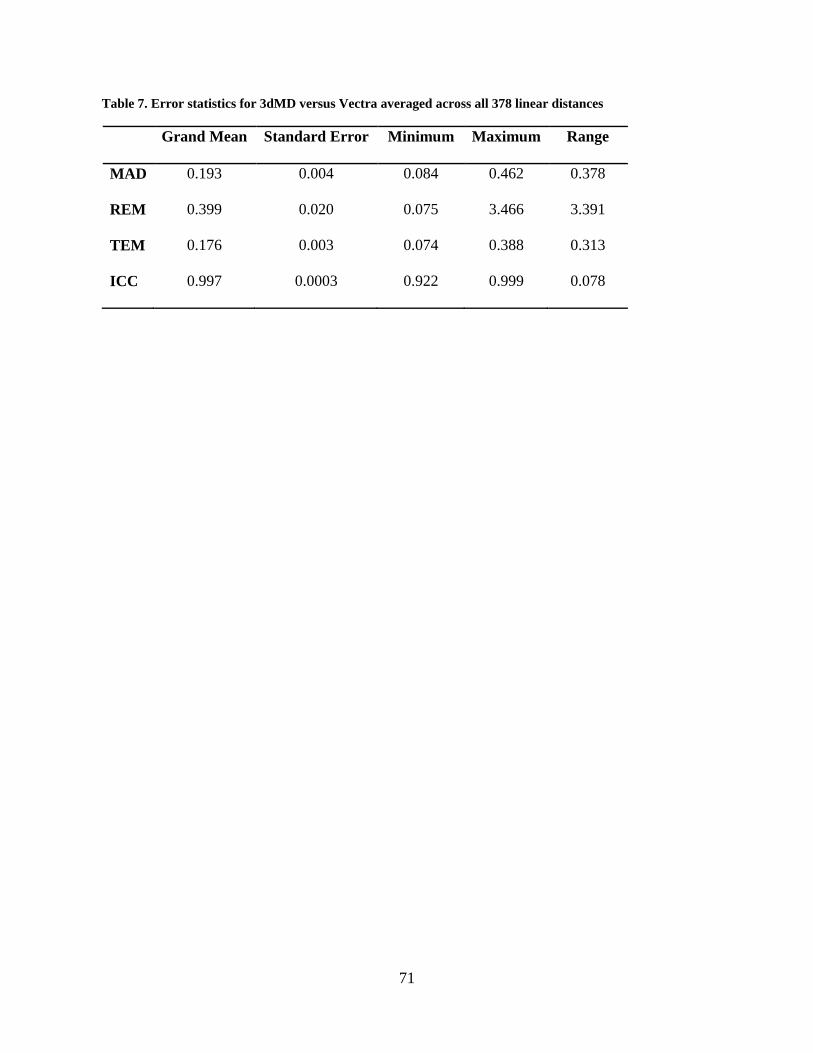
71
Table 7. Error statistics for 3dMD versus Vectra averaged across all 378 linear distances
Grand Mean Standard Error Minimum Maximum Range
MAD 0.193 0.004 0.084 0.462 0.378
REM 0.399 0.020 0.075 3.466 3.391
TEM 0.176 0.003 0.074 0.388 0.313
ICC 0.997 0.0003 0.922 0.999 0.078

72
Table 8. 3dMD versus Vectra: the ten linear distances associated with the highest degree of error for each of
the four different error magnitude statistics
MAD (mm) REM (%) TEM (mm) ICC
Distance Value Distance Value Distance Value Distance Value
cph(L)-ft(R) 0.366 sbal(L)-al(R) 1.456 or(L)-sn 0.335 cph(R)-sbal(R) 0.987
t(R)-al(R) 0.368 or(R)-en(R) 1.842 or(L)-sl 0.337 cph(L)-sbal(R) 0.987
cph(L)-tr 0.373 cph(L)-sbal(L) 1.849 cph(R)-en(R) 0.338 sbal(L)-or(L) 0.984
cph(L)-or(R) 0.377 cph(R)-cph(L) 1.857 cph(L)-or(L) 0.340 t(R)-gn 0.981
t(L)-or(L) 0.382 sbal(R)-sn 1.911 al(R)-en(R) 0.348 t(R)-sl 0.980
cph(R)-en(R) 0.398 cph(L)-sbal(R) 2.005 sbal(L)-or(L) 0.352 cph(R)-sn 0.978
al(R)-os(R) 0.419 cph(R)-sbal(R) 2.156 cph(R)-or(L) 0.356 or(R)-en(R) 0.976
al(R)-en(R) 0.434 sbal(R)-al(L) 2.598 t(L)-or(L) 0.356 t(R)-ch(R) 0.974
al(R)-ft(R) 0.437 cph(R)-sn 2.712 ch(L)-or(L) 0.378 cph(L)-sn 0.969
cph(L)-en(R) 0.462 cph(L)-sn 3.466 cph(L)-en(R) 0.388 go(R)-t(R) 0.922
See corresponding figures 25-32

73
Figure 25. 3dMD versus Vectra: Point estimates and associated 95% confidence intervals for those ten linear
distances associated with the highest MAD values
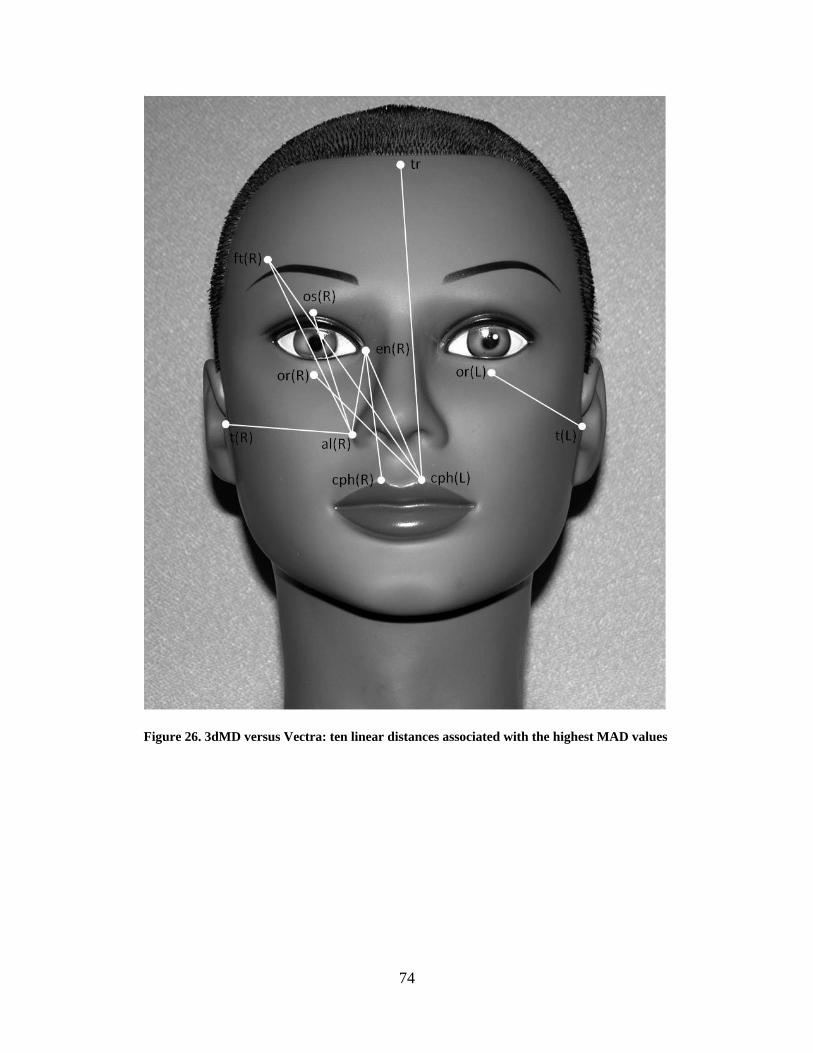
74
Figure 26. 3dMD versus Vectra: ten linear distances associated with the highest MAD values

75
Figure 27. 3dMD versus Vectra: Point estimates and associated 95% confidence intervals for those ten linear
distances associated with the highest REM values

76
Figure 28. 3dMD versus Vectra: ten linear distances associated with the highest REM values
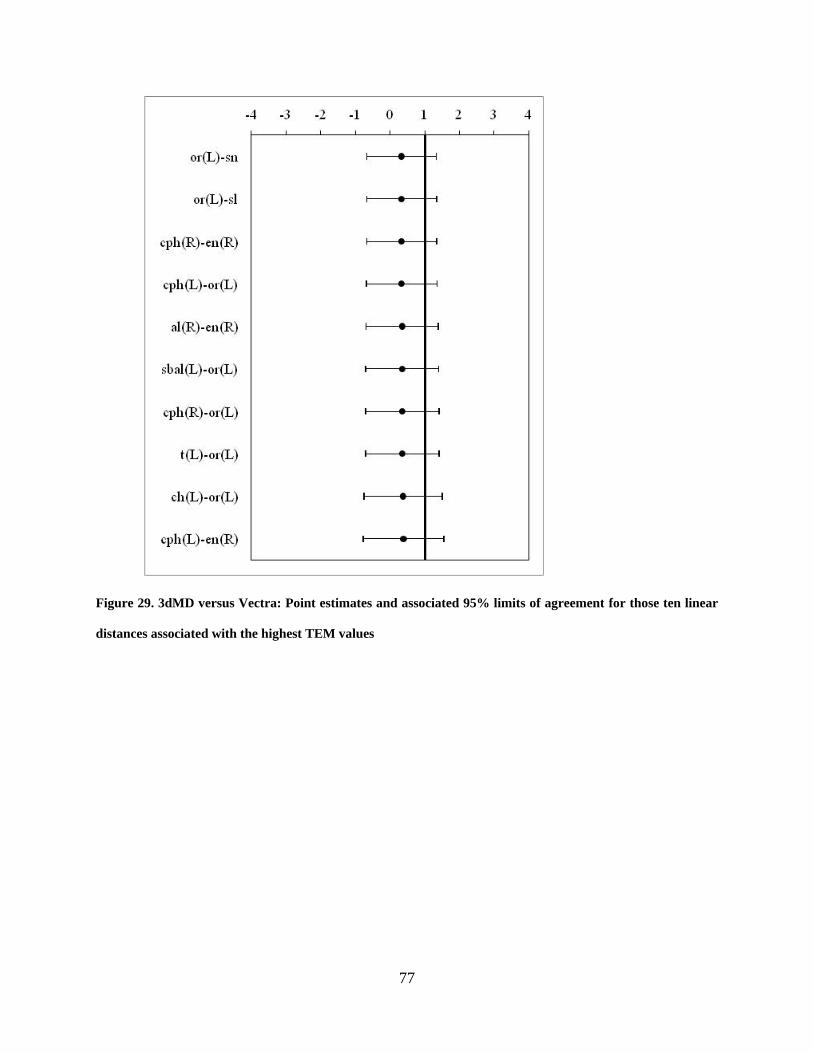
77
Figure 29. 3dMD versus Vectra: Point estimates and associated 95% limits of agreement for those ten linear
distances associated with the highest TEM values
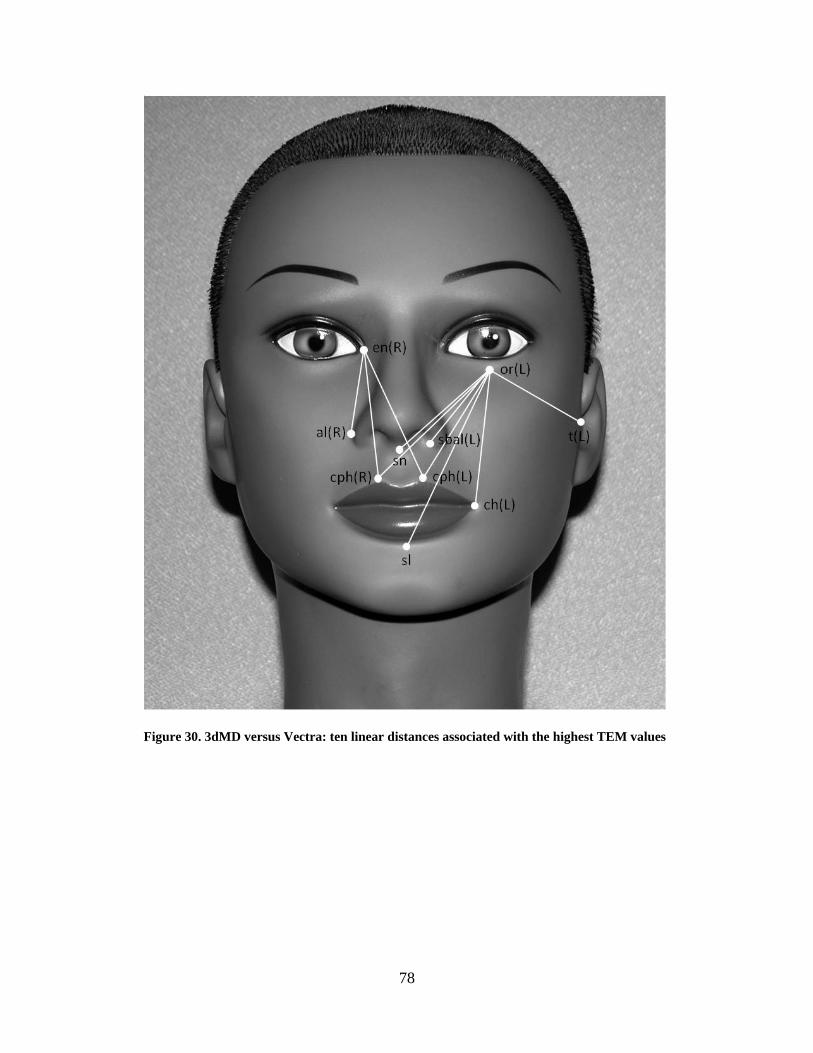
78
Figure 30. 3dMD versus Vectra: ten linear distances associated with the highest TEM values
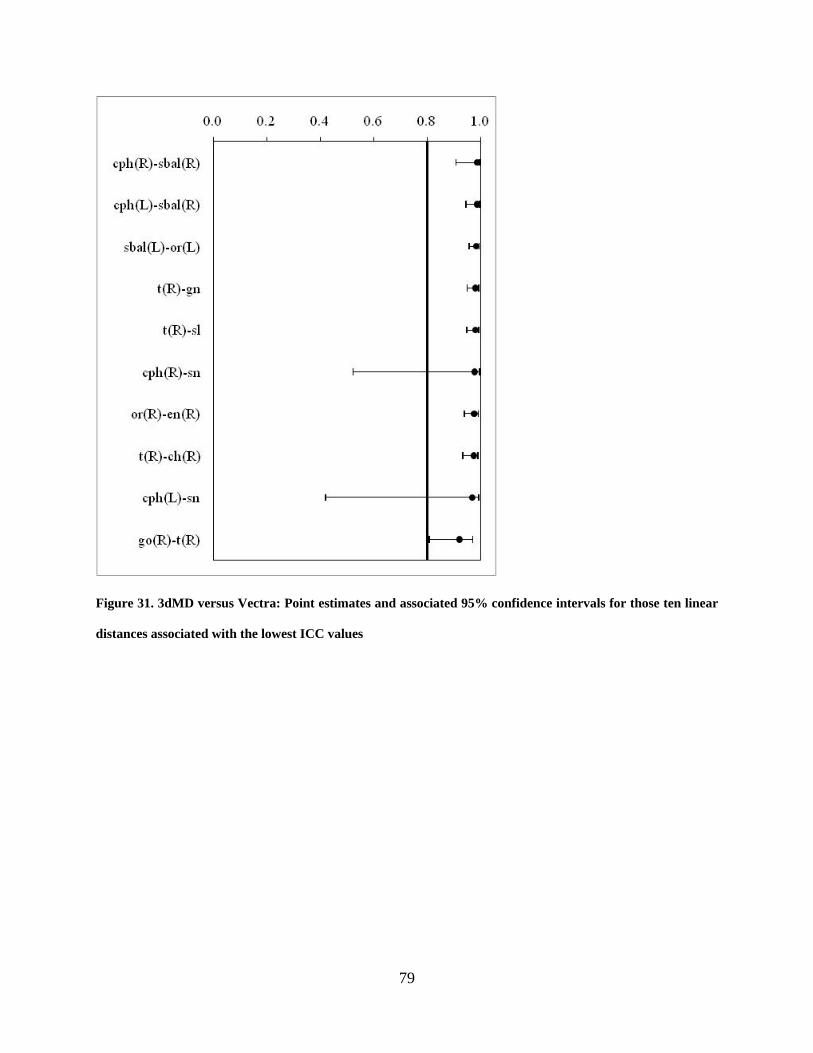
79
Figure 31. 3dMD versus Vectra: Point estimates and associated 95% confidence intervals for those ten linear
distances associated with the lowest ICC values

80
Figure 32. 3dMD versus Vectra: ten linear distances associated with the lowest ICC values

81
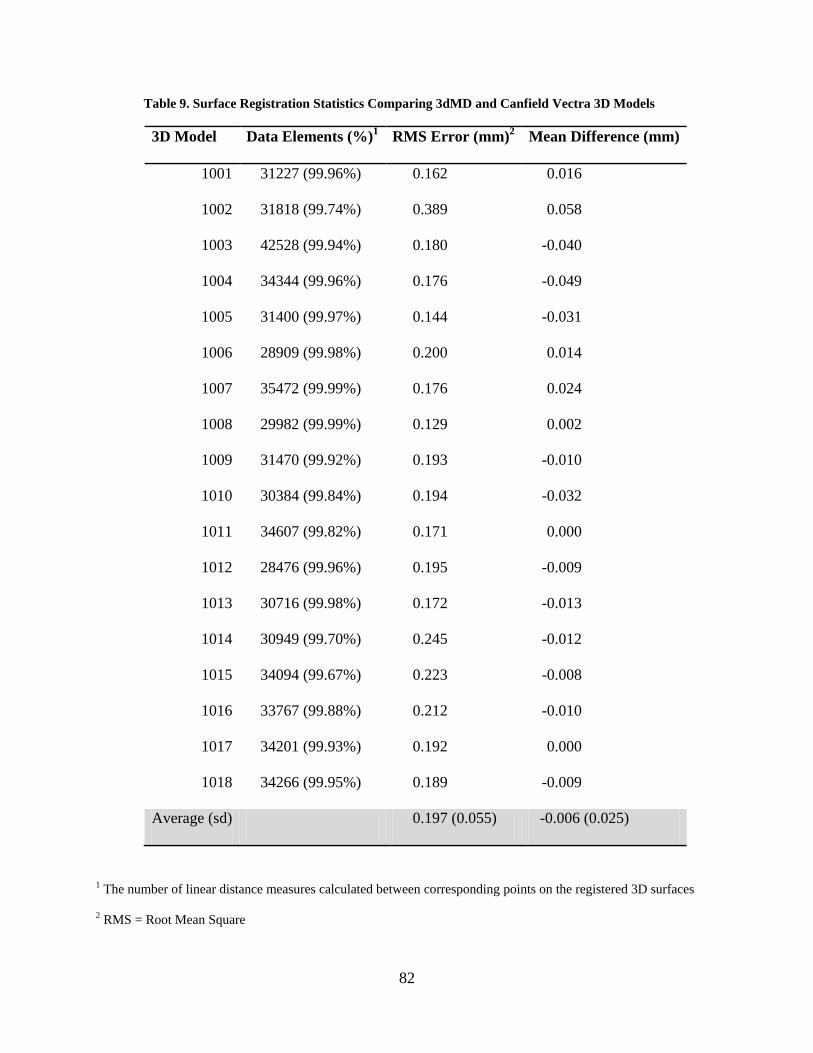
For the surface-to-surface comparison, the average RMS value across all 18 3D models
was 0.197 mm. Individual RMS values ranged from 0.129 mm to 0.389 mm. The average mean
difference between corresponding 3dMD and Vectra 3D surfaces was -0.006 mm (range: -0.049
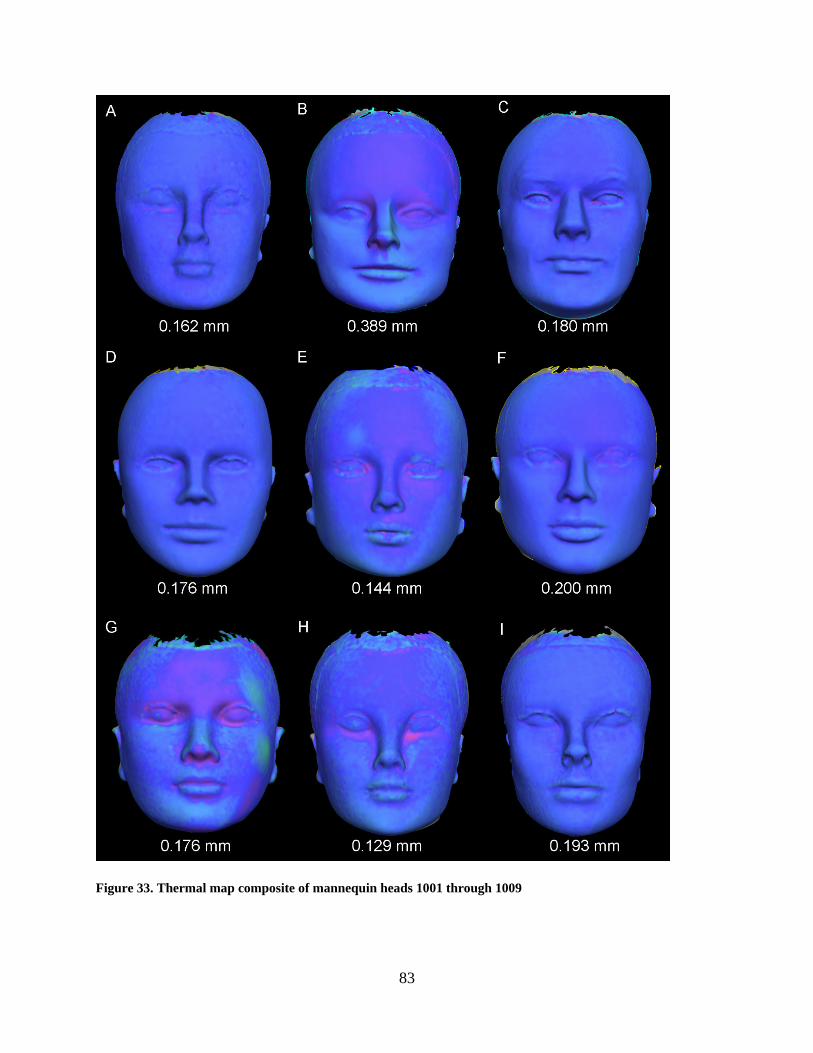
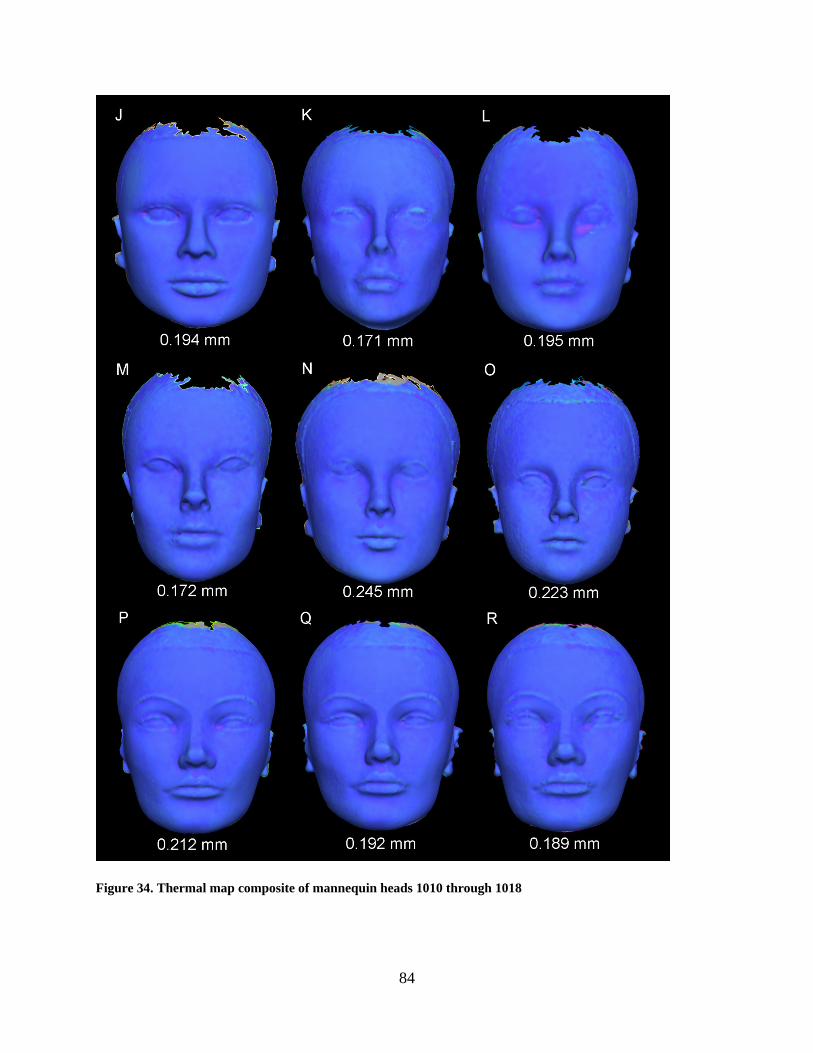
to 0.058). These results are presented in Table 9. Examples of thermal maps showing the
localized differences between corresponding 3D surfaces are shown in Figures 33 - 35.
82
Table 9. Surface Registration Statistics Comparing 3dMD and Canfield Vectra 3D Models
3D Model Data Elements (%)1 RMS Error (mm)2 Mean Difference (mm)
1001 31227 (99.96%) 0.162 0.016
1002 31818 (99.74%) 0.389 0.058
1003 42528 (99.94%) 0.180 -0.040
1004 34344 (99.96%) 0.176 -0.049
1005 31400 (99.97%) 0.144 -0.031
1006 28909 (99.98%) 0.200 0.014
1007 35472 (99.99%) 0.176 0.024
1008 29982 (99.99%) 0.129 0.002
1009 31470 (99.92%) 0.193 -0.010
1010 30384 (99.84%) 0.194 -0.032
1011 34607 (99.82%) 0.171 0.000
1012 28476 (99.96%) 0.195 -0.009
1013 30716 (99.98%) 0.172 -0.013
1014 30949 (99.70%) 0.245 -0.012
1015 34094 (99.67%) 0.223 -0.008
1016 33767 (99.88%) 0.212 -0.010
1017 34201 (99.93%) 0.192 0.000
1018 34266 (99.95%) 0.189 -0.009
Average (sd) 0.197 (0.055) -0.006 (0.025)
1 The number of linear distance measures calculated between corresponding points on the registered 3D surfaces
2 RMS = Root Mean Square
83
Figure 33. Thermal map composite of mannequin heads 1001 through 1009
84
Figure 34. Thermal map composite of mannequin heads 1010 through 1018
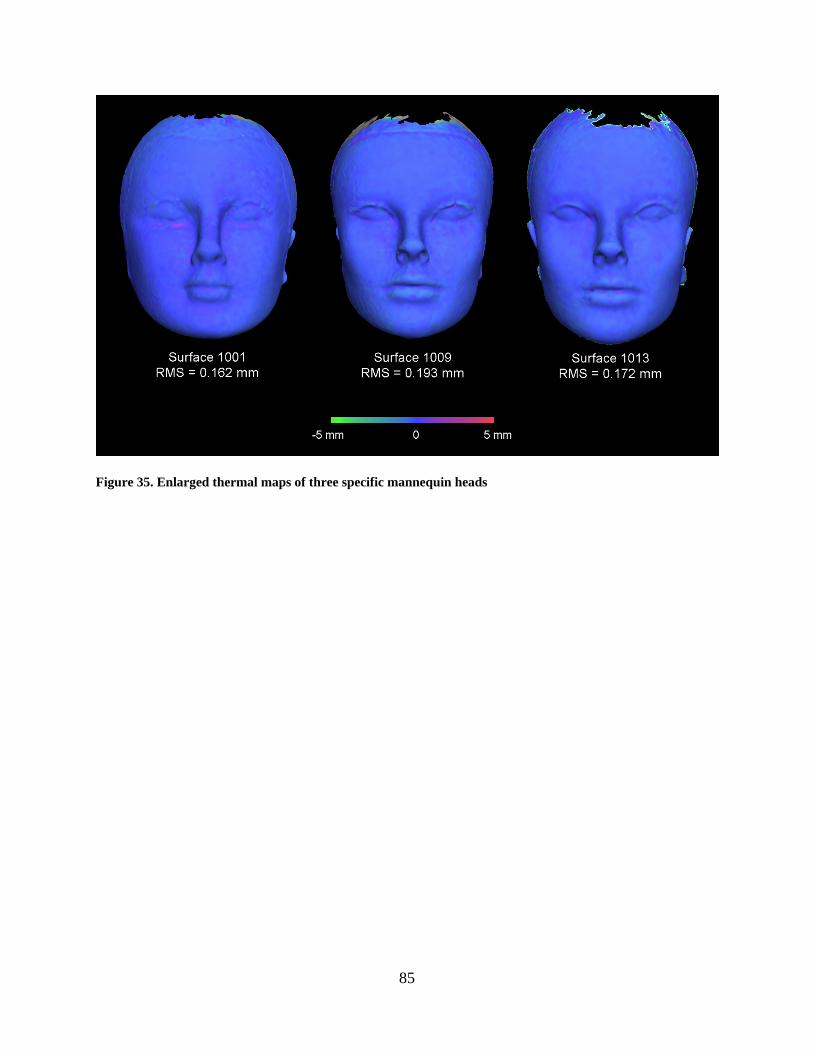
85
Figure 35. Enlarged thermal maps of three specific mannequin heads

86
5.3 QUALITATIVE IMPRESSIONS
Although the overwhelming majority of landmarks on the 3D images produced by both
stereophotogrammetric systems were visible and distinct, a handful of landmarks were faint
and/or distorted. The Canfield Vectra 3D system displayed a greater number of landmarks that
were difficult to identify. Some of the areas on the face that the Canfield Vectra 3D system
occasionally had trouble capturing were: around the eyes (orbitale superius, exocanthion,
endocanthion and orbitale), around the lips (cheilion and crista philtri) and the ears (tragion).
The 3dMD face system displayed fewer landmarks that were difficult to identify. Some of the
areas on the face that the 3dMD face system had trouble capturing were similar to the Canfield
Vectra 3D system: the corners of the eyes (endocanthion and exocanthion) and the ears (tragion).
On the other hand, the 3dMD face system did not seem to have as much trouble with areas
around the lips (cheilion and crista philtri) and above and below the eye (orbitale superius and
orbitale). Figure 36 shows examples of 3D images from both systems that have landmarks that
are unclear or distorted.

87
Figure 36. Examples of unclear or distorted landmarks from the 3D images

88
6.0 DISCUSSION
The objectives of this study were two-fold: (1) evaluate accuracy of craniofacial measurements
obtained using two commercially available 3D stereophotogrammetry systems (3dMDface and
Vectra 3D) by comparing their values to measurements obtained using a Microscribe 3DX
mechanical digitizer and (2) evaluate precision by directly comparing measurements obtained
with the different 3D photogrammetric systems. In regard to the first objective, both the
3dMDface and the Vectra 3D stereophotogrammetric systems were shown to be highly accurate.
When the 3dMDface system was compared to the Microscribe digitizer, 376 out of 378
measurements displayed MADs of less than 1 mm and exhibited a MAD grand mean of 0.3577
mm. 99.7% of REM scores were deemed excellent or very good and the REM grand mean was
0.6517%. All 378 TEM values were less than 1mm and the TEM grand mean was 0.2994 mm.
Finally, ICC ranged from 0.9616 to 0.9996 and exhibited a grand mean of 0.9944. When the
Canfield system was compared to the Microscribe digitizer, 377 out of 378 measurements
displayed MADs of less than 1 mm and exhibited a MAD grand mean of 0.3614 mm. 99.7% of
REM scores were deemed excellent or very good and the REM grand mean was 0.6812%. All
378 TEM values were less than 1mm and the TEM grand mean was 0.3024 mm. Finally, ICC
ranged from 0.9224 to 0.9996 and exhibited a grand mean of 0.9933. Taken together, these
results indicate that both 3D camera systems performed well within the limits of acceptable
accuracy for both routine clinical evaluation and basic research purposes.
89
With regard to the second objective, when the 3dMDface system was compared directly
to the Vectra 3D system, error magnitude statistics showed the systems to be highly compatible.
All 378 inter-landmark measurements displayed MADs of less than 1 mm and a MAD grand
mean of 0.1925 mm. 100% of REM scores were deemed excellent or very good and the REM
grand mean was 0.3985%. All 378 TEM values were less than 1mm and the TEM grand mean
was 0.1756 mm. Finally, ICC range from 0.9224 to 0.9999 and exhibited a grand mean of
0.9969. When 3D surfaces derived from each system were registered to one another and
compared directly, the global differences were consistently well-below 1 mm. For all practical
purposes, these results indicate that measurements derived from the two camera systems are
virtually interchangeable.
To date, the only other study that compares two different 3D photogrammetric systems to
one another is by Weinberg et al. (2006). This study examined measurement precision and
accuracy of the Genex FaceCam 250 and 3dMD face photogrammetric systems, by comparing
their indirect digital measurements to one another and to direct anthropometry. All mean
differences were found to be in the submillimeter range. These results are very similar to the
current study in which over 99% of MAD values were less than 1 mm. Although a number of
other studies evaluate the accuracy of individual 3D photogrammetric systems, it is difficult to
make meaningful comparisons to the current study (Meintjes et al. 2002, Ayoub et al. 2003,
Weinberg et al. 2004, Winder et al. 2008, Wong et al. 2008, Ma et al. 2009, Schaaf et al. 2010).
Reasons this comparison is difficult include: inconstancies in the use of terminology, methods of
data acquisition and analysis, and choice of statistics for error reporting. Furthermore, the study
population varies greatly from one study to another. For example, some studies use living
subjects, while others use cadaver heads and still other use plaster casts or head models.
90
Consequently, reports are mixed regarding the accuracy of digital 3D stereophotogrammetry,
with mean differences ranging from negligible (< 1 mm) to fairly discrepant (> 8mm). Despite
these varying results, a number of studies report high overall accuracy for 3D photogrammetric
systems, with most measurements exhibiting mean differences of less than 2 mm (Ayoub et al.
2003, Weinberg et al. 2004, Weinberg et al. 2006, Winder et al. 2008, Wong et al. 2008, Ma et
al. 2009).
The choice to use an inanimate sample was based on practical necessity, given the
geographic locations (Pittsburgh, PA and Dallas, TX) of the two imaging systems. The
consequence of this choice is that the accuracy and precision reported in the current study may
be high compared to similar studies that use living subjects. A certain amount of measurement
error is unavoidable with the use of human subjects for both direct and indirect anthropometry.
Direct anthropometry measurement error is mainly a result of direct contact of measurement
instruments with the pliable tissues of the face, causing soft tissue deformation (Farkas 1994b,
1996). While this source of error is eliminated with indirect anthropometry, movement during
3D image capture creates motion artifacts, which may be another source of error with this
technique. Motion artifacts are more likely to be found in 3D images acquired with 3D laser
surface scanners, since image capture can take up to 20 seconds. While the near instantaneous
image capture (on the order of several milliseconds) of digital 3D stereophotogrammetric
systems minimizes motion artifacts, this potential source of error is not completely eliminated.
It is well known in the anthropometric literature that a certain level of error arises from
landmark localization. Weinberg et al. (2004) found that the use of pre-labeled landmarks
resulted in overall higher precision for both direct and indirect anthropometric measurements.
Thus, it would be expected that the use of pre-labeled landmarks in the present study would

91
provide elevated accuracy and precision estimates compared to similar studies that did not pre-
label landmarks. It appears the use of pre-labeled landmarks is becoming more common in 3D
stereophotogrammetry validation studies (Ayoub et al. 2003, Weinberg et al. 2004, Weinberg et
al. 2006, Winder et al. 2008, Ma et al. 2009, Schaaf et al. 2010). In fact, Heike et al. (2009)
recommends pre-labeling landmarks that are identified by palpation and those used in multiple
measurements as a standard protocol for stereophotogrammetric 3D image capture.
A number of studies compare direct anthropometry to indirect measurements, acquired
through a variety of 3D imaging systems including 3D stereophotogrammetry, surface laser
scanning and CBCT. Instruments commonly utilized for the direct anthropometry reference
standard include, digital sliding calipers, spreading calipers, rulers and cloth metric tape
(Meintjes et al. 2002, Weinberg et al. 2004, Weinberg et al. 2006, Winder et al. 2008, Wong et
al. 2008, Heike et al. 2009, Schaaf et al. 2010). The choice of reference method taken to
represent the “true” value is another factor that makes comparisons between different validation
studies difficult. The current study used the Microscribe 3DX 3D digitizer as the direct
anthropometry reference standard, which is a well established and highly-tested measuring
device. The advantage of using the 3D digitizer was it provided x, y and z coordinate data for
each landmark, allowing for the calculation of all possible inter-landmark distances. Other
studies to use a similar accuracy reference standard are Ayoub et al. (2003) and Ma et al. (2009),
both of which reported an average mean difference below 1 mm.
As knowledge continues to accumulate regarding the heritability of normal facial
variation as well as the genetic underpinning for many craniofacial anomalies, there is an ever-
increasing need for high quality phenotypic data. The use of affordable, non-invasive 3D surface
imaging technology provides an opportunity to capture detailed quantitative information about
92
the face in a large number of individuals. However, sometimes it is not always possible for a
single research institution to acquire enough subjects with a given genotype or phenotype to
design a study with sufficient power. Consequently, the creation of multi-center studies and
databases through collaborative efforts between institutions is vital to the continued advancement
of craniofacial research. These multi-center databases allow for the establishment of sufficiently
large study populations, permitting investigators to make stronger, more definitive statistical
conclusions. A current initiative known as the FaceBase Consortium is attempting to
systematically compile craniofacial research data, including 3D facial surface data into one large
multi-center database (www.FaceBase.org). Since a number of 3D stereophotogrammetric
systems are commercially available, it is not uncommon for various institutions or investigators
to utilize different technologies. Thus, knowledge of the compatibility between alternative 3D
imaging systems is essential in efforts such as the FaceBase Consortium, where the need
potentially exists to compare and merge independent 3D data sets collected with different
imaging systems. In relation to the current study, the research question was asked: Do the
Vectra-3D and 3dMDface imaging systems produce facial measurements sufficiently similar to
allow for their data to be combined or compared statistically? Results indicate that
measurements derived from the Vectra-3D and 3dMDface imaging systems are virtually
identical. Furthermore, both systems demonstrated similarly high levels of accuracy when
compared to the Microscribe digitizer. Thus, both imaging systems produce facial measurements
sufficiently similar to allow for their data to be combined or compared statistically.
93
BIBLIOGRAPHY
Aldridge K, Boyadjiev SA, Capone GT, DeLeon VB, Richtsmeier JT. (2005). Precision and Error of Three-Dimensional Phenotypic Measures Acquired From 3dMD Photogrammetric Images. Am J Med Genet 138A:247-253.
Ayoub A, Garrahy A, Hood C, White J, Bock M, Siebert JP, Spencer R, Ray A. (2003). Validation of a vision-based, three-dimensional facial imaging system. Cleft Palate Craniofac J 40:523-529.
Baca DB, Deustch CK, D’Agostino RB. (1994). Correspondence between direct anthropometry and structured light digital measurement. In: Farkas LG, ed. Anthropometry of the Head and Face. New York: Raven press; 235-237.
Baumrind S and Frantz RC. (1971). The reliability of head film measurements. Am J Orthod Dentofacial Orthop 60:111-127.
Cameron N. The methods of auxological anthropometry. In: Falkner F, Tanner JM, eds. Human Growth: A Comprehensive Treatise. Vol. 3. New York: Plenum Press;1986:3-46.
Corner BD, Lele S, Richtsmeier JT. (1992). Measuring precision of three-dimensional landmark data. J Quant Anthropol 3:347-359.
Farkas LG, ed. Anthropometry of the Head and Face. New York: Raven Press;1994.
Farkas LG, Bryson W, Klotz J. (1980). Is photogrammetry of the face reliable? Plast Reconstr Surg 66:346-355.
Fleiss JL.(1986). The Design and Analysis of Clinical Experiments. New York: John Wiley and Sons.
Fourie Z, Damstra J, Gerrits PO, Ren Y. (2010). Evaluation of anthropometric accuracy and reliability using different three-dimensional scanning systems. Forensic Sci Int. Article in Press, Correct Proof.
Frisancho AR. Anthropometric Standards for the Assessment of Growth and Nutritional Status. Ann Arbor, MI: University of Michigan Press;1990.

94
Gordon CC, Bradtmiller B. (1992). Interobserver error in a large scale anthropometric survey. Am J Hum Biol 4:253-263.
Gordon CC, Churchill T, Clauser CE, Bradtmiller B, McConville JT, Tebbetts I, Walker RA. 1988 Anthropometric Survey of U.S. Army Personnel: Methods and Summary Statistics. Natick, MA: U.S. Army Natick Research, Development, and Engineering Center;1989.
Habicht JP, Yarbrough C, Martorell R. (1979). Anthropometric field methods: criteria for selection. In: Jelliffe DB, Jelliffe EFP (eds). Nutrition and Growth. New York: Plenum Press; 365-387.
Heike CL, Cunningham ML, Hing AV, Stuhaug E, Star JR. Picture Perfect? (2009).Reliability of Craniofacial Anthropometry Using Three-Dimensional Digital Stereophotogrammetry. Plast Reconstr Surg 124:1261-1272.
Hildebolt CF and Vannier MW. (1988). Three-dimensional measurement accuracy of skull surface landmarks. Am J Phys Anthropol 76:497-503.
Hopkins WG. Measures of reliability in sports medicine and science. (2000). Sports Med 30:1-15.
Kolar JC, Salter EM. (1997). Craniofacial Anthropometry: Practical Measurement of the Head and Face for Clinical, Surgical and Research Use. Springfield: Charles C. Thomas.
Lane C, Harrell W. (2008). Completing the 3-dimensional picture. Am J Orthod Dentofacial Orthop 133:612-620.
Ma L, Xu T, Lin J. (2009). Validation of a three-dimensional facial scanning system based on structured light techniques. Comput Methods Programs Biomed 94:290-298.
Malina RM, Hamill PVV, Lemeshow S. Selected Body Measurements of Children 6-11 Years, United States. Vital and Health Statistics, Series 11, No. 123. Washington: U.S. Government Printing Office;1973.
McGraw KO, Wong SP. (1996). Forming inferences about some intraclass correlation coefficients. Psychol Methods 1:30-46.
Meintjes EM, Douglas TS, Martinez F, Vaughan CL, Adams LP, Stekhoven A, Viljoen D. (2002). A stereophotogrammetric method to measure the facial dysmorphology of children in the diagnosis of fetal alcohol syndrome. Med Eng Phys 24:683-689.
Menezes M, Rosati R, Ferrario VF, Sforza C. (2010). Accuracy and Reproducibility of a 3-Dimensional Stereophotogrammetric Imaging System. J Oral Maxillofac Surg 68:2129-2135.
Mueller WH, Martorell R. (1988). Reliability and accuracy of measurement. In: Lohman TG, Roche AF, Martorell R (eds). Anthropometric Standardization Reference Manual. Champaign: Human Kinetics Books; 83-86.
95
Proffit WR, Fields Jr. WH, Sarver DM. Contemporary Orthodontics. St. Louis: Mosby Elsevier; 2007.
Schaaf H, Pons-Kuehnemann J, Malik CY, Streckbein P, Preuss M, Howaldt HP, Wilbrand JF. (2010). Accuracy of three-dimensional photogrammetric images in non-synostotic cranial deformities. Neuropediatrics. 41:24-29.
Schwenzer-Zimmer K, Haberstok J, Kovacs L, Boerner BI, Schwenzer N, Juergens P, Zeilhofer HF, Holber C. (2008). 3D Surface Measurement for Medical Application – Technical Comparison of Two Established Industrial Surface Scanning Systems. J med Syst 32:59-64.
Ulijaszek SJ, Kerr DA. (1999). Anthropometric measurement error and the assessment of nutritional status. Br J Nutr 82:165-177.
Ulijaszek SJ, Lourie JA. Intra- and inter-observer error in anthropometric measurement. In: Ulijaszek SJ, Mascie-Taylor CGN, eds. Anthropometry: the Individual and the Population. Cambridge, UK: Cambridge University Press;1994:30-55.
Utermohle CJ, Zegura SL (1982). Intra- and interobserver error in craniometry; a cautionary tale. Am J Phys Anthropol. 57:303-310.
Utermohle CJ, Zegura SL, Heathcote GM (1983). Multiple observers, humidity, and choice of precision statistics: factors influencing craniometric data quality. Am J Phys Anthropol. 61:85-95.
Vegelin AL, Brukx LJ, Waelkens JJ, Van Den Broeck J (2003). Influence of knowledge, training and experience of observers on the reliability of anthropometric measurements in children. Ann Hum Biol. 30:65-79.
Ward RE, Jamison PL. (1991). Measurement precision and reliability in craniofacial anthropometry: implications and suggestions for clinical applications. J Craniofac Genet Dev Biol 11:156-164.
Weinberg SM, Scott NM, Neiswanger K, Brandon CA, Marazita ML. (2004). Digital Three-Dimensional Photogrammetry: Evaluation of Anthropometric Precision and Accuracy Using a Genex 3D Camera System. Cleft Palate Craniofac J 41:507-518.
Weinberg SM, Naidoo S, Govier DP, Martin RA, Kane AA, Marazita ML. (2006). Anthropometric Precision and Accuracy of Digital Three-Dimensional Photogrammetry: Comparing Systems with One Another and with Direct Anthropometry. J Craniofac Surg 17:477-483.
Williams FL and Richtsmeier JT. (2003). Comparison of Mandibular Landmarks from Computed Tomography and 3D Digitizer Data. Clin Anat 16:494-500.

96
Winder RJ, Darvann TA, McKnight W, Magee JD, Ramsay-Baggs P. (2008). Technical validation of the Di3D stereophotogrammetry surface imaging system. Br J Oral Maxillofac Surg 46:33-37.
Wong JY, Oh AK, Ohta E, Hunt AT, Rogers GF, Mulliken JB, Deutsch CK. (2008).Validity and Reliability of Craniofacial Anthropometric Measurement of 3D Photogrammetric Images. Cleft Palate Craniofac J 45:232-239.