digital photogrammetric monitoring of river bank...
TRANSCRIPT
Photogrammetric Record, 15(89): 753–764 (April 1997)
DIGITAL PHOTOGRAMMETRIC MONITORINGOF RIVER BANK EROSION
By C. J. PYLE, K. S. RICHARDS
University of Cambridge
and J. H. CHANDLER
Loughborough University
(Paper read at the Thompson Symposium held at the University of York on21st April, 1996)
AbstractDetailed understanding of the processes which control river bank
erosion requires high resolution information concerning temporal changesin bank morphology. This paper describes the successful use of digitalphotogrammetry to extract high resolution digital elevation models (DEMs)from terrestrial oblique stereopairs of rapidly eroding river banks, usingthe commercial software package Erdas Imagine. This software was devel-oped for use with aerial photography and satellite imagery; problemsrelating to the use of oblique terrestrial images are discussed and solutionspresented. Photography was acquired using semi-metric cameras, mountedon tripods and positioned about 15 m from the eroding bank. Data for DEMpoint spacings of 20 mm were obtained, with accuracies of approximately12 12 mm in depth. Digital photogrammetry can permit faster analysis,provide better accuracies and involve less ground disturbance than conven-tional methods of monitoring river channel change. Most importantly, DEMgeneration is considered to be more useful than traditionally acquiredpoints or profiles for landform monitoring strategies.
INTRODUCTION
RIVER BANK dynamics are of direct importance not only to landowners threatened bybank retreat, but also to engineers, ecologists and geomorphologists concerned withpatterns of water quality, erosion and sedimentation, and channel migration. Anumber of diverse processes interact to control and alter bank morphology, from themobilization of individual particles by water flow, to the mass failure of largesediment blocks in response to changing soil-water pressures. Various attempts havebeen made to describe and model the dominant processes of bank erosion in differentenvironments (van Eerdt, 1985; Springeret al., 1985; Osman and Thorne, 1988;Budhu and Gobin, 1995; Darby and Thorne, 1994; Kovacs and Parker, 1994).However, such models have rarely been subjected to rigorous comparison with fieldobservations which quantify the extent and spatial distribution of different bankerosion processes. Their parameterization and verification require detailed threedimensional description of morphological changes, information which has proveddifficult to obtain.
Existing methods of monitoring bank erosion usually involve simple repeatsurveying of the bank edge or channel cross-section (Ashworth and Ferguson, 1986;Odgaard, 1987), or the insertion of metal pins or light-sensitive cells into the bank
753
face and monitoring of their gradual exposure by erosion, to give point informationabout bank retreat (Wolman, 1959; Lawler, 1993). These methods tend to requireconsiderable field labour and may involve significant disturbance of the channel edge.More fundamentally, the changing three dimensional form of the bank face isunlikely to be satisfactorily described by measurements at a small number of pointsor profiles, especially since the accuracy of these measurements is generally notknown.
Photogrammetry represents an alternative, non-intrusive technique for monitor-ing landform evolution (Chandleret al., 1987; Chandler and Cooper, 1989; Lawler,1993; Laneet al., 1993). Geomorphologists have long used photography as a meansof describing landforms, including river channels, but have only recently begun toappreciate the potential of the photograph to provide accurate three dimensionaltopographic information (Chandler and Moore, 1989; Laneet al., 1994).
A small number of studies have used analogue and analytical photogrammetrictechniques to monitor rates and patterns of bank erosion (Collins and Moon, 1979;Welch and Jordan, 1983; Laneet al., 1994; Dixon et al., 1997). Conventionalanalogue and analytical methods are rigorous and produce detailed three dimensionalrepresentations of topography. However, they require hardware which is costly andspecialized, and analogue methods impose mechanical limitations making analysisimpossible in some geometrical situations. These conventional techniques are timeconsuming to use and may be subject to operator error.
Automated image correlation techniques allow much more rapid extraction ofdigital elevation models (DEMs) from scanned stereophotographs; hence digitalphotogrammetric workstations have replaced the analytical plotter as the mainphotogrammetric tool in a wide variety of applications (Dowmanet al., 1992; Heipke,1995; Brunsden and Chandler, 1996). One aim of the present project is to facilitatea photogrammetric “technology transfer” amongst geomorphologists, similar to thattaking place in other industries (Fraser, 1993).
This paper describes the extraction of detailed DEMs of rapidly eroding gravelriver banks from terrestrial oblique stereophotographs, using commercial digitalphotogrammetric software originally developed for use with normal aerial photo-graphy and satellite imagery.
IMAGE ACQUISITION
Fieldwork was carried out in July 1995 on the proglacial stream of the HautGlacier d’Arolla, Valais, Switzerland (Fig. 1). The steep slopes and unconsolidatedgravels of the valley floor give rise to rates of bank erosion which are highly variablebut may locally approach several metres per day at times of high discharge. Previousstudies in the area have used conventional analytical photogrammetric methods tostudy channel dynamics (Laneet al., 1994); the present investigation applies digitalmethods to close range photographs of small sections of bank within the upperreaches of the river.
Hasselblad ELX 500 semi-metric cameras, with 553 55 mm format and fittedwith a 25-cross re´seau plate, were used to acquire imagery. The radial lens distortionof the cameras is described by a polynomial curve, on the basis of laboratory test fieldexperiments.
Stereopairs of photographs of eroding banks were taken daily or more fre-quently; at times of rapid erosion photographs were taken at intervals of a fewminutes. Tripods were mounted on the opposite bank of the river or on mid-channelbars, to achieve base: distance ratios of approximately 1;3 to 1;4. The camera/objectdistance was controlled by the width of the river, a distance of about 15 m havingbeen used in the examples discussed below. The cameras have a cone of view ofaround 40°, so at this distance the entire height of the bank (1 m to 2 m) occupies onlya small part of each photograph and, with approximately 100 per cent overlap, thevisible width of bank is about 10 m. Control targets were glued onto stones on thebank face, where this was possible in safety and with minimal disturbance. Where thebank face was difficult to access or appeared sensitive to disturbance, L-shaped metalhangers were fixed to the bank top and used to suspend targets from the bank edge.
754

FIG. 1. Location of the study site: Haut Glacier d’Arolla, Valais, Switzerland.
In this way, the area of interest was surrounded by targets with little disturbance tothe bank face itself. Sufficient targets were positioned to ensure that a minimum offive were visible on each pair of images. A Leica total station or digital tacheometerwas used to establish the three dimensional co-ordinates of the targets and estimatesof target positions were obtained by least squares adjustment (using the GeneralisedAdjustment Procedure, developed at City University).
Automatic image correlation requires ubiquitous small scale variations in lightintensity in each image; the coarse gravels which dominate bank sediments at Arollaprovide excellent texture of this nature. This advantage was somewhat offset by thedifficulty of obtaining correct exposures for the area of the bank face, despite keepingapertures and shutter speeds around recommended values, because the harsh lightingat altitude gave rise to large contrasts between banks in shadow and brightly litsurrounding areas. A primary concern was that the image matching software mightnot be successful in areas of low or repetitive texture, particularly in areas which wereslightly underexposed.
DATA ANALYSIS
The number of points recorded by a photograph is limited only by the grain sizeof the film; consequently, there is almost total flexibility in the amount of data whichcan be extracted (Chandler and Moore, 1989). In digital photogrammetry, thescanning resolution used to convert the images to digital form provides the effectivecontrol on the point density which is achievable in the image space. The camera/ob-ject distance and focal length determine the equivalent point density in the objectspace. The black and white Hasselblad negatives were scanned at a resolution of20mm with 256 levels of grey, using the Helava DSW100 scanning workstation atCity University, each pixel representing in this case an area of approximately43 4 mm of the bank face. The size of each image file is approximately 8 MB.
755

Analysis has been performed using the commercial remote sensing and GISsoftware package Erdas Imagine, mounted on an Ultra Sparc 140E workstation. ErdasImagine includes the Orthomax module which performs automatic DEM extractionand digital orthorectification.
The operator enters the camera parameters (focal length, radial distortion model,position of fiducials) and the object space co-ordinates of the control targets, and usesa mouse to identify the fiducial marks, control targets, and an unlimited number ofpass points on the screen. Orthomax computes the parameters of interior orientationand then absolute orientation, using a standard bundle adjustment.
Automatic stereomatching then allows the creation of DEMs and ortho-images.The image correlation algorithm used by Orthomax is an area correlator, whichcross-correlates pixel intensity values between a “template” patch from the left imageand a “search” patch from the right image. These values are normalized to takeaccount of overall differences in contrast and brightness between the two sourceimages. The algorithm is hierarchical, performing correlations at successively higherimage resolutions before analysis of the raw imagery takes place, in order to constrainthe template search area and minimize false fixes. Automatic post-processing at eachresolution attempts to identify and exclude anomalous dips and spikes.
The image correlation algorithm is distinctive in its use of orthorectified imagesin the matching process; results from the previous, coarser, resolution are combinedwith those from the current resolution to orthorectify patches at a number ofelevations both above and below that predicted for the point, using the calculatedinterior and exterior orientation parameters to model the imaging event. The cross-correlation coefficient is then calculated for each of these elevation “slices”, and themost probable elevation is regarded as that which maximizes the correlationcoefficient. This method avoids the need for image resampling either during corre-lation or in the creation of the gridded DEM, and is intended to improve the qualityof image correlation by removing the effects of terrain variation, sensor geometry andcamera position before stereomatching at the highest resolution is attempted (VisionInternational, 1994).
Orthomax is intended for employment with normal aerial photography andsatellite imagery; its use with terrestrial oblique images required a modification to theco-ordinate system of the photographed area. A rotation was applied to the objectspace co-ordinates of the control targets, using a simple Visual Basic program, suchthat the bank face would appear flat in the normal vertical case. Since photographswere acquired with the camera axis almost normal to the near-vertical bank faces, thisinvolved a rotation through approximately 90° of tilt. The images were then presentedto Orthomax in the usual way, the co-ordinate system suggesting it to be a normalvertical projection.
This use of Orthomax therefore differs in several aspects from the aerialapplications for which it is designed. There were four areas of particular concern:
(1) whether rotation of the co-ordinate system would be straightforward andproduce results which enabled the image correlator to function;
(2) whether visual texture provided by the bank face would be sufficient for thestereomatching necessary for DEM acquisition;
(3) whether irregularities in the bank platform would give rise to values ofrelative relief (camera distance/object relief) outside the capabilities ofOrthomax; and
(4) whether the package would allow analysis at the small scale required, forexample permitting target object space positions to be specified with asufficiently high precision for close range work.
RESULTS
Digital extraction of DEMs from terrestrial oblique photographs of the Arollariver banks has proved both successful and straightforward; doubts that unusualfeatures associated with this particular application (including the four points detailedabove) would prevent analysis by Orthomax have not been realized. This paper
756

FIG. 2. Ortho-image of the bank face on 25th July, generated with optimum parameters. Grid in metres.
briefly discusses results derived from DEMs generated for an area of approximately12 m2 of river bank, using a 20 mm grid, for three epochs from July 1995.
Fig. 2 shows an ortho-image of the bank face from 25th July (the value ofortho-images is discussed further in the next section); individual coarse gravel andcobble clasts are visible in the steep bank face, and recent instability is evidenced bythe small debris cone which has accumulated at the base of the bank betweenapproximatelyx5 82·5 m andx5 84·4 m. The bank top is in strong sunlight and thechaotic foreground indicates failure of the stereomatching process in the imaged areaof the river.
Qualitative inspection of a DEM of the same area of bank on the following day(26th July) suggested that there had been no change. However, it was possible toestablish that localized but significant erosion had in fact occurred, by performing asimple comparison with the previous day’s DEM. The topographic surface generatedfor 25th July was subtracted from that of 26th July to give a DEM of difference,shown as the upper image in Fig. 3: the pale grey pixels have values close to zero;white pixels have positive values, indicating deposition; and darker areas havenegative values, indicating net erosion. The horizontal line at approximatelyz5 28·6 m represents the top of the bank, and the line near toz5 27·2 m is the water’sedge. Most of the bank experienced little change, as initial inspection suggested.However, the dark area betweenx5 80 m andx5 81 m and abovez5 28 m has pixelvalues of approximately2 0·1 m, suggesting that localized erosion has taken place.By itself, a DEM of the difference between two epochs is often difficult to interpret,but it is straightforward for the Imagine user to link the on-screen cursors between aDEM and an ortho-image of the same area, and thus unambiguously identify areas ofapparent change. The two small ortho-images shown in Fig. 3 indicate that “real”change has indeed occurred in this area; it is clear that a cluster of stones immediatelybelow the bank top disappeared in the 26th July image.
Non-photogrammetric monitoring methods would have be unable to identifysuch subtle and restricted changes, while the time required for conventional photo-grammetric methods might have precluded DEM extraction for two epochs whichappeared identical on initial inspection. However, digital photogrammetry allowedthe identification and quantitative definition of quite subtle changes between theDEMs of 25th and 26th July.
Comparison of the 26th July results with those from a third epoch illustratesanother aspect of the flexibility of the technique. Fig. 4 shows the DEM of differenceproduced by subtracting the 26th July surface from a DEM generated from photo-graphy on 29th July. In this case, the dark areas of the DEM of difference have pixelvalues of approximately2 0·6 m, and it is clear that substantial erosion has takenplace across the majority of the bank face. This was also obvious in the field, becausethe L-shaped hanging targets at each end of the bank had disappeared during theerosion event. Target positions were established with reference to a wider controlnetwork, and so it was possible to position and survey a new set of photographictargets on the bank face, using the same datum, and to extract DEMs of the new bankface with only minimal inconvenience. This ability to measure erosion in areas whichhave suffered major disturbance is a particular advantage of the photogrammetricmethod. It is also significant that, while the loss of all targets and hangers suggested
757

758
111111F
IG.
3.T
op:D
EM
ofdifference
ofthe
bankface
between
25thand
26thJuly.
Bottom
:ortho-im
agesidentifying
smallarea
ofchange.
Grid
inm
etres.

FIG. 4. DEM of difference of the bank face between 26th and 29th July, showing major change. Grid in metres.
that the entire bank face had been removed, Fig. 4 in fact shows that a central core(the pale area betweenx5 81 m and 82 m) of the bank suffered little and locally noerosion occurred. Landform monitoring strategies based on points or profiles whichsimply interpolate between widely spaced measured points would certainly haveyielded misleading results in this example; even more seriously,in situ measuringdevices would often have been destroyed by such severe erosion.
DEM QUALITY ASSESSMENT
The importance of assessing the quality of any measurement process is particu-larly significant where automated measurement methods have been used. The qualityof the DEMs generated by Orthomax has been assessed in two ways: firstly by thevisual inspection of ortho-images and secondly by the quantitative comparison ofmultiple DEMs obtained for a single area.
Visual Assessment of DEM Quality
Visual assessment of DEM quality is not straightforward. A typical initial stagein the analysis of a conventional large scale landscape DEM is a qualitative assess-ment of its geomorphic consistency, shown for example by the connectivity of ridgesor stream channels, and its conformance to the operator’s knowledge of the terrain(Bolstad and Stowe, 1994). However, the irregular topography and random sedimen-tary character of the bank face generally combined to make such an assessment ofDEM quality impossible in the present case.
A satisfactory alternative method for the qualitative assessment of DEM qualityhas proved to be the visual inspection of ortho-images. An ortho-image is an imagereprojected to remove the distorting effects of perspective geometry and relief; it iseffectively the result of “draping” a DEM with one of the original images from whichit has been derived. Areas of poor topographic representation give rise to errors inorthorectification, and appear as “wrinkles”, “stretches” or blurred areas in theortho-image. Distortions to the straight hangers to which control targets were attachedalso indicate errors in the image correlation and DEM extraction process. Suchdistortions act as a useful guide in identifying areas of poor performance and inrapidly differentiating between the results of DEMs collected with different user-specified parameters.
Considerable uncertainty surrounds the choice of parameters for use by theimage correlation and DEM extraction software; a total of 16 parameters may bespecified by the operator in the “DEM Tool” of Orthomax, with only limited guidanceavailable as to the true significance of each. Qualitative experimentation to datesuggests that DEM quality is improved by increasing the search range allowed forstereomatching, and particularly by the noise and minimum thresholds (the minimumcorrelation coefficients required respectively to consider or accept a point) which arespecified (Table I). Contrary to expectations, best results have been achieved byapplying very stringent controls on the acceptability of matches, even though thismay increase the proportion of DEM points whose positions are estimated byinterpolation.
759
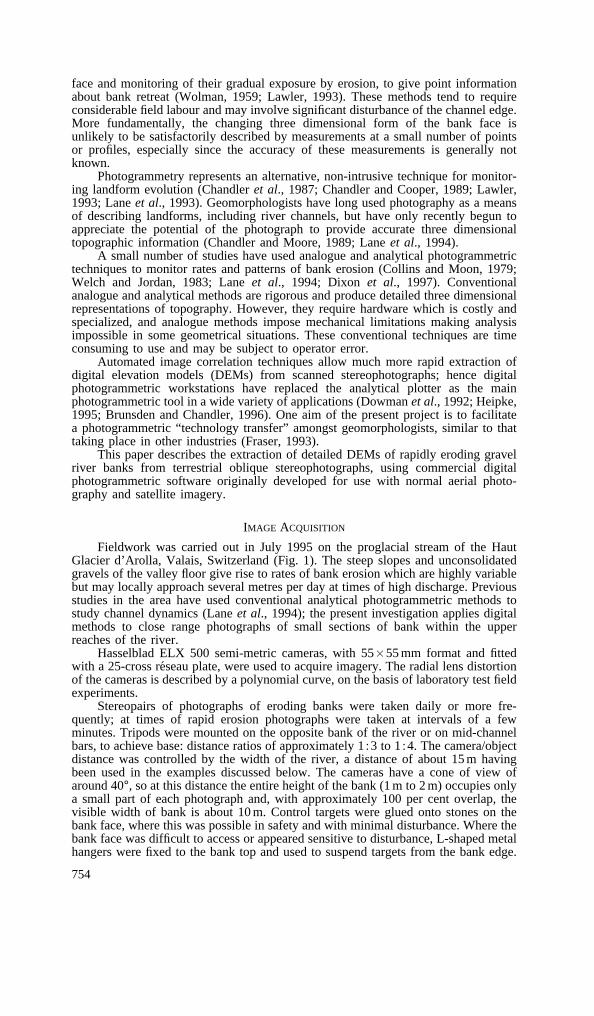
TABLE I. Optimum and default parameters used for image matching and DEMcreation by Orthomax.
Parameter Default value Optimum value
Minimum threshold 0·6 0·9Noise threshold 0·4 0·7x parallax search range (pixels) 5 10y parallax search range (pixels) 0 1
The ortho-images in Figs. 2 and 5 illustrate the difference between resultsobtained with optimum and default image matching parameter values. The extensivewrinkled and blurred areas in Fig. 5 contrast with the clear results which wereachieved with higher cut-off criteria and a larger search range in Fig. 2; in particular,the straightness of the control target hangers suspended vertically near tox5 77·9 mand 85·1 m suggests that distortion is minimal.
Quantitative Assessment of DEM Quality
The quality of several parts of the DEM collection process may be evaluatedquantitatively. For example, in close range applications, the precision of the controlsurvey may provide the main limitation on the precision of the final DEM. In thepresent work, standard errors in the position of photocontrol targets were calculatedas part of the least squares adjustment applied to the survey observations; these weregenerally better than 10 mm inx andy, and 1 mm inz. The bundle adjustment mayimprove these values further, however, and Orthomax provides a statistical estimateof the success of the triangulation process. The precision of the image matchingprocess estimated by Orthomax is typically around 0·1 pixel (or 0·4 mm in the objectspace) and represents another partial measure of DEM quality.
However, the end user is primarily interested in the accuracy of the DEM itself,and this should also be assessed. Distortions to the DEM arise from the propagationof inaccuracies during interior and exterior orientation, resulting from errors such asinadequate modelling of the camera lens distortion, imprecise identification of targetsor fiducial marks, as well as incorrect matching at the image correlation stage.
A standard test of DEM accuracy is the use of independent ground survey toprovide independent check points, but problems of access and disturbance made thisimpossible in the present study. Provision of ground truth data is likely to offer onlya partial assessment of DEM quality in small scale work such as this, because of thedifficulty of measuring more than a very small number of points, ensuring surveyaccuracies better than a few millimetres, and unambiguously identifying each locationwith the corresponding point on the DEM.
The alternative method used to assess DEM accuracy in this study consideredthe reproducibility of DEM results for a single area. DEMs derived from differentpairs of photographs have been compared for an area of bank which appears (from
FIG. 5. Ortho-mage of the bank face on 25th July, generated with default collection parameters. Contrast theblurred and distorted areas with Fig. 2. Grid in metres.
760

FIG. 6. Histogram showing pixel values of DEM of difference, for area of no change. Mean5 -0·008 m, standarddeviation5 6 0·012 m.
detailed inspection of clasts visible on the ortho-images) not to have experienced anychange between two epochs.
Fig. 6 presents the results of a typical analysis, which is a histogram of the pixelvalues for 3800 points in the DEM of difference shown in Fig. 3 (away from the smallarea of change discussed above). If no erosion or deposition has taken place, theposition of each point will be identical, and the value of each point on this DEM ofdifference should ideally be zero. Fig. 6 shows that pixel values are in fact normallydistributed and centred around a mean of2 8 mm. The most useful indication ofDEM accuracy is to state this mean value, and the standard deviation of thedistribution of differences (Li, 1988), which in this case is1
2 12 mm. On the basis ofthis sampled area, the accuracy of the DEM is therefore estimated to be2 8 mm1
2 12 mm. This represents an accuracy of approximately 1/1000 of the cam-era/object distance, towards the lower end of accuracies achieved in aerial photo-graphy (Fryeret al., 1994). This may be attributable to the close range nature of thisstudy, because errors in the estimates of ground point positions are much largerrelative to the camera/object distance than would be expected in large scale mapping.In terms of modelling the geomorphological processes, these accuracies are con-sidered highly satisfactory.
DISCUSSION:GEOMORPHOLOGICALSIGNIFICANCE
The coarse gravel banks analysed in this study are rich in fine scale visualtexture, allowing successful image correlation and DEM production with Orthomax.The extent to which less favourable (fine grained) sedimentary environments can bemonitored in a similar way is not yet known: current research on the River Severnaims to resolve this important question. Although grain scale texture will normallyfall into the sub-pixel size range in such environments, river banks in fine grainedsediments typically appear rich in texture at the ped or block scale, and initial resultssuggest that application to fine grained sediments should not prove problematic.
Digital photogrammetry is being used to support a geomorphological studyaddressing the relationship between soil moisture flow within river banks and theprocesses of bank collapse. Recent physically based numerical models have examinedthe effect on bank stability of soil moisture flow in response to changing river levels(Springeret al., 1985; Budhu and Gobin, 1995). DEMs generated by the present workwill be used to provide topographic boundary conditions for such simulations, and toprovide detailed comparisons between model predictions and observed failure pat-terns as individual blocks of cohesive sediment slide down an internal failure plane.
761
An area of particular uncertainty has been the development of this failure plane,theoretical models of tension crack development being hampered by a lack ofobservational evidence (Darby and Thorne, 1994). The authors are also attempting touse automatically derived DEMs of collapsing river banks to define the position andshape of these failure planes for the first time.
A particular concern is the effect of DEM accuracy on model output. Anincreasing number of studies in the earth sciences are using DEMs to define thetopographic boundary conditions for numerical models of geomorphic processes(Richardset al., 1995), allowing geomorphological theories to be tested againstobserved earth surface changes. However, errors in the representation of topographytend to be ignored unless their effects are so severe as to make analysis impossible(Garbrecht and Starks, 1995). For example, Burbank (1992, p. 484) states that currentresearch demonstrates that “Earth scientists will have no trouble digesting whatevertopographic data are sent their way”; where this trend involves the uncriticalapplication of data whose accuracy is unknown, however, its benefits are questionable(Fryer et al., 1994). Rigorous evaluation is rarely performed even for probabilisticreliability analyses, which are increasingly important in hydraulic and geotechnicalmodelling and whose results depend on correct estimation of the uncertainties ofinput variables (Johnson, 1996). It is critical that DEM based modelling begins toincorporate a probabilistic approach, associating topographic positions with statisticalerror bounds (Hunter and Goodchild, 1995) in order to quantify the uncertainty inmodel predictions. A major advantage of digital photogrammetric methods is theirpotential for the straightforward generation of multiple DEMs for accuracy assess-ment in the manner which has been described above.
CONCLUSIONS
This study has used digital photogrammetry to map rates of retreat acrossapproximately 12 m2 of river bank, creating a series of DEMs with point spacings of20 mm and accuracies of around2 8 mm1
2 12 mm. A simple rotation to the objectspace co-ordinates of the photocontrol network was applied to simulate the normalcase, and allowed the use of terrestrial oblique stereopairs in the digital photogram-metric workstation package Erdas Orthomax. Acquisition of distributed three dimen-sional terrain data involved minimal contact and allowed retrospective control overthe temporal resolution of measurement, by the selection of significant epochs foranalysis. The method has proved capable of measuring both subtle and major changesin bank form. Its most significant feature is its ability to reconstruct topographicsurfaces at a very fine scale, avoiding the errors due to interpolation between widelyspaced points which are implicit in traditional methods of monitoring landformchange based on points or profiles. The DEMs created are considered greatly toincrease the potential for detailed understanding and modelling of bank erosionprocesses.
Many areas of field and laboratory study in the earth sciences require highresolution topographic data, at a variety of scales and in situations which are no moregeometrically complex than those described here. For such work, digital photo-grammetry seems able to provide high resolution DEMs while involving less disturb-ance, providing better accuracies, and operating at greater speeds than methodscurrently in use.
A critical advantage of in-house DEM generation by digital photogrammetry isits potential for straightforward accuracy assessment. Statistical estimates of uncer-tainty can be made in the way which has been described, and the confidence limitsassociated with topographic parameters should be used to guide the sensitivity testingof subsequent process models.
ACKNOWLEDGEMENTS
C. J. Pyle gratefully acknowledges receipt of NERC studentship GT4/94/315A.The semi-metric cameras used in this project were obtained by J. H. Chandler andK. S. Richards from the NERC small grant GR3/547a.
762

REFERENCES
ASHWORTH, P. J. and FERGUSON, R. I., 1986. Interrelationships of channel processes, changes and sedimentsin a proglacial braided river.Geografiska Annaler, 68A(4): 361–371.
BOLSTAD, P. V. and STOWE, T., 1994. An evaluation of DEM accuracy: elevation, slope, and aspect.Photogrammetric Engineering and Remote Sensing, 60(11): 1327–1332.
BRUNSDEN, D. and CHANDLER, J. H., 1996. The continuing evolution of the Black Ven mudslide, 1946-95.Theories put to the test.Advances in hillslope processes(Eds. S. Brooks and M. Anderson). Wiley,Chichester. 1306 pages: 869–896.
BUDHU, M. and GOBIN, R., 1995. Seepage erosion from dam-regulated flow: case of Glen Canyon Dam,Arizona. ASCE Journal of Irrigation and Drainage Engineering, 121(1): 22–33.
BURBANK, D. W., 1992. Characteristic size of relief.Nature, 359(6395): 483–484.CHANDLER, J. H., CLARK, J. S., COOPER, M. A. R. and STIRLING, D. M., 1987. Analytical photogrammetry
applied to Nepalese slope morphology.Photogrammetric Record, 12(70): 443–458.CHANDLER, J. H. and COOPER, M. A. R., 1989. The extraction of positional data from historical photographs
and their application to geomorphology.Ibid., 13(73): 69–78.CHANDLER, J. H. and MOORE, R., 1989. Analytical photogrammetry: a method for monitoring slope
instability. Quarterly Journal of Engineering Geology, 22(2): 97–110.COLLINS, S. H. and MOON, G. C., 1979. Stereometric measurement of streambank erosion.Photogrammetric
Engineering and Remote Sensing, 45(2): 183–90.DARBY, S. E. and THORNE, C. R., 1994. Prediction of tension crack location and riverbank erosion hazards
along destabilized channels.Earth Surface Processes and Landforms, 19(3): 233–245.DIXON, L. F. J., BARKER, R., BRAY, M., FARRES, P., HOOKE, J., INKPEN, R., MEREL, A., PAYNE, A. and
SHELFORD, A., 1997. Analytical photogrammetry for geomorphological research.Landform monitor-ing, modelling and analysis(Eds. S. N. Lane, K. S. Richards and J. S. Chandler). Wiley, Chichester.In press.
DOWMAN, I. J., EBNER, H. and HEIPKE, C., 1992. Overview of European developments in digital photogram-metric workstations.Photogrammetric Engineering and Remote Sensing, 58(1): 51–56.
VAN EERDT, M. M., 1985. Salt marsh cliff stability in the Oosterschelde.Earth Surface Processes andLandforms, 10(2): 95–106.
FRASER, C. S., 1993. A resume of some industrial applications of photogrammetry.ISPRS Journal ofPhotogrammetry and Remote Sensing, 48(3): 12–23.
FRYER, J. G., CHANDLER, J. H. and COOPER, M. A. R., 1994. On the accuracy of heighting from aerialphotographs and maps: implications to process modellers.Earth Surface Processes and Landforms,19(6): 577–583.
GARBRECHT, J. and STARKS, P., 1995. Note on the use of USGS Level 1 7.5-minute DEM coverages forlandscape drainage analyses.Photogrammetric Engineering and Remote Sensing, 61(5): 519–522.
HEIPKE, C., 1995. State-of-the-art of digital photogrammetric workstations for topographic applications.Ibid., 61(1): 49–56.
HUNTER, G. J. and GOODCHILD, M. F., 1995. Dealing with error in spatial databases: a simple case study.Ibid., 61(5): 529–537.
JOHNSON, P. A., 1996. Uncertainty of hydraulic parameters.ASCE Journal of Hydraulic Engineering,122(2): 112–114.
KOVACS, A. and PARKER, G., 1994. A new vectorial bedload formulation and its application to the timeevolution of straight channels.Journal of Fluid Mechanics, 267: 153–183.
LANE, S. N., RICHARDS, K. S. and CHANDLER, J. H., 1993. Developments in photogrammetry; the geomor-phological potential.Progress in Physical Geography, 17(3): 306–328.
LANE, S. N., CHANDLER, J. H. and RICHARDS, K. S., 1994. Developments in monitoring and modellingsmall-scale river bed topography.Earth Surface Processes and Landforms, 19(4): 349–368.
LAWLER, D. M., 1993. The measurement of river bank erosion and lateral channel change: a review.Ibid.,18(9): 777–821.
LI, Z., 1988. On the measure of digital terrain model accuracy.Photogrammetric Record, 12(72): 873–877.ODGAARD, A. J., 1987. Streambank erosion along two rivers in Iowa.Water Resources Research,23(7):
1225–1236.OSMAN, A. M. and THORNE, C. R., 1988. Riverbank stability analysis. I: Theory.ASCE Journal of Hydraulic
Engineering, 114(2): 134–150.RICHARDS, K., ARNOLD, N., LANE, S., CHANDRA, S., EL-HAMES, A., MATTIKALLI , N. and CHANDLER, J., 1995.
Numerical landscapes: static, kinematic and dynamic process-form relations.Zeitschrift fur Geomor-phologie, Supplementband, 101: 201–220.
SPRINGER, F. M., ULLRICH, C. R. and HAGERTY, D. J., 1985. Streambank stability.ASCE Journal ofGeotechnical Engineering, 111(5): 624–640.
VISION INTERNATIONAL, 1994.IMAGINE Orthomax user’s guide. Unpublished document.WELCH, R. and JORDAN, T. R., 1983. Analytical non-metric close-range photogrammetry for monitoring
stream channel erosion.Photogrammetric Engineering and Remote Sensing, 49(3): 367–374.WOLMAN, M. G., 1959. Factors influencing erosion of a cohesive river bank.American Journal of Science,
257(3): 204–216.
763

Resume
Pour comprendre en de´tail la facon dont s’erode la rive d’un coursd’eau, il est ne´cessaire d’avoir des informations a` haute resolution sur lesvariations temporelles de la morphologie de cette rive. On de´crit dans cetarticle l’emploi reussi de la photogramme´trie numerique qui a permisd’obtenir des mode`les nume´riques du terrain (MNT) a` haute resolution apartir de couples ste´reoscopiques de photographies terrestres obliques surles rives d’un fleuve s’e´rodant rapidement, en utilisant l’ensemble deslogiciels Erdas Imagine du commerce.
Ces derniers avaient e´te developpes pour traiter des photographiesaeriennes et des images-satellites; on examine donc les proble`mes que l’ona recontres pour les appliquer a` des images terrestres obliques et l’ondecrit les solutions mises en œuvre. On a effectue´ la prise de vues photo-graphiques avec des chambres semi-me´triques, installe´es sur des tre´pieds etplaces aenviron 15 m du rivage e´rode. On a realise les MNT avec des pasde 20 mm et obtenu des pre´cisions d’environ12 12 mm sur les e´loignements.La photogramme´trie numerique permet de faire des analyses plus rapides,fournit des pre´cisions meilleures et introduit moins de perturbations sur leterrain que les me´thodes classiques de suivi des variations du cours desfleuves.
De plus dans les strate´gies de suivi des formes du terrain, on conside`reque la production de MNT est plus utile que la saisie classique de profilsou de semis de points, ce qui constitue un e´lement tres important.
Zusammenfassung
Ein detailliertes Versta¨ndnis des Prozesses, der die Erosion vonFlußufern steuert, erfordert hochauflo¨sende Informationen in bezug auf diezeitlichen Vera¨nderungen der Ufer-Morphologie. Im Beitrag wird dieerfolgreiche Nutzung der Digitalphotogrammetrie zur Gewinnung digitalerHohenmodelle (DEM) hoher Auflo¨sung aus terrestrischen Schra¨gbild-paaren von schnell erodierenden Flußufern unter Nutzung des kommerziel-len Software-Pakets Erdas Imagine beschrieben. Diese Software wurde zurAnwendung auf Luft- und Satellitenbilder entwickelt. Probleme, die sich ausder Anwendung terrestrischer Schra¨gbilder ergaben, werden diskutiert, undes werden Lo¨sungen dargestellt. Die photographische Aufnahme erfolgtemit Hilfe semimetrischer Kameras, die auf Stativen im Abstand von etwa15 m von dem erodierenden Ufer aufgestellt waren. Fu¨r die DEM-Bestim-mung wurden Daten mit 20 mm Abstand mit einer ungefa¨hren Genauigkeitvon1
2 12 mm in der Tiefe erhalten. Die Digitalphotogrammetrie kann eineschnellere Analyse erlauben, liefert bessere Genauigkeiten und umfaßtgeringere Gela¨ndesto¨rungen als konventionelle Verfahren des Monitoringder Veranderung von Flußla¨ufen. Am wichtigsten erscheint, daß die DEM-Erzeugung fu¨r die Erfassungsstrategien von Landformen brauchbarer ist,als traditionell gewonnene Punkte oder Profile.
764