digital coupon redeemer: exposed
TRANSCRIPT

© GfK 2012 | LEAD Marketing Conference | October 2012 1
Digital Coupon Redeemer:
Exposed
Neal Heffernan
SVP – Shopper & Retail Strategy
© GfK 2012 | LEAD Marketing Conference | October 2012 2
Agenda
● Current Coupon Trends
● Purchase Profile of Digital Coupon Redeemer
● Categories in Highest Demand
● Coupon Performance Benchmarks
© GfK 2012 | LEAD Marketing Conference | October 2012 3
Coupons are Genius!
© GfK 2012 | LEAD Marketing Conference | October 2012 4
© GfK 2012 | LEAD Marketing Conference | October 2012 5
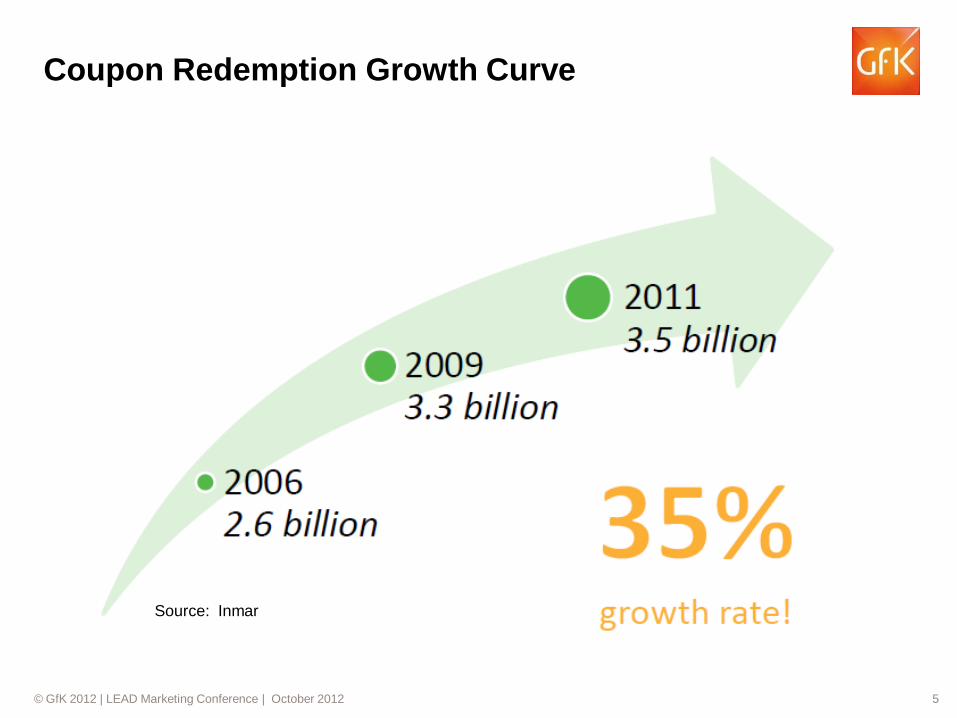
Source: Inmar
Coupon Redemption Growth Curve
© GfK 2012 | LEAD Marketing Conference | October 2012 6
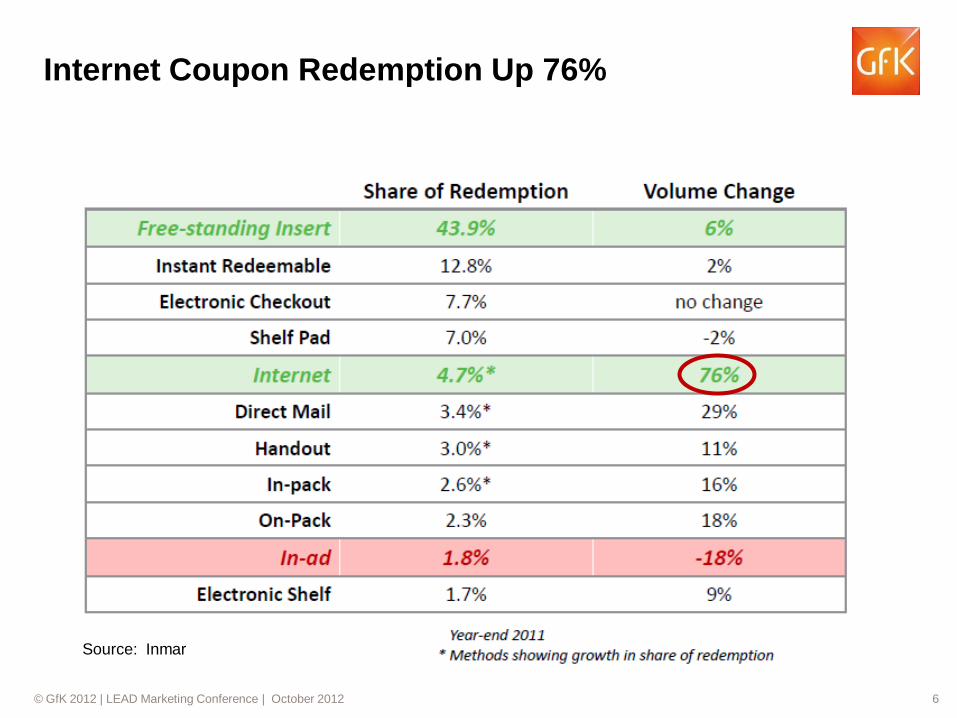
Source: Inmar
Internet Coupon Redemption Up 76%
© GfK 2012 | LEAD Marketing Conference | October 2012 7
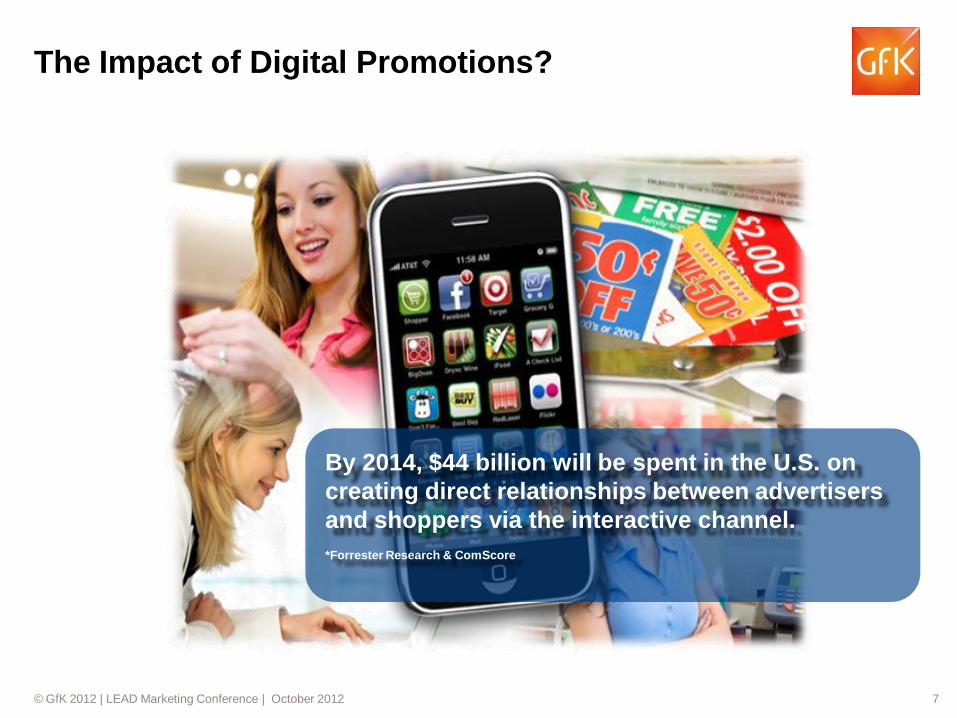
The Impact of Digital Promotions?
By 2014, $44 billion will be spent in the U.S. on
creating direct relationships between advertisers
and shoppers via the interactive channel.
*Forrester Research & ComScore
© GfK 2012 | LEAD Marketing Conference | October 2012 8
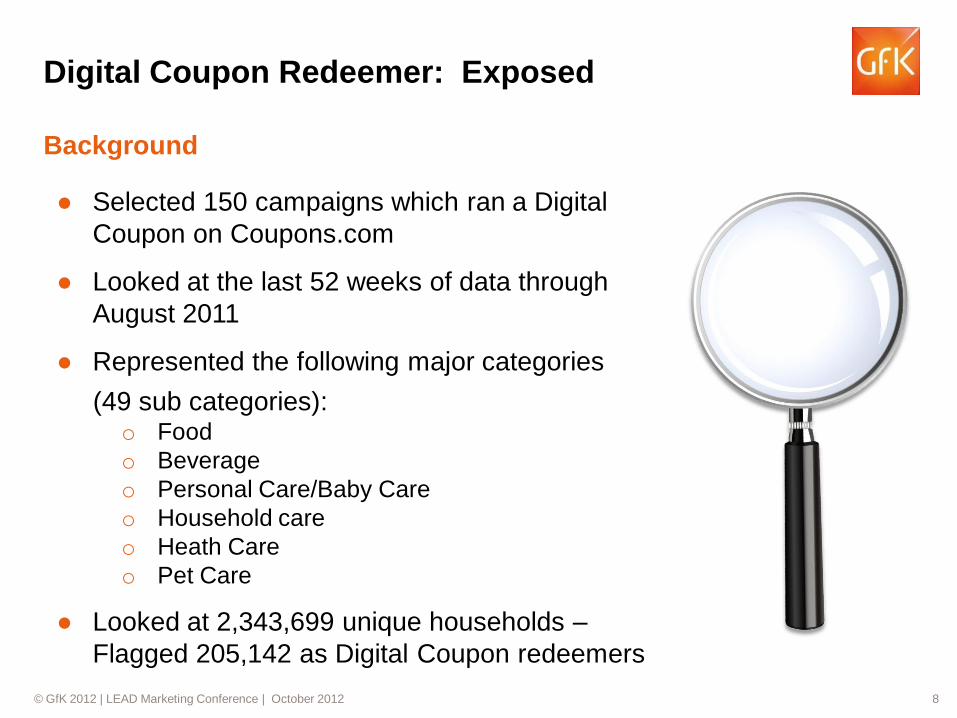
● Selected 150 campaigns which ran a Digital
Coupon on Coupons.com
● Looked at the last 52 weeks of data through
August 2011
● Represented the following major categories
(49 sub categories): o Food
o Beverage
o Personal Care/Baby Care
o Household care
o Heath Care
o Pet Care
● Looked at 2,343,699 unique households –
Flagged 205,142 as Digital Coupon redeemers
Digital Coupon Redeemer: Exposed
Background
© GfK 2012 | LEAD Marketing Conference | October 2012 9
Data Source: The National Shopper Lab
● Data is collected from retailer frequent shopper programs, demographically representative of Total U.S.
● Weekly transaction-level purchase data
o 23+ million frequent shoppers – 2.3 million
frequent shoppers (static)
o By UPC, Store
o With price and coupon redemption (by day if
required for promotion evaluations)
o The whole coupon is captured (first 5 digits are
Manufacturer Code; the next 3 are “family” and
the last 2 are “value”). Care has been taken to
ensure that the code was unique to the time
period analyzed, avoiding any “miscoding” of
redemption volume from another, similar offer.
● 3 year rolling purchase history
Digital Coupon Redeemer: Exposed
© GfK 2012 | LEAD Marketing Conference | October 2012 10
How Do Digital Coupon
Shoppers…Shop?
Well, They Buy a Helluva Lot!
© GfK 2012 | LEAD Marketing Conference | October 2012 11
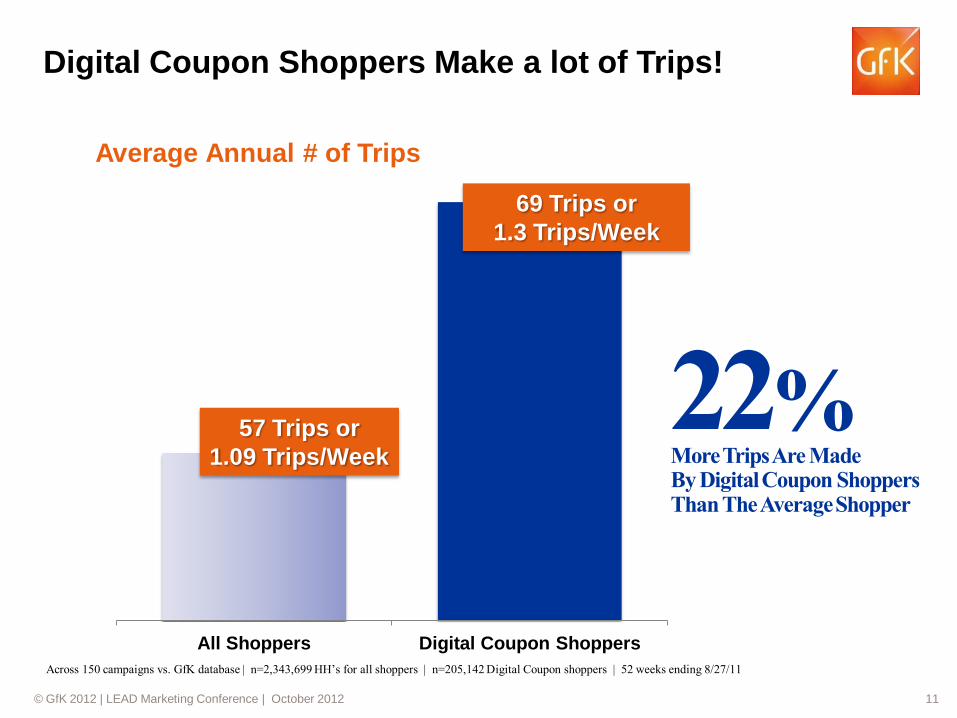
22% More Trips Are Made By Digital Coupon Shoppers Than The Average Shopper
All Shoppers Digital Coupon Shoppers
Average Annual # of Trips
57 Trips or
1.09 Trips/Week
69 Trips or
1.3 Trips/Week
Across 150 campaigns vs. GfK database | n=2,343,699 HH’s for all shoppers | n=205,142 Digital Coupon shoppers | 52 weeks ending 8/27/11
Digital Coupon Shoppers Make a lot of Trips!
© GfK 2012 | LEAD Marketing Conference | October 2012 12
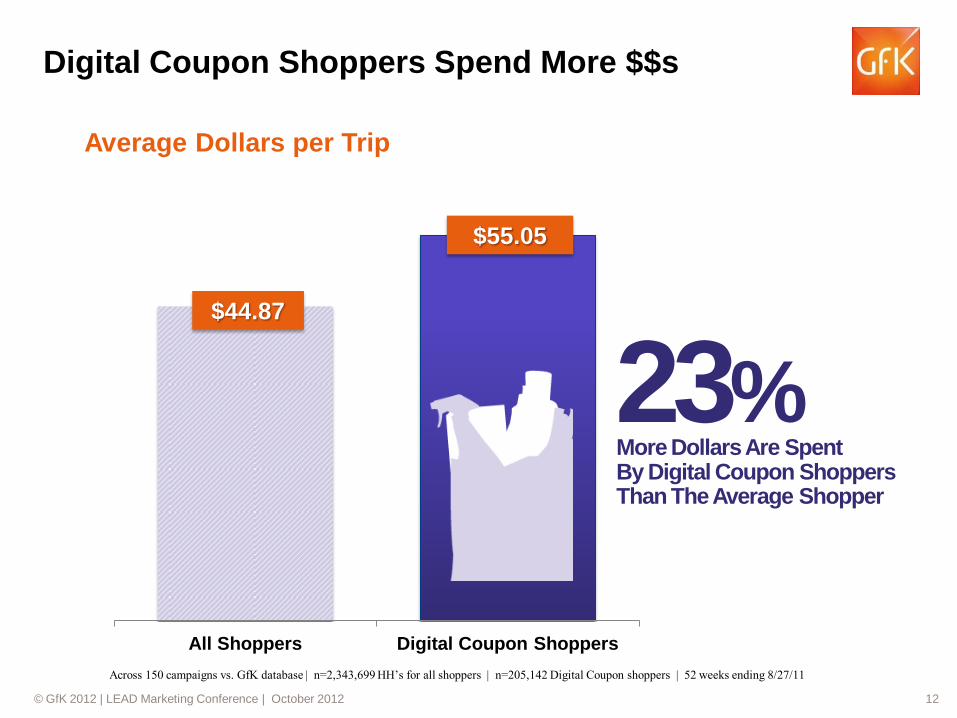
23% More Dollars Are Spent By Digital Coupon Shoppers Than The Average Shopper
All Shoppers Digital Coupon Shoppers
Average Dollars per Trip
Digital Coupon Shoppers Spend More $$s
$44.87
$55.05
Across 150 campaigns vs. GfK database | n=2,343,699 HH’s for all shoppers | n=205,142 Digital Coupon shoppers | 52 weeks ending 8/27/11
© GfK 2012 | LEAD Marketing Conference | October 2012 13
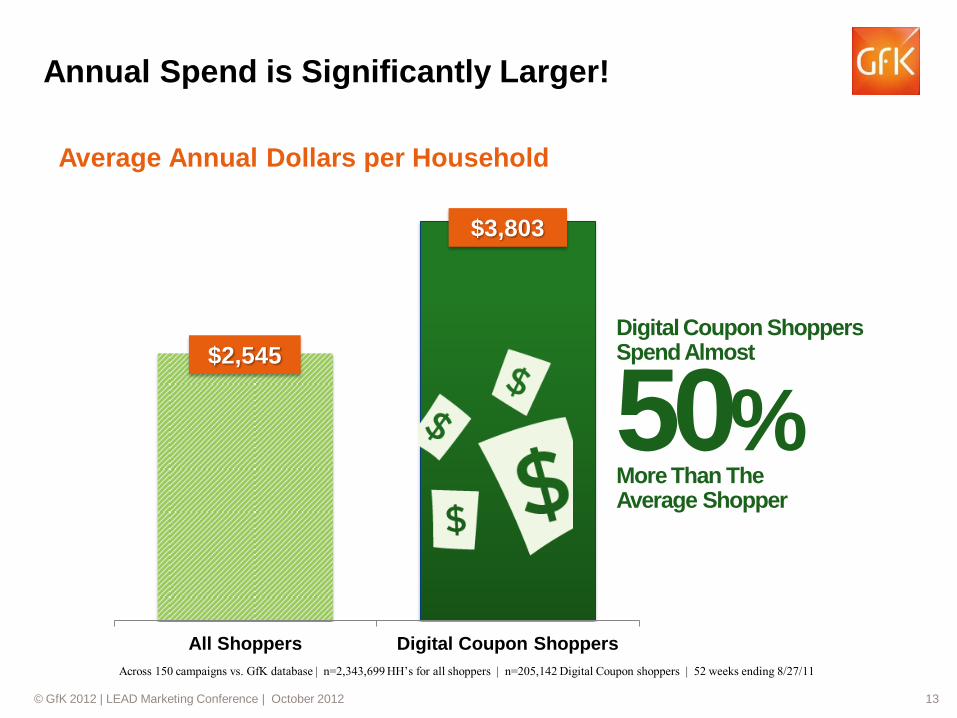
All Shoppers Digital Coupon Shoppers
Average Annual Dollars per Household
Annual Spend is Significantly Larger!
$2,545
$3,803
50% More Than The Average Shopper
Digital Coupon Shoppers Spend Almost
Across 150 campaigns vs. GfK database | n=2,343,699 HH’s for all shoppers | n=205,142 Digital Coupon shoppers | 52 weeks ending 8/27/11
© GfK 2012 | LEAD Marketing Conference | October 2012 14
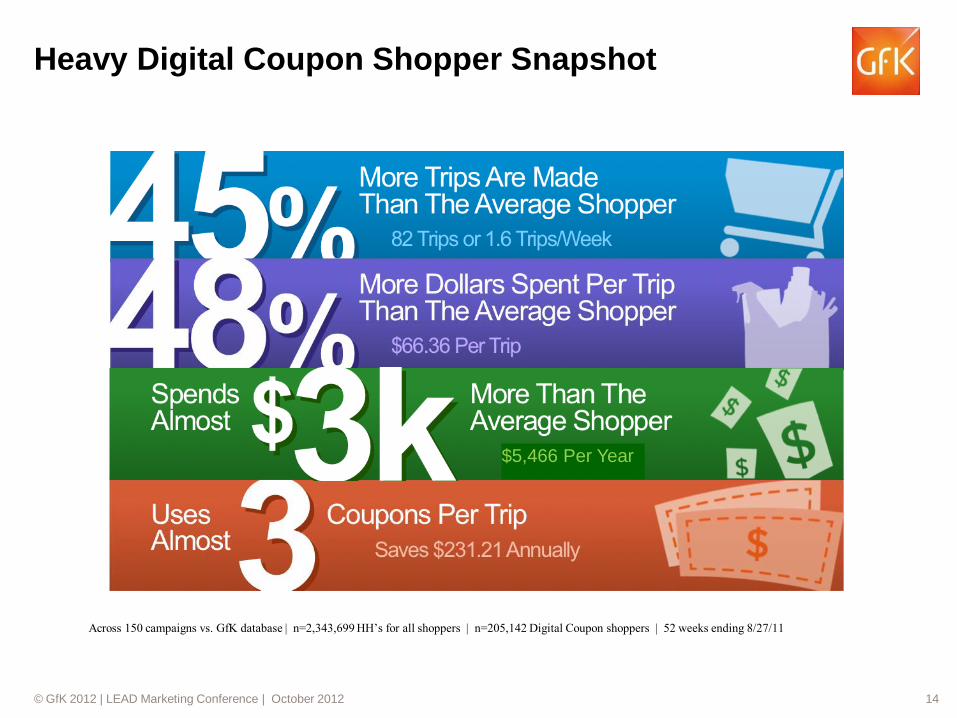
Heavy Digital Coupon Shopper Snapshot
Across 150 campaigns vs. GfK database | n=2,343,699 HH’s for all shoppers | n=205,142 Digital Coupon shoppers | 52 weeks ending 8/27/11
$5,466 Per Year
© GfK 2012 | LEAD Marketing Conference | October 2012 15
A Closer Look at Stock Up Trips
© GfK 2012 | LEAD Marketing Conference | October 2012 16
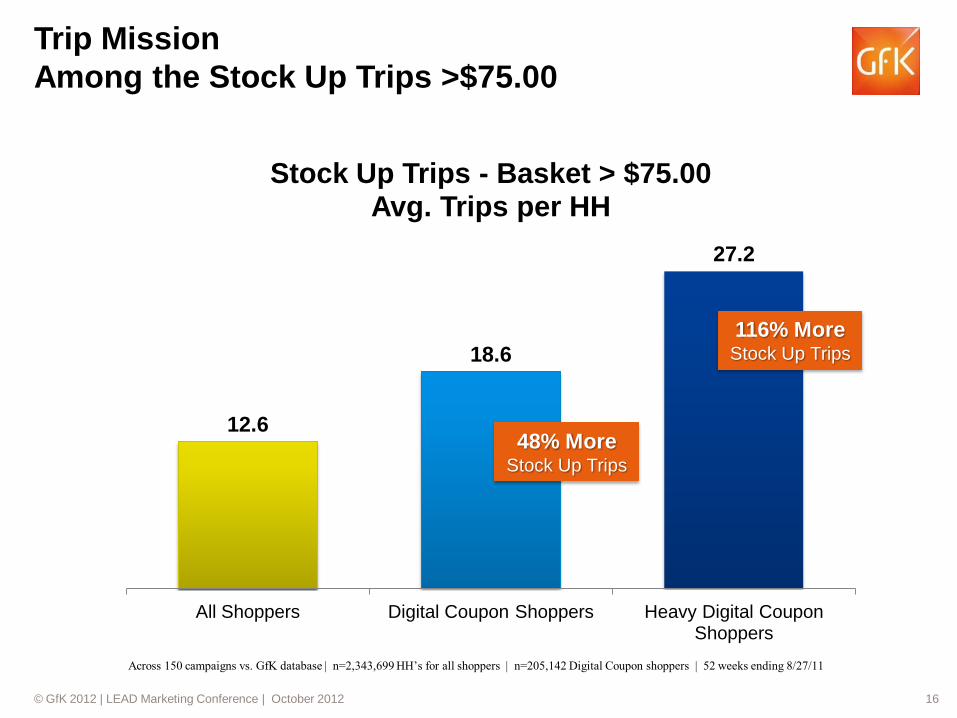
Trip Mission
Among the Stock Up Trips >$75.00
12.6
18.6
27.2
All Shoppers Digital Coupon Shoppers Heavy Digital Coupon Shoppers
Stock Up Trips - Basket > $75.00 Avg. Trips per HH
48% More Stock Up Trips
116% More Stock Up Trips
Across 150 campaigns vs. GfK database | n=2,343,699 HH’s for all shoppers | n=205,142 Digital Coupon shoppers | 52 weeks ending 8/27/11
© GfK 2012 | LEAD Marketing Conference | October 2012 17
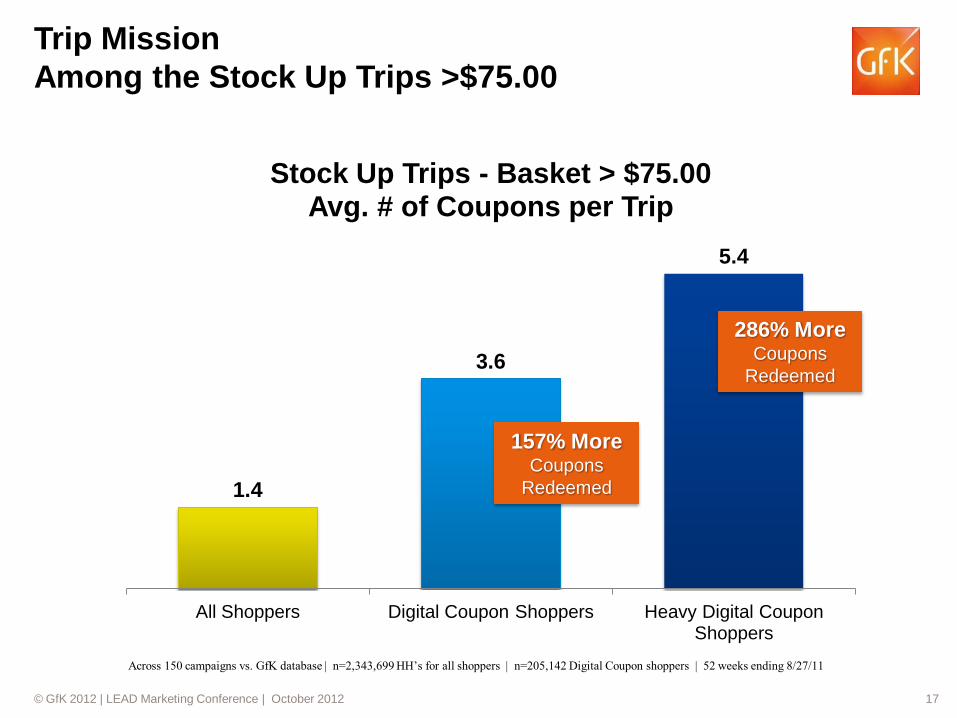
Trip Mission
Among the Stock Up Trips >$75.00
1.4
3.6
5.4
All Shoppers Digital Coupon Shoppers Heavy Digital Coupon Shoppers
Stock Up Trips - Basket > $75.00 Avg. # of Coupons per Trip
157% More Coupons
Redeemed
286% More Coupons
Redeemed
Across 150 campaigns vs. GfK database | n=2,343,699 HH’s for all shoppers | n=205,142 Digital Coupon shoppers | 52 weeks ending 8/27/11
© GfK 2012 | LEAD Marketing Conference | October 2012 18
Who are Digital Coupon Shoppers?
They are Not Poor People!
© GfK 2012 | LEAD Marketing Conference | October 2012 19
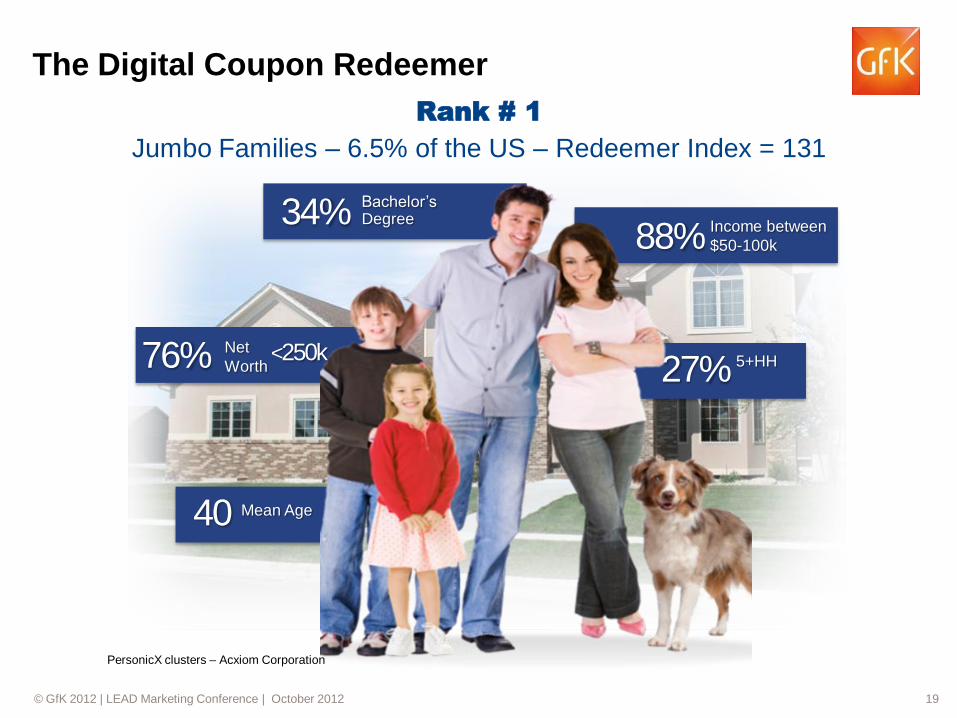
Rank # 1
Jumbo Families – 6.5% of the US – Redeemer Index = 131
The Digital Coupon Redeemer
PersonicX clusters – Acxiom Corporation
Net
Worth <250k
40 Mean Age
34% Bachelor’s Degree
88% Income between
$50-100k
27% 5+HH 76%
© GfK 2012 | LEAD Marketing Conference | October 2012 20
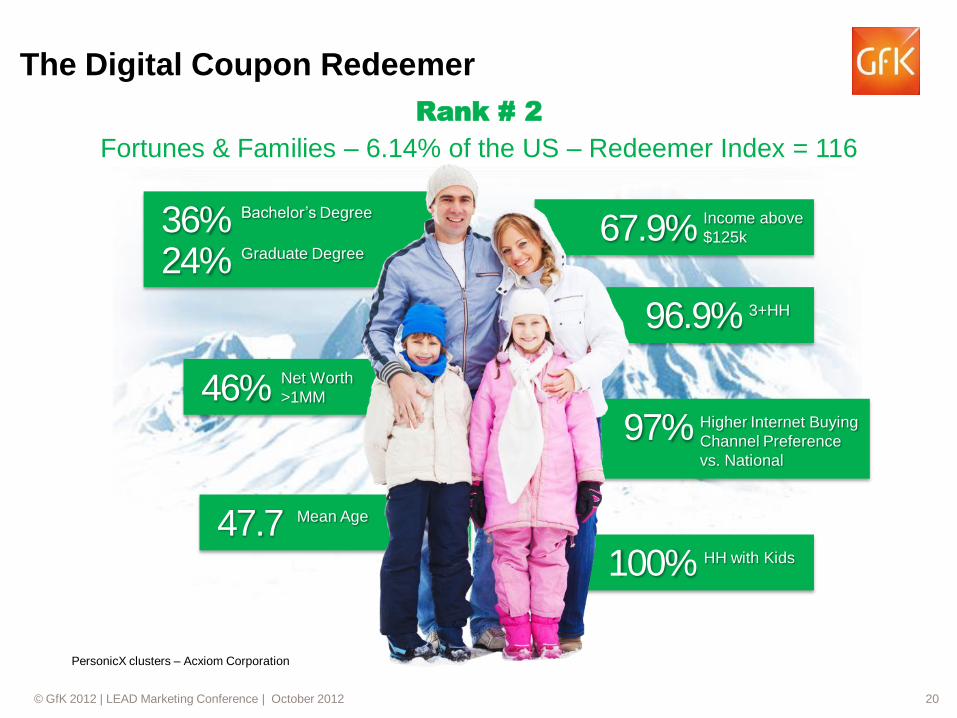
Rank # 2
Fortunes & Families – 6.14% of the US – Redeemer Index = 116
The Digital Coupon Redeemer
Net Worth
>1MM 46%
47.7 Mean Age
36% Bachelor’s Degree
24% Graduate Degree
97% Higher Internet Buying
Channel Preference
vs. National
96.9% 3+HH
100% HH with Kids
67.9% Income above
$125k
PersonicX clusters – Acxiom Corporation
© GfK 2012 | LEAD Marketing Conference | October 2012 21
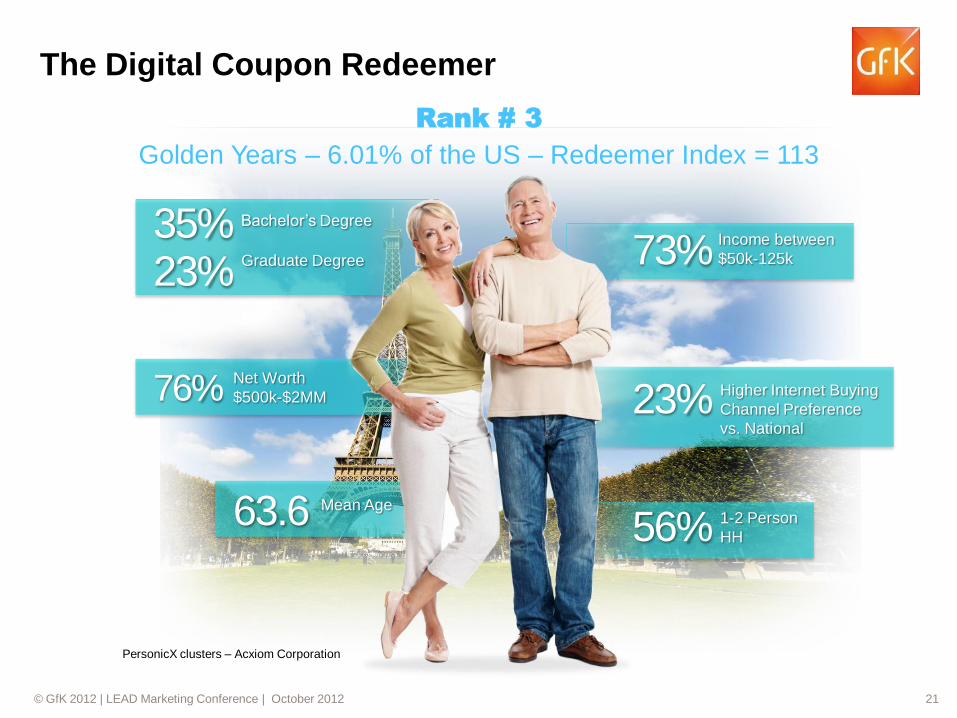
Rank # 3
Golden Years – 6.01% of the US – Redeemer Index = 113
The Digital Coupon Redeemer
Net Worth
$500k-$2MM 76%
63.6 Mean Age
35% Bachelor’s Degree
73% Income between
$50k-125k
23% Higher Internet Buying
Channel Preference
vs. National
56% 1-2 Person
HH
23% Graduate Degree
PersonicX clusters – Acxiom Corporation
© GfK 2012 | LEAD Marketing Conference | October 2012 22
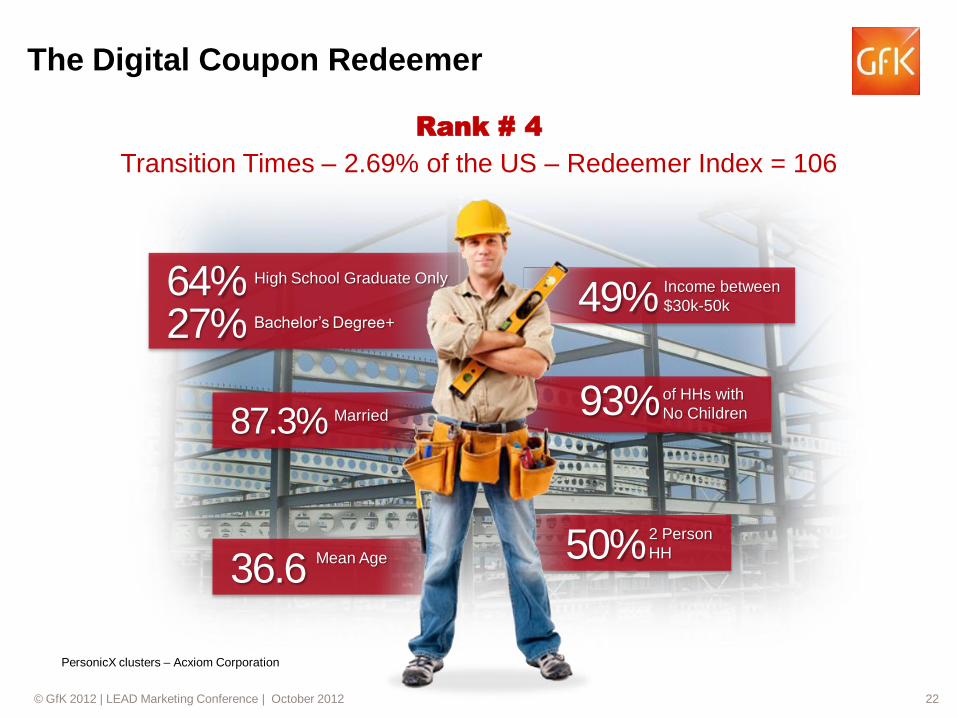
Rank # 4
Transition Times – 2.69% of the US – Redeemer Index = 106
The Digital Coupon Redeemer
Married
87.3%
36.6 Mean Age
49% Income between
$30k-50k
93% of HHs with
No Children
64% High School Graduate Only
27% Bachelor’s Degree+
50% 2 Person
HH
PersonicX clusters – Acxiom Corporation
© GfK 2012 | LEAD Marketing Conference | October 2012 23
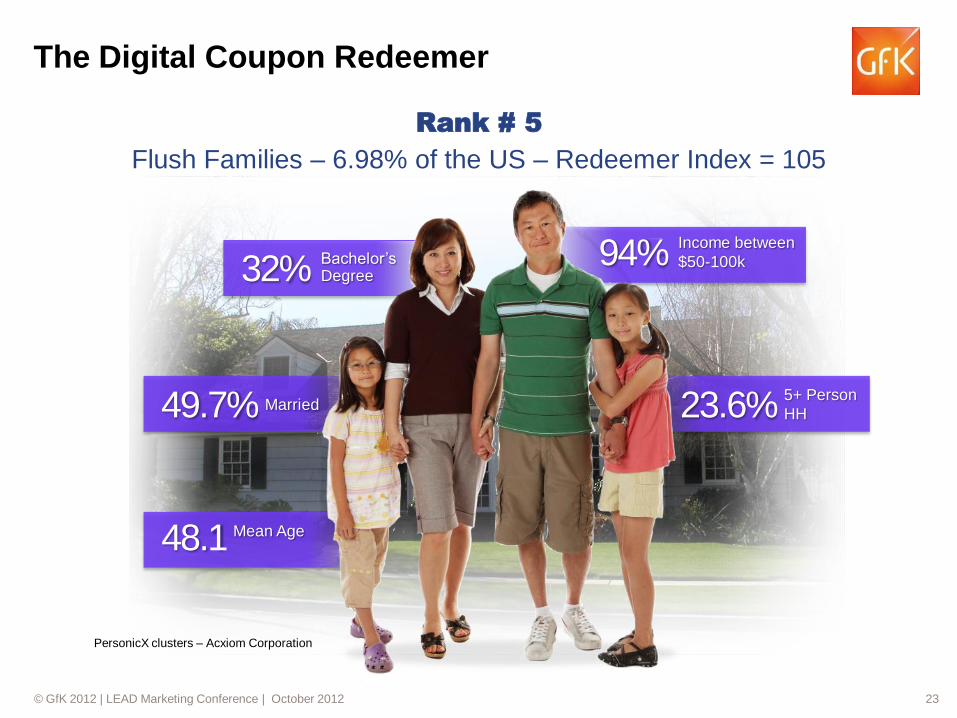
Rank # 5
Flush Families – 6.98% of the US – Redeemer Index = 105
The Digital Coupon Redeemer
Married 49.7%
48.1 Mean Age
32% Bachelor’s Degree
94% Income between
$50-100k
23.6% 5+ Person
HH
PersonicX clusters – Acxiom Corporation
© GfK 2012 | LEAD Marketing Conference | October 2012 24
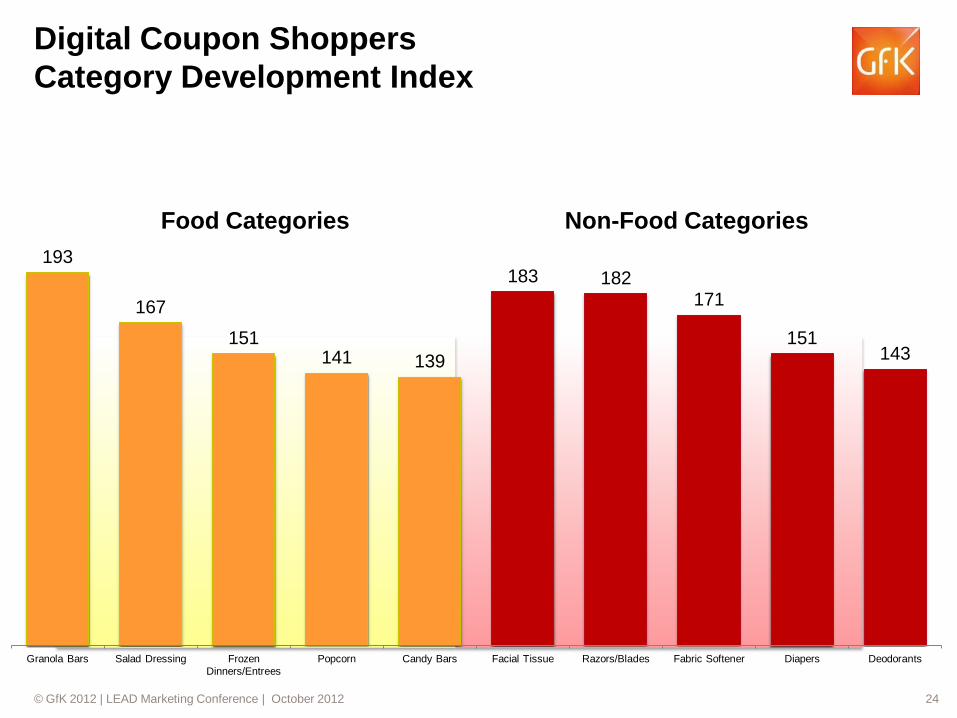
Digital Coupon Shoppers
Category Development Index
193
167
151 141 139
183 182 171
151 143
Granola Bars Salad Dressing Frozen
Dinners/Entrees
Popcorn Candy Bars Facial Tissue Razors/Blades Fabric Softener Diapers Deodorants
Food Categories Non-Food Categories

© GfK 2012 | LEAD Marketing Conference | October 2012 25
Industry Coupon
Benchmark Norms
© GfK 2012 | LEAD Marketing Conference | October 2012 26
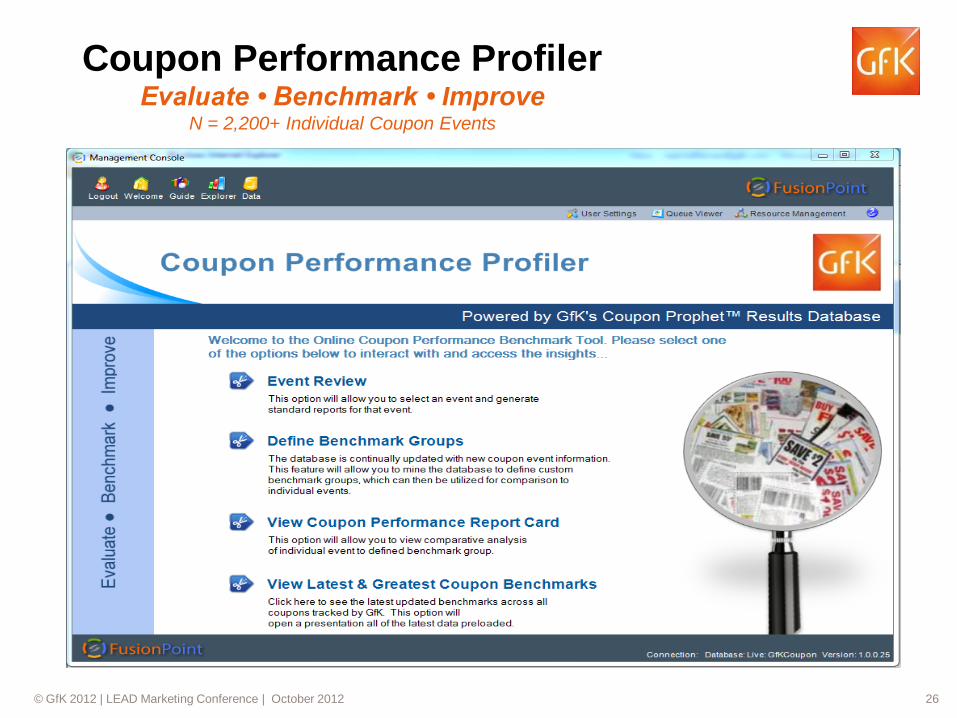
Coupon Performance Profiler Evaluate • Benchmark • Improve
N = 2,200+ Individual Coupon Events
© GfK 2012 | LEAD Marketing Conference | October 2012 27 27
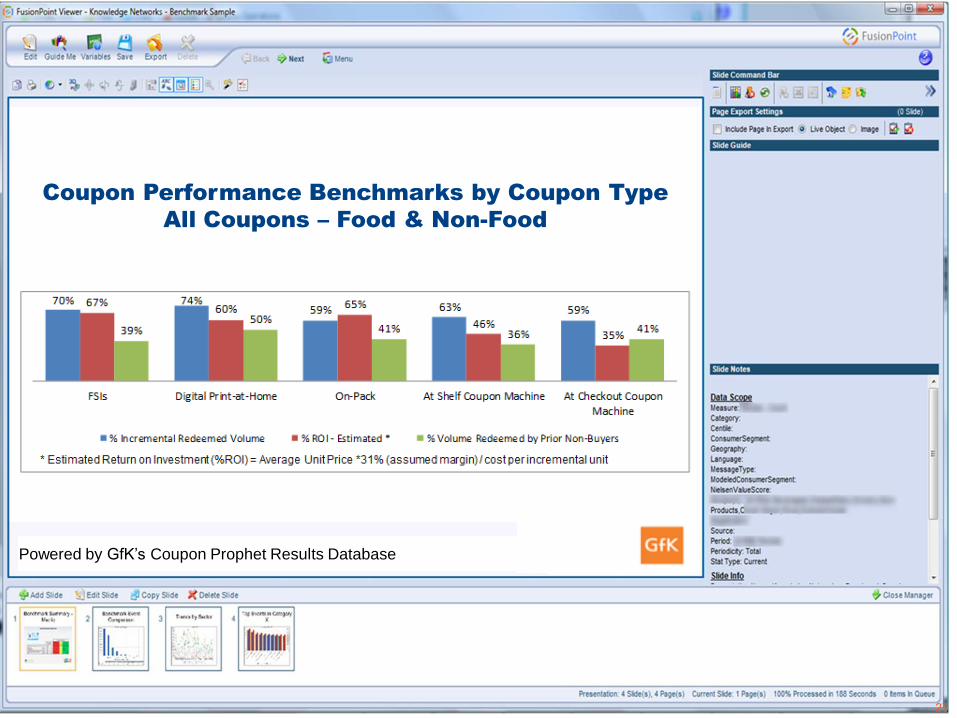
Coupon Performance Benchmarks by Coupon Type
All Coupons – Food & Non-Food
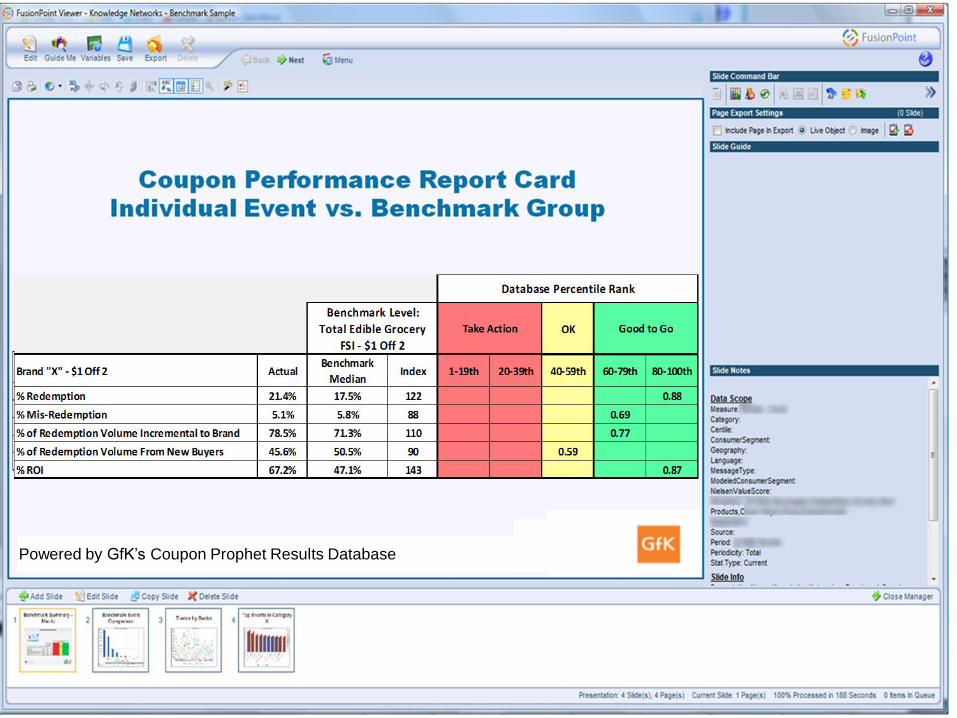
Powered by GfK’s Coupon Prophet Results Database
© GfK 2012 | LEAD Marketing Conference | October 2012 28 28
Powered by GfK’s Coupon Prophet Results Database
© GfK 2012 | LEAD Marketing Conference | October 2012 29
● Digital coupons should play a significant role in your go forward
coupon strategy.
● Digital coupons do an excellent job attracting new buyers and
driving incremental volume for brands.
● Digital coupon redeemers have a lot of buying power.
● Coupons are not just for Poor people
Key Takeaways
© GfK 2012 | LEAD Marketing Conference | October 2012 30
THANK YOU!
Neal Heffernan SVP / Behavioral Research
GfK Shopper & Retail Strategy
T 513.559.3922
www.gfk.com