digital business - s3.amazonaws.com · cis is seeing solid demand from clients looking to simplify,...
TRANSCRIPT

Helping clients embrace the new digital customer.
2014 ANNUAL REPORT
DIGITAL BUSINESS
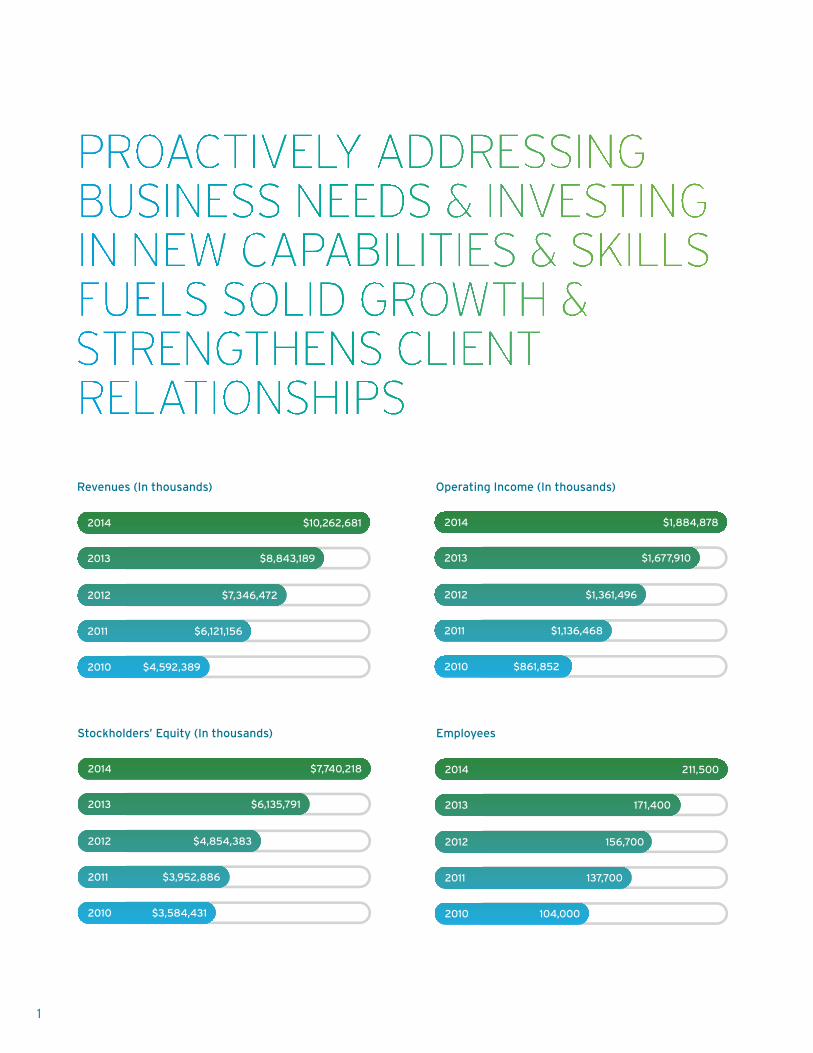
Revenues (In thousands) Operating Income (In thousands)
Stockholders’ Equity (In thousands) Employees
2014
2013
2012
2011
2010
$10,262,681
$8,843,189
$7,346,472
$6,121,156
$4,592,389
2014
2013
2012
2011
2010
$7,740,218
$6,135,791
$4,854,383
$3,952,886
$3,584,431
2014
2013
2012
2011
2010
211,500
171,400
156,700
137,700
104,000
2014
2013
2012
2011
2010
$1,884,878
$1,677,910
$1,361,496
$1,136,468
$861,852
1

2014 MARKED COGNIZANT’S 20TH YEAR OF STRONG
GROWTH, INNOVATION AND INDUSTRY LEADERSHIP.
OUR SHARP FOCUS ON HELPING CLIENTS NAVIGATE
A RAPIDLY CHANGING BUSINESS AND TECHNOLOGY
LANDSCAPE DROVE STRONG GROWTH ON THE TOP
LINE, ALONG WITH RISING NET INCOME AND SOLID
OPERATING MARGINS.
Rather than merely looking back at our past performance,
we prefer to also look forward to the enormous opportunities
that are emerging from the growing shift to digital business.
Through our investments in new solutions and services, key
acquisitions that expand our capabilities, the growth and
development of our teams, and continuous reinvestment
in our customers’ success, we are working to ensure that
Cognizant is well positioned to help clients decode the vast
opportunity – and deliver on the potential – of this new digital
business era.
2

3
Nearly every company, across every industry, is striving
hard to become more digital. Getting there requires
an accomplished partner with a proven track record of
delivering tangible digital business results. Moreover,
it requires a pragmatic approach to building and
expanding digital backbones powered by social, mobile,
analytics and cloud technologies (the SMAC Stack),
as well as sensors and intelligent process automation
tools. We are helping clients create new business models
and build the foundational infrastructure necessary to
power digital success.
While digital is pivotal, today’s business models are
based on value chains that integrate both physical and
virtual elements. In fact, some companies are already
proving that the value of the “virtual” — information
and digital interactions — can far outstrip traditional
physical value propositions. This is possible because
new technologies and nearly-pervasive connectivity
have created an almost endless supply of valuable
information and opportunities to connect businesses,
products, people, organizations, machines, and devices.
We are architecting new value chains, operating models
and human-centric experiences that simplify digital
interactions and transactions across existing and
emerging ecosystems, helping our clients achieve new
levels of business performance.
Capturing the digital high ground requires organizations
to see every aspect of the business through the customer’s
eyes. It also requires an intimate understanding of how
nearly every physical-world device can be instrumented
in ways that generate massive volumes of potentially
meaningful business data — revealing user behaviors,
interests and desires. To lead in today’s new digital
era, businesses must extract value from ambient and
behavioral data to design better products, improve user
experiences, and inform strategic decision making. Making
and applying meaning from digital data by employing
advanced analytics informs business strategy and helps
As business becomes more IT-intensive, organizations
must become increasingly agile, and continuously
innovate to keep pace with the dynamics of today’s digital
era. Cognizant is well positioned to help enterprises
exceed customer expectations for new digital services
and experiences that drive market differentiation and
performance. We work with our clients every day to help
same time reimagining their businesses and building new
capabilities to get the most from today’s blended digital
and physical worlds.
4
For several years we have helped clients implement new
digital solutions. Powered by SMAC Stack technologies,
we provide a comprehensive approach informed by new
knowledge, to enable organizations to answer today’s
unknowns and address tomorrow’s challenges to reach
their digital potential. We collaborate closely with clients —
sharing new thinking, methodologies, and deep domain
expertise to help them take advantage of new business
opportunities as they emerge.
This experience helped us create a comprehensive,
integrated approach to enable clients to quickly and
effectively infuse digital into their businesses. We
are working with business and technology leaders
across industries to strategically rethink business and
operating models, and with CIOs and CTOs to create the
foundational technologies to securely digitize business
processes and drive outperformance in this new digital
age. We understand that clients need to accelerate
these initiatives, but may lack the internal structure and
wherewithal to quickly create value.
Our Cognizant Digital Works™ practice brings together
multi-disciplinary industry teams consisting of consultants,
digital technologists, designers, business process experts,
and data scientists to create cohesive roadmaps and ideas
to help clients quickly and effectively embed digital into
the core of their businesses. (See page 15.)
At our Cognizant Digital Works Collaboratory, clients work
alongside our teams to visualize, prototype and plan new
initiatives that will accelerate the digitization of business
by creating, distilling and applying meaning from Code
Halos – the digital information that surrounds people,
processes, organizations and devices. (See page 16.)
As business success becomes more IT-dependent,
we are developing ways organizations can create
differentiating value with the next generations of game-
changing technologies, including ultra-low cost sensors,
embedded software, 3D printing, instrumentation, and
advanced security. (Turn to page 14 to see how Cognizant
Technology Labs is developing advanced technologies and
helping our clients achieve their IT objectives.)
5
We made several acquisitions last year to expand our capabilities and enhance
our portfolio of digital solutions. The acquisition of TriZetto, completed in
November 2014, allows us to provide a new vertically-integrated service
model for the healthcare sector, and create new revenue opportunities amid
the industry’s rapid digitization. TriZetto is a leading provider of healthcare
IT software and solutions that complement and extend Cognizant’s existing
offerings. Joining forces with TriZetto enables us to meet the needs of an
industry undergoing profound change due to reform, cost pressure and shifting
responsibilities between payers and providers. TriZetto works with some
245,000 providers and about 350 payers, and touches 180 million covered lives
in the U.S. Together, we create an integrated portfolio of capabilities that will
re-imagining care for the future.
We acquired Cadient Group, a full-service digital marketing agency serving
companies in the pharmaceutical, biotechnology, consumer health, and medical
device industries. In addition, the acquisition of itaas, a U.S.-based digital video
solutions company, allows us to offer a broader range of digital video services
for clients in the cable, telecommunications and high-technology industries.
We also purchased Odecee, a provider of digital solutions to businesses in
the Australia-New Zealand region with expertise in delivering leading-edge
insurance, healthcare, logistics and communications sectors.
BUILDING DIGITAL SKILLS, SCOPE & SCALE
6
Looking at our 2014 results, revenue rose to $10.26
billion, up 16% from 2013. GAAP net income increased
17% to $1.44 billion, or $2.35 per diluted share. Diluted
EPS on a non-GAAP basis, excluding stock-based
compensation costs, acquisition-related charges and
net non-operating foreign currency exchange gains and
losses, was $2.60. GAAP operating margin was 18.4%,
while non-GAAP operating margin, excluding stock-based
compensation costs and acquisition-related charges, was
20.2%, slightly above our targeted 19% to 20% range.*
We ended 2014 with $3.77 billion in cash and short-term
investments, supporting our capacity to grow along with
our clients’ emerging needs.
We have continued to grow across vertical sectors,
regions and lines of service — with a particularly strong
with the potential to generate $5 million to $50 million or
more in annual revenue. We had 271 strategic accounts
at the end of 2014, an increase of 28 over 2013. With our
strong client relationships, deep knowledge of industry-
architectures, global delivery capability and large-scale,
multi-service integration, we are well positioned to win
and execute on such major engagements.
Our Financial Services segment grew 15.3% year-over-
year, powered in part by continued strength in our
insurance practice, where demand is accelerating for
end-to-end managed services. In banking, underlying
business drivers continued to pivot around cost
optimization, regulatory compliance, real-time risk
monitoring, and fraud and trade surveillance.
Our Healthcare segment, which consists primarily of
our payer, pharmaceutical and medical-device clients
and now our TriZetto business, grew 18.7% year-over-
year (15.2% excluding TriZetto). The Life Sciences
segment began stabilizing after two challenging years.
Improved performance was driven by strategic supplier
consolidation and cost optimization across many existing
and new clients. The business also saw increased demand
for end-to-end service offerings across applications
and infrastructure, leveraging cloud technologies and
platforms.
Revenues in our Retail, Manufacturing and Logistics
segment were up 12.1% from 2013. We are seeing more
demand, particularly in areas such as modernizing supply
chains, and digital and e-commerce engagements. Our
Other segment, which includes high-tech, communications,
as well as information, media and entertainment clients,
was up 20.3% year-over-year, in part driven by new
engagements with our existing clients.
Growth was strong across all geographic regions. North
America revenues rose 14.9%, including TriZetto. Europe
was up 19.3% overall, with especially strong growth
in Continental Europe, driven by a shift toward larger,
multi-year global sourcing engagements. We continued
to expand in other key regional markets, including India,
Singapore, Australia, Japan and Hong Kong, with
revenues increasing 23.6% over the prior year.
* Non-GAAP diluted EPS (earnings per share)See “Non-GAAP Financial Measures” beginning on page 53 of the Company’s Annual Report on Form 10-K included in this Annual Report for more information and a
7

We continue to pursue a “three-horizon” strategy to grow
our businesses: optimizing Horizon 1 core IT services;
building momentum and scale in Horizon 2 offerings —
Cognizant Business Consulting (CBC), Cognizant Business
Process Services (BPS) and Cognizant Infrastructure
Services (CIS); and incubating new technology architectures
such as SMAC, as well as new delivery models and markets,
in Horizon 3.
All of our Horizon 2 offerings achieved greater critical mass
to grow faster than the company overall, offering end-to-
end solutions characterized by deep industry knowledge,
technology expertise and process acumen. CIS is seeing
solid demand from clients looking to simplify, automate and
make their infrastructure more predictable by incorporating
highly advanced managed services.
(See page 13.)
8
Achieving end-to-end service productivity by bringing multiple capabilities together
is another area in which we are excelling. This integrated approach — what we call a
multi-tower or platform solution – responds to client needs for synergistic application,
business process, consulting and infrastructure services, informed by deep domain
expertise. Increasingly, we are bringing together the problem-solving skills and
solutions across our company to deliver higher levels of business value to clients.
A prime example of the value of a multi-tower engagement is our agreement with
Health Net, a managed care company, which engaged Cognizant to provide an
integrated array of offerings, including consulting, technology and administrative
services to serve a wide range of vital functional areas.
(See page 18.)
PACKAGING MULTI-SERVICE INTEGRATION & INDUSTRY SOLUTIONS
9

We have continued to invest in building an at-scale
delivery network. Today, our global delivery ecosystem
spans more than 75 delivery and operations centers
globally and supports customer operations in 48
countries, allowing us to access a world of talent and
expertise. In the U.S. during 2014, we added a delivery
and operations center in Charlotte, NC and expanded
our presence in Tampa, FL. We also expanded delivery
center operations in San Jose, Costa Rica; Amsterdam,
the Netherlands; Hamburg, Germany; Budapest, Hungary;
and Stockholm, Sweden. Through acquisition, we added
delivery centers in Denver, CO in the United States;
London, Ontario, Canada; and Pune and Noida, India.
Growing our talent and skill sets is an important way
we are positioning Cognizant to meet clients’ digital
business needs. We focus on recruiting and hiring the
best talent from across the IT industry, key vertical
markets and leading universities around the world, and
are proud to have crossed the 200,000 employee mark
in 2014. We have expanded our recruitment into areas
and human factors engineering to address digital-
driven opportunities. And we have a major commitment
to training and development, earning the #1 rank in
the Association for Talent Development BEST Awards
program for the second year running.
We continue to broaden and deepen our diversity
programs, which enhance opportunities for women,
instituted a program that creates a positive workplace for
military veterans, and facilitates an easier transition back
into civilian life with careers that utilize their advanced
leadership skills and strong work ethic. Following the 2013
launch of the U.S. “Veterans in Technology” program,
we hired over 300 veterans. In 2014, we moved up the
Solutions Group. This initiative will continue in 2015 with
Business Consulting and Insurance business units.
10
Just as we help leading global businesses improve and innovate to seize
new opportunities, we are using our capabilities to drive improvements and
innovations in the world around us. That means devoting our talent, expertise
and passion to making a difference in areas such as education, human potential
and the environment.
At the 2014 White House Maker Faire, we committed to tripling our Making the
Future initiative to support STEM activities in the U.S., aiming to provide 1.5
million hours of “making” programs for 25,000 children in 200 communities
by 2017. Our Outreach volunteer effort supports learning initiatives in India and
other countries, with over 25,000 associates dedicating over 300,000 hours
to mentoring, career counseling and talent development. A key focus is our 1004
effort, which aims to help 100 schools in India achieve a 100% pass rate, 100%
graduation rate and 100% employability for graduates. Last year, Cognizant
Foundation helped set up smart classrooms and computer and science
laboratories that cater to underprivileged students in rural areas.
We remain responsible stewards of the environment. Since 2013, we have
powered several major facilities in India with renewable energy; over 10% of our
global energy consumption now comes from wind and biomass. Our Go Green
energy program has reduced per capita carbon emissions 43% versus the
2008 baseline. Employee volunteers, known as Green Brigadiers, participated
in over 100 environmental projects — planting trees, cleaning up waterways, and
MAKING A DIFFERENCE
11

These are exciting times for our industry. The pace of change and innovation is
breathtaking. Over the next decade, organizations around the world will race to
deploy new technologies, decode digital opportunities and recode business success.
We are proud that Cognizant’s commitment to excellence in both client service
The company is ranked #308 among the “Fortune 500” (up 44 places from 2013),
and has appeared on Fortune’s “World’s Most Admired” list for seven consecutive
years. We also have been cited by independent authorities for leadership in such
areas as business intelligence (Forrester Research) and business analytics for
business process services (IDC MarketScape).
With our ability to bring together a range of integrated solutions, deep domain
expertise, a global delivery ecosystem, best-in-class talent, and a culture for
challenging the status quo, Cognizant occupies a uniquely valuable position in
strengths will lead to new opportunities to partner with clients, while providing solid
performance for stockholders, a rewarding environment for our team members, and
fruitful engagement in our communities.
Sincerely,
Francisco D’Souza
12
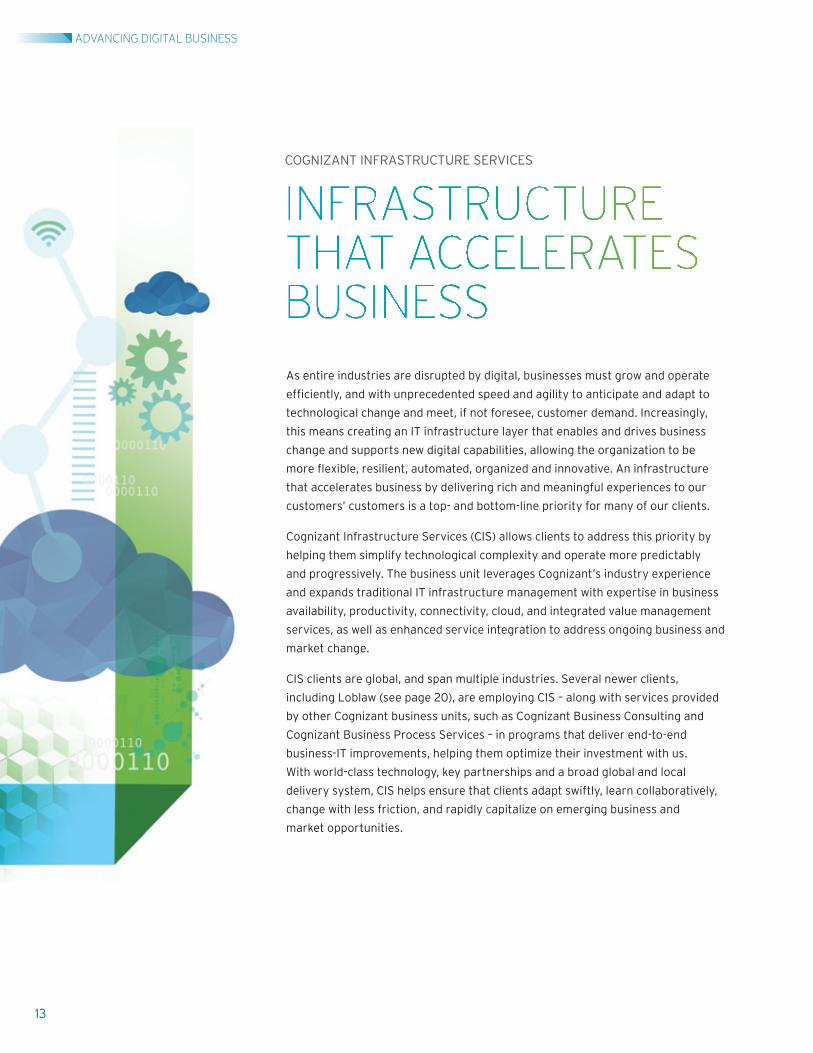
As entire industries are disrupted by digital, businesses must grow and operate
technological change and meet, if not foresee, customer demand. Increasingly,
this means creating an IT infrastructure layer that enables and drives business
change and supports new digital capabilities, allowing the organization to be
that accelerates business by delivering rich and meaningful experiences to our
customers’ customers is a top- and bottom-line priority for many of our clients.
Cognizant Infrastructure Services (CIS) allows clients to address this priority by
helping them simplify technological complexity and operate more predictably
and progressively. The business unit leverages Cognizant’s industry experience
and expands traditional IT infrastructure management with expertise in business
availability, productivity, connectivity, cloud, and integrated value management
services, as well as enhanced service integration to address ongoing business and
market change.
CIS clients are global, and span multiple industries. Several newer clients,
including Loblaw (see page 20), are employing CIS – along with services provided
by other Cognizant business units, such as Cognizant Business Consulting and
Cognizant Business Process Services – in programs that deliver end-to-end
business-IT improvements, helping them optimize their investment with us.
With world-class technology, key partnerships and a broad global and local
delivery system, CIS helps ensure that clients adapt swiftly, learn collaboratively,
change with less friction, and rapidly capitalize on emerging business and
market opportunities.
COGNIZANT INFRASTRUCTURE SERVICES
ADVANCING DIGITAL BUSINESS
13
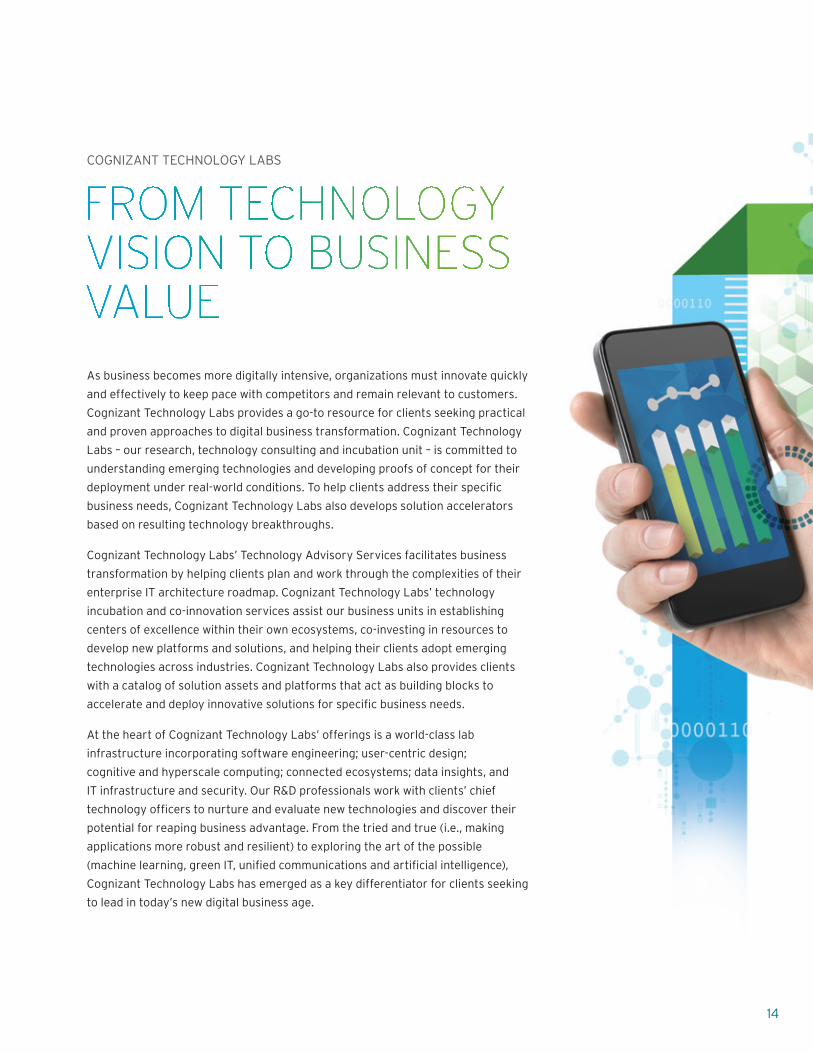
As business becomes more digitally intensive, organizations must innovate quickly
and effectively to keep pace with competitors and remain relevant to customers.
Cognizant Technology Labs provides a go-to resource for clients seeking practical
and proven approaches to digital business transformation. Cognizant Technology
Labs – our research, technology consulting and incubation unit – is committed to
understanding emerging technologies and developing proofs of concept for their
business needs, Cognizant Technology Labs also develops solution accelerators
based on resulting technology breakthroughs.
Cognizant Technology Labs’ Technology Advisory Services facilitates business
transformation by helping clients plan and work through the complexities of their
enterprise IT architecture roadmap. Cognizant Technology Labs’ technology
incubation and co-innovation services assist our business units in establishing
centers of excellence within their own ecosystems, co-investing in resources to
develop new platforms and solutions, and helping their clients adopt emerging
technologies across industries. Cognizant Technology Labs also provides clients
with a catalog of solution assets and platforms that act as building blocks to
At the heart of Cognizant Technology Labs’ offerings is a world-class lab
infrastructure incorporating software engineering; user-centric design;
cognitive and hyperscale computing; connected ecosystems; data insights, and
IT infrastructure and security. Our R&D professionals work with clients’ chief
potential for reaping business advantage. From the tried and true (i.e., making
applications more robust and resilient) to exploring the art of the possible
Cognizant Technology Labs has emerged as a key differentiator for clients seeking
to lead in today’s new digital business age.
COGNIZANT TECHNOLOGY LABS
14
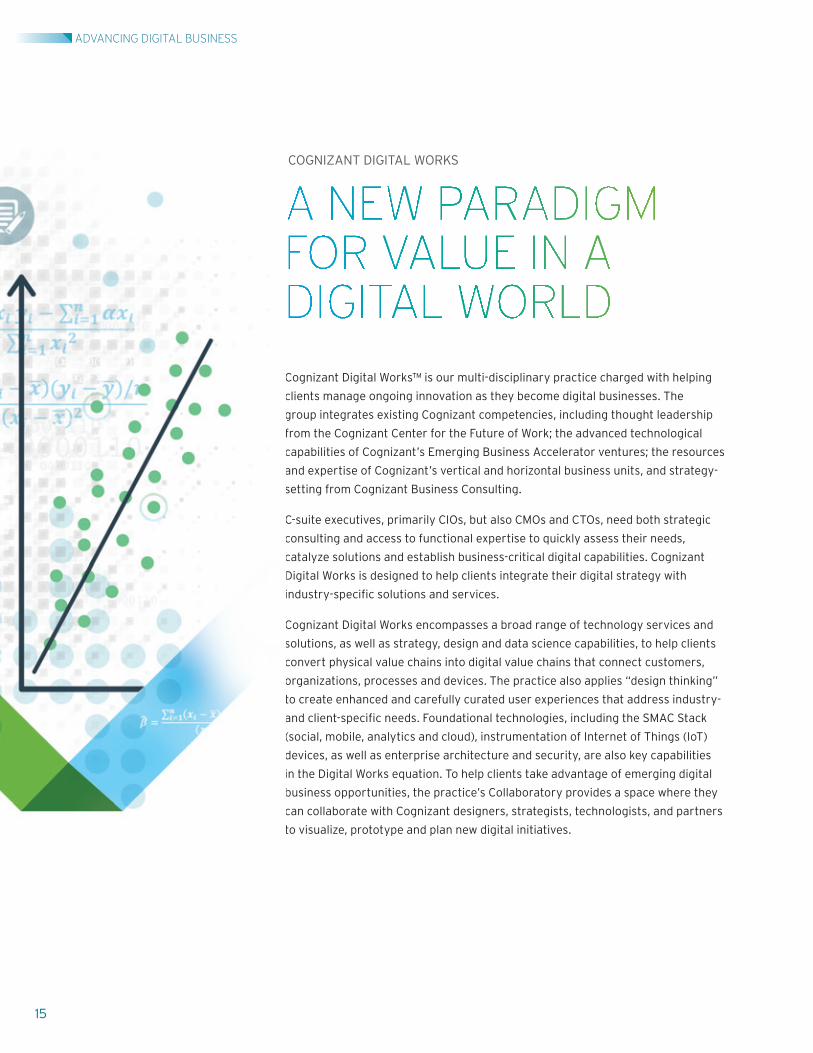
Cognizant Digital Works™ is our multi-disciplinary practice charged with helping
clients manage ongoing innovation as they become digital businesses. The
group integrates existing Cognizant competencies, including thought leadership
from the Cognizant Center for the Future of Work; the advanced technological
capabilities of Cognizant’s Emerging Business Accelerator ventures; the resources
and expertise of Cognizant’s vertical and horizontal business units, and strategy-
setting from Cognizant Business Consulting.
C-suite executives, primarily CIOs, but also CMOs and CTOs, need both strategic
consulting and access to functional expertise to quickly assess their needs,
catalyze solutions and establish business-critical digital capabilities. Cognizant
Digital Works is designed to help clients integrate their digital strategy with
Cognizant Digital Works encompasses a broad range of technology services and
solutions, as well as strategy, design and data science capabilities, to help clients
convert physical value chains into digital value chains that connect customers,
organizations, processes and devices. The practice also applies “design thinking”
to create enhanced and carefully curated user experiences that address industry-
(social, mobile, analytics and cloud), instrumentation of Internet of Things (IoT)
devices, as well as enterprise architecture and security, are also key capabilities
in the Digital Works equation. To help clients take advantage of emerging digital
business opportunities, the practice’s Collaboratory provides a space where they
can collaborate with Cognizant designers, strategists, technologists, and partners
to visualize, prototype and plan new digital initiatives.
COGNIZANT DIGITAL WORKS
C
c
g
f
c
a
s
C
c
c
C
s
c
o
t
(
d
i
c
t
ADVANCING DIGITAL BUSINESS
15
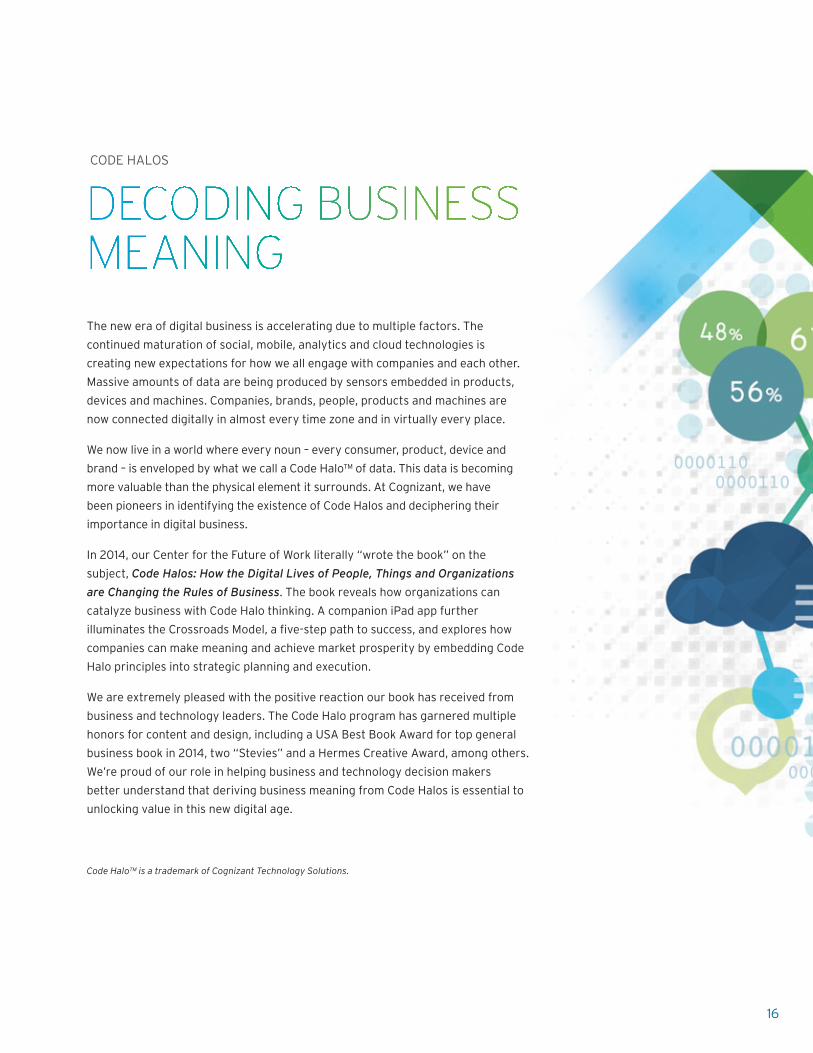
The new era of digital business is accelerating due to multiple factors. The
continued maturation of social, mobile, analytics and cloud technologies is
creating new expectations for how we all engage with companies and each other.
Massive amounts of data are being produced by sensors embedded in products,
devices and machines. Companies, brands, people, products and machines are
now connected digitally in almost every time zone and in virtually every place.
We now live in a world where every noun – every consumer, product, device and
brand – is enveloped by what we call a Code Halo™ of data. This data is becoming
more valuable than the physical element it surrounds. At Cognizant, we have
been pioneers in identifying the existence of Code Halos and deciphering their
importance in digital business.
In 2014, our Center for the Future of Work literally “wrote the book” on the
subject, Code Halos: How the Digital Lives of People, Things and Organizations
are Changing the Rules of Business. The book reveals how organizations can
catalyze business with Code Halo thinking. A companion iPad app further
companies can make meaning and achieve market prosperity by embedding Code
Halo principles into strategic planning and execution.
We are extremely pleased with the positive reaction our book has received from
business and technology leaders. The Code Halo program has garnered multiple
honors for content and design, including a USA Best Book Award for top general
business book in 2014, two “Stevies” and a Hermes Creative Award, among others.
We’re proud of our role in helping business and technology decision makers
better understand that deriving business meaning from Code Halos is essential to
unlocking value in this new digital age.
Code Halo™ is a trademark of Cognizant Technology Solutions.
CODE HALOS
16

17

increasingly need a partner that can bring together diverse capabilities to create
at creating and executing these “multi-tower” engagements, which may combine
the efforts of Cognizant Business Consulting, Cognizant Business Process
Services, Cognizant Infrastructure Services and other business units.
Such a multi-tower engagement was entered into in late 2014 with Health Net,
million individuals across the U.S. Under the agreement, Health Net, a long-
time client, will work with Cognizant to strengthen its technology platform,
enhance the delivery of a high level of service to members and providers, enable
of capital. The deal, which is subject to regulatory approval and initially valued at
approximately $2.8 billion over seven years, is the largest signed in our history.
The holistic solution is expected to provide Health Net with services in areas
customer contact center, information technology, quality assurance, appeals
and grievance support services, and non-clinical medical management functions.
costs and add new business capabilities that support future growth. For example,
Cognizant is tasked with meeting targets for maintaining or improving the
including claims processing and routing times, customer service response times,
and contact center satisfaction.
Under the agreement, Cognizant must meet all regulatory compliance
requirements, which will be overseen by Health Net’s dedicated governance
and oversight committee.
HEALTH NET
AA MMMUULLTTTII-TTTOOWWWWEERRR ENGGGAAGGGEEMMMEENNNT WWWWITTHH HOOLLISSTTTICC BBEEENNEFFITTSSS
g
costs
Cogni
includ
and co
Under
requir
and ov
18
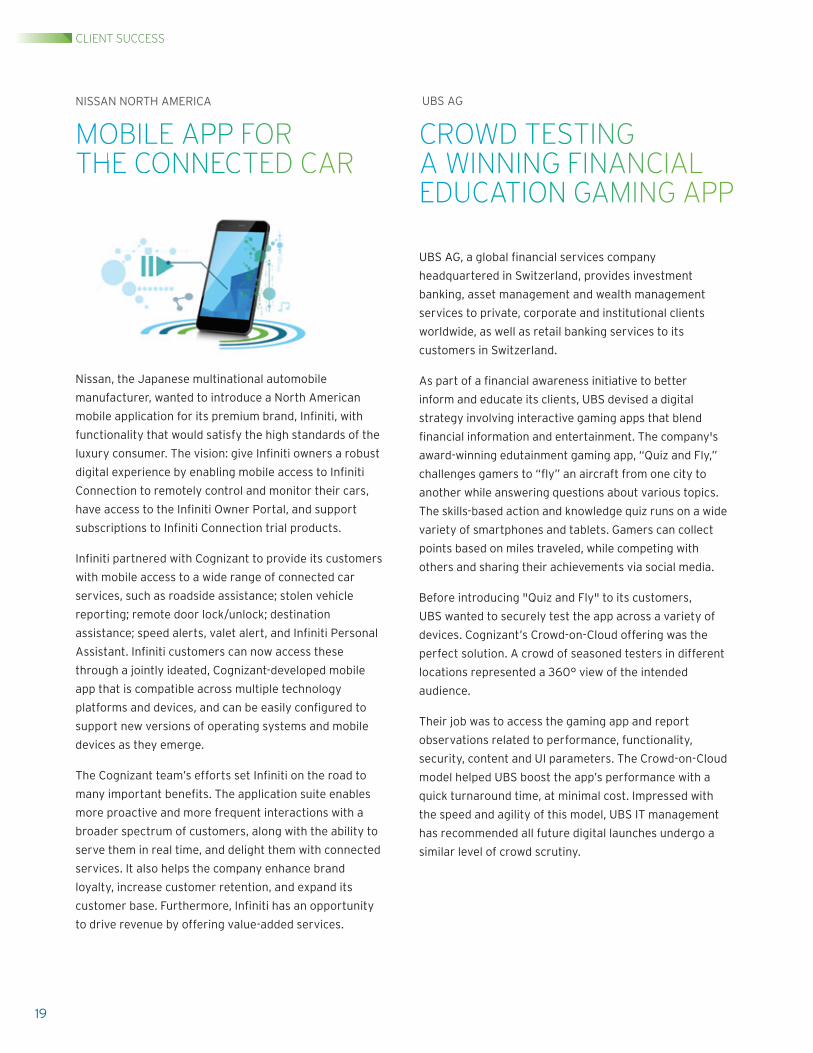
Nissan, the Japanese multinational automobile
manufacturer, wanted to introduce a North American
functionality that would satisfy the high standards of the
Connection to remotely control and monitor their cars,
with mobile access to a wide range of connected car
services, such as roadside assistance; stolen vehicle
reporting; remote door lock/unlock; destination
through a jointly ideated, Cognizant-developed mobile
app that is compatible across multiple technology
support new versions of operating systems and mobile
devices as they emerge.
more proactive and more frequent interactions with a
broader spectrum of customers, along with the ability to
serve them in real time, and delight them with connected
services. It also helps the company enhance brand
loyalty, increase customer retention, and expand its
to drive revenue by offering value-added services.
headquartered in Switzerland, provides investment
banking, asset management and wealth management
services to private, corporate and institutional clients
worldwide, as well as retail banking services to its
customers in Switzerland.
inform and educate its clients, UBS devised a digital
strategy involving interactive gaming apps that blend
award-winning edutainment gaming app, “Quiz and Fly,”
another while answering questions about various topics.
The skills-based action and knowledge quiz runs on a wide
variety of smartphones and tablets. Gamers can collect
points based on miles traveled, while competing with
others and sharing their achievements via social media.
Before introducing "Quiz and Fly" to its customers,
UBS wanted to securely test the app across a variety of
devices. Cognizant’s Crowd-on-Cloud offering was the
perfect solution. A crowd of seasoned testers in different
locations represented a 360° view of the intended
audience.
Their job was to access the gaming app and report
observations related to performance, functionality,
security, content and UI parameters. The Crowd-on-Cloud
model helped UBS boost the app’s performance with a
quick turnaround time, at minimal cost. Impressed with
the speed and agility of this model, UBS IT management
has recommended all future digital launches undergo a
similar level of crowd scrutiny.
NISSAN NORTH AMERICA
MMOOOBBILLEEE AAPPPP FFOOOORR TTTHHEE CCCOOONNNNNNEECCCTTEEEDD CCAAAR
UBS AG
CCRROOWWWWDD TTEEESSTTTINNGG AAA WWWWINNNNNINNGGGG FFIINNAAAANNCCCCIAAAAL EDDUUCCAATTIOOONNN GGGAAMMMINNNGG AAPP
HHHEE CCCOOONNNNNNEECCCTTEEEDD CCAAA
CLIENT SUCCESS
19
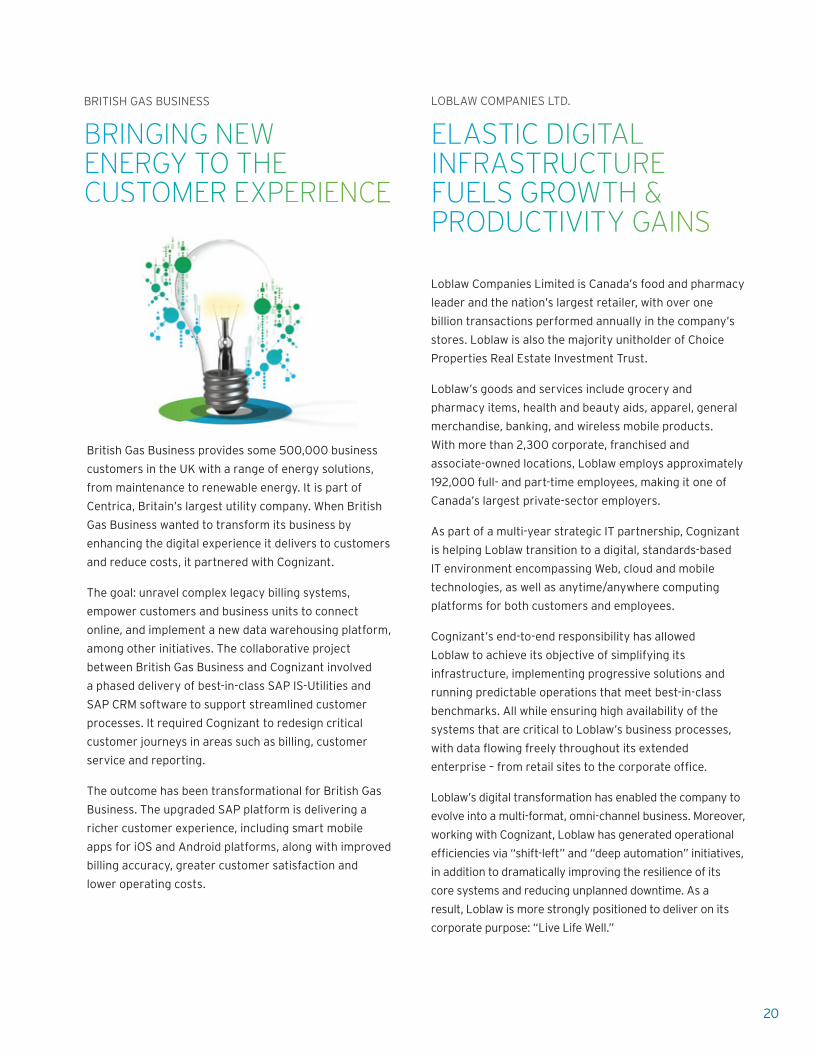
British Gas Business provides some 500,000 business
customers in the UK with a range of energy solutions,
from maintenance to renewable energy. It is part of
Centrica, Britain’s largest utility company. When British
Gas Business wanted to transform its business by
enhancing the digital experience it delivers to customers
and reduce costs, it partnered with Cognizant.
The goal: unravel complex legacy billing systems,
empower customers and business units to connect
online, and implement a new data warehousing platform,
among other initiatives. The collaborative project
between British Gas Business and Cognizant involved
a phased delivery of best-in-class SAP IS-Utilities and
SAP CRM software to support streamlined customer
processes. It required Cognizant to redesign critical
customer journeys in areas such as billing, customer
service and reporting.
The outcome has been transformational for British Gas
Business. The upgraded SAP platform is delivering a
richer customer experience, including smart mobile
apps for iOS and Android platforms, along with improved
billing accuracy, greater customer satisfaction and
lower operating costs.
Loblaw Companies Limited is Canada’s food and pharmacy
leader and the nation’s largest retailer, with over one
billion transactions performed annually in the company’s
stores. Loblaw is also the majority unitholder of Choice
Properties Real Estate Investment Trust.
Loblaw’s goods and services include grocery and
pharmacy items, health and beauty aids, apparel, general
merchandise, banking, and wireless mobile products.
With more than 2,300 corporate, franchised and
associate-owned locations, Loblaw employs approximately
192,000 full- and part-time employees, making it one of
Canada’s largest private-sector employers.
As part of a multi-year strategic IT partnership, Cognizant
is helping Loblaw transition to a digital, standards-based
IT environment encompassing Web, cloud and mobile
technologies, as well as anytime/anywhere computing
platforms for both customers and employees.
Cognizant’s end-to-end responsibility has allowed
Loblaw to achieve its objective of simplifying its
infrastructure, implementing progressive solutions and
running predictable operations that meet best-in-class
benchmarks. All while ensuring high availability of the
systems that are critical to Loblaw’s business processes,
Loblaw’s digital transformation has enabled the company to
evolve into a multi-format, omni-channel business. Moreover,
working with Cognizant, Loblaw has generated operational
in addition to dramatically improving the resilience of its
core systems and reducing unplanned downtime. As a
result, Loblaw is more strongly positioned to deliver on its
corporate purpose: “Live Life Well.”
BRITISH GAS BUSINESS
BBRRINNGGGINNNGGG NNEEEWWW EENNEERRRGGYYY TTOO TTTHHEEE CCUUUSSTTTOOMMMEERR EEEXXPPPEERRRIEEENCE
LOBLAW COMPANIES LTD.
EELLAAASSTTICCC DDDIGGGITTAAAALL INNFFRRAAASSTTTRRUUCCCTTUUURREE FUUEELLSS GGGRROOWWWTTHHH &&& PPRROODDDUUCCCTTIVVITTYYY GGAAAINNNS
British Gas Business provides some 500,000 busin
customers in the UK with a range of energy solutio
CCUUUSSTTTOOMMMEERR EEEXXPPPEERRRIEEEN
20

21
UNITED STATESSECURITIES AND EXCHANGE COMMISSION
Washington, D.C. 20549
FORM 10-K
FOR ANNUAL AND TRANSITION REPORTSPURSUANT TO SECTIONS 13 OR 15(d) OF THE
SECURITIES EXCHANGE ACT OF 1934(Mark One)
È ANNUAL REPORT PURSUANT TO SECTION 13 OR 15(d) OF THE SECURITIES EXCHANGEACT OF 1934For the fiscal year ended December 31, 2014
OR‘ TRANSITION REPORT PURSUANT TO SECTION 13 OR 15(d) OF THE SECURITIES
EXCHANGE ACT OF 1934For the transition period from to
Commission File Number 0-24429
COGNIZANT TECHNOLOGY SOLUTIONS CORPORATION(Exact Name of Registrant as Specified in Its Charter)
Delaware 13-3728359(State or Other Jurisdiction ofIncorporation or Organization)
(I.R.S. EmployerIdentification No.)
Glenpointe Centre West500 Frank W. Burr Blvd.
Teaneck, New Jersey 07666(Address of Principal Executive Offices) (Zip Code)
Registrant’s telephone number, including area code: (201) 801-0233
Securities registered pursuant to Section 12(b) of the Act:Title of each class Name of each exchange on which registered
Class A Common Stock, $0.01 par value per share The NASDAQ Stock Market LLCSecurities registered pursuant to Section 12(g) of the Act:
None
Indicate by check mark if the registrant is a well-known seasoned issuer, as defined in Rule 405 of the Securities Act. È Yes ‘ NoIndicate by check mark if the registrant is not required to file reports pursuant to Section 13 or Section 15(d) of the
Act. ‘ Yes È NoIndicate by check mark whether the registrant (1) has filed all reports required to be filed by Section 13 or 15(d) of the Securities
Exchange Act of 1934 during the preceding 12 months (or for such shorter period that the registrant was required to file such reports), and(2) has been subject to such filing requirements for the past 90 days. È Yes ‘ No
Indicate by check mark whether the registrant has submitted electronically and posted on its corporate Website, if any, every InteractiveData File required to be submitted and posted pursuant to Rule 405 of Regulation S-T (§232.405 of this chapter) during the preceding12 months (or for such shorter period that the registrant was required to submit and post such files). È Yes ‘ No
Indicate by check mark if disclosure of delinquent filers pursuant to Item 405 of Regulation S-K (§229.405 of this chapter) is notcontained herein, and will not be contained, to the best of registrant’s knowledge, in definitive proxy or information statements incorporatedby reference in Part III of this Form 10-K or any amendment to this Form 10-K. ‘
Indicate by check mark whether the registrant is a large accelerated filer, an accelerated filer, a non-accelerated filer, or a smallerreporting company. See definitions of “large accelerated filer,” “accelerated filer” and “smaller reporting company” in Rule 12b-2 of theExchange Act. (Check one):Large accelerated filer È Accelerated filer ‘
Non-accelerated filer ‘ (Do not check if a smaller reporting company) Smaller reporting company ‘
Indicate by check mark whether the registrant is a shell company (as defined in Rule 12b-2 of the Act). ‘ Yes È NoThe aggregate market value of the registrant’s voting shares of common stock held by non-affiliates of the registrant on June 30, 2014,
based on $48.91 per share, the last reported sale price on the NASDAQ Global Select Market of the NASDAQ Stock Market LLC on thatdate, was $29,556,044,386.
The number of shares of Class A common stock, $0.01 par value, of the registrant outstanding as of February 19, 2015 was 609,616,575shares.
DOCUMENTS INCORPORATED BY REFERENCE
The following documents are incorporated by reference into the Annual Report on Form 10-K: Portions of the registrant’s definitiveProxy Statement for its 2015 Annual Meeting of Stockholders are incorporated by reference into Part III of this Report.

TABLE OF CONTENTS
Item Page
PART I . . . . . . . . . . . . . . . . . . . . . . . . . . . . . . . . . . . . . . . . . . . . . . . . . . . . . . . . . . . . . . . . . . . . . . . . . . . . . . . 11. Business . . . . . . . . . . . . . . . . . . . . . . . . . . . . . . . . . . . . . . . . . . . . . . . . . . . . . . . . . . . . . . . . . . . 11A. Risk Factors . . . . . . . . . . . . . . . . . . . . . . . . . . . . . . . . . . . . . . . . . . . . . . . . . . . . . . . . . . . . . . . . 211B. Unresolved Staff Comments . . . . . . . . . . . . . . . . . . . . . . . . . . . . . . . . . . . . . . . . . . . . . . . . . . . 392. Properties . . . . . . . . . . . . . . . . . . . . . . . . . . . . . . . . . . . . . . . . . . . . . . . . . . . . . . . . . . . . . . . . . . 403. Legal Proceedings . . . . . . . . . . . . . . . . . . . . . . . . . . . . . . . . . . . . . . . . . . . . . . . . . . . . . . . . . . . 404. Mine Safety Disclosures . . . . . . . . . . . . . . . . . . . . . . . . . . . . . . . . . . . . . . . . . . . . . . . . . . . . . . 40
PART II . . . . . . . . . . . . . . . . . . . . . . . . . . . . . . . . . . . . . . . . . . . . . . . . . . . . . . . . . . . . . . . . . . . . . . . . . . . . . . 415. Market for Registrant’s Common Equity, Related Stockholder Matters and Issuer Purchases
of Equity Securities . . . . . . . . . . . . . . . . . . . . . . . . . . . . . . . . . . . . . . . . . . . . . . . . . . . . . . . . 416. Selected Financial Data . . . . . . . . . . . . . . . . . . . . . . . . . . . . . . . . . . . . . . . . . . . . . . . . . . . . . . . 447. Management’s Discussion and Analysis of Financial Condition and Results of
Operations . . . . . . . . . . . . . . . . . . . . . . . . . . . . . . . . . . . . . . . . . . . . . . . . . . . . . . . . . . . . . . . 457A. Quantitative and Qualitative Disclosures About Market Risk . . . . . . . . . . . . . . . . . . . . . . . . . 648. Financial Statements and Supplementary Data . . . . . . . . . . . . . . . . . . . . . . . . . . . . . . . . . . . . . 659. Changes in and Disagreements with Accountants on Accounting and Financial
Disclosure . . . . . . . . . . . . . . . . . . . . . . . . . . . . . . . . . . . . . . . . . . . . . . . . . . . . . . . . . . . . . . . 659A. Controls and Procedures . . . . . . . . . . . . . . . . . . . . . . . . . . . . . . . . . . . . . . . . . . . . . . . . . . . . . . 669B. Other Information . . . . . . . . . . . . . . . . . . . . . . . . . . . . . . . . . . . . . . . . . . . . . . . . . . . . . . . . . . . 67
PART III . . . . . . . . . . . . . . . . . . . . . . . . . . . . . . . . . . . . . . . . . . . . . . . . . . . . . . . . . . . . . . . . . . . . . . . . . . . . . . 6810. Directors, Executive Officers and Corporate Governance . . . . . . . . . . . . . . . . . . . . . . . . . . . . 6811. Executive Compensation . . . . . . . . . . . . . . . . . . . . . . . . . . . . . . . . . . . . . . . . . . . . . . . . . . . . . . 6812. Security Ownership of Certain Beneficial Owners and Management and Related
Stockholder Matters . . . . . . . . . . . . . . . . . . . . . . . . . . . . . . . . . . . . . . . . . . . . . . . . . . . . . . . 6813. Certain Relationships and Related Transactions, and Director Independence . . . . . . . . . . . . . 6814. Principal Accountant Fees and Services . . . . . . . . . . . . . . . . . . . . . . . . . . . . . . . . . . . . . . . . . . 68
PART IV . . . . . . . . . . . . . . . . . . . . . . . . . . . . . . . . . . . . . . . . . . . . . . . . . . . . . . . . . . . . . . . . . . . . . . . . . . . . . . 6915. Exhibits, Financial Statements Schedules . . . . . . . . . . . . . . . . . . . . . . . . . . . . . . . . . . . . . . . . . 69
SIGNATURES . . . . . . . . . . . . . . . . . . . . . . . . . . . . . . . . . . . . . . . . . . . . . . . . . . . . . . . . . . . . . . . . . . . . . . . . . 70EXHIBIT INDEX . . . . . . . . . . . . . . . . . . . . . . . . . . . . . . . . . . . . . . . . . . . . . . . . . . . . . . . . . . . . . . . . . . . . . . . 71INDEX TO CONSOLIDATED FINANCIAL STATEMENTS AND FINANCIAL STATEMENT
SCHEDULE . . . . . . . . . . . . . . . . . . . . . . . . . . . . . . . . . . . . . . . . . . . . . . . . . . . . . . . . . . . . . . . . . . . . . . . . . F-1
i

[THIS PAGE INTENTIONALLY LEFT BLANK]
PART I
Item 1. Business
Overview
We are a leading provider of information technology (IT), consulting and business process services,dedicated to helping the world’s leading companies innovate and build stronger businesses. Our clients engage usto help them operate more efficiently, provide solutions for critical business and technology problems, and tohelp them drive technology-based innovation and growth. Our core competencies include: Business, Process,Operations and IT Consulting, Application Development and Systems Integration, Enterprise InformationManagement, or EIM, Application Testing, Application Maintenance, IT Infrastructure Services, or IT IS, andBusiness Process Services, or BPS. We tailor our services to specific industries and utilize an integrated globaldelivery model. This seamless global sourcing model combines industry-specific expertise, client service teamsbased on-site at the client locations and delivery teams located at dedicated near-shore and offshore globaldelivery centers.
We completed several acquisitions during 2014 that we believe will accelerate our ability to provide multi-service integrated solutions to the healthcare industry and enhance our overall digital delivery capabilities. Webelieve that our fourth quarter acquisition of TZ US Parent, Inc., or TriZetto, a leading provider of healthcare ITsoftware and solutions, broadens our solutions offerings and creates an opportunity for us to cross-sell ourbusiness process, infrastructure management and consulting services to the TriZetto clients where we currentlydo not have relationships. More importantly, we believe a greater longer term opportunity exists for us tocombine TriZetto’s platforms with our services and program management capabilities to create end-to-endintegrated platform-based solutions that bring together infrastructure, applications, the cloud and businessprocess services. During 2014, we completed three other acquisitions to strengthen our digital deliverycapabilities across several industry groups.
Industry Background
In today’s complex business environment, many companies face intense competitive pressure and rapidlychanging market dynamics, driven by such factors as changes in the economy, government regulations,globalization, virtualization and other technology innovations. At the same time, companies must evaluate theeffect of emerging digital technologies, including social networks, mobile devices, advanced analytics and cloudcomputing, or SMAC, on their business operations. These technologies represent a new IT infrastructure that willtransform the way companies relate to their customers, engage with employees, and bring innovative productsand services to market. In response to these challenges, many companies are focused on improving efficienciesand enhancing effectiveness while also driving innovation through technology to favorably impact both thebottom-line and the top-line. Companies need to build agility into both the cost and revenue sides of theirmodels. In this context, they increasingly view a global sourcing model as a key to their efforts to operate morecost-effectively and productively. At the same time, companies are confronting secular industry shifts, changingcustomer requirements and new technologies that require them to innovate by building new and differentcapabilities with emerging technologies to ensure their businesses stay competitive.
Companies increasingly seek to meet a dual mandate of achieving more efficient and effective operations,including cost reductions, while developing technology-based innovation and business transformation in acomprehensive, integrated manner. Achieving these objectives presents major challenges and requires companiesto have highly skilled professionals trained in many diverse and new technologies combined with industry-specific expertise. Increasingly, companies are relying on service providers operating with global deliverymodels, like Cognizant, to help them meet these ever-changing objectives.
Global demand for high quality, cost-effective technology services from outside providers has created asignificant opportunity for IT service providers that can successfully leverage the benefits of and address thechallenges in using a global talent pool. The effective use of personnel from across the globe can offer a variety
1
of benefits, including deep industry expertise, lower costs, faster delivery of new IT solutions and innovations inindustry-specific solutions, processes and technologies. Certain countries, particularly India, the Philippines,Singapore and China, have large talent pools of highly qualified technical professionals who can provide highquality IT and business process services at a lower cost. India is a leader in IT services and is regarded as havingone of the largest and highest quality pools of talent in the world. Historically, IT service providers have usedoffshore labor pools primarily to supplement the internal staffing needs of customers. However, evolvingcustomer demands have led to the increasing acceptance and use of offshore resources for higher value-addedservices. These services include application design, development, testing and systems integration, technology andindustry-specific consulting and infrastructure management.
The Cognizant Approach
Our approach is built on a global network of delivery centers, deep domain expertise and a robust portfolioof industry-specific services.
Global Delivery Model. Our geographic reach extends across the globe, with more than 75 delivery centersworldwide. We have a four-tiered global architecture for service delivery and operations, consisting of employeesco-located at clients’ sites, at local or in-country delivery centers, at regional delivery centers and at global deliverycenters. We are continuously expanding global delivery capacity at our centers in the United States, India, Europeand other regions throughout the world. We use our proprietary Cognizant 2.0 knowledge-sharing and project-management platform to unite all of our operations around the globe, access capabilities across the Company andstreamline workflow. Our extensive facilities, technology and communications infrastructure facilitates the seamlessintegration of our global workforces.
Domain Expertise. Our business is organized and managed primarily around our four industry-orientedbusiness segments:
• Financial Services;
• Healthcare;
• Manufacturing, Retail and Logistics; and
• Other, which includes Communications, Information, Media and Entertainment, and High Technology.
This industry focus has been central to our revenue growth and high client satisfaction. As the IT servicesindustry continues to mature, clients are looking for service providers with a deep understanding of theirbusinesses, industry initiatives, customers, markets and cultures, and that can create solutions tailored to meettheir individual business needs. To strengthen our industry practices, we hire professionals who are deeplyexperienced in the industries we serve, thus establishing a broad base of business analysts and consultants. Wecontinually invest in industry training for our staff and build out industry-specific services and solutions. Thisapproach is central to our high levels of on-time delivery and client satisfaction, as we understand the full contextof our clients’ challenges and have deep experience in addressing them.
Portfolio of Services. We offer a broad range of services designed to help clients address businesschallenges and enhance their ability to pursue growth opportunities. Our key service areas, Consulting andTechnology Services and Outsourcing Services, are delivered to our clients across our four business segments ina standardized, high-quality manner through our global delivery model. We continually invest in the expansionof our service portfolio to anticipate and meet clients’ evolving needs. In recent years, in addition to ourtraditional offerings, we have begun to provide services that enable clients to harness emerging digitaltechnologies. Our current service areas include:
• Consulting and Technology Services
• Business, Process, Operations and IT Consulting
• Application Development and Systems Integration
2
• Enterprise Information Management
• Application Testing
• Digital Technologies Services, including Social, Mobile, Analytics and Cloud-based Technologies
• Software Solutions and Related Services
• Outsourcing Services
• Application Maintenance
• IT Infrastructure Services
• Business Process Services
Business Segments
We are organized around and report the operations of our business according to our four industry-orientedbusiness segments:
Financial Services Healthcare Manufacturing/Retail/Logistics Other
–Banking–Insurance
–Healthcare–Life Sciences
–Manufacturing and Logistics–Retail, Travel and Hospitality–Consumer Goods
–Communications–Information, Media and
Entertainment–High Technology
Financial Services
Our Financial Services business segment serves leading financial institutions throughout the world. Ourclients include banks, investment firms and insurance companies. In 2014, this segment representedapproximately 41.8% of our total revenues. Revenues from our Financial Services business segment were$4,285.6 million, $3,717.6 million, and $3,035.4 million for the years ended December 31, 2014, 2013, and2012, respectively. This business segment provides services to our customers operating in the followingindustries:
• Banking. We serve traditional retail and commercial banks, diversified financial enterprises, broker-dealers, asset management firms, depositories, clearing organizations and exchanges. Our clientsengage us to help make their operations as effective, productive and cost-efficient as possible, and tosupport new digital capabilities. We assist these clients in such areas as: Retail Banking, WholesaleBanking, Consumer Lending, Cards and Payments, Risk Management, Investment Banking andBrokerage, Asset and Wealth Management, and Securities Services.
The demand for our services in the banking sector is being driven by several significant changesin the industry. In response to the recent global economic crisis, central banks and government bodieshave adopted policies designed to maintain low interest rates, raise capital requirements, impose newregulations, and institute risk-mitigation measures, such as restricting proprietary trading. Such actionshave the effect of curtailing some revenue sources and increasing compliance costs for most financialinstitutions. In addition, financial institutions must consider adopting new digital technologies tochange the way they interface with customers and employees and manage their operations. We help ourcustomers adapt to these changes by providing technology-based, industry-specific solutions. Inaddition to Application Development and Maintenance, the services increasingly in demand in thissector include EIM, Testing, Customer Relationship Management, or CRM, Enterprise ResourcePlanning, or ERP, BPS, IT IS, and Business and Technology Consulting.
• Insurance. We serve global property and casualty insurers, life insurers, reinsurance firms andinsurance brokers by improving the efficiency and effectiveness of their operations and helping themwith business transformation. We focus on such aspects of our clients’ operations as: Business
3
Acquisition, Policy Administration, Claims Processing, Management Reporting, RegulatoryCompliance and Reinsurance.
Among the factors driving the need for our services in the insurance industry is a desire toimprove the sales and marketing process, both by deepening direct retail customer relationships andstrengthening interactions with networks of independent and captive insurance agents, often throughthe use of social and mobile technologies. Insurers also seek to enhance their profitability bydifferentiating their products and services, resulting in a need for specialized underwriting models andsystems. Additionally, many insurers seek to improve business effectiveness by reducing expenseratios and exiting non-core lines of business and operations. Our services which are most in demand inthis sector include: Application Development and Integration, Consulting, BPS, IT IS, EIM, and digitalservices.
Healthcare
Our Healthcare business segment serves many leading healthcare and life sciences companies, and includesthe post-acquisition operating results of TriZetto. In 2014, our Healthcare business segment representedapproximately 26.2% of our total revenues. Revenues from our Healthcare business segment were $2,689.4million, $2,264.8 million, and $1,934.9 million for the years ended December 31, 2014, 2013, and 2012,respectively. This business segment provides services to our clients operating in the following industries:
• Healthcare. We work with many leading global healthcare organizations, including healthcare payers,providers and pharmacy benefit managers. The healthcare industry today faces the dual challenge ofimproving the quality of care while lowering the cost of care and making healthcare affordable to alarger population. A key factor driving this transformation has been the Affordable Care Act. In 2014,we acquired TriZetto to enhance our competitive position in the healthcare sector. TriZetto deliversworld-class, healthcare IT solutions that enable healthcare organizations to work more efficiently andcollaboratively.
Our Healthcare business focuses on providing a broad range of services and solutions that addressregulatory requirements and emerging industry trends such as: Regulatory Compliance (includingcompliance with the Affordable Care Act and work related to state health insurance exchanges),Integrated Health Management (including establishing health information exchanges), EIM, ClaimsInvestigative Services (aimed at preventing fraud and abuse and strengthening administrativeprocesses), and Operational Improvement (in areas such as claims processing, enrollment, membershipand billing). We also help our clients to enable their systems and processes to deal with the retailorientation of health care, such as the support of individual mandates and the adoption of mobile andanalytics solutions to improve access to health information and decision making by end consumers.Through our acquisition of TriZetto, we now develop, license, implement and support proprietary andthird-party software products for the healthcare industry.
• Life Sciences. We partner with leading pharmaceutical, biotech, and medical device companies, as wellas providers of generic, animal health and consumer health products, to assist them in transformingtheir business by becoming more efficient and effective from an IT and business operationsperspective, while driving innovation and transformation to grow their business.
Among the industry forces generating demand for our services are: financial pressures caused bypayer and government pricing pressures, patent expiry and competition from generics; the drive toexpand into new geographic markets; the need for more targeted or personalized therapies leading toR&D innovation; continued diversification of product portfolios and the related high cost of productdevelopment; and a dynamic regulatory environment with greater emphasis on product safety, ethicsand compliance, transparency of pricing and promotional activity. Our Life Sciences solutions helptransform many of the business processes in the life sciences value chain (Research, ClinicalDevelopment, Manufacturing and Supply Chain, Sales and Marketing) as well as regulatory andadministrative functions and general IT. Among our services most often in demand are Consulting,
4
EIM, Customer Solutions, BPS, IT IS, Application Maintenance, Application Development andSystems Integration, Testing and digital services. In 2014, we acquired Cadient Group Inc., a full-service digital marketing agency that serves a broad spectrum of life sciences companies in thepharmaceutical, biotechnology, consumer health, and medical device industries. Life sciencescompanies around the world have significantly increased their emphasis on web, mobile, and socialengagement with all of their stakeholders while increasingly leveraging enterprise-level analytics todrive a customer-centric approach to marketing and sales.
Manufacturing/Retail/Logistics
Our Manufacturing, Retail and Logistics business segment provides outsourcing, business consulting andtechnology services for global leaders in a range of sub-sectors, including industrial, automotive, processlogistics, energy and utilities, and retail. In 2014, this segment represented approximately 20.4% of our totalrevenues. Revenues from our Manufacturing/Retail/Logistics business segment were $2,093.6 million,$1,868.3 million, and $1,498.7 million for the years ended December 31, 2014, 2013, and 2012, respectively.This business segment services customers in the following industry groups:
• Manufacturing and Logistics. Clients in this sector include manufacturers of automotive and industrialproducts as well as processors of natural resources, chemicals and raw materials. In logistics, ourclients include rail, truck, marine and other transportation and distribution companies. We also servemany leading energy utilities, as well as oil and gas producers. Our clients seek our help inimplementing business-relevant changes that will make them more productive, competitive and cost-effective. To that end, we help organizations improve operational efficiencies, enhance responsiveness,and collaborate with trading partners to better serve their markets and end customers. We leverage acomprehensive understanding of the business and technology drivers of the industry. Some of ourManufacturing and Logistics solutions for Automotive and Industrial clients include: WarrantyManagement, Dealer Systems Integration, Supply Chain Management, Sales and Operations Planning,and Mobility. For transportation and distribution clients, our service areas include Warehouse and YardManagement, Transportation Asset Management, Transportation Network Design, Global TradeManagement and Analytics.
Industry trends that influence the demand for our services in this sector include the increasingglobalization of sourcing and the desire of clients to further penetrate emerging markets, leading tolonger and more complex supply chains. In the power generation sector, industry trends include thecontinued energy conservation efforts, including “smart meter” installations, the need for better gridreliability and security, regulatory changes and the need to relieve cost pressures through better assetperformance and web-based customer care systems. Clients also are optimizing their supply chains tobetter manage inventory, support growing eCommerce operations and improve customer-suppliercollaboration. They are applying intelligent systems to manufacturing and logistics operations,enabling mobile platforms to support field sales and are using data analytics to make better informeddecisions. These trends are driving demand for our offerings such as Enterprise Application Services,or EAS, EIM, Consulting and digital technologies.
• Retail, Travel and Hospitality. We serve a wide spectrum of retailers and distributors, includingsupermarkets, specialty premium retailers, department stores and large mass-merchandise discounters,who seek our assistance in becoming more efficient and cost-effective and in digitally transformingtheir businesses. Current trends affecting demand in the retail industry include a need for greater cost-efficiency to combat the industry’s traditionally narrow profit margins, changes in supply chainmanagement to facilitate direct store delivery, the ability to accommodate multi-channel (in-store andon-line) models, and the impact of digital technologies on customer and employee interaction.
Services in high demand in the retail sector include Consulting, eCommerce, EAS, SystemsIntegration, Testing, BPS and EIM. We also serve the entire travel and hospitality industry including
5
airlines, hotels and restaurants, as well as online and retail travel, global distribution systems andintermediaries and real estate companies, providing solutions such as CRM, EIM and BPS.
• Consumer Goods. We work with many of the world’s premier consumer goods manufacturers, creatinginnovative solutions and strategies that help them build and sustain strong brands while enhancing theirprice-competitiveness, category leadership and consumer loyalty. Principal segments served includeconsumer durables, food and beverage, footwear and apparel, and home and personal care products.Our expertise in these areas spans a wide range, from demand-driven supply chains, to revenue-creating trade promotion management systems, to analytics systems and mobility solutions thatanticipate and serve ever-changing customer needs.
The demand for our services in this sector is driven by the need of consumer goods companies toaccelerate product innovation to remain competitive and deliver top-line growth, the continuing driveto optimize global sourcing and supply chain management, the impact of digital technologies onconsumer interaction, marketing and sales processes, the use of data analytics to increase theeffectiveness of product development and marketing, as well as ongoing pressures to curtail IT costs. Inresponse to these needs, we provide solutions including Application Development and SystemsIntegration, Consulting, CRM, EIM, Testing, BPS, IT IS and digital services.
Other
The Other business segment includes the Communications, Information, Media and Entertainment, andHigh Technology operating segments. In 2014, our Other business segment represented approximately 11.6% ofour total revenues. Revenues from our Other business segment were $1,194.1 million, $992.5 million, and$877.5 million for the years ended December 31, 2014, 2013, and 2012, respectively. The Other businesssegment is an aggregation of operating segments each of which, individually, represents less than 10.0% ofconsolidated revenues and segment operating profit. Descriptions of the key operating segments included in theOther business segment are as follows:
• Communications. We serve some of the world’s leading communications (cable, wireless and wireline)service providers, equipment vendors, and software vendors. We help our clients address the importanttrends in the communications industry, such as: transitioning to new network technologies; designing,developing, testing and introducing new products and channels; improving customer service andincreasing customer satisfaction; transforming Business Support Systems (BSSs) and OperationsSupport Systems (OSSs); transitioning to agile development methodologies; and enabling applicationsfor cloud deployment. We provide solutions including; Customer Solutions, Mobility, IT IS, Testing,ERP Implementation, EIM, and Cloud services.
• Information, Media and Entertainment. We work with some of the world’s largest media andentertainment companies, including information service providers, publishers, broadcasters, and movie,music and video game companies. The growth of digital platforms is causing significant change inthese industries and we are working with clients to help them meet these challenges and transform theirbusinesses. Additional trends affecting the industry include a decline in traditional print publishing, theneed for digital asset management and the increasing role of digital technologies on the consumption ofentertainment content.
We provide solutions in critical areas such as the Digital Content Supply Chain and Media AssetManagement. Some of our other services include: Business Solutions (such as AdvertisingManagement, Online Media, and e-Business), Digital Distribution, Workflow Automation, IntellectualProperty Management, Anti-Piracy Initiatives, and Operational Systems (Advertising Sales, StudioManagement, Billing and Payments, Content Management and Delivery).
• High Technology. We serve some of the world’s leading independent software vendors, or ISVs,technology equipment manufacturers, and online service providers. We assist the ISVs with theirtransitions to new business models (such as Software-as-a-Service, or SaaS, models) and facilitate their
6
license management and sales processes. We help the high-technology manufacturers take on complex,transformational business process and product engineering initiatives. The technology sector is largelydriven by product development. This creates demand for Analytical, Engineering, Testing, and ContentManagement services and Go to Market strategies. Other services we provide include CRM, ProductTechnical Support, Supply Chain Management and the application of digital technologies to thecustomer experience, as well as Application Development, Systems Integration and ApplicationMaintenance.
Across our business segments, we are highly dependent upon our foreign operations. The majority of ourdevelopment and delivery centers and technical professionals are located in India, and we also have facilities inEurope, Asia Pacific, the Middle East and Latin America. Our operations in India and the rest of the worldexpose us to various risks, including regulatory, economic and political instability, potentially unfavorable tax,import and export policies, fluctuations in foreign exchange and inflation rates, international and civil hostilities,terrorism, natural disasters and pandemics.
See Note 15 to our consolidated financial statements for additional information related to our businesssegments, including the disclosure of segment operating profit.
Our Solutions and Services
Across each of our business segments, we provide a broad and expanding range of consulting, informationtechnology and outsourcing services, including:
Consulting and Technology Services
• Business, Process, Operations and IT Consulting. Our global consulting team, Cognizant BusinessConsulting, or CBC, helps clients re-imagine and transform their businesses to gain competitiveadvantage. As businesses explore new operating models, the value chain is being disaggregated todrive speed to market and agility.
CBC is built on a foundation of deep thought leadership and actionable strategies. CBC workswith clients to improve business performance and operational productivity in order to exceed businessgoals. We also provide assistance with Strategy Consulting, Business and Operations Consulting, ITStrategy & Change Management, and Program Management Consulting.
Key factors driving the demand for CBC’s services are the following:
• The need to run the business better while increasing operational flexibility and reducing timeto market;
• Optimizing big data and predictive analytics to gain competitive insight;
• Large business transformations, impacting business and IT operating models;
• Increased demands to collaborate and compete in the market for customers, capabilities andtalent;
• The need to remove roadblocks in the Business/IT relationship to increase the return ontechnology investments, both directly and through positioning IT as a source of digitalbusiness innovation;
• Readiness to embrace virtualization capabilities, including greater infrastructure outsourcingand cloud solutions, with a focus on identifying and managing risk and cost; and
• Ongoing regulatory shifts, which require enhanced risk management and complianceframeworks as well as greater organizational resilience.
7
In this environment, the services currently provided by CBC include:
• IT strategy consulting to define new IT target operating and delivery models, and to optimizeIT-to-business alignment, sourcing strategies and IT costs;
• Program management consulting, including post-acquisition integration, business and ITintegration, business transformation, and large scale business transformation;
• Operations improvement consulting for business process management, operations strategy,global sourcing and supply chain management, and change management;
• Strategy consulting with respect to re-imagining new business and operating models, marketgrowth, mergers and acquisitions, product innovation and sustainability initiatives; and
• Business consulting related to finance, risk advisory, human resources, marketing andanalytics functions.
CBC is also expanding new services and capabilities in areas such as BPS, Supply ChainManagement, Enterprise Analytics, EAS, and consulting related to the management of core assets andintellectual property, or IP.
• Application Development and Systems Integration. We offer a full range of Application Design,Application Development and Systems Integration services, which enable customers to focus on andinvest in their core business activities and in growth-producing innovation, while ensuring that their ITfunctions operate in the most efficient, responsive and cost-effective manner. We have particular depthof skills in implementing large, complex, business-critical IT development and integration programs.
Demand for our Application Development and Systems Integration services is being driven by ourcustomers’ growing need to access outside capabilities to respond to the impact of changes in markets,regulation, competition and digital technologies on their businesses.
As part of our Application Development services, we define customer requirements, documentspecifications and design, develop, test and integrate software across multiple platforms, includingInternet technologies. We modify and test applications to enable systems to function in new operatingenvironments. In addition, these services include ERP and CRM implementation services. We followone of two alternative approaches to application development and systems integration:
• full life-cycle application development, in which we assume start-to-finish responsibility foranalysis, design, implementation, testing and integration of systems; or
• cooperative development, in which our employees work with a customer’s in-house IT personnelto jointly analyze, design, implement, test and integrate new systems.
In both of these approaches, our on-site team members work closely and collaboratively with ourclients. Detailed design, implementation and testing are generally performed at dedicated near-shoreand offshore development and delivery centers. In addition, we maintain an on-site presence at eachcustomer location in order to address evolving client needs and resulting changes to the project.
A key part of our application development and systems integration offering is a suite of services tohelp organizations build and integrate business applications with the rest of their operations. Using thissuite of services, we leverage our skills in business application development and enterprise applicationintegration to build sophisticated business applications and to integrate these new applications andwebsites with client servers and legacy systems. We build and deploy robust, scalable and extensiblearchitectures for use in a wide range of industries. We maintain competency centers specializing invarious areas such as: Microsoft solutions; IBM, SAP, Oracle and Java applications; and CloudComputing and Mobile solutions. These competency centers enable us to provide applicationdevelopment and integration services to a broad spectrum of clients.
8
Our re-engineering service offerings assist customers migrating from systems based on legacycomputing environments to newer standards-based distribution architectures, often in response to themore stringent demands of business. Our re-engineering tools automate many of the processes requiredto implement advanced technology platforms. We believe that this automation substantially reduces thetime and cost to perform re-engineering services. These tools also enable us to perform source codeanalysis and to re-design target databases and convert certain programming languages. If necessary, ourprogrammers also help clients re-design and convert user interfaces.
• Enterprise Information Management. Our EIM practice focuses on helping clients harness the vastamounts of data available on their operations, customers and markets, and to convert that data intoinformation and insights that are valuable to their businesses and can be used to drive managementdecisions. We help clients identify the types of data available both within their organizations and fromoutside sources, including social media, and work to bring that data together in a meaningful “data toforesight” continuum. Among the trends driving this business are: the desire of companies to betterunderstand consumer demands and market opportunities in order to create new products and services,the explosion of differently structured types of data from newly crafted business processes, the need tomanage reporting requirements in regulated industries such as healthcare and financial services, and thepressures to manage operations more efficiently and cost-effectively through the use of analytical tools.Among the services we provide in the EIM area are the following:
• Strategic, advisory and management consulting services across Information Management,Business Intelligence & Analytics;
• Enterprise Data Management, including the creation of data warehouses, data marts, operationalstores, enterprise master data management platforms, enterprise metadata platforms and enterprisedata governance;
• Descriptive Analytics/ Business Intelligence that involves the strategy, design, build andmanagement of information assets that drive day-to-day decision making;
• Strategic Corporate Performance Management, which enables clients to create executivedashboards or scorecards to better manage operations;
• Packaged Analytics designed to provide solutions to specific business problems leveragingtechnologies such as Mobile and Cloud; and
• Big Data services that assist clients in managing and deriving actionable insights from theexplosion in the volume, variety, velocity and complexity of data.
• Application Testing. Our Application Testing practice offers a comprehensive suite of services intesting, consulting and engineering. Our Quality Assurance, or QA, transformation services help clientsdevelop deep, agile QA capabilities that create or extend their competitive advantage. QA is driven bysix strategic themes: integrated automation, user advocacy, IP-based intelligent platform, a factorymodel, end-to-end quality focus, and an on-demand infrastructure model. Our business-aligned servicesin the areas of system and integration testing, package testing, user acceptance, automation,performance testing and test data management address our clients’ critical quality needs. Consultingand infrastructure solutions in quality management, test tools and test infrastructure enable our clientsto capitalize on emerging opportunities. Factors driving the demand for our testing services include theadoption of digital technologies, the need for testing of new regulatory compliance processes, and thedesire of clients for more cost-effective and nimble “on-demand” testing. Accordingly, among thefunctions we provide are: testing related to integration of SAP, Seibel and other systems, IT processand quality consulting, testing of customized mobile and cloud-based applications, and Testing as aService. We focus our Managed Test Centers on specific domains (e.g., specific industries andsoftware solutions), ensuring we tailor our testing solutions to the particular needs of clients. We helpour clients achieve significant reduction in time to market as well as cost of quality, and realizesignificant improvements in the maturity of their quality processes.
9
• Digital Technologies Services, including Social, Mobile, Analytics and Cloud-based Technologies. Wehelp clients implement digital technologies in their businesses. These technologies are nowfundamental components of the enterprise IT architecture. These technologies are profoundly changingthe way companies bring products and services to market and relate to and interact with theircustomers, employees and others. As such, these technologies may help companies achieve innovation-driven top line growth and efficiencies that improve the bottom line. As part of our services, we helpclients analyze social media sentiment and build those insights into their customer relationshipmanagement process, as well as enabling clients to manage and analyze vast accumulations of data anduse that data to drive management decisions. We also offer end-to-end services to enable cloud-basedprocesses, from consulting and implementation to ongoing support activities.
• Software Solutions and Related Services. Through our 2014 acquisition of TriZetto, we now develop,license, implement and support proprietary and third-party software products for the healthcareindustry, including solutions for health insurance plans, third party benefit administrators, or TPAs, andhealthcare providers that enable healthcare organizations to work more efficiently and collaborativelyto deliver better healthcare services. Our solutions help health plans and TPAs increase administrativeefficiency, improve the cost and quality of care, and succeed in the retail healthcare market. Oursolutions help physicians and healthcare organizations simplify business processes and executestrategies for population health management, accountable care, and value-based initiatives.
Outsourcing Services
• Application Maintenance. Our Application Maintenance service offering supports some or all of aclient’s applications, ensuring that systems remain operational and responsive to changing userrequirements and provide on-going enhancements as required by the client. Beyond the traditional viewof IT outsourcing as a cost-saving measure, our Application Maintenance services enable clients toimprove the overall agility, responsiveness, productivity and efficiency of their IT infrastructure.Increasingly, we also are assisting clients in adapting their IT systems to digital technologies.
By supporting some or all of a client’s applications, our services help ensure that a user’s coreoperational systems are free of defects and responsive to changing needs. As part of this process, weare often able to introduce product and process enhancements and improve service levels to customersrequesting modifications and on-going support. We also provide Application Value ManagementSolutions that can help balance cost, complexity and capacity and can help clients reduce cost ofownership, improve service levels and create new operational efficiencies.
Our global delivery business model enables us to provide a range of rapid response and cost-effective support services to our clients. Our on-site personnel often provide help-desk services at theclient’s facility. These employees typically are available in the event of an emergency service requestand are also able to quickly resolve customer problems from remote locations. In the case of morecomplex maintenance services, including modifications, enhancements and documentation, whichtypically take a longer amount of time, we utilize our offshore resources to develop solutions morecost-effectively than would be possible locally.
As part of our Application Maintenance services, we assist clients in renovating their core systemsto meet the requirements imposed by new regulations, new standards or other external events. Weanticipate the operational environment of our clients’ IT systems as we design and develop suchsystems. We also offer diagnostic services to assist clients in identifying issues in their IT systems andoptimizing the performance of their systems.
• IT Infrastructure Services. We provide end-to-end IT Infrastructure Management Outsourcing servicesand anticipate continued growth for these services in the coming years. We provide service capabilityin redundant Global Operating Centers worldwide, through which we provide significant scale, qualityand cost savings to our clients. Clients are increasingly utilizing IT IS to sharpen their focus on corebusiness operations, reallocate overhead costs to growth investments, enable businesses to respond
10
more quickly to changing demands, decrease time to market, ensure that the IT infrastructure can scaleas the business evolves, and access skill sets outside the organization. The major services we provideinclude Data Center, Infrastructure Security, Network and Convergence, End-User ComputingServices, and Mobility. We also have Cloud Services offerings that utilize virtualization technologiesacross delivery solutions for private cloud, enterprise multi-tenant cloud and public cloud models.
• Business Process Services. We provide BPS services through unique industry-aligned solutions thatintegrate process, domain and technology expertise to enable our clients to respond in an agile mannerto market opportunities and challenges, while also creating variable cost structures to drive greatereffectiveness and cost-efficiency. We have extensive domain-specific expertise in core front office,middle office and back office functions including Finance and Accounting, Procurement, DataAdministration, Data Management, and Research and Analytics. Our industry-specific solutionsinclude clinical data management, pharmacovigilance, equity research support, commercial operationsand order management. In addition to BPS, related services include Consulting to ensure processexcellence, and a range of platform-based services. Our goals for our client relationships are customersatisfaction, operational productivity, strategic value, and business transformation. Among the factorsdriving growth in our services are the desire to improve cost-effectiveness, the emergence of digitaltechnologies, and the need for clients to access capabilities beyond their organizations to adapt to rapidchanges in technologies, markets and customer demands.
Business Strategies
Our objectives are to maximize shareholder value and enhance our position as a leading provider ofinformation technology, consulting and business process services. We implement the following core strategies toachieve these objectives:
Growth through Reinvestment. We aim to invest our profits above the 19% to 20% non-GAAP operating marginlevel, excluding stock-based compensation expense and acquisition-related charges, back into our business. Webelieve this is a significant contributing factor to our strong revenue growth. This investment is primarily focusedin the areas of: strengthening and expanding our portfolio of services; continuing to expand our geographicpresence for both sales and delivery; hiring client partners and relationship personnel with specific industryexperience or domain expertise; training our technical staff in a broader range of service offerings; recognizingand rewarding exceptional performance by our employees; and maintaining a level of resources, trained in abroad range of service offerings, to be well positioned to respond to our client requests, as described below.
• Expand Service Offerings and Solutions: We have several teams dedicated to creating innovativetechnology-based solutions and developing new, high value services. The teams collaborate withcustomers to develop these services. We are currently developing new offerings in Business and ITConsulting and industry-oriented IT solutions utilizing innovative technologies. We invest in internalresearch and development and promote knowledge building and sharing across the organization toadvance the development of new services and solutions. We also continue to enhance our capabilitiesand service offerings in the areas of CRM, ERP, EIM, Software Testing, Infrastructure Management,industry-oriented BPS services and digital technologies.
We believe that the continued expansion of our service offerings will provide new sources ofrevenue, reduce our reliance on any one technology initiative and foster long-term relationships withour customers by allowing us to better serve their needs. Additionally, as part of our vision to continueour growth and anticipate our clients’ and the markets’ rapidly changing demands in the near-term,mid-term and long-term, we are investing in emerging digital opportunities which will transform clientand user platforms to Internet, cloud and mobile-based experiences.
• Expand Domestic and International Geographic Presence: We have established sales and marketingoffices in various metropolitan areas in the United States and internationally. As we expand ourcustomer base, we plan to open additional sales and marketing offices globally to support the demands
11
of our clients and markets. This expansion is expected to facilitate sales and services to existing andnew customers.
• Research and Development and Competency Centers: We have project experience and expertise acrossmultiple architectures and technologies, and have made significant investments in our competencycenters and in research and development around the latest technology developments. Most of ourtechnical staff is trained in multiple technologies and architectures. As a result, we are able to react toclients’ needs quickly and efficiently redeploy our technical staff to support a variety of technologies.Also, to develop and maintain this flexibility, we have made a substantial investment in ourcompetency centers so that the experience gained from particular projects and research anddevelopment efforts is leveraged across our entire organization. Through our investment in researchand development activities and the continuing education of our technical personnel, we enlarge ourknowledge base and develop the necessary skills to keep pace with emerging technologies. We believethat our ability to work in new technologies allows us to foster long-term relationships by having thecapacity to continually address the needs of both existing and new clients.
• Enhance Processes, Methodologies and Productivity Toolsets: We have a comprehensive processframework that addresses the entire software engineering life cycle and support activities, which arescalable for projects of different sizes and complexities. This proprietary framework, which we refer toas “Process Space”, is supported by in-house project management, metrics management and workflowtools and is available to all our programmers globally. Process Space has evolved since its originalrelease in 1996 in breadth, depth and maturity, based on the implementation feedback from projectsand findings of internal quality audits and external assessments. Process capabilities are monitored atthe sub-process level and performance targets are monitored at the process level. Performance targetsare aligned with the overall business objectives. Statistical process controls are used extensively tocontinuously monitor, predict and improve performance. Our Delivery Excellence Group facilitatesprocess implementation from project inception and audits the projects periodically to ensure that theimplementation is effective and the risks are being managed. With the globalization of business, we arecommitted to improving and enhancing our proprietary Process Space software engineering processand other methodologies and toolsets. In light of the rapid evolution of technology, we believe thatcontinued investment in research and development is critical to our continued success. We areconstantly designing and developing additional productivity software tools to automate testingprocesses and improve project estimation and risk assessment techniques.
We have invested considerably in automation to improve process institutionalization across theorganization. For example, we have built and deployed “Cognizant 2.0,” an intelligent deliveryecosystem which orchestrates processes, methodologies and best practices driving effective usage ofknowledge, while providing a collaborative framework for our world-wide client service personnel.Our process framework has been extensively adapted to cater to different types of projects managed bythe organization across different service lines, such as Application Development, Managed Services,Application Testing, BPS and IT IS.
Global Delivery Model. We have a four-tiered global architecture for service delivery and operations, consistingof employees co-located at clients’ sites, at local facilities or in-country delivery centers, at regional deliverycenters and at global delivery centers. Our extensive facilities, technology and communications infrastructurefacilitate the seamless integration of our global workforces. This is accomplished by permitting team members indifferent locations to access common project information and to work directly on client projects. Thisinfrastructure allows for rapid completion of projects, highest level of quality, efficient use of clients’technological resources and real-time access to project information by the on-site account manager or the client.In addition, for large projects with short time frames, our offshore facilities allow for parallel processing ofvarious development phases to accelerate delivery time. Key aspects of our global delivery model include:
• Two-in-a-Box Engagement Model: Our proprietary, trademarked client engagement model, calledTwo-in-a-Box, or TIB, represents our commitment to providing superior service to help clients reduce
12
IT operational costs, embrace best practices and undergo sustainable business transformation. Centeredon the needs of the client’s organization, TIB is designed specifically to help clients quickly reduce ITbudgets, revamp IT operations and re-deploy freed-up assets to more strategic initiatives that generatebusiness value. The TIB model includes a relationship management team, led by the Client Partner, orCP, with deep industry expertise, working onsite to absorb the client’s culture, operational processes,challenges and business goals and to assist with strategic planning. Another critical TIB team memberis the dedicated global delivery manager, or DM. The relationship between the CP and DM is essentialto ensure that our IT services are delivered with precision and that they are tailored to each client’sunique needs.
• Highly-Skilled Workforce: Our managers and senior technical personnel provide in-depth projectmanagement expertise to clients. To maintain this level of expertise, we place significant emphasis onrecruiting and training our workforce of highly-skilled professionals. We have approximately 30,000project managers and senior service delivery staff around the world, many of whom have significantwork experience in North America, Europe and Asia. We also maintain programs and personnel to hireand train the best available technical professionals in both legacy systems and emerging technologies.We provide extensive combined classroom and on-the-job training to newly-hired technical staff, aswell as additional annual training programs designed to enhance the business practices, tools,technology and consulting skills of our professional staff.
• Initiatives to Remain an Employer of Choice: As a rapidly growing professional services firm, a keyattribute of our continued success is the ability to continually hire, assimilate, motivate and retain thebest talent possible in the industry. We have developed strong relationships with key universitiesaround the world, particularly in India, to provide a continual pipeline of talented staff from top-rankedschools. In addition, we have established an active lateral recruiting program in North America, Europeand India and an on-campus recruiting program in North America. We continue to expand our presenceand brand in our key supply markets, further enhancing our ability to hire experienced professionalsfrom competing IT services firms and industry to support our client needs and growth. We investheavily in training programs, motivational programs and career development to ensure personalprofessional growth for each of our employees.
Further Development of Long-Term Client Relationships. We have strong long-term strategic relationshipswith our clients and business partners. We seek to establish long-term relationships that present recurring revenueopportunities, frequently trying to establish relationships with our clients’ chief information officers, or other ITand business decision makers, by offering a wide array of cost-effective high quality services. Approximately97.1% of our revenues for the year ended December 31, 2014 were derived from clients who had been using ourservices at the end of 2013. We also seek to leverage our experience with a client’s IT systems into new businessopportunities. A successful track record and in-depth knowledge of a client’s processes and IT systems gainedduring the performance of application maintenance services can provide us with a competitive advantage insecuring additional maintenance, development and other projects.
Pursuit of Selective Strategic Acquisitions, Joint Ventures and Strategic Alliances. We believe thatopportunities continue to exist in the fragmented market in which we operate to expand our business throughselective strategic acquisitions, joint ventures and strategic alliances. We believe that acquisition and jointventure candidates may enable us to expand our geographic presence, service offering and capabilities morerapidly. For example, in 2014, we completed several acquisitions which we believe will accelerate our ability toprovide multi-service integrated solutions to the healthcare industry and enhance our overall digital deliverycapabilities. We believe that our fourth quarter acquisition of TriZetto, the largest acquisition in our history,broadens our offerings and creates an opportunity for us to cross-sell our business process, infrastructuremanagement and consulting services to the TriZetto clients where we currently do not have relationships. Moreimportantly, we believe a greater longer term opportunity exists for us to combine TriZetto’s platforms with ourservices and program management capabilities to create end-to-end integrated platform-based solutions that bring
13
together infrastructure, applications, the cloud and business process services. During 2014, we completed threeother acquisitions to strengthen our digital delivery capabilities across several industry groups.
Sales and Marketing
We market and sell our services directly through our professional staff, senior management and direct salespersonnel operating out of our Teaneck, New Jersey global headquarters and our business development officeswhich are strategically located in various metropolitan areas around the world. The sales and marketing groupworks with our client delivery team as the sales process moves closer to the customer’s selection of a servicesprovider. The duration of the sales process varies depending on the type of service, ranging from approximatelytwo months to over one year.
Customers
The number of customers served by us has increased significantly in recent years. As of December 31, 2014,we increased the number of strategic clients to 271. We define a strategic client as one offering the potential togenerate at least $5 million to $50 million or more in annual revenues at maturity. Accordingly, we provide asignificant volume of services to many customers in each of our business segments. Therefore, a loss of asignificant customer or a few significant customers in a particular segment could materially reduce revenues forsuch segment. However, no individual customer exceeded 10.0% of our consolidated revenues for the yearsended December 31, 2014, 2013, and 2012. In addition, the services we provide to our larger customers are oftencritical to the operations of such customers and a termination of our services generally would require an extendedtransition period with gradually declining revenues. For the years ended December 31, 2014, 2013, and 2012,76.8%, 77.6%, and 79.4% of our revenue, respectively, was from North American customers. See Note 15 to ourconsolidated financial statements for additional financial information by geographic area.
For the year ended December 31, 2014, the distribution of our revenues across our business segments was asfollows: 41.8% from Financial Services, 26.2% from Healthcare, 20.4% from Manufacturing/Retail/Logisticsand 11.6% from Other.
We generally provide our services on a time-and-material, fixed price, or per-transaction basis. The volumeof work performed for specific customers is likely to vary from year to year, and a significant customer in oneyear may not use our services in a subsequent year. Presented in the table below is additional information aboutour customers.
Year Ended December 31,
2014 2013 2012
Revenues from top five customers as a percentage of total revenues . . . . . . . . . 12.2% 13.2% 14.0%Revenues from top ten customers as a percentage of total revenues . . . . . . . . . 21.3% 22.6% 25.0%Revenues under fixed-bid contracts as a percentage of total revenues . . . . . . . . 35.5% 34.0% 33.1%
Competition
The intensely competitive IT services and outsourcing market includes a large number of participants and issubject to rapid change. This market includes participants from a variety of market segments, including:
• systems integration firms;
• contract programming companies;
• application software companies;
• traditional large consulting firms;
14
• the professional services groups of computer equipment companies; and
• facilities management and outsourcing companies.
Our direct competitors include, among others, Accenture, Capgemini, Computer Sciences Corporation,Genpact, HCL Technologies, HP Enterprise (formerly Electronic Data Systems), IBM Global Services, InfosysTechnologies, Tata Consultancy Services and Wipro. In addition, we compete with numerous smaller localcompanies in the various geographic markets in which we operate.
Some of our competitors have greater financial, technical and marketing resources and/or greater namerecognition. The principal competitive factors affecting the markets for our services include:
• performance and reliability;
• quality of technical support, training and services;
• responsiveness to customer needs;
• reputation and experience;
• financial stability and strong corporate governance; and
• competitive pricing of services.
We rely on the following to compete effectively:
• a well-developed recruiting, training and retention model;
• a successful service delivery model;
• a broad referral base;
• continual investment in process improvement and knowledge capture;
• investment in infrastructure and research and development;
• financial stability and strong corporate governance;
• continued focus on responsiveness to customer needs, quality of services, competitive prices; and
• project management capabilities and technical expertise.
Intellectual Property
We provide value to our clients based, in part, on our proprietary innovations, methodologies, reusableknowledge capital and other intellectual property assets. We recognize the importance of intellectual propertyand its ability to differentiate us from our competitors. We rely on a combination of intellectual property laws, aswell as confidentiality procedures and contractual provisions, to protect our intellectual property and our brand.We have registered, and applied for the registration of, U.S. and international trademarks, service marks, domainnames, and copyrights. As of December 31, 2014, we have also applied for or obtained a total of 624 trademarkregistrations in 60 countries. In addition, we have applied for or obtained 105 U.S. and international patents andpatent applications and 146 U.S. and international copyright registrations covering certain of our proprietarytechnology assets. Although we believe the ownership of such patents, copyrights, trademarks and service marksis an important factor in our business and that our success does depend in part on the ownership thereof, we relyprimarily on the innovative skills, technical competence and marketing abilities of our personnel.
Employees
We had approximately 211,500 employees at the end of 2014, with approximately 37,800 persons in theNorth American region, approximately 8,100 persons in the European region, and approximately
15
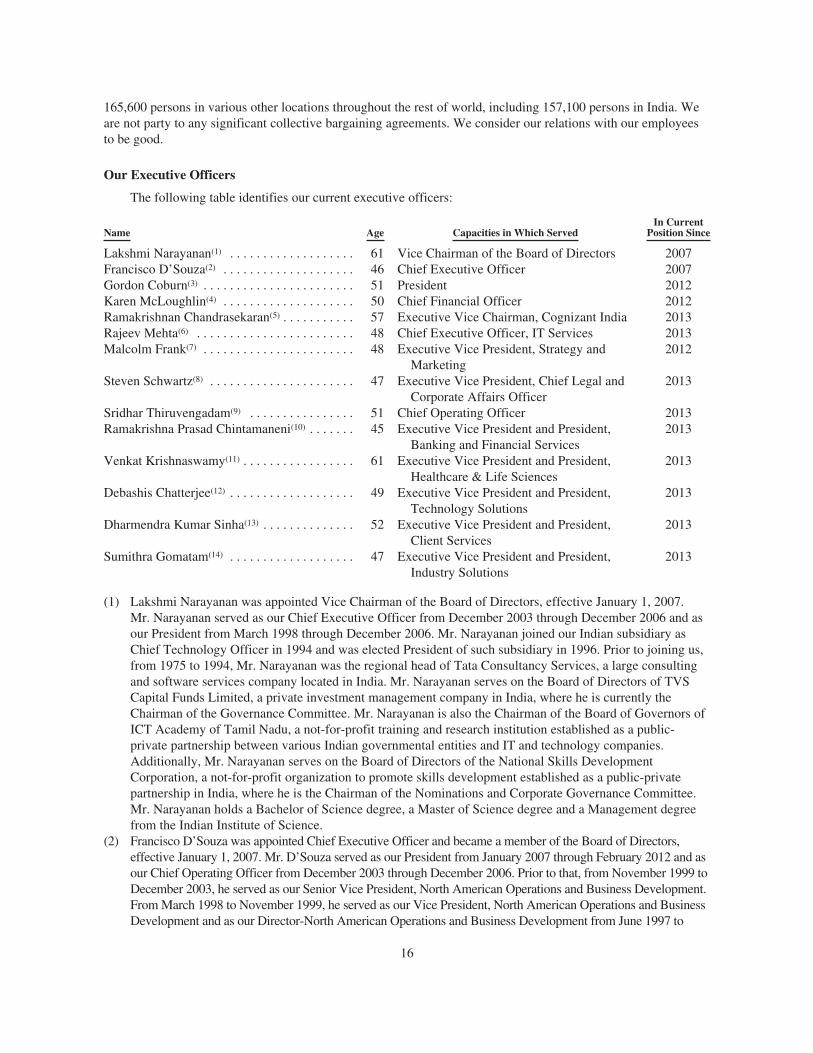
165,600 persons in various other locations throughout the rest of world, including 157,100 persons in India. Weare not party to any significant collective bargaining agreements. We consider our relations with our employeesto be good.
Our Executive Officers
The following table identifies our current executive officers:
Name Age Capacities in Which ServedIn Current
Position Since
Lakshmi Narayanan(1) . . . . . . . . . . . . . . . . . . . 61 Vice Chairman of the Board of Directors 2007Francisco D’Souza(2) . . . . . . . . . . . . . . . . . . . . 46 Chief Executive Officer 2007Gordon Coburn(3) . . . . . . . . . . . . . . . . . . . . . . . 51 President 2012Karen McLoughlin(4) . . . . . . . . . . . . . . . . . . . . 50 Chief Financial Officer 2012Ramakrishnan Chandrasekaran(5) . . . . . . . . . . . 57 Executive Vice Chairman, Cognizant India 2013Rajeev Mehta(6) . . . . . . . . . . . . . . . . . . . . . . . . 48 Chief Executive Officer, IT Services 2013Malcolm Frank(7) . . . . . . . . . . . . . . . . . . . . . . . 48 Executive Vice President, Strategy and
Marketing2012
Steven Schwartz(8) . . . . . . . . . . . . . . . . . . . . . . 47 Executive Vice President, Chief Legal andCorporate Affairs Officer
2013
Sridhar Thiruvengadam(9) . . . . . . . . . . . . . . . . 51 Chief Operating Officer 2013Ramakrishna Prasad Chintamaneni(10) . . . . . . . 45 Executive Vice President and President,
Banking and Financial Services2013
Venkat Krishnaswamy(11) . . . . . . . . . . . . . . . . . 61 Executive Vice President and President,Healthcare & Life Sciences
2013
Debashis Chatterjee(12) . . . . . . . . . . . . . . . . . . . 49 Executive Vice President and President,Technology Solutions
2013
Dharmendra Kumar Sinha(13) . . . . . . . . . . . . . . 52 Executive Vice President and President,Client Services
2013
Sumithra Gomatam(14) . . . . . . . . . . . . . . . . . . . 47 Executive Vice President and President,Industry Solutions
2013
(1) Lakshmi Narayanan was appointed Vice Chairman of the Board of Directors, effective January 1, 2007.Mr. Narayanan served as our Chief Executive Officer from December 2003 through December 2006 and asour President from March 1998 through December 2006. Mr. Narayanan joined our Indian subsidiary asChief Technology Officer in 1994 and was elected President of such subsidiary in 1996. Prior to joining us,from 1975 to 1994, Mr. Narayanan was the regional head of Tata Consultancy Services, a large consultingand software services company located in India. Mr. Narayanan serves on the Board of Directors of TVSCapital Funds Limited, a private investment management company in India, where he is currently theChairman of the Governance Committee. Mr. Narayanan is also the Chairman of the Board of Governors ofICT Academy of Tamil Nadu, a not-for-profit training and research institution established as a public-private partnership between various Indian governmental entities and IT and technology companies.Additionally, Mr. Narayanan serves on the Board of Directors of the National Skills DevelopmentCorporation, a not-for-profit organization to promote skills development established as a public-privatepartnership in India, where he is the Chairman of the Nominations and Corporate Governance Committee.Mr. Narayanan holds a Bachelor of Science degree, a Master of Science degree and a Management degreefrom the Indian Institute of Science.
(2) Francisco D’Souza was appointed Chief Executive Officer and became a member of the Board of Directors,effective January 1, 2007. Mr. D’Souza served as our President from January 2007 through February 2012 and asour Chief Operating Officer from December 2003 through December 2006. Prior to that, from November 1999 toDecember 2003, he served as our Senior Vice President, North American Operations and Business Development.From March 1998 to November 1999, he served as our Vice President, North American Operations and BusinessDevelopment and as our Director-North American Operations and Business Development from June 1997 to
16

March 1998. From January 1996 to June 1997, Mr. D’Souza was engaged as our consultant. From February 1995to December 1995, Mr. D’Souza was employed as Product Manager at Pilot Software. Between 1992 and 1995,Mr. D’Souza held various marketing, business development and technology management positions as aManagement Associate at The Dun & Bradstreet Corporation. While working at The Dun & BradstreetCorporation, Mr. D’Souza was part of the team that established the software development and maintenancebusiness conducted by us. Mr. D’Souza has served on the Board of Directors of General Electric Company since2013, where he is currently a member of the Audit Committee and the Science and Technology Committee.Mr. D’Souza also serves on the Board of Trustees of Carnegie Mellon University, as Co-Chairman of the Boardof Trustees of The New York Hall of Science and on the Board of Directors of the U.S.-India Business Council,and is a member of the Business Roundtable. Mr. D’Souza holds a Bachelor of Business Administration degreefrom the University of Macau (formerly known as the University of East Asia) and a Master of BusinessAdministration degree from Carnegie Mellon University.
(3) Gordon Coburn was appointed President of the Company, effective February 6, 2012. From March 1998until February 6, 2012, Mr. Coburn served as the Company’s Chief Financial Officer and Treasurer andfrom January 2007 until February 2012, Mr. Coburn also held the position of Chief Operating Officer.Mr. Coburn also served as the Company’s Executive Vice President from December 2003 throughDecember 2006. From November 1999 to December 2003, he served as our Senior Vice President. Hepreviously was our Vice President from 1996 to November 1999. Mr. Coburn served as Senior Director-Group Finance and Operations for Cognizant Corporation from November 1996 to December 1997. From1990 to October 1996, Mr. Coburn held key financial positions with The Dun & Bradstreet Corporation.Mr. Coburn serves on the Board of Directors of The Corporate Executive Board Company. He also servedon the Board of Directors of ICT Group, Inc. until its acquisition on February 2, 2010. Mr. Coburn holds aBachelor of Arts degree from Wesleyan University and a Master of Business Administration degree fromthe Amos Tuck School at Dartmouth College, where he serves as a member of its MBA Advisory Board.
(4) Karen McLoughlin was appointed Chief Financial Officer of the Company, effective February 6, 2012. Shepreviously served as the Company’s Senior Vice President of Finance and Enterprise Transformation, a roleshe held since January 2010. In such role, Ms. McLoughlin was responsible for the Company’s worldwidefinancial planning and analysis, enterprise risk management and enterprise transformation functions,including the facilitation and execution of various internal reengineering and transformation initiativesdesigned to enable the Company’s strategic vision. From August 2008 to January 2010, Ms. McLoughlinserved as the Company’s Senior Vice President of Finance, responsible for overseeing the Company’sglobal financial planning and analysis team and enterprise risk management, and from October 2003 untilAugust 2008, Ms. McLoughlin served as the Company’s Vice President of Global Financial Planning andAnalysis. Prior to joining Cognizant in October 2003, Ms. McLoughlin held various financial managementpositions at Spherion Corporation from August 1997 to October 2003 and at Ryder System Inc. from July1994 to August 1997. Prior to joining Ryder, she spent six years in the South Florida Practice of PriceWaterhouse (now PricewaterhouseCoopers). Ms. McLoughlin has a Bachelor of Arts degree in Economicsfrom Wellesley College and a Master of Business Administration degree from Columbia University.
(5) Ramakrishnan Chandrasekaran was appointed Executive Vice Chairman, Cognizant India, effectiveDecember 4, 2013. In this role, Mr. Chandrasekaran focuses on strengthening our strong relationship withindustry bodies, driving strategic initiatives that strengthen outreach to the government, and furtherenhancing our brand equity through public relations in India. From February 2012 to December 2013,Mr. Chandrasekaran served as Group Chief Executive-Technology and Operations. In this role,Mr. Chandrasekaran was responsible for leading our solutions and delivery teams world-wide. FromAugust 2006 to February 2012, he served as our President and Managing Director, Global Delivery,responsible for leading our global delivery organization, spearheading new solutions, and championingprocess improvements. Mr. Chandrasekaran served as our Executive Vice President and Managing Directorfrom January 2004 through July 2006. Prior to that, from November 1999 to January 2004, he served as ourSenior Vice President responsible for Independent Software Vendor relationships, key alliances, capacitygrowth, process initiatives, business development and offshore delivery. Mr. Chandrasekaran joined us asAssistant Vice President in December 1994, before being promoted to Vice President in January 1997. Priorto joining us, Mr. Chandrasekaran worked with Tata Consultancy Services. Mr. Chandrasekaran holds a
17
Mechanical Engineering degree and Master of Business Administration degree from the Indian Institute ofManagement.
(6) Rajeev Mehta was appointed Chief Executive Officer, IT Services, effective December 4, 2013. In this role,Mr. Mehta is responsible for market facing activities across the Company as well as for delivery across ourIT Services business. From February 2012 to December 2013, Mr. Mehta served as Group Chief Executive-Industries and Markets. In this role, Mr. Mehta was responsible for leading our industry vertical andgeographic market operations on a global basis. From August 2006 to February 2012, he served as our ChiefOperating Officer, Global Client Services, responsible for our sales, business development and clientrelationship management organizations. Mr. Mehta served as Senior Vice President and General Manager ofour Financial Services business segment from June 2005 to August 2006. From November 2001 toJune 2005, he served as our Vice President and General Manager of our Financial Services businesssegment. From January 1998 to November 2001, Mr. Mehta served as our Director of the U.S. CentralRegion. Mr. Mehta served as our Senior Manager of Business Development from January 1997 toJanuary 1998. Prior to joining Cognizant in 1997, Mr. Mehta was involved in implementing GE InformationServices offshore outsourcing program and also held consulting positions at Deloitte & Touche andAndersen Consulting. Mr. Mehta holds a Bachelor of Science degree from the University of Maryland and aMaster of Business Administration degree from Carnegie Mellon University.
(7) Malcolm Frank was appointed Executive Vice President, Strategy and Marketing, effective February 6, 2012.Mr. Frank served as our Senior Vice President of Strategy and Marketing from August 2005 to February 2012.In both these roles, Mr. Frank’s responsibilities have included, and continue to include, directing all aspects ofour corporate marketing function, including strategy and branding, industry and media relations, corporatecommunications and corporate marketing. From August 2005 until June 2009, Mr. Frank was also responsiblefor leading our field marketing function. Prior to joining Cognizant in August 2005, Mr. Frank was co-founder,President and Chief Executive Officer of CXO Systems, Inc., an independent software vendor providingdashboard solutions for senior managers, from March 2002 to July 2005. From June 1999 to September 2002,Mr. Frank was the founder, President, Chief Executive Officer and Chairman of Nervewire Inc. (“Nervewire”),a management consulting and systems integration firm. Prior to founding Nervewire, Mr. Frank was aco-founder, executive officer, and Senior Vice President at Cambridge Technology Partners, where he ranWorldwide Marketing, Business Development, and several business units, from January 1990 to June 1999.Mr. Frank graduated from Yale University with a degree in Economics.
(8) Steven Schwartz was appointed Executive Vice President, Chief Legal and Corporate Affairs Officer onDecember 4, 2013. In this role, Mr. Schwartz is responsible for our global legal teams, our global governmentaffairs efforts and our global security team. From July 2007 to December 2013, Mr. Schwartz served as SeniorVice President, General Counsel and Secretary, having global responsibility for managing Cognizant’s legalfunction. Mr. Schwartz, who joined Cognizant in 2001, previously served as Vice President and GeneralCounsel, a position he held from March 2003 to July 2007. From April 2002 to March 2003, he served as ourVice President and Chief Corporate Counsel. From October 2001 to December 2002, he served as our ChiefCorporate Counsel. Mr. Schwartz serves on the Board of Directors of Information Technology IndustryCouncil and Citizen Schools. Mr. Schwartz holds a Bachelor of Business Administration degree from theUniversity of Miami, a Juris Doctor degree from Fordham University School of Law and a Master of Law (inTaxation) degree from the New York University School of Law.
(9) Sridhar Thiruvengadam was appointed Chief Operating Officer of the Company, effective May 8, 2013.Previously, from January 2012 to May 2013, Mr. Thiruvengadam served as an Executive Vice President ofthe Company, leading the global delivery operations for several of the Company’s industry verticals, andhead of the Company’s BPS practice. From January 2010 to January 2012, Mr. Thiruvengadam served as aSenior Vice President and global head of BPS, infrastructure and testing services. From April 2007 toJanuary 2010, Mr. Thiruvengadam served as the Company’s Chief People Officer in charge of talentacquisition, management, training and staffing. From March 2001 to March 2007, Mr. Thiruvengadam heldseveral positions in the Company’s banking, financial services, healthcare and insurance practices, includingVice President and head of the Company’s insurance industry vertical. Mr. Thiruvengadam joined theCompany as a project manager in November 1994. Mr. Thiruvengadam holds a M.Tech degree from theIndian Institute of Technology, Madras.
18

(10) Ramakrishna Prasad Chintamaneni was appointed Executive Vice President and President, Banking andFinancial Services (BFS), effective December 4, 2013. In this role, Mr. Chintamaneni is responsible forleading the BFS practice. From 2011 to December 2013, Mr. Chintamaneni served as our Global Head ofBFS Practice and was responsible for the practice’s sales, business development, consulting, clientrelationships, management and delivery, and global profit and loss. Previously, from 2010 to 2011,Mr. Chintamaneni served as our Global Head of Markets for the BFS Practice. From 2006 to 2009, heserved as our Head of BFS Practice for North America. From 1999 through 2006, Mr. Chintamaneni servedas our Client Partner, managing the relationships with several of our key BFS clients, and also led our U.S.Eastern Region’s BFS Practice. Prior to joining Cognizant in 1999, Mr. Chintamaneni spent seven years inthe investment banking and financial services industry, including working at Merrill Lynch and its affiliatesfor five years as an Investment Banker and a member of Merrill’s business strategy committee in India.Mr. Chintamaneni serves on the Board of Directors of NPower, a nonprofit that helps nonprofits, schoolsand individuals build technology skills by harnessing the power of the technology community.Mr. Chintamaneni obtained his Bachelor of Technology degree in Chemical Engineering from the IndianInstitute of Technology, Kanpur and a Postgraduate Diploma in Business Management from XLRI Schoolof Management in India.
(11) Venkat Krishnaswamy was appointed President, Healthcare & Life Sciences, effective December 4, 2013.In this role, Mr. Krishnaswamy is focused on delivering solutions and services to the healthcare industry.From February 2012 to December 2013, Mr. Krishnaswamy served as Executive Vice President ofHealthcare and Life Sciences. From April 2007 to February 2012, Mr. Krishnaswamy served as Senior VicePresident and General Manager of Healthcare and Life Sciences. Mr. Krishnaswamy served as VicePresident—Projects from January 2003 to April 2007 and as Director of Projects from April 1999 toJanuary 2003. Upon joining Cognizant in 1997, Mr. Krishnaswamy served as Senior Manager untilApril 1999. Between 1997 and 2003, Mr. Krishnaswamy served in our BFS Practice. Prior to joiningCognizant in 1997, Mr. Krishnaswamy spent over ten years in retail and commercial banking with ColonialState Bank (now Commonwealth Bank of Australia). Mr. Krishnaswamy holds a Bachelor of Engineeringdegree from the University of Madras and a Masters degree in Electrical Engineering from the IndianInstitute of Technology New Delhi.
(12) Debashis Chatterjee was appointed Executive Vice President and President, Technology Solutions, effectiveDecember 4, 2013. In this role, Mr. Chatterjee has responsibility for all of our horizontal practices within ITServices and is responsible for implementing best practices in service delivery and creating solutions acrossour horizontal practices. From May 2013 until his current appointment, Mr. Chatterjee served as SeniorVice President and Global Head, Technology and Information Services. From March 2012 to April 2013, hewas Senior Vice President, Transformational Services. Previously, from April 2011 to January 2012,Mr. Chatterjee served as Vice President and Sectors Leader, Global Business Services, Global Delivery atIBM, a multinational technology and consulting company. From January 2010 to March 2011,Mr. Chatterjee was Senior Vice President and Global Head of Cognizant’s BFS Practice, from April 2007 toDecember 2009, he was Senior Vice President and Global Delivery Head of BFS, and from April 2004 toMarch 2007, he was Vice President and Global Delivery Head of BFS. Prior to that, Mr. Chatterjee heldvarious key management roles at Cognizant since joining us in 1996. Mr. Chatterjee has a Bachelor ofEngineering in Mechanical Engineering from Jadavpur University in India.
(13) Dharmendra Kumar Sinha was appointed Executive Vice President and President, Client Services, effectiveDecember 4, 2013. In this role, Mr. Sinha leads our global sales, field marketing and intermediary relationsteams. He is also responsible for our strategic partnerships and alliances organization. From 2007 toDecember 2013, Mr. Sinha served as Senior Vice President and General Manager, Global Sales and FieldMarketing. From 2004 to 2007, Mr. Sinha served as our Vice President, responsible for our Manufacturing,Logistics, Retail, Hospitality, and Technology verticals. In addition, he assumed the role of Head of Salesand managed our Field Marketing function. From January 2008 to December 2008, Mr. Sinha additionallymanaged the Insurance business unit. Prior to that, from 1998 to 2004, Mr. Sinha served as Director andsubsequently as Vice President of the U.S. Western Region. From 1997 to 1998, Mr. Sinha served in variousoperational and business development positions. Prior to joining Cognizant in 1997, Mr. Sinha worked withTata Consultancy Services and CMC Limited, an end-to-end IT solutions provider. Mr. Sinha has a
19
Bachelor of Science Degree from Patna Science college, Patna and a Master’s Degree in BusinessAdministration from Birla Institute of Technology, Mesra.
(14) Sumithra Gomatam was appointed Executive Vice President and President, Industry Solutions, effectiveDecember 04, 2013. In this role, Ms. Gomatam oversees global delivery for all of our industry verticals and isresponsible for implementing best practices in services delivery and for creating solutions across our industrypractices. Ms. Gomatam also leads our Communications and High Technology business units. EffectiveFebruary 02, 2015, Ms. Gomatam’s role has been expanded to oversee global delivery for our BPS unit. FromJuly 2008 to December 2013, Ms. Gomatam served as Senior Vice President, Projects. In this role, Ms. Gomatamserved initially as our Global Delivery Head and then as Global Practice Leader for our testing practice. FromMarch 2006 to July 2008, Ms. Gomatam served as Vice President, Projects, leading global delivery and buildingout the testing practice. From 2001 to March 2006, Ms. Gomatam served as an Account Relationship Managerand as part of our Core Delivery Leadership Team in our BFS Practice. From 1995, when Ms. Gomatam joinedus, until 2001, she held various key positions within The Dun & Bradstreet Corporation and Cognizant, includingserving our BFS clients on application development and application maintenance projects. Ms. Gomatamreceived her B.E. in Electronics and Communication from Anna University.
None of our executive officers are related to any other executive officer or to any of our Directors. Ourexecutive officers are elected annually by the Board of Directors and serve until their successors are duly electedand qualified.
Corporate History
We began our IT development and maintenance services business in early 1994, as an in-house technologydevelopment center for The Dun & Bradstreet Corporation and its operating units. In 1996, we, along withcertain other entities, were spun-off from The Dun & Bradstreet Corporation to form a new company, CognizantCorporation. On June 24, 1998, we completed an initial public offering of our Class A common stock. OnJune 30, 1998, a majority interest in us, and certain other entities were spun-off from Cognizant Corporation toform IMS Health. Subsequently, Cognizant Corporation was renamed Nielsen Media Research, Incorporated.
On January 30, 2003, we filed a tender offer in which IMS Health stockholders could exchange IMS Healthshares held by them for our Class B common stock held by IMS Health. On February 13, 2003, IMS Healthdistributed all of our Class B common stock that IMS Health owned in an exchange offer to its stockholders. OnFebruary 21, 2003, pursuant to the terms of our Restated Certificate of Incorporation, all of the shares of Class Bcommon stock automatically converted into shares of Class A common stock. Since February 21, 2003, therehave been no outstanding shares of Class B common stock. Effective May 26, 2004, pursuant to our Certificateof Incorporation, there are no authorized shares of Class B common stock.
Available Information
We make available the following public filings with the Securities and Exchange Commission, or the SEC,free of charge through our website at www.cognizant.com as soon as reasonably practicable after weelectronically file such material with, or furnish such material to, the SEC:
• our Annual Reports on Form 10-K and any amendments thereto;
• our Quarterly Reports on Form 10-Q and any amendments thereto; and
• our Current Reports on Form 8-K and any amendments thereto.
In addition, we make available our code of business conduct and ethics entitled “Cognizant’s Core Valuesand Standards of Business Conduct” free of charge through our website. We intend to disclose any amendmentsto, or waivers from, our code of business conduct and ethics that are required to be publicly disclosed pursuant torules of the SEC and the NASDAQ Global Select Market by posting it on our website.
No information on our website is incorporated by reference into this Form 10-K or any other public filingmade by us with the SEC.
20
Item 1A. Risk Factors
Factors That May Affect Future Results
We face various important risks and uncertainties, including those described below, that could adverselyaffect our business, results of operations and financial condition and, as a result, cause a decline in thetrading price of our common stock.
Risks Relating to our Business
We face intense competition from other service providers.
We operate in intensely competitive industries that experience rapid technological developments, changes inindustry standards, and changes in customer requirements. The intensely competitive information technology,consulting and business process services markets include a large number of participants and are subject to rapidchange. These markets include participants from a variety of market segments, including:
• systems integration firms;
• contract programming companies;
• application software companies;
• internet solutions providers;
• large or traditional consulting companies;
• professional services groups of computer equipment companies; and
• infrastructure management and outsourcing companies.
These markets also include numerous smaller local competitors in the various geographic markets in whichwe operate which may be able to provide services and solutions at lower costs or on terms more attractive toclients than we can. Our direct competitors include, among others, Accenture, Capgemini, Computer SciencesCorporation, Genpact, HCL Technologies, HP Enterprise (formerly Electronic Data Systems), IBM GlobalServices, Infosys Technologies, Tata Consultancy Services and Wipro. In certain markets, our competitors mayhave greater financial, technical and marketing resources and greater name recognition and, therefore, may bebetter able to compete for new work and skilled professionals. There is a risk that increased competition couldput downward pressure on the prices we can charge for our services and, in turn, our operating margins.Similarly, if our competitors develop and implement processes and methodologies that yield greater efficiencyand productivity, they may be able to offer services similar to ours at lower prices without adversely affectingtheir profit margins. If we are unable to provide our clients with superior services and solutions at competitiveprices or successfully market those services to current and prospective clients, our business, results of operationsand financial condition may suffer.
Our international expansion plans may not be successful if we are unable to compete effectively in othercountries. We may face competition in other countries from companies that may have more experience withoperations in such countries or with international operations. Additionally, such companies may have long-standing or well-established relationships with desired clients, which may put us at a competitive disadvantage. Ifwe fail to compete effectively in the new markets we enter, our ability to continue to grow our business could beadversely affected. In addition, if we cannot compete effectively, we may be required to reconsider our strategyto expand internationally as well as our intent not to repatriate our non-U.S. earnings.
We may also face competition from companies that increase in size or scope as the result of strategicmergers or acquisitions. These transactions may include consolidation activity among hardware manufacturers,software companies and vendors, and service providers, which could result in the convergence of products andservices. If buyers of products and services in the markets we serve favor using a single provider of integratedproducts and services, such buyers may direct more business to such providers, which could have a variety of
21
negative effects on our competitive position and, in turn, adversely affect our business, results of operations andfinancial condition.
Our operating margin may decline and we may not be able to sustain our current level ofprofitability.
Our operating margin may decline if we experience declines in demand and pricing for our services, anincrease in our operating costs, including imposition of new non-income related taxes, or adverse fluctuations inforeign currency exchange rates. In addition, wages in India have historically increased at a faster rate than in theUnited States, which has in the past and may in the future put pressure on our operating margins due to ouroffshore delivery model. Additionally, the number and type of equity-based compensation awards and theassumptions used in valuing equity-based compensation awards may change resulting in increased stock-basedcompensation expense and lower margins.
Further, our operating margin, and therefore our profitability, is dependent on the rates we are able torecover for our services. If we are not able to maintain favorable pricing for our services, our operating marginand our profitability could suffer. The rates we are able to recover for our services are affected by a number offactors, including:
• our clients’ perceptions of our ability to add value through our services;
• introduction of new services or products by us or our competitors;
• our competitors’ pricing policies;
• our ability to accurately estimate, attain and sustain contract revenues, margins and cash flows overincreasingly longer contract periods;
• bid practices of clients and their use of third-party advisors;
• the use by our competitors and our clients of offshore resources to provide lower-cost service deliverycapabilities;
• our ability to charge premium prices when justified by market demand or the type of service; and
• general economic and political conditions.
In addition, if we are not able to maintain an appropriate utilization rate for our professionals, ourprofitability may suffer. Our utilization rates are affected by a number of factors, including:
• our ability to efficiently transition employees from completed projects to new assignments;
• our ability to hire and assimilate new employees;
• our ability to accurately forecast demand for our services and thereby maintain an appropriateheadcount in each of our geographies and workforces;
• our ability to effectively manage attrition; and
• our need to devote time and resources to training, professional development and other non-chargeableactivities.
If we are unable to control our costs and operate our business in an efficient manner, our operating margin,and therefore our profitability, may decline.
We could be held liable for damages or our reputation could suffer from security breaches ordisclosure of confidential information or personal data.
We are dependent on information technology networks and systems to process, transmit and securely storeelectronic information and to communicate among our locations around the world and with our clients. Security
22
breaches of this infrastructure could lead to shutdowns or disruptions of our systems and potential unauthorizeddisclosure of confidential information or data, including personal data. In addition, many of our engagementsinvolve projects that are critical to the operations of our customers’ businesses. The theft and/or unauthorized useor publication of our, or our clients’, confidential information or other proprietary business information as aresult of such an incident could adversely affect our competitive position and reduce marketplace acceptance ofour services. Any failure in the networks or computer systems used by us or our customers could result in a claimfor substantial damages against us and significant reputational harm, regardless of our responsibility for thefailure.
In addition, we often have access to or are required to manage, utilize, collect and store sensitive orconfidential client or employee data, including personal data. As a result, we are subject to numerous U.S. andnon-U.S. laws and regulations designed to protect this information, such as the European Union Directive onData Protection and various U.S. federal and state laws governing the protection of personal data. If any person,including any of our employees, negligently disregards or intentionally breaches controls or procedures withwhich we are responsible for complying with respect to such data or otherwise mismanages or misappropriatesthat data, or if unauthorized access to or disclosure of data in our possession or control occurs, we could besubject to liability and penalties in connection with any violation of applicable privacy laws and/or criminalprosecution, as well as significant liability to our clients or our clients’ customers for breaching contractualconfidentiality and security provisions or privacy laws. These risks will increase as we continue to grow ourcloud-based offerings and services and store and process increasingly large amounts of our customers’confidential information and data and host or manage parts of our customers’ businesses, especially in industriesinvolving particularly sensitive data such as the financial services industry and the healthcare industry.Unauthorized disclosure of sensitive or confidential client or employee data, including personal data, whetherthrough breach of computer systems, systems failure, employee negligence, fraud or misappropriation, orotherwise, could damage our reputation and cause us to lose clients. Similarly, unauthorized access to or throughour information systems and networks or those we develop or manage for our clients, whether by our employeesor third parties, could result in negative publicity, legal liability and damage to our reputation, which could inturn have a material adverse affect on our business, results of operations and financial condition.
Healthcare-related data protection, privacy and similar laws restrict access, use, and disclosure ofinformation, and failure to comply with or adapt to changes in these laws could materially adversely affectour business, results of operations and financial condition.
As a service provider in the healthcare industry, we are subject to data privacy and security regulation byboth the federal government and the states in which we conduct our business, including the Health InsurancePortability and Accountability Act of 1996, or HIPAA, and the Health Information Technology for Economicand Clinical Health Act, or HITECH, which are federal laws that apply to firms that provide services to certainentities in the healthcare industry.
A portion of the data that we obtain and handle for or on behalf of our healthcare clients is subject toHIPAA, and we are required to maintain the privacy and security of individually identifiable health informationin accordance with HIPAA and the terms of our agreements with clients. HITECH increased the civil andcriminal penalties that may be imposed against us, and gave state attorneys general new authority to file civilactions for damages or injunctions in federal court to enforce HIPAA’s requirements. We have incurred, and willcontinue to incur, significant costs to establish and maintain HIPAA-required safeguards and, if additionalsafeguards are required to comply with HIPAA or our healthcare clients’ requirements, our costs could increasefurther, which would negatively affect our results of operations. Furthermore, if we fail to maintain adequatesafeguards, or we inappropriately use or disclose individually identifiable health information, we could be subjectto significant liabilities and consequences, including, without limitation:
• breach of our contractual obligations to our healthcare clients, which may cause these clients toterminate their relationship with us and may result in potentially significant financial obligations tothem;
23
• investigation by the federal regulatory authorities empowered to enforce HIPAA and by the stateattorneys general empowered to enforce comparable state laws, and the possible imposition of civil andcriminal penalties;
• private litigation by individuals adversely affected by any violation of HIPAA, HITECH or comparablestate laws to which we are subject; and
• negative publicity, which may decrease the willingness of current and potential future clients in thehealthcare industry to work with us.
Laws and expectations relating to privacy, security and data protection continue to evolve, and we continueto adapt to changing needs. Nevertheless, changes in these laws may limit our data access, use, and disclosure,and may require increased expenditures by us or may dictate that we not offer certain types of services. Any ofthe foregoing may have a material adverse effect on our ability to provide services to our healthcare clients and,in turn, on our business, results of operations and financial condition.
Our revenues and operating results may experience significant quarterly fluctuations.
We may experience significant quarterly fluctuations in our revenues and results of operations. Among thefactors that could cause these variations are:
• the nature, number, timing, scope and contractual terms of the projects in which we are engaged;
• delays incurred in the performance of those projects;
• the accuracy of estimates of resources and time required to complete ongoing projects;
• changes to the financial condition of our clients;
• changes in pricing in response to customer demand and competitive pressures;
• longer sales cycles and ramp-up periods for our larger, more complex projects;
• volatility and seasonality of our software sales;
• the mix of on-site and offshore staffing;
• the ratio of fixed-price contracts versus time-and-materials contracts;
• employee wage levels and utilization rates;
• changes in foreign exchange rates, including the Indian rupee versus the U.S. dollar;
• the timing of collection of accounts receivable;
• enactment of new taxes;
• changes in domestic and international income tax rates and regulations;
• changes to levels and types of stock-based compensation awards and assumptions used to determinethe fair value of such awards; and
• general economic conditions.
As a result of these factors, it is possible that in some future periods, our revenues and results of operationsmay be significantly below the expectations of public market analysts and investors. In such an event, the priceof our common stock would likely be materially and adversely affected.
We rely on a few customers for a large portion of our revenues.
Our top five and top ten customers generated approximately 12.2% and 21.3%, respectively, of our revenuesfor the year ended December 31, 2014. The volume of work performed for specific customers is likely to vary
24
from year to year, and a major customer in one year may not use our services in a subsequent year. The loss ofone of our large customers could have a material adverse effect on our business, results of operations andfinancial condition.
Our business, results of operations and financial condition will suffer if we fail to enhance our existingservices and solutions and develop new services and solutions that allow us to keep pace with rapidlyevolving technological developments.
The information technology, consulting and business process services markets are characterized by rapidtechnological change, evolving industry standards, changing customer preferences and new product and serviceintroductions. Our future success will depend on our ability to develop services and solutions that keep pace withchanges in the markets in which we operate. We cannot be sure that we will be successful in developing newservices and solutions addressing evolving technologies in a timely or cost-effective manner or that any servicesand solutions we do develop will be successful in the marketplace. Our failure to address the demands of therapidly evolving technological environment could have a material adverse effect on our ability to retain andattract clients and our competitive position, which could in turn have a material adverse effect on our business,results of operations and financial condition.
Our business, results of operations and financial condition may be affected by the rate of growth inthe use of technology in business and the type and level of technology spending by our clients.
Our business depends, in part, upon continued growth in the use of technology in business by our clients andprospective clients as well as their customers and suppliers. In challenging economic environments, our clientsmay reduce or defer their spending on new technologies in order to focus on other priorities, or may choose touse their own internal resources rather than engage an outside firm to perform the types of services and solutionswe provide. In addition, many companies have already invested substantial resources in their current means ofconducting commerce and exchanging information, and they may be reluctant or slow to adopt new approachesthat could disrupt existing personnel, processes and infrastructures. If the growth of technology usage inbusiness, or our clients’ spending on technology in business, declines, or if we cannot convince our clients orpotential clients to embrace new technological solutions, our business, results of operations and financialcondition could be adversely affected.
Most of our contracts with our customers are short-term, and our business, results of operations andfinancial condition could be adversely affected if our clients terminate their contracts on short notice.
Consistent with industry practice, most of our contracts with our customers are short-term. A majority of ourcontracts can be terminated by our clients with short notice and without significant early termination cost.Terminations may result from factors that are beyond our control and unrelated to our work product or theprogress of the project, including the business or financial condition of a client, changes in ownership,management or the strategy of a client or economic or market conditions generally or specific to a client’sindustry. When contracts are terminated, we lose the anticipated revenues and might not be able to eliminate ourassociated costs in a timely manner. Consequently, our operating margins in subsequent periods could be lowerthan expected. If we are unable to replace the lost revenue with other work on terms we find acceptable oreffectively eliminate costs, our business, results of operations and financial condition could be adverselyaffected.
If our pricing structures are based on inaccurate expectations and assumptions regarding the cost andcomplexity of performing our work, then our contracts could be unprofitable.
We negotiate pricing terms with our clients utilizing a range of pricing structures and conditions. Wepredominantly contract to provide services either on a time-and-materials basis or on a fixed-price basis. Fixed-price contracts accounted for approximately 35.5% of our revenues for the 12 months ended December 31, 2014,
25
and we expect that an increasing number of our future projects will be contracted on a fixed-price basis. Ourpricing is highly dependent on our internal forecasts and predictions about our projects and the marketplace,which might be based on limited data and could turn out to be inaccurate. We face a number of risks whenpricing our contracts, as many of our projects entail the coordination of operations and workforces in multiplelocations and utilizing workforces with different skill sets and competencies across geographically diverseservice locations. Our pricing, cost and operating margin estimates for the work that we perform frequentlyinclude anticipated long-term cost savings from transformational and other initiatives that we expect to achieveand sustain over the life of the contract. There is a risk that we will underprice our projects, fail to accuratelyestimate the costs of performing the work or fail to accurately assess the risks associated with potential contracts.In particular, any increased or unexpected costs, delays, failures to achieve anticipated cost savings, orunexpected risks we encounter in connection with the performance of this work, including those caused byfactors outside our control, could make these contracts less profitable or unprofitable, which could have anadverse effect on our business, results of operations and financial condition.
If we fail to maintain appropriate internal controls in the future, we may not be able to report ourfinancial results accurately, which may adversely affect our stock price and our business.
Section 404 of the Sarbanes-Oxley Act of 2002 and the related regulations require our management to reporton, and our independent registered public accounting firm to attest to, the effectiveness of our internal controlover financial reporting. We have committed and will be required to continue to commit significant financial andmanagerial resources in order to comply with these requirements.
Further, we are required to integrate TriZetto and other acquired businesses into our system of disclosurecontrols and procedures and internal control over financial reporting. As may be the case with other companieswe acquire, prior to being acquired by us, TriZetto was not required to implement or maintain the disclosurecontrols and procedures or internal control over financial reporting that are required of public companies, and wecannot provide assurance as to how long the integration process may take.
Internal control over financial reporting has inherent limitations, including human error, the possibility thatcontrols could be circumvented or become inadequate because of changed conditions, and fraud. If we are unableto maintain effective internal controls, we may not have adequate, accurate or timely financial information, andwe may be unable to meet our reporting obligations as a publicly traded company or comply with therequirements of the SEC or the Sarbanes-Oxley Act of 2002. This could result in a restatement of our financialstatements, the imposition of sanctions, or investigation by regulatory authorities, and could cause investors tolose confidence in our reported financial information. Any such consequence or other negative effect of ourinability to meet our reporting requirements or comply with legal and regulatory requirements, as well as anydisclosure of an accounting, reporting or control issue, could adversely affect the trading price of our commonstock and our business.
We may not be able to successfully acquire target companies or integrate acquired companies ortechnologies into our company, and we may become subject to certain liabilities assumed or incurred inconnection with our acquisitions that could harm our business, results of operations and financialcondition.
If we are unable to complete the number and kind of acquisitions for which we plan, or if we are inefficientor unsuccessful at integrating any acquired businesses, including TriZetto, into our operations, we may not beable to achieve our planned rates of growth or improve our market share, profitability or competitive position inspecific markets or services. The process of integrating an acquired company, business, or technology hascreated, and will continue to create, operating difficulties. The risks we face include:
• Diversion of management time and focus from operating our core business to acquisition integrationchallenges;
26
• Failure to successfully integrate the acquired business into our operations, including cultural challengesassociated with integrating and retaining employees; and
• Failure to achieve anticipated efficiencies and/or benefits, realize our strategic objectives or furtherdevelop the acquired business.
Although we conduct due diligence in connection with each of our acquisitions, there may be liabilities thatwe fail to discover, that we inadequately assess or that are not properly disclosed to us. In particular, to the extentthat any acquired business (or any assets thereof) (i) failed to comply with or otherwise violated applicable lawsor regulations, (ii) failed to fulfill contractual obligations to customers or (iii) incurred material liabilities orobligations to customers that are not identified during the diligence process, we, as the successor owner, may befinancially responsible for these violations, failures and liabilities and may suffer financial and/or reputationalharm or otherwise be adversely affected. In addition, as part of an acquisition, we may assume responsibilitiesand obligations of the acquired business pursuant to the terms and conditions of agreements entered by theacquired entity that are not consistent with the terms and conditions that we typically accept and require. We alsohave been and may in the future be subject to litigation or other claims in connection with an acquired company,including claims from terminated employees, customers, former stockholders, or other third parties. Any materialliabilities associated with our acquisitions could harm our business, results of operations and financial condition.
We cannot predict or guarantee that we will successfully identify suitable acquisition candidates,consummate any acquisition or integrate any acquired business. Any failure to do so could have an adverseimpact on our business, results of operations and financial condition.
System failure or disruptions in our communications or information technology could negativelyimpact our operations and ability to provide our services and solutions, which would have an adverseeffect on our business, results of operations and financial condition.
To deliver our services and solutions to our customers, we must maintain a high speed network of satellite,fiber optic and land lines and active voice and data communications 24 hours a day between our main operatingoffices in India, our other development and delivery centers and the offices of our customers worldwide. Anysystems failure or a significant lapse in our ability to transmit voice and data through satellite and telephonecommunications could result in curtailed operations and a loss of customers, which would have an adverse effecton our business, results of operations and financial condition.
Our business, results of operations and financial condition could be impaired if we lose key membersof our management team.
Our future performance depends upon the continued service of the key members of our management team.Competition for experienced executive officers and other key employees in the industries in which we compete isintense, and there can be no assurance that we will be able to retain key persons, or that we will be successful inattracting and retaining replacements in the future. The loss of any one or more of our executive officers orsignificant employees, or the failure to attract, integrate and retain additional talent, could have a materialadverse effect on our business, results of operations and financial condition. We do not maintain key man lifeinsurance on any of our executive officers or significant employees.
In addition, our business could be harmed if any key member of our management team leaves ouremployment and joins one of our competitors. Currently we have entered into non-competition agreements withthe majority of our executive officers. We cannot be certain, however, that the restrictions in these agreementsprohibiting such executive officers from engaging in competitive activities are enforceable. Any defection by akey member of our management team could have a material adverse effect on our business, results of operationsand financial condition.
27

Competition for highly-skilled technical personnel is intense, and our ability to compete for andmanage client engagements depends on our ability to attract and retain such personnel.
Our ability to maintain and renew existing client engagements and obtain new business depends to asignificant extent on our ability to attract, train and retain highly-skilled technical personnel so as to keep oursupply of skills and resources in balance with client demand. In particular, in order to serve client needs andgrow our business, we must attract, train and retain appropriate numbers of talented people, including projectmanagers, IT engineers and other senior technical personnel, who are able to keep pace with continuing changesin information technology, evolving industry standards and changing customer preferences. We cannot guaranteethat we will be able to train and assimilate new employees successfully. In addition, we believe there is ashortage of, and significant competition for, professionals with the advanced technological skills necessary toperform the services we offer. We have subcontracted in the past, and may continue to subcontract in the future,with other service providers in order to meet our obligations to our customers. If we are unable to attract andretain highly-skilled technical personnel, our ability to effectively lead our current projects and develop newbusiness could be jeopardized, and our business, results of operations and financial condition could be adverselyaffected.
Our business could be negatively affected if we incur legal liability in connection with providing ourservices and solutions.
If we fail to meet our contractual obligations or otherwise breach obligations to our clients, we could besubject to legal liability. We may enter into non-standard agreements because we perceive an important financialopportunity by doing so or because our personnel did not adequately adhere to our guidelines. In addition, thecontracting practices of our competitors may cause contract terms and conditions that are unfavorable to us tobecome standard in the marketplace. If we cannot, or do not, meet our contractual obligations to provide servicesand solutions, and if our exposure is not adequately limited through the enforceable terms of our agreements, wemight face significant legal liability and our business, results of operations and financial condition could beadversely affected.
In the normal course of business and in conjunction with certain client engagements, we have entered intocontractual arrangements through which we may be obligated to indemnify clients or other parties with whom weconduct business with respect to certain matters. These arrangements can include provisions whereby we agree tohold the indemnified party and certain of their affiliated entities harmless with respect to third-party claims,including matters such as our breach of certain representations or covenants, our infringement of the intellectualproperty of others or our gross negligence or willful misconduct. Payments by us under any of thesearrangements are generally conditioned on the client making a claim and providing us with full control over thedefense and settlement of such claim. It is not possible to determine our maximum potential exposure under theseindemnification agreements due to the unique facts and circumstances involved in each particular agreement. Ifevents arise requiring us to make payment for indemnification claims under our contractual indemnificationobligations, such payments could have a material impact on our business, results of operations and financialcondition.
Additionally, our clients may perform audits or require us to perform audits and provide audit reports withrespect to the controls and procedures that we use in the performance of services for such clients, especiallywhen we process data belonging to them. Our ability to acquire new clients and retain existing clients may beadversely affected and our reputation could be harmed if we receive a qualified opinion, or if we cannot obtain anunqualified opinion, with respect to our controls and procedures in connection with any such audit in a timelymanner. We could also incur liability if our controls and procedures, or the controls and procedures we managefor a client, were to result in an internal control failure or impair our client’s ability to comply with its owninternal control requirements.
28

We may face difficulties in providing end-to-end business solutions or delivering complex and largeprojects for our clients that could cause clients to discontinue their work with us, which in turn couldharm our business, results of operations and financial condition.
We have been expanding the nature and scope of our engagements and have added new service offerings,such as consulting, business process services, systems integration and outsourcing of entire portions of ITinfrastructure across the industries we serve. The success of these service offerings depends, in part, uponcontinued demand for such services by our existing and prospective clients and our ability to meet this demand ina cost-competitive and effective manner. To obtain engagements for such end-to-end solutions, we also are morelikely to compete with large, well-established international consulting firms, resulting in increased competitionand pricing pressure. Accordingly, we cannot be certain that our new service offerings will effectively meetclient needs or that we will be able to attract existing and prospective clients to these service offerings.
The increased breadth of our service offerings has resulted and may continue to result in larger and morecomplex projects with our clients. This requires us to establish closer relationships with our clients and achieve athorough understanding of their operations. Our ability to establish such relationships depends on a number offactors, including the proficiency of our professionals and our management personnel. Our failure to understandour client requirements or our failure to deliver services that meet the requirements specified by our clients couldresult in termination of client contracts, and we could be liable to our clients for significant penalties or damages,which could have a material adverse effect on our business, results of operations and financial condition.
Larger projects often involve multiple engagements or stages, and there is a risk that a client may choose notto retain us for additional stages or may cancel or delay additional planned engagements. These terminations,cancellations or delays may result from factors that have little or nothing to do with the quality of our services,such as the business or financial condition of our clients or the economy generally. Such cancellations or delaysmake it difficult to plan for project resource requirements and inaccuracies in such resource planning andallocation may have a negative impact on our business, results of operations and financial condition.
If we are unable to collect our receivables from, or bill our unbilled services to, our clients, ourbusiness, results of operations and financial condition could be adversely affected.
Our business depends on our ability to successfully obtain payment from our clients of the amounts theyowe us for work performed. We evaluate the financial condition of our clients and usually bill and collect onrelatively short cycles. We maintain allowances against receivables and unbilled services. Actual losses on clientbalances could differ from those that we currently anticipate and, as a result, we might need to adjust ourallowances. There is no guarantee that we will accurately assess the creditworthiness of our clients.Macroeconomic conditions could also result in financial difficulties for our clients, including limited access tothe credit markets, insolvency or bankruptcy, and, as a result, could cause clients to delay payments to us, requestmodifications to their payment arrangements that could increase our receivables balance, or default on theirpayment obligations to us. Timely collection of client balances also depends on our ability to complete ourcontractual commitments and bill and collect our contracted revenues. If we are unable to meet our contractualrequirements, we might experience delays in collection of and/or be unable to collect our client balances, and ifthis occurs, our results of operations and cash flows could be adversely affected. In addition, if we experience anincrease in the time to bill and collect for our services, our cash flows could be adversely affected.
If our clients are not satisfied with our services and solutions or if our reputation in the marketplaceis damaged, our business, results of operations and financial condition could be adversely affected.
Our business model depends in large part on our ability to attract additional work from our base of existingclients. Our business model also depends on our account teams’ ability to develop relationships with our clientsthat enable us to understand our clients’ needs and deliver services and solutions that are tailored to those needs.If a client is not satisfied with the quality of work performed by us, or with the type of services or solutions
29
delivered, then we could incur additional costs to address the situation, the profitability of that work might beimpaired, and the client’s dissatisfaction with our services could damage our ability to obtain additional workfrom that client. In particular, clients that are not satisfied might seek to terminate existing contracts prior to theirscheduled expiration date and could direct future business to our competitors.
In addition, negative publicity related to our client services or relationships, regardless of its accuracy, couldadversely affect our business by inhibiting our ability to compete for new contracts with current and prospectiveclients. Our corporate reputation is potentially susceptible to damage due to actions or statements made bycurrent or former clients that are dissatisfied with our services or work product, as well as competitors, vendors,adversaries in legal proceedings, government regulators, former and current employees, members of theinvestment community and the media. Damage to our reputation could be difficult and time-consuming to repair,make potential or existing clients reluctant to select us for new engagements and, in turn, result in a loss ofbusiness, adversely affect our recruitment and retention efforts, reduce the value and effectiveness of theCognizant brand name and reduce investor confidence in us, any one of which could adversely affecting ourbusiness, results of operations and financial condition.
We rely on third parties for certain software products.
Certain of our software products contain components that are developed by third parties. In addition, weresell certain software products of third parties and we use third-party software products to deliver our servicesand solutions. We may not be able to replace the functions provided by these third-party software components orproducts if they become obsolete, defective, or incompatible with future versions of our products or with ourservices and solutions, or if they are not adequately maintained or updated. Any defects in or significantinterruption in the availability of these third-party software products or components could harm the sale of ourproducts and our delivery of services and solutions to our clients unless and until we can secure or develop analternative source. In addition, third-party suppliers of software or other intellectual property assets could beunwilling to permit us to use their intellectual property and this could impede or disrupt use of their products orservices by us and our clients. If our ability to provide services and solutions to our clients is impaired as a resultof any such denial, our business, results of operations and financial condition could be adversely affected.
Alternate sources for the technology currently licensed to us may not be available to us in a timely manner,may not provide us with the same functions as currently provided to us or may be more expensive than productswe currently use. Further, our success depends on our ability to maintain our existing relationships with third-party software providers and build new relationships with other providers in order to enhance our services andremain competitive. If we are unable to maintain such existing relationships or successfully build newrelationships, our business, results of operations, and financial condition could suffer.
We are exposed to credit risk and fluctuations in the market values of our investment portfolio.
Any deterioration of the credit and capital markets in the United States, Europe or other regions of the worldcould result in volatility of our investment earnings and impairments to our investment portfolio, which couldnegatively impact our financial condition and reported income. Any decline in economic activity could adverselyaffect the ability of counterparties to certain financial instruments such as marketable securities and derivatives tomeet their obligations to us.
Our revenues are highly dependent on clients concentrated in certain industries, including thefinancial services and healthcare industries. Consolidation and factors that negatively affect theseindustries may adversely affect our business, results of operations and financial condition.
During the year ended December 31, 2014, we earned approximately 41.8% of our revenues from thefinancial services industry, which includes insurance, and 26.2% from the healthcare industry. Significantconsolidation or a decrease in growth in the financial services industry or the healthcare industry may reduce the
30
demand for our services and negatively affect our business, financial condition and results of operations. Forexample, two or more of our current clients may merge or consolidate and combine their operations, which maycause us to lose work or lose the opportunity to gain additional work. The increased market power of largercompanies may also increase pricing and competitive pressures on us. Any of these possible results of industryconsolidation could adversely affect our business, financial condition and results of operations. In addition, if weare unable to successfully anticipate changing regulatory, economic and political conditions affecting theindustries in which we operate, we may be unable to effectively plan for or respond to those changes, and ourbusiness, results of operations and financial condition could be negatively affected.
Our revenues are highly dependent on clients located in the United States and Europe. Anyweakening of economic conditions in these markets may adversely affect our business, results of operationsand financial condition.
Approximately 76.8% of our revenues during the year ended December 31, 2014 were derived from clientslocated in North America. In the same period, approximately 18.4% of our revenues were derived from clientslocated in Europe. Any weakening of economic conditions in the United States or European economies coulddepress the pricing for our services and cause our customers to reduce or postpone their technology spendingsignificantly, which may in turn lower the demand for our services and negatively affect our business, results ofoperations and financial condition.
If we do not continue to improve our operational, financial and other internal controls and systems tomanage our rapid growth and size, our business, results of operations and financial condition could beadversely affected.
Our recent and anticipated growth, including our acquisition of TriZetto, will continue to place significantdemands on our management and other resources, and will require us to continue to develop and improve ouroperational, financial and other internal controls. In particular, our growth will increase the challenges involved in:
• recruiting, training and retaining technical, finance, marketing and management personnel with theknowledge, skills and experience that our business model requires;
• maintaining high levels of client satisfaction;
• developing and improving our internal administrative infrastructure, particularly our financial,operational, communications and other internal systems;
• preserving our culture, values and entrepreneurial environment; and
• effectively managing our personnel and operations and effectively communicating to our personnelworldwide our core values, strategies and goals.
In addition, the increasing size and scope of our operations increase the possibility that a member of ourpersonnel will engage in unlawful or fraudulent activity, breach our contractual obligations, or otherwise exposeus to unacceptable business risks, despite our efforts to train our people and maintain internal controls to preventsuch instances. If we do not continue to develop and implement the right processes and tools to manage ourenterprise, our business, results of operations and financial condition could be adversely affected.
There can be no assurance that our business, results of operations and financial condition will not beadversely affected by our incurrence of indebtedness.
On November 20, 2014, in conjunction with our acquisition of TriZetto, we entered into a credit agreementwith a bank syndicate providing for a $1.0 billion unsecured term loan and a $750.0 million unsecured revolvingcredit facility, both of which mature on November 20, 2019. We may incur additional indebtedness in the future,which may be significant. We will be required to have sufficient cash available in the United States to pay
31
scheduled installments of principal, accrued interest and fees from time to time and at maturity. If we do not havesufficient cash available in the United States, we may be required to repatriate earnings held by our foreignsubsidiaries. Any such repatriation would cause us to accrue the applicable amount of taxes associated with suchearnings at that time, which could have a material adverse effect on our results of operations. In addition, we maynot have sufficient cash in the United States or abroad to make payments on our debt obligations, which couldcause us to seek additional debt or equity capital or restructure or refinance our existing indebtedness. We maynot be able to effect any such alternative measures, if necessary, on commercially reasonable terms or at all and,even if successful, those alternative actions may not allow us to meet our scheduled debt service obligations.
In addition, the credit agreement contains certain covenants including a requirement that we maintain a debtto total stockholders’ equity ratio not in excess of 0.40:1.00 as of the last day of any fiscal quarter. Failure tocomply with this covenant or other provisions of the credit agreement could result in a default under the creditagreement, requiring us to either cure such default, receive a waiver, or in the absence of such cure or waiver,refinance any outstanding indebtedness under the credit agreement. There is no assurance that we would be ableto refinance our debt on acceptable terms and conditions.
Risks Relating to our International Operations
Our global operations are subject to complex risks, some of which might be beyond our control.
We have offices and operations in various countries around the world and provide services to clientsglobally. In 2014, approximately 76.8% of our revenues were attributable to the North American region, 18.4%were attributable to the European region, and the remainder was attributable to the rest of the world, primarily theAsia Pacific region. We anticipate that revenues from customers outside North America will continue to accountfor a material portion of our revenues in the foreseeable future and may increase as we expand our internationalpresence, particularly in Europe, the Asia Pacific region and the Latin America region.
In addition, the majority of our employees, along with our development and delivery centers, are located inIndia. As a result, we may be subject to risks inherently associated with international operations, including risksassociated with foreign currency exchange rate fluctuations, difficulties in enforcing intellectual property and/orcontractual rights, the burdens of complying with a wide variety of foreign laws and regulations, potentiallyadverse tax consequences, tariffs, quotas and other barriers, potential difficulties in collecting accountsreceivable, international hostilities, terrorism and natural disasters. We may also face difficulties integrating newfacilities in different countries into our existing operations, as well as integrating employees that we hire indifferent countries into our existing corporate culture. If we are unable to manage the risks of our globaloperations, our business, results of operations and financial condition could be adversely affected.
A substantial portion of our assets and operations are located in India and we are subject toregulatory, economic, political and other uncertainties in India.
We intend to continue to develop and expand our offshore facilities in India where a majority of ourtechnical professionals are located. While wage costs are lower in India than in the United States and otherdeveloped countries for comparably skilled professionals, wages in India have historically increased at a fasterrate than in the United States and other countries in which we operate. If this trend continues in the future, itwould result in increased costs for our skilled professionals and thereby potentially reduce our operating margins.Also, there is no assurance that, in future periods, competition for skilled professionals will not drive salarieshigher in India, thereby resulting in increased costs for our technical professionals and reduced operatingmargins.
India has also recently experienced civil unrest and terrorism and has been involved in conflicts withneighboring countries. In recent years, there have been military confrontations between India and Pakistan thathave occurred in the region of Kashmir and along the India-Pakistan border. The potential for hostilities betweenthe two countries has been high in light of tensions related to recent terrorist incidents in India and the unsettled
32
nature of the regional geopolitical environment, including events in and related to Afghanistan, Iraq and Syria. IfIndia becomes engaged in armed hostilities, particularly if these hostilities are protracted or involve the threat ofor use of weapons of mass destruction, it is likely that our business, results of operations and financial conditionwould be materially adversely affected.
In the past, the Indian economy has experienced many of the problems that commonly confront theeconomies of developing countries, including high inflation, erratic gross domestic product growth and shortagesof foreign exchange. The Indian government has exercised, and continues to exercise, significant influence overmany aspects of the Indian economy and Indian government actions concerning the economy could have amaterial adverse effect on private sector entities like us. In the past, the Indian government has providedsignificant tax incentives and relaxed certain regulatory restrictions in order to encourage foreign investment inspecified sectors of the economy, including the software development services industry. Changes in governmentleadership in India or a change in policies of the existing government in India that results in the elimination ofany of the benefits realized by us from our Indian operations or the imposition of new taxes applicable to suchoperations could have a material adverse effect on our business, results of operations and financial condition.
Our operating results may be adversely affected by fluctuations in the Indian rupee and other foreigncurrency exchange rates, restrictions on the deployment of cash across our global operations and our useof derivative financial instruments.
Although we report our operating results in U.S. dollars, a portion of our revenues and expenses aredenominated in currencies other than the U.S. dollar. Fluctuations in foreign currency exchange rates can have anumber of adverse effects on us. Because our consolidated financial statements are presented in U.S. dollars, wemust translate revenues, expenses and income, as well as assets and liabilities, into U.S. dollars at exchange ratesin effect during or at the end of each reporting period. Therefore, changes in the value of the U.S. dollar againstother currencies will affect our revenues, income from operations, net income and the value of balance sheetitems originally denominated in other currencies. There is no guarantee that our financial results will not beadversely affected by currency exchange rate fluctuations. In addition, in some countries we could be subject tostrict restrictions on the movement of cash and the exchange of foreign currencies, which could limit our abilityto use these funds across our global operations. Further, as we continue to leverage our global delivery model,more of our expenses are incurred in currencies other than those in which we bill for the related services. Anincrease in the value of certain currencies, such as the Indian rupee, against the U.S. dollar could increase costsfor delivery of services at offshore sites by increasing labor and other costs that are denominated in localcurrency.
We have entered into a series of foreign exchange forward contracts that are designated as cash flow hedgesof certain rupee denominated payments in India. These contracts are intended to partially offset the impact of themovement of the exchange rates on future operating costs. In addition, we have also entered into foreignexchange forward contracts in order to mitigate foreign currency risk on foreign currency denominated netmonetary assets. The hedging strategies that we have implemented, or may in the future implement, to mitigateforeign currency exchange rate risks may not reduce or completely offset our exposure to foreign exchange ratefluctuations and may expose our business to unexpected market, operational and counterparty credit risks.Accordingly, we may incur losses from our use of derivative financial instruments that could have a materialadverse effect on our business, results of operations and financial condition.
Our global operations expose us to numerous and sometimes conflicting legal and regulatoryrequirements, and violations of these regulations could harm our business, results of operations andfinancial condition.
Because we provide services to clients throughout the world, we are subject to numerous, and sometimesconflicting, legal rules on matters as diverse as import/export controls, content requirements, trade restrictions,tariffs, taxation, sanctions, government affairs, internal and disclosure control obligations, data privacy and laborrelations. Violations of these laws or regulations in the conduct of our business could result in fines, criminal
33
sanctions against us or our officers, prohibitions on doing business, damage to our reputation and otherunintended consequences such as liability for monetary damages, fines and/or criminal prosecution, unfavorablepublicity, restrictions on our ability to process information and allegations by our clients that we have notperformed our contractual obligations. Due to the varying degrees of development of the legal systems of thecountries in which we operate, local laws might be insufficient to protect our rights. Our failure to comply withapplicable legal and regulatory requirements could have a material adverse effect on our business, results ofoperations and financial condition.
Among other anti-corruption laws and regulations, we are subject to the United States Foreign CorruptPractices Act, or FCPA, which prohibits improper payments or offers of improper payments to foreign officialsto obtain business or any other benefit, and the U.K. Bribery Act. Violations of these laws or regulations couldsubject us to criminal or civil enforcement actions, including fines and suspension or disqualification fromgovernment contracting or contracting with private entities in certain highly regulated industries, any of whichcould have a material adverse effect on our business, results of operations and financial condition.
International hostilities, terrorist activities, other violence or war, natural disasters, pandemics andinfrastructure disruptions, could delay or reduce the number of new service orders we receive and impairour ability to service our customers, thereby adversely affecting our business, results of operations andfinancial condition.
Hostilities involving acts of terrorism, violence or war, natural disasters, global health risks or pandemics orthe threat or perceived potential for these events could materially adversely affect our operations and our abilityto provide services to our customers. Such events may cause customers to delay their decisions on spending forinformation technology, consulting, and business process services and give rise to sudden significant changes inregional and global economic conditions and cycles. These events also pose significant risks to our personnel andto our and our clients’ physical facilities and operations around the world. Additionally, by disruptingcommunications and travel, giving rise to travel restrictions, and increasing the difficulty of obtaining andretaining highly-skilled and qualified personnel, these events could make it difficult or impossible for us todeliver services to some or all of our clients. The majority of our employees are located in India, and the vastmajority of our technical professionals in the United States and Europe are Indian nationals who are able to workin the United States and Europe only because they hold current visas and work permits. Any inability to travelcould cause us to incur additional unexpected costs and expenses or could impair our ability to retain the skilledprofessionals we need for our operations. In addition, any extended disruptions of electricity, other public utilitiesor network services at our facilities could also adversely affect our ability to serve our clients.
Hostilities involving the United States, the United Kingdom, India and other countries in which we provideservices to our clients, and other acts of terrorism, violence or war, natural disasters, global health risks orpandemics may reduce the demand for our services and negatively affect our revenues. If we fail to defendagainst any of these occurrences, we might be unable to protect our people, facilities and systems. If thesedisruptions prevent us from effectively serving our clients, our business, results of operations and financialcondition could be adversely affected.
Risks Relating to Taxes
Our earnings and financial condition may be negatively impacted by certain tax related matters.
We are subject to income taxes in the United States and numerous foreign jurisdictions. Our provision forincome taxes and cash tax liability could be adversely affected by numerous factors including, but not limited to,income before taxes being lower than anticipated in countries with lower statutory tax rates and higher thananticipated in countries with higher statutory tax rates, changes in the valuation of deferred tax assets andliabilities, and changes in tax laws, regulations, accounting principles or interpretations thereof, which couldadversely impact our results of operations and financial condition in future periods. In addition, our income taxreturns are subject to examination in the jurisdictions in which we operate. We regularly assess the likelihood of
34

adverse outcomes resulting from these examinations to determine the adequacy of our provision for incometaxes. An unfavorable outcome of one or more of these examinations may have an adverse effect on our business,results of operations and financial condition.
Our earnings may be adversely affected if we change our intent not to repatriate foreign earnings or ifsuch earnings become subject to U.S. tax on a current basis.
We earn a significant amount of our earnings outside of the United States. Other than amounts for which wehave already accrued U.S. taxes, we consider foreign earnings to be indefinitely reinvested outside of the UnitedStates. While we have no plans to do so, events may occur that could effectively force us to change our intent notto repatriate such earnings. If such earnings are repatriated in the future or are no longer deemed to beindefinitely reinvested outside of the United States, or if legislation is enacted in the United States providing for atax on foreign earnings or profits prior to their repatriation, we may have to accrue taxes associated with suchearnings or profits at a substantially higher rate than our projected effective income tax rate in 2015. Theseincreased taxes could have a material adverse effect on our business, results of operations and financialcondition.
Our earnings may be negatively impacted by the loss of certain tax benefits provided by India tocompanies in our industry as well as by possible changes in Indian tax laws.
Our Indian subsidiaries, collectively referred to as Cognizant India, are primarily export-oriented and areeligible for certain income tax holiday benefits granted by the Indian government for export activities conductedwithin Special Economic Zones, or SEZs, for periods of up to 15 years. Changes in Indian tax laws that wouldreduce or deny SEZ tax benefits could have a material adverse effect on our business, results of operations andfinancial condition. In addition, all Indian profits, including those generated within SEZs, are subject to theMinimum Alternative Tax, or MAT, at the current rate of approximately 21.0%, including surcharges. Any MATpaid is creditable against future corporate income tax, subject to limitations. Currently, we anticipate utilizing ourexisting MAT balances against future corporate income tax. Our ability to fully do so may be influenced bypossible changes to the Indian tax laws as well as the future financial results of Cognizant India. Our potentialinability to fully utilize our deferred income tax assets related to the MAT could have a material adverse effecton our business, results of operations and financial condition.
Risks Relating to Intellectual Property
We may not be able to enforce or protect our intellectual property rights, which may harm our abilityto compete and harm our business.
Our future success will depend, in part, on our ability to protect our proprietary methodologies and othervaluable intellectual property. We presently hold a limited number of issued patents, and we have filed andintend to file patent applications. There is no guarantee that any patents will issue in the United States or in anyother country we may seek protection or that they will serve as a barrier from competition from otherorganizations. Additionally, the protection afforded by international patent laws as well as the enforcementactions differ from country to country. There is no guarantee that we will be able to maintain adequate protectionor enforcement of our intellectual property rights.
We also rely upon a combination of copyright and trade secret laws, non-disclosure and related contractualarrangements, and other security measures to protect our intellectual property rights. We believe that laws, rules,regulations and treaties in effect in the United States, India and other countries in which we operate are adequateto protect us from misappropriation or unauthorized use of our intellectual property. However, there can be noassurance that these laws will not change in ways that may prevent or restrict the transfer of softwarecomponents, libraries, toolsets and other technology or data we use in the performance of our services, andexisting laws of some countries in which we provide services, such as China, might offer only limited protection
35

of our intellectual property rights. There also can be no assurance that the steps we have taken to protect ourintellectual property rights will be adequate to deter misappropriation, or that we will be able to detectunauthorized use of our intellectual property.
Unauthorized use of our intellectual property may result in development of technology, products or servicesthat compete with our products and services and unauthorized parties may infringe upon or misappropriate ourproducts, services or proprietary information. If we are unable to protect our intellectual property, our businessmay be adversely affected and our ability to compete may be impaired.
Depending on the circumstances, we might need to grant a specific client greater rights in intellectualproperty developed or used in connection with a contract than we normally do. In certain situations, we mightforego all rights to the use of intellectual property we create and intend to reuse across multiple clientengagements, which would limit our ability to reuse that intellectual property for other clients. Any limitation onour ability to provide a service or solution could cause us to lose revenue-generating opportunities and require usto incur additional expenses to develop new or modified solutions for future projects.
Our ability to enforce our software license agreements, service agreements, and other intellectual propertyrights is subject to general litigation risks, as well as uncertainty as to the enforceability of our intellectualproperty rights in various countries. To the extent that we seek to enforce our rights, we could be subject toclaims that an intellectual property right is invalid, otherwise not enforceable, or is licensed to the party againstwhom we are pursuing a claim. In addition, our assertion of intellectual property rights may result in the otherparty seeking to assert alleged intellectual property rights or assert other claims against us, which could harm ourbusiness. If we are not successful in defending such claims in litigation, we may not be able to sell or license aparticular service or solution due to an injunction, or we may have to pay damages that could, in turn, harm ourresults of operations. In addition, governments may adopt regulations, or courts may render decisions, requiringcompulsory licensing of intellectual property to others, or governments may require that products meet specifiedstandards that serve to favor local companies. Our inability to enforce our intellectual property rights under thesecircumstances may harm our competitive position and our business.
Our services or solutions could infringe upon the intellectual property rights of others and we may besubject to claims of infringement of third-party intellectual property rights.
We cannot be sure that our services and solutions, or the solutions of others that we offer to our clients, donot infringe on the intellectual property rights of others. Third parties may assert against us or our customersclaims alleging infringement of patent, copyright, trademark, or other intellectual property rights to technologiesor services that are important to our business. Infringement claims could harm our reputation, cost us money andprevent us from offering some services or solutions. In our contracts, we generally agree to indemnify our clientsfor certain expenses or liabilities resulting from potential infringement of the intellectual property rights of thirdparties. In some instances, the amount of our liability under these indemnities could be substantial. Any claimsthat our products, services or processes infringe the intellectual property rights of others, regardless of the meritor resolution of such claims, may result in significant costs in defending and resolving such claims, and maydivert the efforts and attention of our management and technical personnel from our business. In addition, as aresult of such intellectual property infringement claims, we could be required or otherwise decide that it isappropriate to:
• pay third-party infringement claims;
• discontinue using, licensing, or selling particular products subject to infringement claims;
• discontinue using the technology or processes subject to infringement claims;
• develop other technology not subject to infringement claims, which could be costly or may not bepossible; and/or
• license technology from the third party claiming infringement, which license may not be available oncommercially reasonable terms.
36
The occurrence of any of the foregoing could result in unexpected expenses or require us to recognize animpairment of our assets, which would reduce the value of our assets and increase expenses. In addition, if wealter or discontinue our offering of affected items or services, our revenue could be affected. If a claim ofinfringement were successful against us or our clients, an injunction might be ordered against our client or ourown services or operations, causing further damages.
We expect that the risk of infringement claims against us will increase if our competitors are able to obtainpatents or other intellectual property rights for software products and methods, technological solutions, andprocesses. We may be subject to intellectual property infringement claims from certain individuals or companiesthat have acquired patent portfolios for the primary purpose of asserting such claims against other companies.The risk of infringement claims against us may also increase as we continue to develop and license ourintellectual property to our clients and other third parties. Any infringement claim or litigation against us couldhave a material adverse effect on our business, results of operations and financial condition.
Risks Relating to Legislation and Government Regulation
Anti-outsourcing legislation, if adopted, and negative perceptions associated with offshoreoutsourcing could impair our ability to service our customers and adversely affect our business, results ofoperations and financial condition.
The issue of companies outsourcing services to organizations operating in other countries is a topic ofpolitical discussion in the United States, which is our largest market, as well as in Europe, the Asia Pacific andother regions in which we have clients. For example, measures aimed at limiting or restricting outsourcing byUnited States companies are periodically considered in the U.S. Congress and in numerous state legislatures toaddress concerns over the perceived association between offshore outsourcing and the loss of jobs domestically.If enacted, such measures may broaden existing restrictions on outsourcing by federal and state governmentagencies and on government contracts with firms that outsource services directly or indirectly, or impact privateindustry with measures that include, but are not limited to, tax disincentives, fees or penalties, intellectualproperty transfer restrictions, mandatory government audit requirements, and new standards that have the effectof restricting the use of certain business and/or work visas. In the event that any of these measures become law,our ability to provide services to our customers could be impaired, which could adversely affect our business,results of operations and financial condition. Existing and future legislative and administrative/regulatorypolicies restricting the performance of business process services from an offshore location in jurisdictions inEurope, the Asia Pacific or any other region in which we have clients could also have a material adverse effect onour business, results of operations and financial condition.
In addition, from time to time there has been publicity about negative experiences associated with offshoreoutsourcing, such as domestic job loss and theft and misappropriation of sensitive client data, particularlyinvolving service providers in India. Current or prospective clients may elect to perform certain servicesthemselves or may be discouraged from utilizing global service delivery providers due to negative perceptionsthat may be associated with using global service delivery models or firms. Any slowdown or reversal of existingindustry trends toward global service delivery would seriously harm our ability to compete effectively withcompetitors that provide the majority of their services from within the country in which our clients operate.
Restrictions on immigration may affect our ability to compete for and provide services to clients,which could hamper our growth and cause our revenue to decline.
Our future success continues to depend on our ability to attract and retain employees with technical andproject management skills, including those from developing countries, especially India. The ability of foreignnationals to work in the United States, Europe, the Asia Pacific and other regions in which we have clientsdepends on their and our ability to obtain the necessary visas and work permits for our personnel who need totravel internationally. If we are unable to obtain such visas or work permits, or if their issuance is delayed or iftheir length is shortened, we may not be able to provide services to our clients or to continue to provide services
37
on a timely and cost-effective basis, receive revenues as early as expected or manage our delivery centers asefficiently as we otherwise could, any of which could have a material adverse effect on our business, results ofoperations and financial condition.
Immigration and work permit laws and regulations in the countries in which we have clients are subject tolegislative and administrative changes as well as changes in the application of standards and enforcement. Forexample, the United States Congress has recently considered and may consider in the future extensive changes toU.S. immigration laws regarding the admission of high-skilled temporary and permanent workers. If suchprovisions are signed into law, our cost of doing business in the United States would increase and that maydiscourage customers from seeking our services. Our international expansion strategy and our business, results ofoperations and financial condition may be materially adversely affected if changes in immigration and workpermit laws and regulations or the administration or enforcement of such laws or regulations impair our ability tostaff projects with professionals who are not citizens of the country where the work is to be performed.
Increased regulation of the financial services industry, healthcare industry or other industries inwhich our clients operate could harm our business, results of operations and financial condition.
The industries in which our clients are concentrated, such as the financial services industry and thehealthcare industry, are, or may be, increasingly subject to governmental regulation and intervention. Forinstance, the financial services industry is subject to extensive and complex federal and state regulation. As aprovider of services to financial institutions, portions of our operations are examined by a number of regulatoryagencies. These agencies regulate the services we provide and manner in which we operate. For example, somefinancial services regulators have imposed guidelines for use of cloud computing services that mandate specificcontrols or require financial services enterprises to obtain regulatory approval prior to outsourcing certainfunctions. If we are unable to comply with these guidelines or controls, or if our customers are unable to obtainregulatory approval to use our services where required, our business may be harmed. In addition, clients in thefinancial services sector have been subject to increased regulation following the enactment of the Dodd-FrankWall Street Reform and Consumer Protection Act in the United States. New or changing regulations under Dodd-Frank, as well as other regulations or legislation affecting our customers in the financial services industry, mayreduce demand for our services or cause us to incur costly changes in our processes or personnel, therebynegatively affecting our business, results of operations and financial condition.
The healthcare industry is highly regulated at the federal, state and local levels and is subject to changinglegislative, regulatory, political and other influences. Many healthcare laws, such as the Affordable Care Act, arecomplex, subject to frequent change, and dependent on interpretation and enforcement decisions fromgovernment agencies with broad discretion. The application of these laws to us, our clients or the specificservices and relationships we have with our clients is not always clear. Our failure to anticipate accurately theapplication of the Affordable Care Act and similar or future laws and regulations, or our failure to comply withthem, could create liability for us, result in adverse publicity and negatively affect our business, results ofoperations and financial condition. Further, the growth of our business, results of operations and financialcondition rely, in part, on clients in the healthcare industry that receive substantial revenues from governmentaland other third-party payor programs. A reduction or less than expected increase in government funding for theseprograms, a change in allocation methodologies or the termination of our clients’ government contracts couldnegatively affect our clients’ businesses and, in turn, negatively impact our business, results of operations andfinancial condition. In addition, as a service provider to clients who are government contractors, we may in thefuture become involved in governmental investigations to evaluate our or our clients’ compliance withgovernment healthcare programs, which could result in the assessment of damages, civil or criminal fines orpenalties, or other sanctions, any of which could have a material adverse effect on our business, results ofoperations and financial condition.
Increased regulation, changes in existing regulation or increased government intervention in the otherindustries in which our clients operate also may adversely affect the growth of their respective businesses andtherefore negatively impact our business, results of operations and financial condition.
38
Risks Relating to our Common Stock and Governing Documents
Our stock price continues to be volatile.
Our stock has at times experienced substantial price volatility as a result of variations between our actualand anticipated financial results, announcements by us and our competitors, projections or speculation about ourbusiness or that of our competitors by the media or investment analysts or uncertainty about current globaleconomic conditions. The stock market, as a whole, also has experienced extreme price and volume fluctuationsthat have affected the market price of many technology companies in ways that may have been unrelated to thesecompanies’ operating performance. Furthermore, we believe our stock price should reflect future growth andprofitability expectations and, if we fail to meet these expectations, our stock price may significantly decline.
Provisions in our charter and by-laws and provisions under Delaware law may discourage unsolicitedtakeover proposals.
Provisions in our charter and by-laws, each as amended, and Delaware General Corporate Law, or DGCL,may have the effect of deterring unsolicited takeover proposals or delaying or preventing changes in our controlor management, including transactions in which stockholders might otherwise receive a premium for their sharesover then-current market prices. These provisions include:
• Authority of the board of directors, without further action by the stockholders, to fix the rights andpreferences, and issue shares of preferred stock;
• The classification of our board of directors until the 2016 annual meeting of stockholders, at whichpoint the board of directors will be declassified and each director will be elected on an annual basis.While our board of directors remains classified, a change of control of our board of directors cannotoccur at a single meeting of stockholders;
• The inability of our stockholders to act by written consent and the restrictions imposed on ourstockholders’ ability to call a special meeting. As a result, any action by our stockholders may bedelayed until annual meetings or until a special meeting is called by our chairman or chief executiveofficer or our board of directors;
• The supermajority-voting requirement for specified amendments to our charter and by-laws, whichallows a minority of our stockholders to block those amendments; and
• Provisions in the DGCL preventing stockholders from engaging in business combinations with us,subject to certain exceptions.
These provisions could also discourage bids for our common stock at a premium as well as create a depressiveeffect on the market price of the shares of our common stock.
Item 1B. Unresolved Staff Comments
None.
39
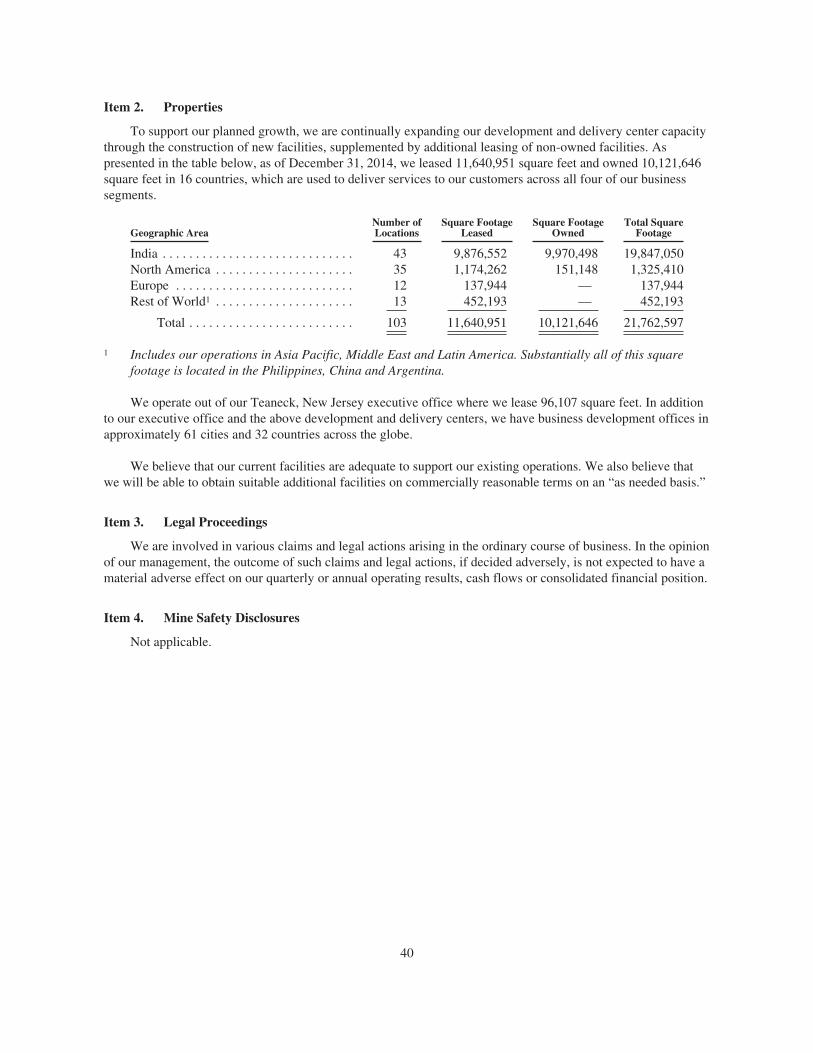
Item 2. Properties
To support our planned growth, we are continually expanding our development and delivery center capacitythrough the construction of new facilities, supplemented by additional leasing of non-owned facilities. Aspresented in the table below, as of December 31, 2014, we leased 11,640,951 square feet and owned 10,121,646square feet in 16 countries, which are used to deliver services to our customers across all four of our businesssegments.
Geographic AreaNumber ofLocations
Square FootageLeased
Square FootageOwned
Total SquareFootage
India . . . . . . . . . . . . . . . . . . . . . . . . . . . . . 43 9,876,552 9,970,498 19,847,050North America . . . . . . . . . . . . . . . . . . . . . 35 1,174,262 151,148 1,325,410Europe . . . . . . . . . . . . . . . . . . . . . . . . . . . 12 137,944 — 137,944Rest of World1 . . . . . . . . . . . . . . . . . . . . . 13 452,193 — 452,193
Total . . . . . . . . . . . . . . . . . . . . . . . . . 103 11,640,951 10,121,646 21,762,597
1 Includes our operations in Asia Pacific, Middle East and Latin America. Substantially all of this squarefootage is located in the Philippines, China and Argentina.
We operate out of our Teaneck, New Jersey executive office where we lease 96,107 square feet. In additionto our executive office and the above development and delivery centers, we have business development offices inapproximately 61 cities and 32 countries across the globe.
We believe that our current facilities are adequate to support our existing operations. We also believe thatwe will be able to obtain suitable additional facilities on commercially reasonable terms on an “as needed basis.”
Item 3. Legal Proceedings
We are involved in various claims and legal actions arising in the ordinary course of business. In the opinionof our management, the outcome of such claims and legal actions, if decided adversely, is not expected to have amaterial adverse effect on our quarterly or annual operating results, cash flows or consolidated financial position.
Item 4. Mine Safety Disclosures
Not applicable.
40
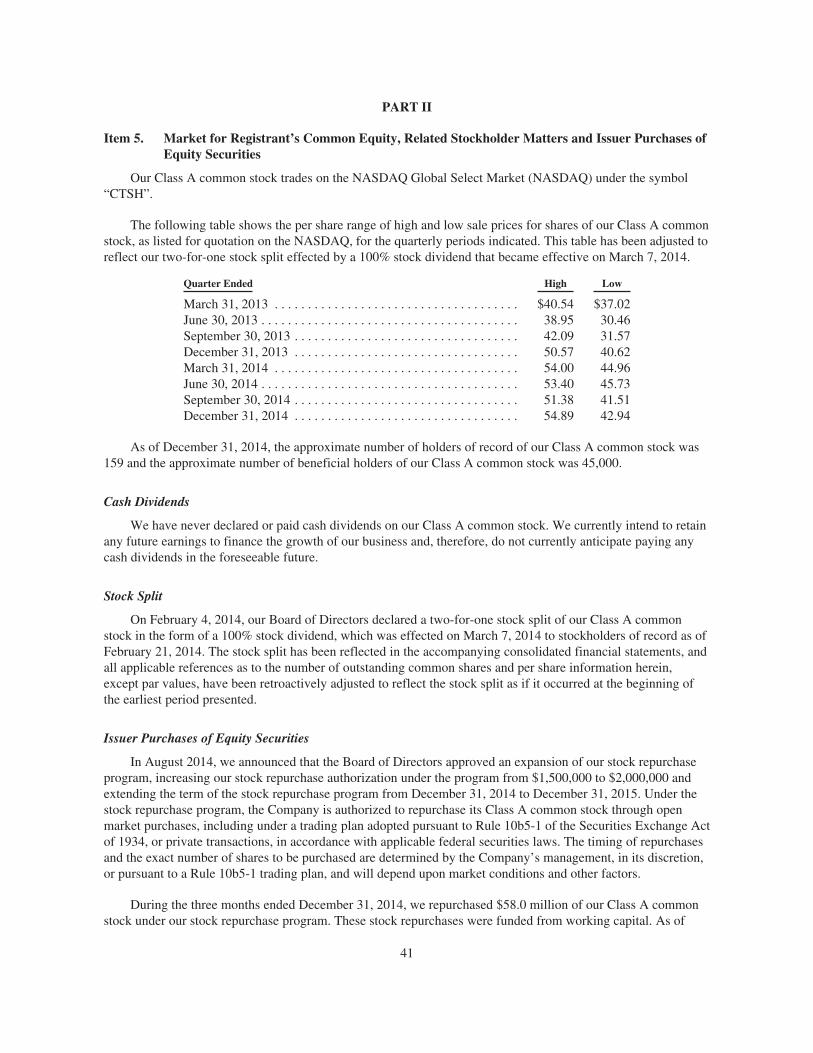
PART II
Item 5. Market for Registrant’s Common Equity, Related Stockholder Matters and Issuer Purchases ofEquity Securities
Our Class A common stock trades on the NASDAQ Global Select Market (NASDAQ) under the symbol“CTSH”.
The following table shows the per share range of high and low sale prices for shares of our Class A commonstock, as listed for quotation on the NASDAQ, for the quarterly periods indicated. This table has been adjusted toreflect our two-for-one stock split effected by a 100% stock dividend that became effective on March 7, 2014.
Quarter Ended High Low
March 31, 2013 . . . . . . . . . . . . . . . . . . . . . . . . . . . . . . . . . . . . . $40.54 $37.02June 30, 2013 . . . . . . . . . . . . . . . . . . . . . . . . . . . . . . . . . . . . . . . 38.95 30.46September 30, 2013 . . . . . . . . . . . . . . . . . . . . . . . . . . . . . . . . . . 42.09 31.57December 31, 2013 . . . . . . . . . . . . . . . . . . . . . . . . . . . . . . . . . . 50.57 40.62March 31, 2014 . . . . . . . . . . . . . . . . . . . . . . . . . . . . . . . . . . . . . 54.00 44.96June 30, 2014 . . . . . . . . . . . . . . . . . . . . . . . . . . . . . . . . . . . . . . . 53.40 45.73September 30, 2014 . . . . . . . . . . . . . . . . . . . . . . . . . . . . . . . . . . 51.38 41.51December 31, 2014 . . . . . . . . . . . . . . . . . . . . . . . . . . . . . . . . . . 54.89 42.94
As of December 31, 2014, the approximate number of holders of record of our Class A common stock was159 and the approximate number of beneficial holders of our Class A common stock was 45,000.
Cash Dividends
We have never declared or paid cash dividends on our Class A common stock. We currently intend to retainany future earnings to finance the growth of our business and, therefore, do not currently anticipate paying anycash dividends in the foreseeable future.
Stock Split
On February 4, 2014, our Board of Directors declared a two-for-one stock split of our Class A commonstock in the form of a 100% stock dividend, which was effected on March 7, 2014 to stockholders of record as ofFebruary 21, 2014. The stock split has been reflected in the accompanying consolidated financial statements, andall applicable references as to the number of outstanding common shares and per share information herein,except par values, have been retroactively adjusted to reflect the stock split as if it occurred at the beginning ofthe earliest period presented.
Issuer Purchases of Equity Securities
In August 2014, we announced that the Board of Directors approved an expansion of our stock repurchaseprogram, increasing our stock repurchase authorization under the program from $1,500,000 to $2,000,000 andextending the term of the stock repurchase program from December 31, 2014 to December 31, 2015. Under thestock repurchase program, the Company is authorized to repurchase its Class A common stock through openmarket purchases, including under a trading plan adopted pursuant to Rule 10b5-1 of the Securities Exchange Actof 1934, or private transactions, in accordance with applicable federal securities laws. The timing of repurchasesand the exact number of shares to be purchased are determined by the Company’s management, in its discretion,or pursuant to a Rule 10b5-1 trading plan, and will depend upon market conditions and other factors.
During the three months ended December 31, 2014, we repurchased $58.0 million of our Class A commonstock under our stock repurchase program. These stock repurchases were funded from working capital. As of
41
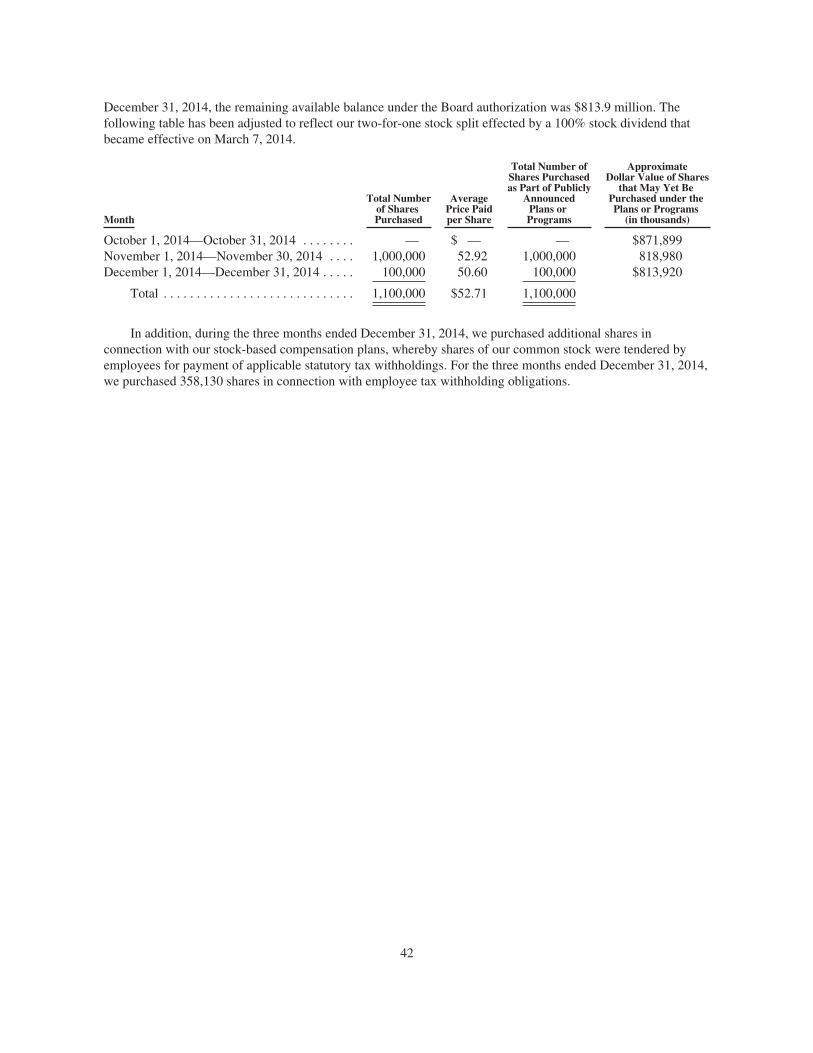
December 31, 2014, the remaining available balance under the Board authorization was $813.9 million. Thefollowing table has been adjusted to reflect our two-for-one stock split effected by a 100% stock dividend thatbecame effective on March 7, 2014.
Month
Total Numberof SharesPurchased
AveragePrice Paidper Share
Total Number ofShares Purchasedas Part of Publicly
AnnouncedPlans orPrograms
ApproximateDollar Value of Shares
that May Yet BePurchased under thePlans or Programs
(in thousands)
October 1, 2014—October 31, 2014 . . . . . . . . — $ — — $871,899November 1, 2014—November 30, 2014 . . . . 1,000,000 52.92 1,000,000 818,980December 1, 2014—December 31, 2014 . . . . . 100,000 50.60 100,000 $813,920
Total . . . . . . . . . . . . . . . . . . . . . . . . . . . . . 1,100,000 $52.71 1,100,000
In addition, during the three months ended December 31, 2014, we purchased additional shares inconnection with our stock-based compensation plans, whereby shares of our common stock were tendered byemployees for payment of applicable statutory tax withholdings. For the three months ended December 31, 2014,we purchased 358,130 shares in connection with employee tax withholding obligations.
42
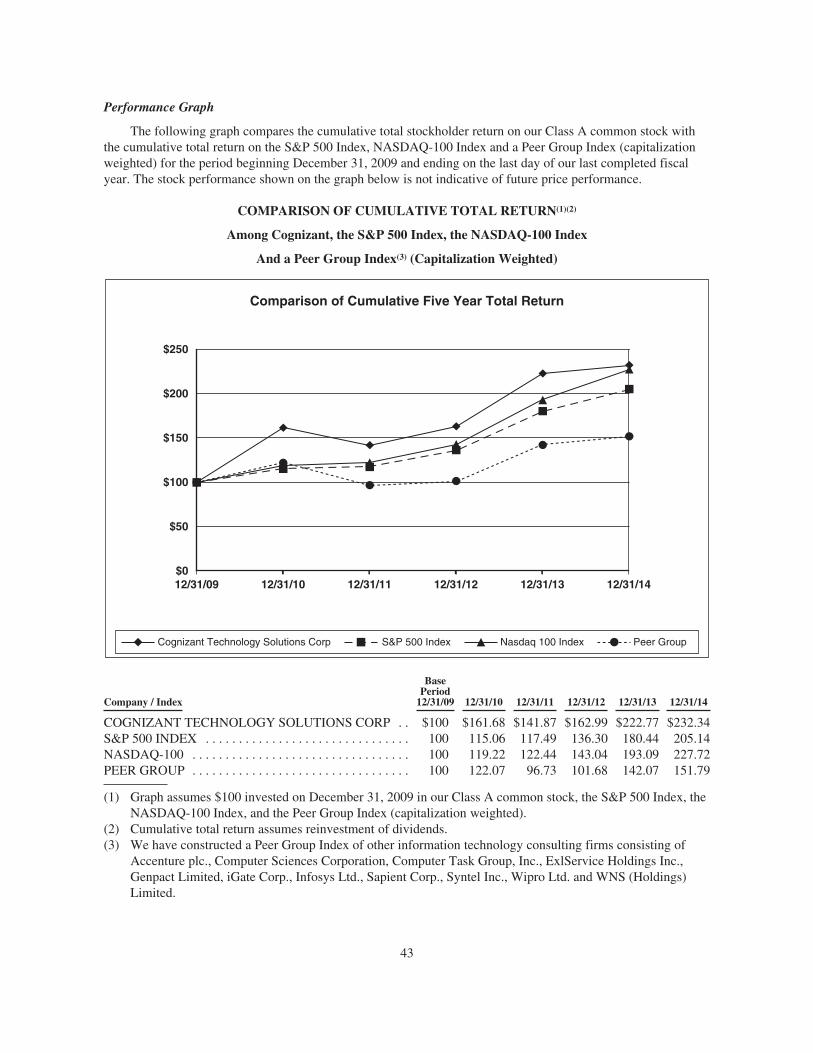
Performance Graph
The following graph compares the cumulative total stockholder return on our Class A common stock withthe cumulative total return on the S&P 500 Index, NASDAQ-100 Index and a Peer Group Index (capitalizationweighted) for the period beginning December 31, 2009 and ending on the last day of our last completed fiscalyear. The stock performance shown on the graph below is not indicative of future price performance.
COMPARISON OF CUMULATIVE TOTAL RETURN(1)(2)
Among Cognizant, the S&P 500 Index, the NASDAQ-100 Index
And a Peer Group Index(3) (Capitalization Weighted)
12/31/09 12/31/10 12/31/11 12/31/12 12/31/1412/31/13$0
$50
$100
$250
$200
$150
Comparison of Cumulative Five Year Total Return
Cognizant Technology Solutions Corp S&P 500 Index Nasdaq 100 Index Peer Group
Company / Index
BasePeriod
12/31/09 12/31/10 12/31/11 12/31/12 12/31/13 12/31/14
COGNIZANT TECHNOLOGY SOLUTIONS CORP . . $100 $161.68 $141.87 $162.99 $222.77 $232.34S&P 500 INDEX . . . . . . . . . . . . . . . . . . . . . . . . . . . . . . . 100 115.06 117.49 136.30 180.44 205.14NASDAQ-100 . . . . . . . . . . . . . . . . . . . . . . . . . . . . . . . . . 100 119.22 122.44 143.04 193.09 227.72PEER GROUP . . . . . . . . . . . . . . . . . . . . . . . . . . . . . . . . . 100 122.07 96.73 101.68 142.07 151.79
(1) Graph assumes $100 invested on December 31, 2009 in our Class A common stock, the S&P 500 Index, theNASDAQ-100 Index, and the Peer Group Index (capitalization weighted).
(2) Cumulative total return assumes reinvestment of dividends.(3) We have constructed a Peer Group Index of other information technology consulting firms consisting of
Accenture plc., Computer Sciences Corporation, Computer Task Group, Inc., ExlService Holdings Inc.,Genpact Limited, iGate Corp., Infosys Ltd., Sapient Corp., Syntel Inc., Wipro Ltd. and WNS (Holdings)Limited.
43
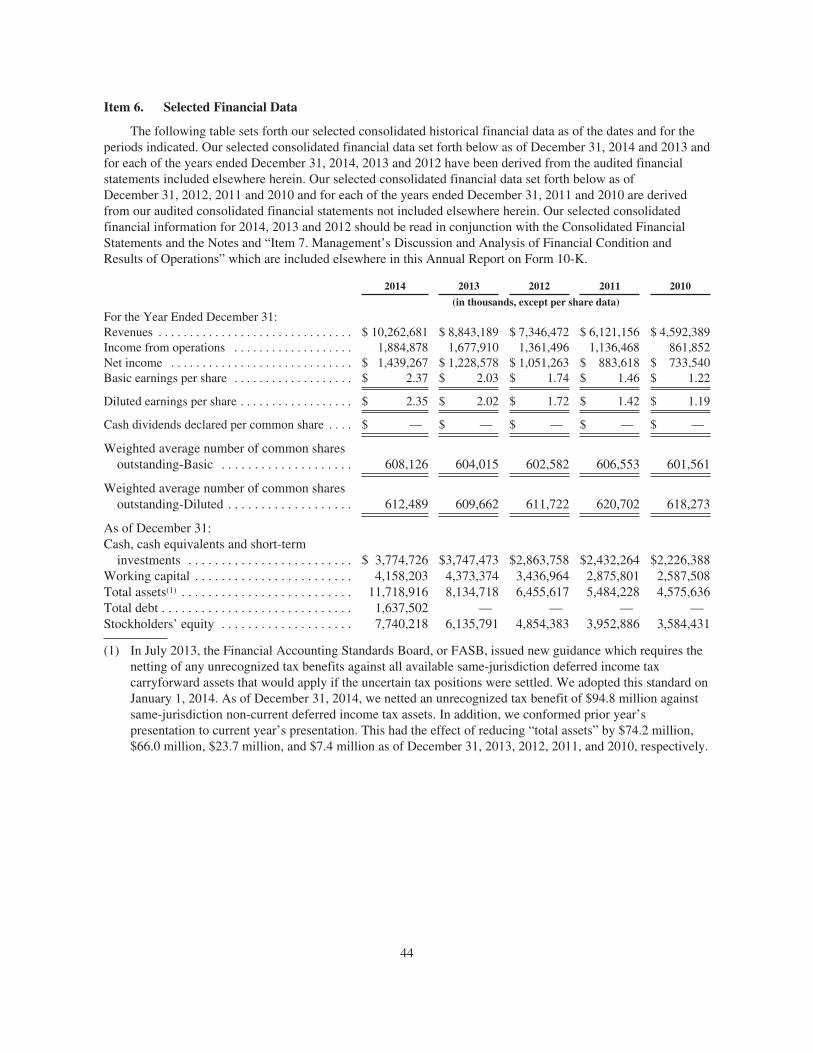
Item 6. Selected Financial Data
The following table sets forth our selected consolidated historical financial data as of the dates and for theperiods indicated. Our selected consolidated financial data set forth below as of December 31, 2014 and 2013 andfor each of the years ended December 31, 2014, 2013 and 2012 have been derived from the audited financialstatements included elsewhere herein. Our selected consolidated financial data set forth below as ofDecember 31, 2012, 2011 and 2010 and for each of the years ended December 31, 2011 and 2010 are derivedfrom our audited consolidated financial statements not included elsewhere herein. Our selected consolidatedfinancial information for 2014, 2013 and 2012 should be read in conjunction with the Consolidated FinancialStatements and the Notes and “Item 7. Management’s Discussion and Analysis of Financial Condition andResults of Operations” which are included elsewhere in this Annual Report on Form 10-K.
2014 2013 2012 2011 2010
(in thousands, except per share data)For the Year Ended December 31:Revenues . . . . . . . . . . . . . . . . . . . . . . . . . . . . . . . $ 10,262,681 $ 8,843,189 $ 7,346,472 $ 6,121,156 $ 4,592,389Income from operations . . . . . . . . . . . . . . . . . . . 1,884,878 1,677,910 1,361,496 1,136,468 861,852Net income . . . . . . . . . . . . . . . . . . . . . . . . . . . . . $ 1,439,267 $ 1,228,578 $ 1,051,263 $ 883,618 $ 733,540Basic earnings per share . . . . . . . . . . . . . . . . . . . $ 2.37 $ 2.03 $ 1.74 $ 1.46 $ 1.22
Diluted earnings per share . . . . . . . . . . . . . . . . . . $ 2.35 $ 2.02 $ 1.72 $ 1.42 $ 1.19
Cash dividends declared per common share . . . . $ — $ — $ — $ — $ —
Weighted average number of common sharesoutstanding-Basic . . . . . . . . . . . . . . . . . . . . 608,126 604,015 602,582 606,553 601,561
Weighted average number of common sharesoutstanding-Diluted . . . . . . . . . . . . . . . . . . . 612,489 609,662 611,722 620,702 618,273
As of December 31:Cash, cash equivalents and short-term
investments . . . . . . . . . . . . . . . . . . . . . . . . . $ 3,774,726 $3,747,473 $2,863,758 $2,432,264 $2,226,388Working capital . . . . . . . . . . . . . . . . . . . . . . . . 4,158,203 4,373,374 3,436,964 2,875,801 2,587,508Total assets(1) . . . . . . . . . . . . . . . . . . . . . . . . . . 11,718,916 8,134,718 6,455,617 5,484,228 4,575,636Total debt . . . . . . . . . . . . . . . . . . . . . . . . . . . . . 1,637,502 — — — —Stockholders’ equity . . . . . . . . . . . . . . . . . . . . 7,740,218 6,135,791 4,854,383 3,952,886 3,584,431
(1) In July 2013, the Financial Accounting Standards Board, or FASB, issued new guidance which requires thenetting of any unrecognized tax benefits against all available same-jurisdiction deferred income taxcarryforward assets that would apply if the uncertain tax positions were settled. We adopted this standard onJanuary 1, 2014. As of December 31, 2014, we netted an unrecognized tax benefit of $94.8 million againstsame-jurisdiction non-current deferred income tax assets. In addition, we conformed prior year’spresentation to current year’s presentation. This had the effect of reducing “total assets” by $74.2 million,$66.0 million, $23.7 million, and $7.4 million as of December 31, 2013, 2012, 2011, and 2010, respectively.
44
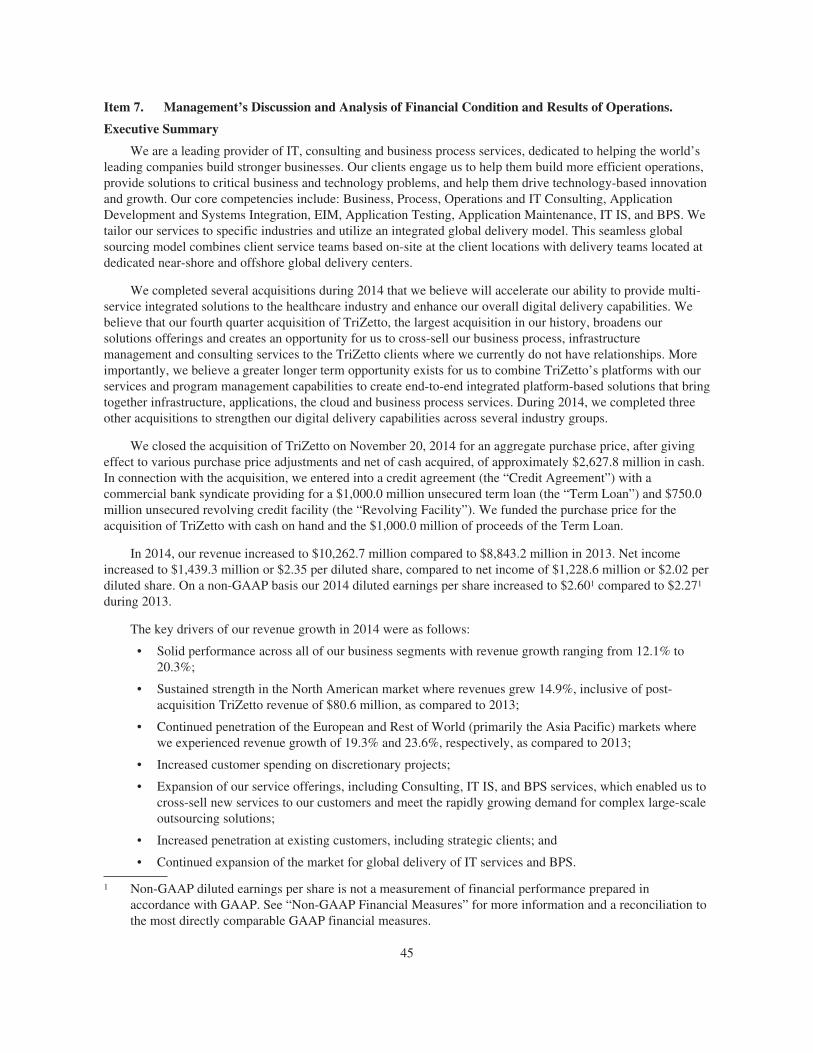
Item 7. Management’s Discussion and Analysis of Financial Condition and Results of Operations.
Executive Summary
We are a leading provider of IT, consulting and business process services, dedicated to helping the world’sleading companies build stronger businesses. Our clients engage us to help them build more efficient operations,provide solutions to critical business and technology problems, and help them drive technology-based innovationand growth. Our core competencies include: Business, Process, Operations and IT Consulting, ApplicationDevelopment and Systems Integration, EIM, Application Testing, Application Maintenance, IT IS, and BPS. Wetailor our services to specific industries and utilize an integrated global delivery model. This seamless globalsourcing model combines client service teams based on-site at the client locations with delivery teams located atdedicated near-shore and offshore global delivery centers.
We completed several acquisitions during 2014 that we believe will accelerate our ability to provide multi-service integrated solutions to the healthcare industry and enhance our overall digital delivery capabilities. Webelieve that our fourth quarter acquisition of TriZetto, the largest acquisition in our history, broadens oursolutions offerings and creates an opportunity for us to cross-sell our business process, infrastructuremanagement and consulting services to the TriZetto clients where we currently do not have relationships. Moreimportantly, we believe a greater longer term opportunity exists for us to combine TriZetto’s platforms with ourservices and program management capabilities to create end-to-end integrated platform-based solutions that bringtogether infrastructure, applications, the cloud and business process services. During 2014, we completed threeother acquisitions to strengthen our digital delivery capabilities across several industry groups.
We closed the acquisition of TriZetto on November 20, 2014 for an aggregate purchase price, after givingeffect to various purchase price adjustments and net of cash acquired, of approximately $2,627.8 million in cash.In connection with the acquisition, we entered into a credit agreement (the “Credit Agreement”) with acommercial bank syndicate providing for a $1,000.0 million unsecured term loan (the “Term Loan”) and $750.0million unsecured revolving credit facility (the “Revolving Facility”). We funded the purchase price for theacquisition of TriZetto with cash on hand and the $1,000.0 million of proceeds of the Term Loan.
In 2014, our revenue increased to $10,262.7 million compared to $8,843.2 million in 2013. Net incomeincreased to $1,439.3 million or $2.35 per diluted share, compared to net income of $1,228.6 million or $2.02 perdiluted share. On a non-GAAP basis our 2014 diluted earnings per share increased to $2.601 compared to $2.271
during 2013.
The key drivers of our revenue growth in 2014 were as follows:
• Solid performance across all of our business segments with revenue growth ranging from 12.1% to20.3%;
• Sustained strength in the North American market where revenues grew 14.9%, inclusive of post-acquisition TriZetto revenue of $80.6 million, as compared to 2013;
• Continued penetration of the European and Rest of World (primarily the Asia Pacific) markets wherewe experienced revenue growth of 19.3% and 23.6%, respectively, as compared to 2013;
• Increased customer spending on discretionary projects;
• Expansion of our service offerings, including Consulting, IT IS, and BPS services, which enabled us tocross-sell new services to our customers and meet the rapidly growing demand for complex large-scaleoutsourcing solutions;
• Increased penetration at existing customers, including strategic clients; and
• Continued expansion of the market for global delivery of IT services and BPS.
1 Non-GAAP diluted earnings per share is not a measurement of financial performance prepared inaccordance with GAAP. See “Non-GAAP Financial Measures” for more information and a reconciliation tothe most directly comparable GAAP financial measures.
45
We saw a continued demand from our customers for a broad range of services, including IT strategy andbusiness consulting, application development and systems integration, EIM, application testing, applicationmaintenance, IT IS, and BPS. In addition, we are seeing increasing customer interest in digital solutions,including our social, mobile, analytics and cloud-based services and increased demand for mobility, data andsecurity services. We are also seeing an increase in demand for larger, more complex projects that aretransformational for our customers. Such contracts may have longer sales cycles and ramp-up periods and couldlead to greater variability in our period-to-period operating results. We increased the number of strategic clientsby 28 during the year, bringing the total number of our strategic clients to 271. We define a strategic client as oneoffering the potential to generate at least $5 million to $50 million or more in annual revenues at maturity.
In 2014, our operating margin decreased to approximately 18.4% compared to 19.0% in 2013. Our non-GAAP operating margin in 2014 was approximately 20.2%2 compared to 20.6%2 in 2013. The decrease in ourGAAP and non-GAAP operating margins was due to increases in compensation and benefit costs (net of theimpact of lower incentive-based compensation), subcontractor expense and investments to grow our business,partially offset by the impact of the depreciation of the Indian rupee against the U.S. dollar and lower realizedlosses on our cash flow hedges in 2014 compared to 2013. Historically, we have invested our profitability abovethe 19% to 20% non-GAAP operating margin level back into our business, which we believe is a significantcontributing factor to our strong revenue growth. This investment is primarily focused in the areas of hiring clientpartners and relationship personnel with specific industry experience or domain expertise, training our technicalstaff in a broader range of service offerings, strengthening our business analytics and digital technologycapabilities, strengthening and expanding our portfolio of services, continuing to expand our geographic presencefor both sales and delivery as well as recognizing and rewarding exceptional performance by our employees. Inaddition, this investment includes maintaining a level of resources, trained in a broad range of service offerings,to be well positioned to respond to our customer requests to take on additional projects. We expect to continue toinvest amounts in excess of our targeted operating margin levels back into the business.
We finished the year with approximately 211,500 employees, which is an increase of approximately 40,100over the prior year and includes approximately 3,770 employees from the acquisition of TriZetto. The increase inthe number of our technical personnel and the related infrastructure costs to meet the demand for our services isthe primary driver of the increase in our operating expenses in 2014. Annualized turnover, including bothvoluntary and involuntary, was approximately 14.5% for the three months ended December 31, 2014. Themajority of our turnover occurs in India. As a result, annualized attrition rates on-site at clients are below ourglobal attrition rate. In addition, attrition is weighted towards the more junior members of our staff. Historically,we have experienced increases in compensation and benefit costs, including incentive-based compensation costs,in India which may continue in the future; however, historically, this has not had a material impact on our resultsof operations as we have been able to absorb such cost increases through price increases or cost managementstrategies such as managing discretionary costs, the mix of our professional staff as well as utilization levels, andachieving other operating efficiencies.
At December 31, 2014, we had cash, cash equivalents and short-term investments of $3,774.7 million, workingcapital of $4,158.2 million and debt outstanding under the Credit Agreement of approximately $1,637.5 million.The Term Loan and the Revolving Facility both mature on November 20, 2019. As of December 31, 2014, we havedrawn down $650.0 million under the Revolving Facility, which is available for general corporate purposes. Webelieve our cash from operations and capital resources on hand provide sufficient liquidity to continue to makeinvestments to expand and grow our business, and meet our repayment obligations under the Credit Agreement.
During 2015, barring any unforeseen events, we expect the following factors to affect our business and ouroperating results:
• Continued focus by customers on directing IT spending towards cost containment projects, such asapplication maintenance, IT IS and BPS;
2 Non-GAAP operating margin is not a measurement of financial performance prepared in accordance withGAAP. See “Non-GAAP Financial Measures” for more information and a reconciliation to the most directlycomparable GAAP financial measures.
46
• Demand from our customers to help them achieve their dual mandate of simultaneously achieving costsavings while investing in innovation;
• Secular changes driven by evolving technologies and regulatory changes;
• Volatility in foreign currency rates;
• Continued uncertainty in the world economy; and
• Addition of the TriZetto business.
In response to this environment, we plan to:
• Continue to invest in our talent base and new service offerings;
• Partner with our existing customers to garner an increased portion of our customers’ overall IT spendby providing innovative solutions;
• Continue our focus on growing our business in Europe, the Middle East, the Asia Pacific andLatin America regions, where we believe there are opportunities to gain market share;
• Continue to increase our strategic customer base across all of our business segments;
• Opportunistically look for acquisitions that may improve our overall service delivery capabilities,expand our geographic presence and/or enable us to enter new areas of technology;
• Continue to focus on operating discipline in order to appropriately manage our cost structure;
• Continue to locate most of our new development center facilities in tax incentivized areas; and
• Leverage assets and capabilities obtained from the TriZetto acquisition to aggressively pursue newopportunities in the marketplace.
Business Segments
Our four reportable business segments are:
• Financial Services, which includes customers providing banking/transaction processing, capitalmarkets and insurance services;
• Healthcare, which includes healthcare providers and payers as well as life sciences customers. OurHealthcare business segment includes the post-acquisition operating results of TriZetto;
• Manufacturing/Retail/Logistics, which includes consumer goods manufacturers, retailers, travel andother hospitality customers, as well as customers providing logistics services; and
• Other, which is an aggregation of industry operating segments each of which, individually, representsless than 10.0% of consolidated revenues and segment operating profit. The Other segment includesinformation, media and entertainment services, communications, and high technology operatingcustomers.
Our chief operating decision maker evaluates Cognizant’s performance and allocates resources based onsegment revenues and operating profit. Segment operating profit is defined as income from operations beforeunallocated costs. Generally, operating expenses for each operating segment have similar characteristics and aresubject to the same factors, pressures and challenges. However, the economic environment and its effects onindustries served by our operating groups may affect revenue and operating expenses to different degrees.Expenses included in segment operating profit consist principally of direct selling and delivery costs as well as aper seat charge for use of the development and delivery centers. Certain selling, general and administrativeexpenses, excess or shortfall of incentive compensation for delivery personnel as compared to target, stock-basedcompensation expense, a portion of depreciation and amortization and the impact of the settlements of our cashflow hedges are not allocated to individual segments in internal management reports used by the chief operatingdecision maker. Accordingly, such expenses are excluded from segment operating profit.
47
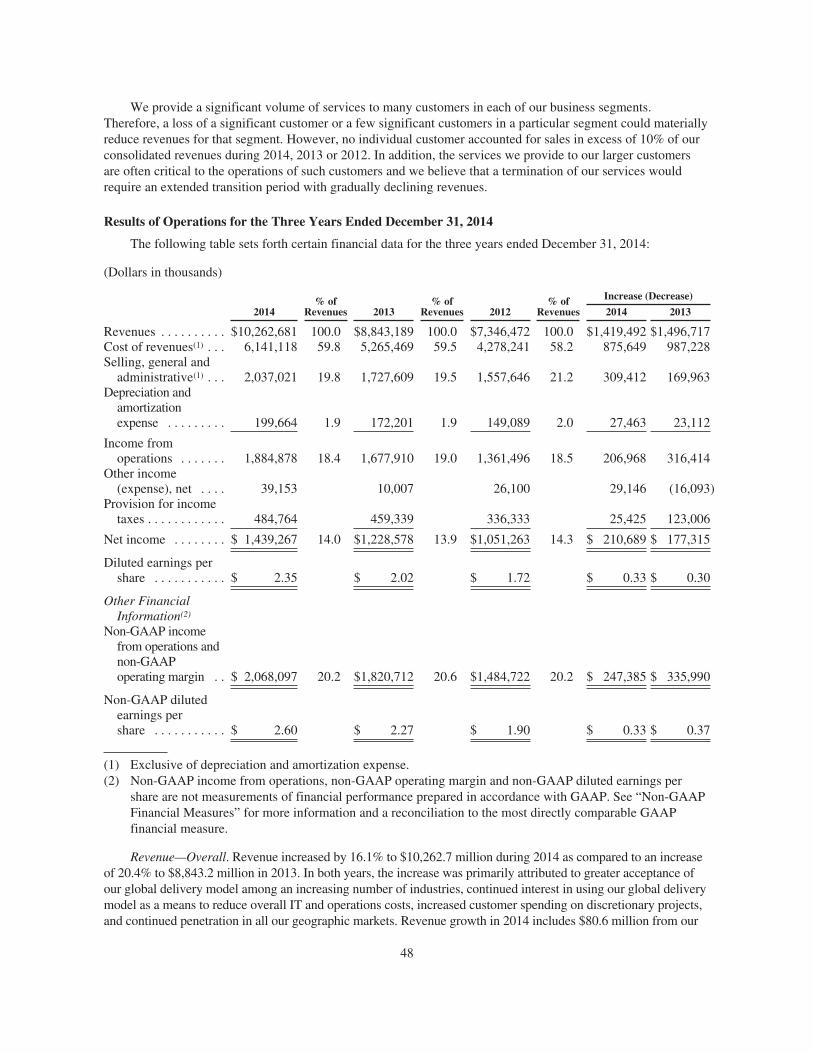
We provide a significant volume of services to many customers in each of our business segments.Therefore, a loss of a significant customer or a few significant customers in a particular segment could materiallyreduce revenues for that segment. However, no individual customer accounted for sales in excess of 10% of ourconsolidated revenues during 2014, 2013 or 2012. In addition, the services we provide to our larger customersare often critical to the operations of such customers and we believe that a termination of our services wouldrequire an extended transition period with gradually declining revenues.
Results of Operations for the Three Years Ended December 31, 2014
The following table sets forth certain financial data for the three years ended December 31, 2014:
(Dollars in thousands)
2014% of
Revenues 2013% of
Revenues 2012% of
Revenues
Increase (Decrease)
2014 2013
Revenues . . . . . . . . . . $10,262,681 100.0 $8,843,189 100.0 $7,346,472 100.0 $1,419,492 $1,496,717Cost of revenues(1) . . . 6,141,118 59.8 5,265,469 59.5 4,278,241 58.2 875,649 987,228Selling, general and
administrative(1) . . . 2,037,021 19.8 1,727,609 19.5 1,557,646 21.2 309,412 169,963Depreciation and
amortizationexpense . . . . . . . . . 199,664 1.9 172,201 1.9 149,089 2.0 27,463 23,112
Income fromoperations . . . . . . . 1,884,878 18.4 1,677,910 19.0 1,361,496 18.5 206,968 316,414
Other income(expense), net . . . . 39,153 10,007 26,100 29,146 (16,093)
Provision for incometaxes . . . . . . . . . . . . 484,764 459,339 336,333 25,425 123,006
Net income . . . . . . . . $ 1,439,267 14.0 $1,228,578 13.9 $1,051,263 14.3 $ 210,689 $ 177,315
Diluted earnings pershare . . . . . . . . . . . $ 2.35 $ 2.02 $ 1.72 $ 0.33 $ 0.30
Other FinancialInformation(2)
Non-GAAP incomefrom operations andnon-GAAPoperating margin . . $ 2,068,097 20.2 $1,820,712 20.6 $1,484,722 20.2 $ 247,385 $ 335,990
Non-GAAP dilutedearnings pershare . . . . . . . . . . . $ 2.60 $ 2.27 $ 1.90 $ 0.33 $ 0.37
(1) Exclusive of depreciation and amortization expense.(2) Non-GAAP income from operations, non-GAAP operating margin and non-GAAP diluted earnings per
share are not measurements of financial performance prepared in accordance with GAAP. See “Non-GAAPFinancial Measures” for more information and a reconciliation to the most directly comparable GAAPfinancial measure.
Revenue—Overall. Revenue increased by 16.1% to $10,262.7 million during 2014 as compared to an increaseof 20.4% to $8,843.2 million in 2013. In both years, the increase was primarily attributed to greater acceptance ofour global delivery model among an increasing number of industries, continued interest in using our global deliverymodel as a means to reduce overall IT and operations costs, increased customer spending on discretionary projects,and continued penetration in all our geographic markets. Revenue growth in 2014 includes $80.6 million from our
48
November 2014 acquisition of TriZetto. Revenues from new customers contributed $298.1 million and $243.4million, representing 21.0% and 16.3% of the year-over-year revenue growth for 2014 and 2013, respectively. In2014, our consulting and technology services revenues increased by approximately 22.1% and representedapproximately 52.8% of total 2014 revenues, while our outsourcing services revenue increased by approximately10.0% and constituted approximately 47.2% of total revenues. In 2013, consulting and technology services revenueincreased by 18.3% and represented approximately 50.2% of total 2013 revenues, while our outsourcing servicesincreased by approximately 22.6% and constituted approximately 49.8% of total 2013 revenues.
Revenues from our top five customers as a percentage of total revenues were 12.2%, 13.2% and 14.0% in2014, 2013 and 2012, respectively. Revenues from our top ten customers as a percentage of total revenues were21.3%, 22.6% and 25.0% in 2014, 2013 and 2012, respectively. As we continue to add new customers andincrease our penetration at existing customers, we expect the percentage of revenues from our top five and topten customers to continue to decline over time.
Revenue—Reportable Segments. Revenues by reportable business segment were as follows:
(Dollars in thousands)
2014 2013 2012
Increase
2014 2013
$ % $ %
Financial services . . . . . . . . . . . . $ 4,285,614 $3,717,573 $3,035,447 $ 568,041 15.3 $ 682,126 22.5Healthcare . . . . . . . . . . . . . . . . . . 2,689,427 2,264,826 1,934,898 424,601 18.7 329,928 17.1Manufacturing/Retail/Logistics . 2,093,560 1,868,305 1,498,668 225,255 12.1 369,637 24.7Other . . . . . . . . . . . . . . . . . . . . . . 1,194,080 992,485 877,459 201,595 20.3 115,026 13.1
Total revenue . . . . . . . . . . . $10,262,681 $8,843,189 $7,346,472 $1,419,492 16.1 $1,496,717 20.4
Revenue from our Financial Services segment grew 15.3% or $568.0 million in 2014, as compared to 2013.Our banking and insurance customers contributed approximately $344.1 million and $223.9 million, respectively,to the year-over-year revenue increase. In this segment, revenue from customers added during 2014 wasapproximately $49.6 million and represented 8.7% of the year-over-year revenue increase in this segment. Keyareas of focus for our Financial Services customers included cost optimization, regulatory and compliance driveninitiatives, risk management, and the adoption and integration of digital technologies to align with shifts inconsumer preferences. Revenue from our Financial Services segment grew 22.5% or $682.1 million in 2013, ascompared to 2012. This strength was driven by revenue growth of $494.1 million from our banking customerswho benefited from the improving economy. In 2013, revenue from customers added during that year wasapproximately $75.3 million and represented 11.0% of the year-over-year revenue increase in this segment.
Revenue from our Healthcare segment grew 18.7% or $424.6 million in 2014, as compared to 2013. During2014, revenue growth was stronger among our healthcare customers, where revenue increased by approximately$340.3 million as compared to an increase of approximately $84.3 million from our life sciences customers.Revenue growth among our healthcare customers includes $80.6 million from our November 20, 2014acquisition of TriZetto. Revenue from customers added during 2014, including new customers from ouracquisition of TriZetto, was approximately $158.1 million and represented 37.2% of the year-over-year revenueincrease in this segment. Although discretionary spending by our healthcare customers recently has beennegatively affected by uncertainty created by regulatory changes, including the Affordable Care Act initiatives inthe United States, we believe that the healthcare industry continues to present a growth opportunity in the longterm. Additionally, in 2014, IT spending by some of our life sciences customers has been and may continue to beadversely impacted by the patent cliff affecting the pharmaceutical industry. Revenue from our Healthcaresegment grew 17.1% or $329.9 million in 2013, as compared to 2012. In 2013, growth within the segment wasdriven by work related to Affordable Care Act initiatives, including extended support for member enrollment andthe implementation of direct to customer programs through mobile platforms. Revenue from customers addedduring 2013 was approximately $30.4 million and represented 9.2% of the year-over-year revenue increase inthis segment.
49
Revenue from our Manufacturing/Retail/Logistics segment grew 12.1% or $225.3 million in 2014, ascompared to 2013. During 2014, growth was stronger among our manufacturing and logistics customers, whererevenue increased by approximately $124.4 million as compared to approximately $100.8 million for our retailand hospitality customers. Revenue from customers added during 2014 was approximately $59.6 million andrepresented 26.5% of the year-over-year revenue increase in this segment. Demand within this segment continuesto be driven by multichannel commerce implementation and integration efforts, analytics, supply chainconsulting and implementation initiatives, and increased adoption of digital technologies to align with shifts inconsumer preferences. Discretionary spending by our retail customers has been and may continue to be affectedby recent weakness in the retail sector. Revenue from our Manufacturing/Retail/Logistics segment grew 24.7%or $369.6 million in 2013, as compared to 2012. In 2013, growth within this segment was stronger among ourmanufacturing and logistics customers, where revenue increased by approximately $200.0 million, while revenuefor our retail and hospitality customers increased by approximately $169.6 million. In 2013, revenue fromcustomers added during that year was approximately $79.9 million and represented 21.6% of the year-over-yearrevenue increase in this segment.
Revenue from our Other segment grew 20.3% or $201.6 million in 2014, as compared to 2013. In 2014,growth within Other was strong among our telecommunication and high technology customers, where revenueincreased by approximately $93.3 million and $71.0 million, respectively, due to an increase in discretionaryspending. Revenue from customers added during 2014 was approximately $30.8 million and represented 15.3%of the year-over-year revenue increase in this segment. Revenue from our Other segment grew 13.1% or$115.0 million in 2013, as compared to 2012. In 2013, growth within Other was particularly strong among ourhigh technology customers, where revenue increased by approximately $54.0 million due to an increase indiscretionary spending. In 2013, revenue from customers added during that year was approximately $57.9 millionand represented 50.3% of the year-over-year revenue increase in this segment.
Revenue—Geographic Locations. Revenues by geographic market, as determined by customer location,were as follows:
(Dollars in thousands)
2014 2013 2012
Increase
2014 2013
$ % $ %
North America . . . . . . . . . . . . $ 7,879,785 $6,860,067 $5,836,258 $1,019,718 14.9 $1,023,809 17.5
United Kingdom . . . . . . 1,099,178 942,579 764,936 156,599 16.6 177,643 23.2Rest of Europe . . . . . . . . 784,412 636,626 430,554 147,786 23.2 206,072 47.9
Europe—Total . . . . . . . . . . . . 1,883,590 1,579,205 1,195,490 304,385 19.3 383,715 32.1
Rest of World . . . . . . . . . . . . 499,306 403,917 314,724 95,389 23.6 89,193 28.3
Total revenue . . . . . $10,262,681 $8,843,189 $7,346,472 $1,419,492 16.1 $1,496,717 20.4
North America continues to be our largest market representing approximately 76.8% of total revenue in2014 and accounting for $1,019.7 million of the $1,419.5 million revenue increase in 2014. Revenue growthamong our North America customers includes $80.6 million from our November 20, 2014 acquisition ofTriZetto. Revenue from Europe grew 19.3% in 2014 driven by the increasing acceptance of our global deliverymodel. Revenue growth in 2014 for our Rest of Europe market includes the full-year benefit of our acquisition ofEquinox Consulting, which closed in the fourth quarter of 2013. We believe the European market is under-penetrated and represents a significant future growth opportunity for us. In 2013, revenue in Europe grew 32.1%.Excluding approximately $93.5 million of revenue from our 2013 acquisitions of the C1 group companies andEquinox Consulting, revenue from Europe grew 24.3% in 2013. The 2013 revenue growth in Europe was drivenby the strength of Europe’s economy and the increasing acceptance of our global delivery model. Revenue
50
growth from Rest of World customers in 2014 was primarily driven by the India, Singapore, Australia, Japan andHong Kong markets. In 2013, the revenue growth for Rest of World was driven primarily by the Middle East,Singapore and India markets. We believe that Europe, the Middle East, the Asia Pacific and Latin Americaregions will continue to be areas of significant investment for us as we see these regions as growth opportunitiesfor the long term. In 2015, we expect the recent strength of the U.S. dollar to negatively impact our revenue fromcountries outside the United States, primarily Eurozone countries and the U.K.
Cost of Revenues (Exclusive of Depreciation and Amortization Expense). Our cost of revenues consistsprimarily of salaries, incentive-based compensation, stock-based compensation expense, payroll taxes, employeebenefits, immigration and project-related travel for technical personnel, subcontracting and sales commissionsrelated to revenues. Our cost of revenues increased by 16.6% or $875.6 million during 2014 as compared to anincrease of approximately 23.1% or $987.2 million during 2013. In both 2014 and 2013, the increase was dueprimarily to an increase in compensation and benefits costs. In 2014, compensation and benefit costs increased byapproximately $650.6 million as a result of the increase in the number of our technical personnel, partially offset bylower incentive-based compensation costs in 2014 as compared to 2013. In 2013, the increase in compensation andbenefit costs, including incentive-based compensation, was approximately $870.2 million as a result of the increasein the number of our technical personnel and higher accrual of individual bonus payouts as compared to 2012.
Selling, General and Administrative Expenses. Selling, general and administrative expenses consistprimarily of salaries, incentive-based compensation, stock-based compensation expense, payroll taxes, employeebenefits, immigration, travel, marketing, communications, management, finance, administrative and occupancycosts. Selling, general and administrative expenses, including depreciation and amortization, increased by 17.7%or $336.9 million during 2014 as compared to an increase of approximately 11.3% or $193.1 million during2013. Selling, general and administrative expenses, including depreciation and amortization, increased as apercentage of revenue to 21.8% in 2014 as compared to 21.5% in 2013 and 23.2% in 2012. In 2014, the increaseas a percentage of revenue was due primarily to an increase in compensation and benefit costs (net of the impactof lower incentive-based compensation costs), professional services, including acquisition-related costs, andinvestments to grow our business, partially offset by the favorable impact of the depreciation of the Indian rupeeversus the U.S. dollar, and lower realized losses on our cash flow hedges in 2014 compared to 2013.
Income from Operations and Operating Margin—Overall. Income from operations increased 12.3%, orapproximately $207.0 million in 2014 as compared to an increase of 23.2% or approximately $316.4 million in2013. Our operating margin decreased to 18.4% of revenues in 2014 from 19.0% of revenues in 2013, due toincreases in compensation and benefit costs (net of the impact of lower incentive-based compensation),subcontractor expense, professional fees and investments to grow our business, partially offset by the impact of thedepreciation of the Indian rupee against the U.S. dollar and lower realized losses on our cash flow hedges in 2014compared to 2013. In 2013, operating margin increased to 19.0% of revenues from 18.5% of revenues in 2012, dueto revenue growth outpacing headcount growth and the impact of the depreciation of the Indian rupee against theU.S. dollar, net of losses on our cash flow hedges, partially offset by increases in compensation and benefit costs,including incentive-based compensation costs. Excluding the impact of applicable designated cash flow hedges, thedepreciation of the Indian rupee against the U.S. dollar positively impacted our operating margin by approximately86 basis points or 0.86 percentage points in 2014 and 209 basis points or 2.09 percentage points in 2013. Eachadditional 1.0% change in exchange rate between the Indian rupee and the U.S. dollar will have the effect of movingour operating margin by approximately 20 basis points or 0.20 percentage points.
We entered into foreign exchange forward contracts to hedge certain Indian rupee denominated payments inIndia. These hedges are intended to mitigate the volatility of the changes in the exchange rate between the U.S.dollar and the Indian rupee. During the years ended December 31, 2014 , 2013 and 2012, the settlement of certaincash flow hedges negatively impacted our operating margin by approximately 133 basis points or 1.33 percentagepoints, 184 basis points or 1.84 percentage points, and 131 basis points or 1.31 percentage points, respectively.
51
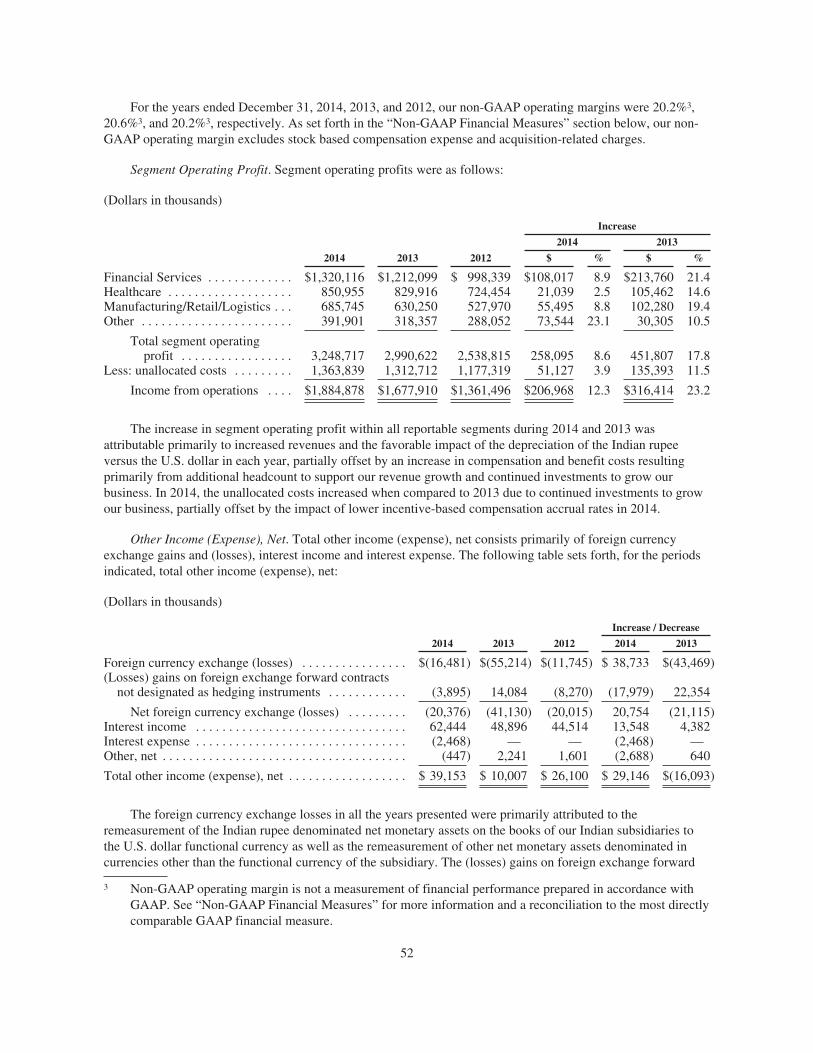
For the years ended December 31, 2014, 2013, and 2012, our non-GAAP operating margins were 20.2%3,20.6%3, and 20.2%3, respectively. As set forth in the “Non-GAAP Financial Measures” section below, our non-GAAP operating margin excludes stock based compensation expense and acquisition-related charges.
Segment Operating Profit. Segment operating profits were as follows:
(Dollars in thousands)
2014 2013 2012
Increase
2014 2013
$ % $ %
Financial Services . . . . . . . . . . . . . $1,320,116 $1,212,099 $ 998,339 $108,017 8.9 $213,760 21.4Healthcare . . . . . . . . . . . . . . . . . . . 850,955 829,916 724,454 21,039 2.5 105,462 14.6Manufacturing/Retail/Logistics . . . 685,745 630,250 527,970 55,495 8.8 102,280 19.4Other . . . . . . . . . . . . . . . . . . . . . . . 391,901 318,357 288,052 73,544 23.1 30,305 10.5
Total segment operatingprofit . . . . . . . . . . . . . . . . . 3,248,717 2,990,622 2,538,815 258,095 8.6 451,807 17.8
Less: unallocated costs . . . . . . . . . 1,363,839 1,312,712 1,177,319 51,127 3.9 135,393 11.5
Income from operations . . . . $1,884,878 $1,677,910 $1,361,496 $206,968 12.3 $316,414 23.2
The increase in segment operating profit within all reportable segments during 2014 and 2013 wasattributable primarily to increased revenues and the favorable impact of the depreciation of the Indian rupeeversus the U.S. dollar in each year, partially offset by an increase in compensation and benefit costs resultingprimarily from additional headcount to support our revenue growth and continued investments to grow ourbusiness. In 2014, the unallocated costs increased when compared to 2013 due to continued investments to growour business, partially offset by the impact of lower incentive-based compensation accrual rates in 2014.
Other Income (Expense), Net. Total other income (expense), net consists primarily of foreign currencyexchange gains and (losses), interest income and interest expense. The following table sets forth, for the periodsindicated, total other income (expense), net:
(Dollars in thousands)
2014 2013 2012
Increase / Decrease
2014 2013
Foreign currency exchange (losses) . . . . . . . . . . . . . . . . $(16,481) $(55,214) $(11,745) $ 38,733 $(43,469)(Losses) gains on foreign exchange forward contracts
not designated as hedging instruments . . . . . . . . . . . . (3,895) 14,084 (8,270) (17,979) 22,354
Net foreign currency exchange (losses) . . . . . . . . . (20,376) (41,130) (20,015) 20,754 (21,115)Interest income . . . . . . . . . . . . . . . . . . . . . . . . . . . . . . . . 62,444 48,896 44,514 13,548 4,382Interest expense . . . . . . . . . . . . . . . . . . . . . . . . . . . . . . . . (2,468) — — (2,468) —Other, net . . . . . . . . . . . . . . . . . . . . . . . . . . . . . . . . . . . . . (447) 2,241 1,601 (2,688) 640
Total other income (expense), net . . . . . . . . . . . . . . . . . . $ 39,153 $ 10,007 $ 26,100 $ 29,146 $(16,093)
The foreign currency exchange losses in all the years presented were primarily attributed to theremeasurement of the Indian rupee denominated net monetary assets on the books of our Indian subsidiaries tothe U.S. dollar functional currency as well as the remeasurement of other net monetary assets denominated incurrencies other than the functional currency of the subsidiary. The (losses) gains on foreign exchange forward
3 Non-GAAP operating margin is not a measurement of financial performance prepared in accordance withGAAP. See “Non-GAAP Financial Measures” for more information and a reconciliation to the most directlycomparable GAAP financial measure.
52
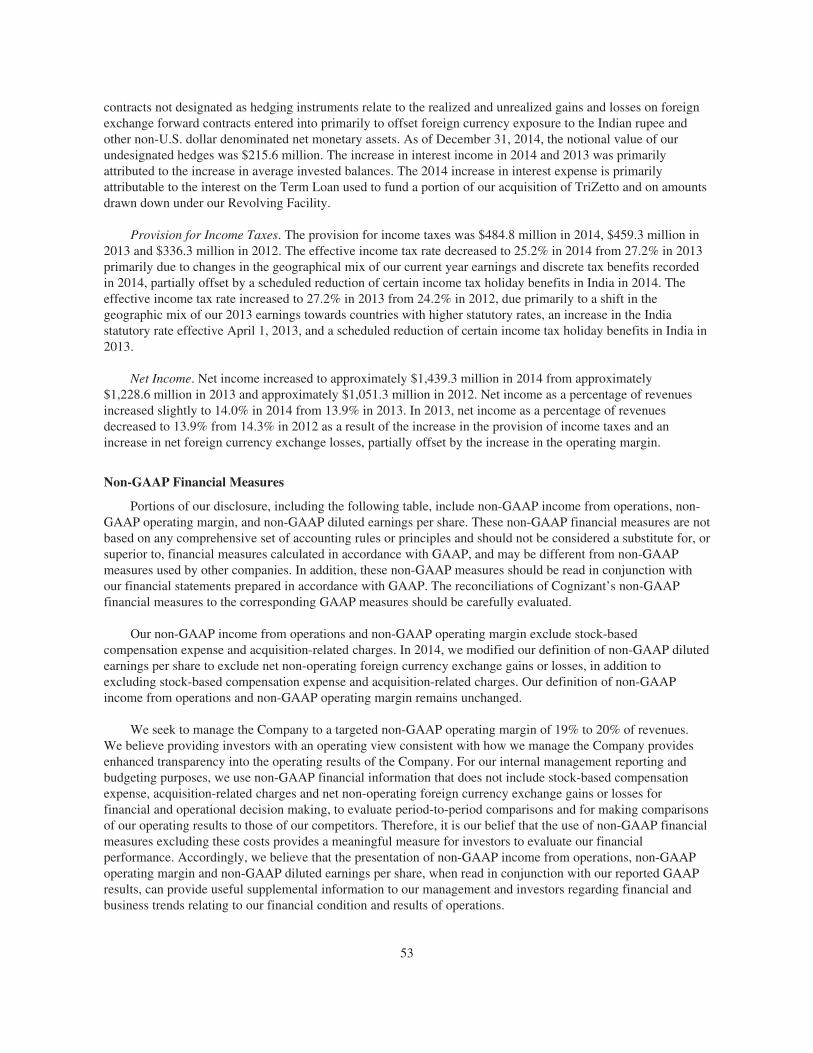
contracts not designated as hedging instruments relate to the realized and unrealized gains and losses on foreignexchange forward contracts entered into primarily to offset foreign currency exposure to the Indian rupee andother non-U.S. dollar denominated net monetary assets. As of December 31, 2014, the notional value of ourundesignated hedges was $215.6 million. The increase in interest income in 2014 and 2013 was primarilyattributed to the increase in average invested balances. The 2014 increase in interest expense is primarilyattributable to the interest on the Term Loan used to fund a portion of our acquisition of TriZetto and on amountsdrawn down under our Revolving Facility.
Provision for Income Taxes. The provision for income taxes was $484.8 million in 2014, $459.3 million in2013 and $336.3 million in 2012. The effective income tax rate decreased to 25.2% in 2014 from 27.2% in 2013primarily due to changes in the geographical mix of our current year earnings and discrete tax benefits recordedin 2014, partially offset by a scheduled reduction of certain income tax holiday benefits in India in 2014. Theeffective income tax rate increased to 27.2% in 2013 from 24.2% in 2012, due primarily to a shift in thegeographic mix of our 2013 earnings towards countries with higher statutory rates, an increase in the Indiastatutory rate effective April 1, 2013, and a scheduled reduction of certain income tax holiday benefits in India in2013.
Net Income. Net income increased to approximately $1,439.3 million in 2014 from approximately$1,228.6 million in 2013 and approximately $1,051.3 million in 2012. Net income as a percentage of revenuesincreased slightly to 14.0% in 2014 from 13.9% in 2013. In 2013, net income as a percentage of revenuesdecreased to 13.9% from 14.3% in 2012 as a result of the increase in the provision of income taxes and anincrease in net foreign currency exchange losses, partially offset by the increase in the operating margin.
Non-GAAP Financial Measures
Portions of our disclosure, including the following table, include non-GAAP income from operations, non-GAAP operating margin, and non-GAAP diluted earnings per share. These non-GAAP financial measures are notbased on any comprehensive set of accounting rules or principles and should not be considered a substitute for, orsuperior to, financial measures calculated in accordance with GAAP, and may be different from non-GAAPmeasures used by other companies. In addition, these non-GAAP measures should be read in conjunction withour financial statements prepared in accordance with GAAP. The reconciliations of Cognizant’s non-GAAPfinancial measures to the corresponding GAAP measures should be carefully evaluated.
Our non-GAAP income from operations and non-GAAP operating margin exclude stock-basedcompensation expense and acquisition-related charges. In 2014, we modified our definition of non-GAAP dilutedearnings per share to exclude net non-operating foreign currency exchange gains or losses, in addition toexcluding stock-based compensation expense and acquisition-related charges. Our definition of non-GAAPincome from operations and non-GAAP operating margin remains unchanged.
We seek to manage the Company to a targeted non-GAAP operating margin of 19% to 20% of revenues.We believe providing investors with an operating view consistent with how we manage the Company providesenhanced transparency into the operating results of the Company. For our internal management reporting andbudgeting purposes, we use non-GAAP financial information that does not include stock-based compensationexpense, acquisition-related charges and net non-operating foreign currency exchange gains or losses forfinancial and operational decision making, to evaluate period-to-period comparisons and for making comparisonsof our operating results to those of our competitors. Therefore, it is our belief that the use of non-GAAP financialmeasures excluding these costs provides a meaningful measure for investors to evaluate our financialperformance. Accordingly, we believe that the presentation of non-GAAP income from operations, non-GAAPoperating margin and non-GAAP diluted earnings per share, when read in conjunction with our reported GAAPresults, can provide useful supplemental information to our management and investors regarding financial andbusiness trends relating to our financial condition and results of operations.
53
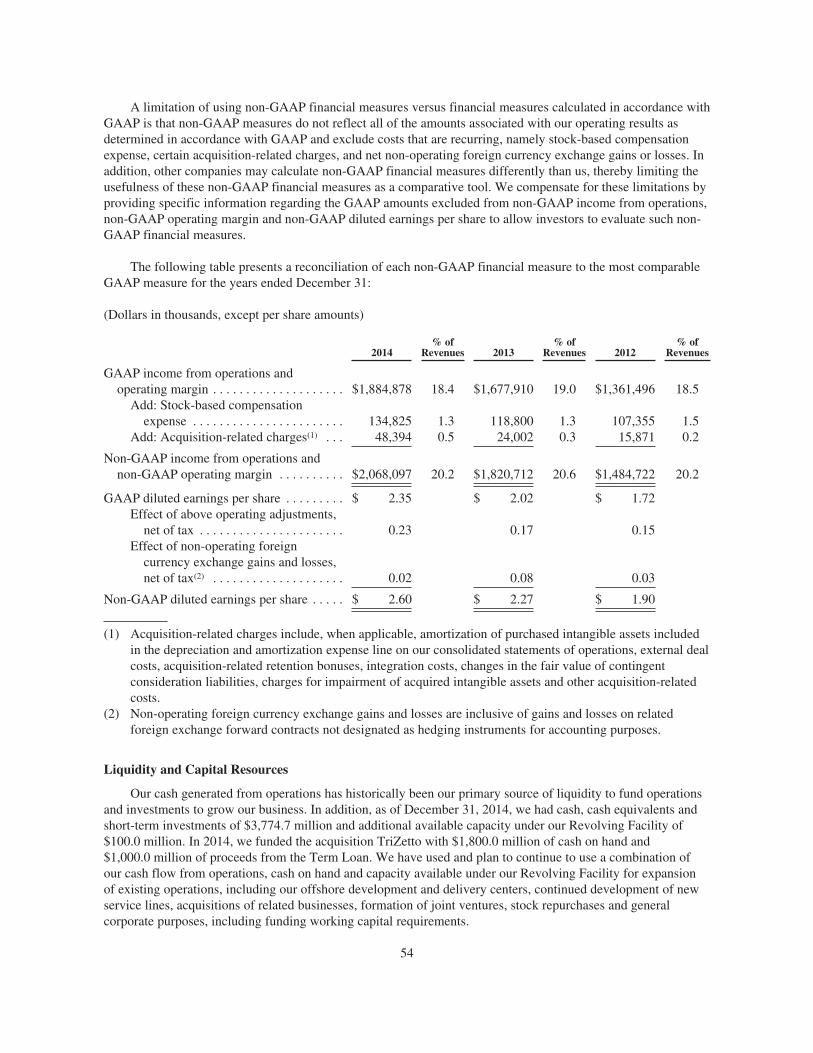
A limitation of using non-GAAP financial measures versus financial measures calculated in accordance withGAAP is that non-GAAP measures do not reflect all of the amounts associated with our operating results asdetermined in accordance with GAAP and exclude costs that are recurring, namely stock-based compensationexpense, certain acquisition-related charges, and net non-operating foreign currency exchange gains or losses. Inaddition, other companies may calculate non-GAAP financial measures differently than us, thereby limiting theusefulness of these non-GAAP financial measures as a comparative tool. We compensate for these limitations byproviding specific information regarding the GAAP amounts excluded from non-GAAP income from operations,non-GAAP operating margin and non-GAAP diluted earnings per share to allow investors to evaluate such non-GAAP financial measures.
The following table presents a reconciliation of each non-GAAP financial measure to the most comparableGAAP measure for the years ended December 31:
(Dollars in thousands, except per share amounts)
2014% of
Revenues 2013% of
Revenues 2012% of
Revenues
GAAP income from operations andoperating margin . . . . . . . . . . . . . . . . . . . . $1,884,878 18.4 $1,677,910 19.0 $1,361,496 18.5
Add: Stock-based compensationexpense . . . . . . . . . . . . . . . . . . . . . . . 134,825 1.3 118,800 1.3 107,355 1.5
Add: Acquisition-related charges(1) . . . 48,394 0.5 24,002 0.3 15,871 0.2
Non-GAAP income from operations andnon-GAAP operating margin . . . . . . . . . . $2,068,097 20.2 $1,820,712 20.6 $1,484,722 20.2
GAAP diluted earnings per share . . . . . . . . . $ 2.35 $ 2.02 $ 1.72Effect of above operating adjustments,
net of tax . . . . . . . . . . . . . . . . . . . . . . 0.23 0.17 0.15Effect of non-operating foreign
currency exchange gains and losses,net of tax(2) . . . . . . . . . . . . . . . . . . . . 0.02 0.08 0.03
Non-GAAP diluted earnings per share . . . . . $ 2.60 $ 2.27 $ 1.90
(1) Acquisition-related charges include, when applicable, amortization of purchased intangible assets includedin the depreciation and amortization expense line on our consolidated statements of operations, external dealcosts, acquisition-related retention bonuses, integration costs, changes in the fair value of contingentconsideration liabilities, charges for impairment of acquired intangible assets and other acquisition-relatedcosts.
(2) Non-operating foreign currency exchange gains and losses are inclusive of gains and losses on relatedforeign exchange forward contracts not designated as hedging instruments for accounting purposes.
Liquidity and Capital Resources
Our cash generated from operations has historically been our primary source of liquidity to fund operationsand investments to grow our business. In addition, as of December 31, 2014, we had cash, cash equivalents andshort-term investments of $3,774.7 million and additional available capacity under our Revolving Facility of$100.0 million. In 2014, we funded the acquisition TriZetto with $1,800.0 million of cash on hand and$1,000.0 million of proceeds from the Term Loan. We have used and plan to continue to use a combination ofour cash flow from operations, cash on hand and capacity available under our Revolving Facility for expansionof existing operations, including our offshore development and delivery centers, continued development of newservice lines, acquisitions of related businesses, formation of joint ventures, stock repurchases and generalcorporate purposes, including funding working capital requirements.
54
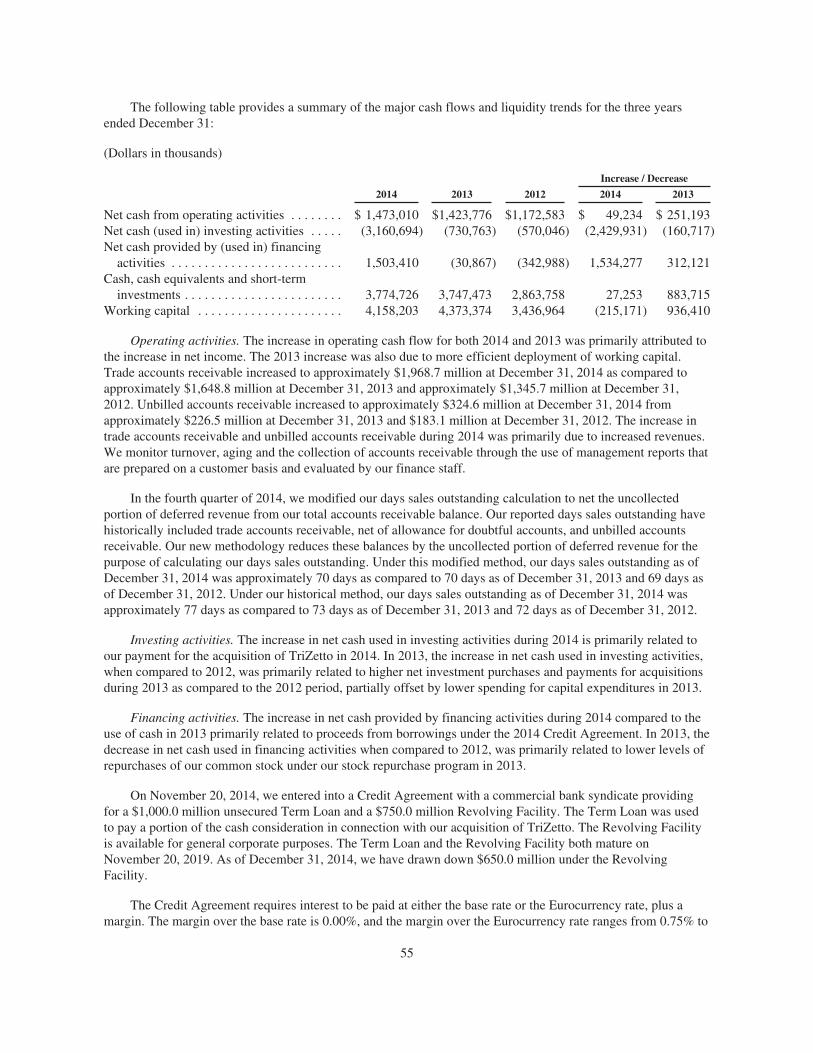
The following table provides a summary of the major cash flows and liquidity trends for the three yearsended December 31:
(Dollars in thousands)
Increase / Decrease
2014 2013 2012 2014 2013
Net cash from operating activities . . . . . . . . $ 1,473,010 $1,423,776 $1,172,583 $ 49,234 $ 251,193Net cash (used in) investing activities . . . . . (3,160,694) (730,763) (570,046) (2,429,931) (160,717)Net cash provided by (used in) financing
activities . . . . . . . . . . . . . . . . . . . . . . . . . . 1,503,410 (30,867) (342,988) 1,534,277 312,121Cash, cash equivalents and short-term
investments . . . . . . . . . . . . . . . . . . . . . . . . 3,774,726 3,747,473 2,863,758 27,253 883,715Working capital . . . . . . . . . . . . . . . . . . . . . . 4,158,203 4,373,374 3,436,964 (215,171) 936,410
Operating activities. The increase in operating cash flow for both 2014 and 2013 was primarily attributed tothe increase in net income. The 2013 increase was also due to more efficient deployment of working capital.Trade accounts receivable increased to approximately $1,968.7 million at December 31, 2014 as compared toapproximately $1,648.8 million at December 31, 2013 and approximately $1,345.7 million at December 31,2012. Unbilled accounts receivable increased to approximately $324.6 million at December 31, 2014 fromapproximately $226.5 million at December 31, 2013 and $183.1 million at December 31, 2012. The increase intrade accounts receivable and unbilled accounts receivable during 2014 was primarily due to increased revenues.We monitor turnover, aging and the collection of accounts receivable through the use of management reports thatare prepared on a customer basis and evaluated by our finance staff.
In the fourth quarter of 2014, we modified our days sales outstanding calculation to net the uncollectedportion of deferred revenue from our total accounts receivable balance. Our reported days sales outstanding havehistorically included trade accounts receivable, net of allowance for doubtful accounts, and unbilled accountsreceivable. Our new methodology reduces these balances by the uncollected portion of deferred revenue for thepurpose of calculating our days sales outstanding. Under this modified method, our days sales outstanding as ofDecember 31, 2014 was approximately 70 days as compared to 70 days as of December 31, 2013 and 69 days asof December 31, 2012. Under our historical method, our days sales outstanding as of December 31, 2014 wasapproximately 77 days as compared to 73 days as of December 31, 2013 and 72 days as of December 31, 2012.
Investing activities. The increase in net cash used in investing activities during 2014 is primarily related toour payment for the acquisition of TriZetto in 2014. In 2013, the increase in net cash used in investing activities,when compared to 2012, was primarily related to higher net investment purchases and payments for acquisitionsduring 2013 as compared to the 2012 period, partially offset by lower spending for capital expenditures in 2013.
Financing activities. The increase in net cash provided by financing activities during 2014 compared to theuse of cash in 2013 primarily related to proceeds from borrowings under the 2014 Credit Agreement. In 2013, thedecrease in net cash used in financing activities when compared to 2012, was primarily related to lower levels ofrepurchases of our common stock under our stock repurchase program in 2013.
On November 20, 2014, we entered into a Credit Agreement with a commercial bank syndicate providingfor a $1,000.0 million unsecured Term Loan and a $750.0 million Revolving Facility. The Term Loan was usedto pay a portion of the cash consideration in connection with our acquisition of TriZetto. The Revolving Facilityis available for general corporate purposes. The Term Loan and the Revolving Facility both mature onNovember 20, 2019. As of December 31, 2014, we have drawn down $650.0 million under the RevolvingFacility.
The Credit Agreement requires interest to be paid at either the base rate or the Eurocurrency rate, plus amargin. The margin over the base rate is 0.00%, and the margin over the Eurocurrency rate ranges from 0.75% to
55
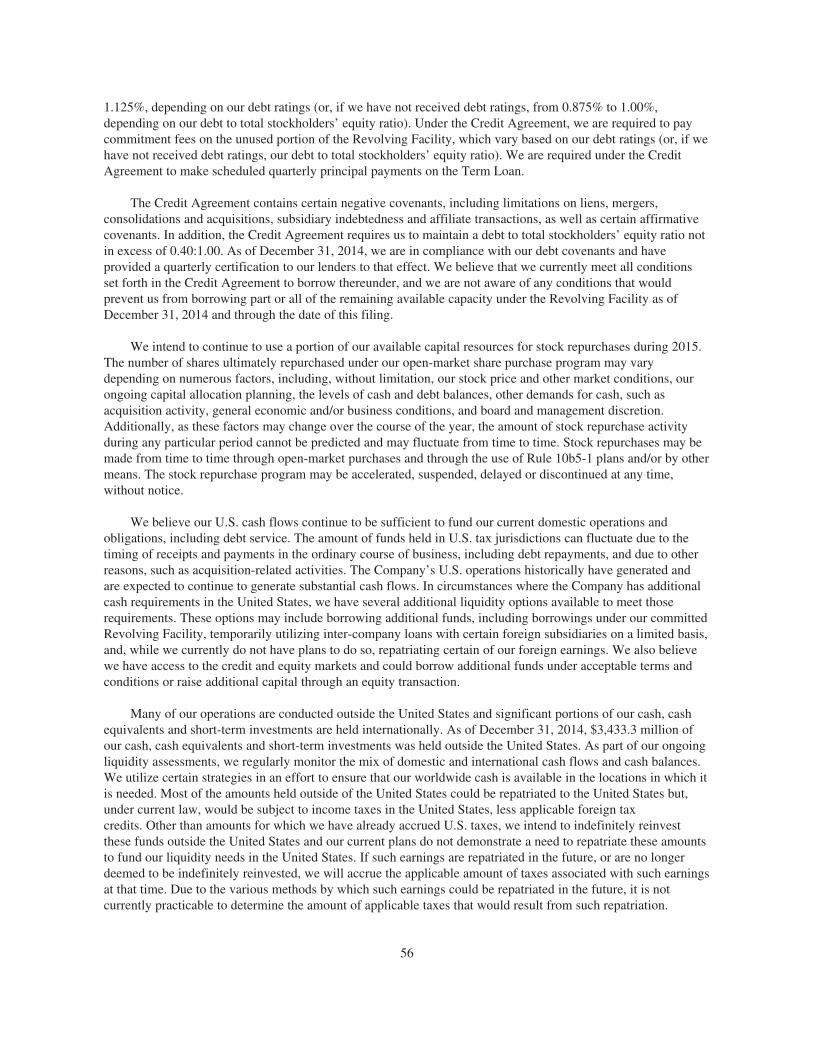
1.125%, depending on our debt ratings (or, if we have not received debt ratings, from 0.875% to 1.00%,depending on our debt to total stockholders’ equity ratio). Under the Credit Agreement, we are required to paycommitment fees on the unused portion of the Revolving Facility, which vary based on our debt ratings (or, if wehave not received debt ratings, our debt to total stockholders’ equity ratio). We are required under the CreditAgreement to make scheduled quarterly principal payments on the Term Loan.
The Credit Agreement contains certain negative covenants, including limitations on liens, mergers,consolidations and acquisitions, subsidiary indebtedness and affiliate transactions, as well as certain affirmativecovenants. In addition, the Credit Agreement requires us to maintain a debt to total stockholders’ equity ratio notin excess of 0.40:1.00. As of December 31, 2014, we are in compliance with our debt covenants and haveprovided a quarterly certification to our lenders to that effect. We believe that we currently meet all conditionsset forth in the Credit Agreement to borrow thereunder, and we are not aware of any conditions that wouldprevent us from borrowing part or all of the remaining available capacity under the Revolving Facility as ofDecember 31, 2014 and through the date of this filing.
We intend to continue to use a portion of our available capital resources for stock repurchases during 2015.The number of shares ultimately repurchased under our open-market share purchase program may varydepending on numerous factors, including, without limitation, our stock price and other market conditions, ourongoing capital allocation planning, the levels of cash and debt balances, other demands for cash, such asacquisition activity, general economic and/or business conditions, and board and management discretion.Additionally, as these factors may change over the course of the year, the amount of stock repurchase activityduring any particular period cannot be predicted and may fluctuate from time to time. Stock repurchases may bemade from time to time through open-market purchases and through the use of Rule 10b5-1 plans and/or by othermeans. The stock repurchase program may be accelerated, suspended, delayed or discontinued at any time,without notice.
We believe our U.S. cash flows continue to be sufficient to fund our current domestic operations andobligations, including debt service. The amount of funds held in U.S. tax jurisdictions can fluctuate due to thetiming of receipts and payments in the ordinary course of business, including debt repayments, and due to otherreasons, such as acquisition-related activities. The Company’s U.S. operations historically have generated andare expected to continue to generate substantial cash flows. In circumstances where the Company has additionalcash requirements in the United States, we have several additional liquidity options available to meet thoserequirements. These options may include borrowing additional funds, including borrowings under our committedRevolving Facility, temporarily utilizing inter-company loans with certain foreign subsidiaries on a limited basis,and, while we currently do not have plans to do so, repatriating certain of our foreign earnings. We also believewe have access to the credit and equity markets and could borrow additional funds under acceptable terms andconditions or raise additional capital through an equity transaction.
Many of our operations are conducted outside the United States and significant portions of our cash, cashequivalents and short-term investments are held internationally. As of December 31, 2014, $3,433.3 million ofour cash, cash equivalents and short-term investments was held outside the United States. As part of our ongoingliquidity assessments, we regularly monitor the mix of domestic and international cash flows and cash balances.We utilize certain strategies in an effort to ensure that our worldwide cash is available in the locations in which itis needed. Most of the amounts held outside of the United States could be repatriated to the United States but,under current law, would be subject to income taxes in the United States, less applicable foreign taxcredits. Other than amounts for which we have already accrued U.S. taxes, we intend to indefinitely reinvestthese funds outside the United States and our current plans do not demonstrate a need to repatriate these amountsto fund our liquidity needs in the United States. If such earnings are repatriated in the future, or are no longerdeemed to be indefinitely reinvested, we will accrue the applicable amount of taxes associated with such earningsat that time. Due to the various methods by which such earnings could be repatriated in the future, it is notcurrently practicable to determine the amount of applicable taxes that would result from such repatriation.
56
We expect our operating cash flow, cash and investment balances, and available capacity under ourRevolving Facility to be sufficient to meet our operating requirements for the next twelve months. Our ability toexpand and grow our business in accordance with current plans, to make acquisitions and form joint ventures andto meet our long-term capital requirements beyond a twelve month period will depend on many factors, includingthe rate, if any, at which our cash flow increases, our ability and willingness to accomplish acquisitions and jointventures with capital stock, our continued intent not to repatriate foreign earnings, and the availability of publicand private debt and equity financing. We cannot be certain that additional financing, if required, will beavailable on terms and conditions acceptable to us, if at all.
Commitments and Contingencies
As of December 31, 2014, we had outstanding fixed capital commitments of approximately $20.5 millionrelated to our India development center expansion program, which includes expenditures for land acquisition,facilities construction and furnishings to build new state-of-the-art development and delivery centers in regionsprimarily designated as SEZs located in India.
As of December 31, 2014, we had the following obligations and commitments to make future paymentsunder contractual obligations and commercial commitments:
Payments due by period
TotalLess than
1 year 1-3 years 3-5 yearsMore than
5 years
(in thousands)
Long-term debt obligations(1) . . . . . . . . . . . . . . . . . . $ 987,500 $ 50,000 $137,500 $800,000 $ —Interest on long-term debt(2) . . . . . . . . . . . . . . . . . . . 51,884 12,085 22,098 17,701 —Capital lease obligations . . . . . . . . . . . . . . . . . . . . . . 56,773 4,705 8,975 7,729 35,364Operating lease obligations . . . . . . . . . . . . . . . . . . . . 746,657 148,320 230,426 153,377 214,534Fixed capital commitments(3) . . . . . . . . . . . . . . . . . . 20,452 20,452 — — —Other purchase commitments(4) . . . . . . . . . . . . . . . . . 68,808 55,482 13,326 — —
Total . . . . . . . . . . . . . . . . . . . . . . . . . . . . . . . . . $1,932,074 $291,044 $412,325 $978,807 $249,898
(1) Includes scheduled repayments of our Term Loan.(2) Interest on the Term Loan was calculated at interest rates in effect as of December 31, 2014.(3) Relates to our India development and delivery center expansion program.(4) Other purchase commitments include, among other things, communications and information technology
obligations, as well as other obligations in the ordinary course of business that we cannot cancel or wherewe would be required to pay a termination fee in the event of cancellation.
As of December 31, 2014, we had $135.6 million of unrecognized tax benefits. This represents the taxbenefits associated with certain tax positions on our domestic and international tax returns that have not beenrecognized on our financial statements due to uncertainty regarding their resolution. The resolution of theseincome tax positions with the relevant taxing authorities is at various stages and therefore we are unable to makea reliable estimate of the eventual cash flows by period that may be required to settle these matters.
We have entered into a series of foreign exchange forward contracts that are designated as cash flow hedgesof certain Indian rupee denominated payments in India. As of December 31, 2014, these contracts were in a netunrealized loss position of $102.6 million and have settlement dates in 2015, 2016 and 2017. The actual amountsat which these contracts will be settled may be significantly impacted by fluctuations in the Indian rupee to U.S.dollar foreign currency exchange rate prior to settlement. Therefore, we are unable to make a reliable estimate ofthe eventual cash flows by period related to the settlement of these foreign exchange forward contracts.
We are involved in various claims and legal actions arising in the ordinary course of business. We accrue aliability when a loss is considered probable and the amount can be reasonably estimated. In the opinion of
57
management, the outcome of any existing claims and legal or regulatory proceedings, if decided adversely, is notexpected to have a material adverse effect on our business, financial condition, results of operations and cashflows. Additionally, many of our engagements involve projects that are critical to the operations of ourcustomers’ business and provide benefits that are difficult to quantify. Any failure in a customer’s systems or ourfailure to meet our contractual obligations to our clients, including any breach involving a customer’sconfidential information or sensitive data, or our obligations under applicable laws or regulations could result ina claim for substantial damages against us, regardless of our responsibility for such failure. Although we attemptto contractually limit our liability for damages arising from negligent acts, errors, mistakes, or omissions inrendering our services, there can be no assurance that the limitations of liability set forth in our contracts will beenforceable in all instances or will otherwise protect us from liability for damages. Although we have generalliability insurance coverage, including coverage for errors or omissions, there can be no assurance that suchcoverage will cover all types of claims, continue to be available on reasonable terms or will be available insufficient amounts to cover one or more large claims, or that the insurer will not disclaim coverage as to anyfuture claim. The successful assertion of one or more large claims against us that exceed or are not covered byour insurance coverage or changes in our insurance policies, including premium increases or the imposition oflarge deductible or co-insurance requirements, could have a material adverse effect on our business, results ofoperations, financial condition and cash flows.
Foreign Currency Risk
Overall, we believe that we have limited revenue risk resulting from movement in foreign currencyexchange rates as approximately 76.8% of our revenues during 2014 were generated from customers located inNorth America. Revenue from our customers in the United Kingdom and Europe represented 10.7% and 7.6%,respectively, of our 2014 revenues. Accordingly, our European operating results may be affected by fluctuationsin the exchange rate of the British pound, Euro, Swiss franc and other European currencies to the U.S. dollar.
A portion of our costs in India, representing approximately 25.0% of our global operating costs during 2014,are denominated in the Indian rupee and are subject to foreign currency exchange rate fluctuations. These foreigncurrency exchange rate fluctuations have an impact on our results of operations. In addition, a portion of ourbalance sheet is exposed to foreign currency exchange rate fluctuations, which may result in non-operatingforeign currency exchange gains or losses upon remeasurement. In 2014, we reported foreign currency exchangelosses, exclusive of hedging gains or losses, of approximately $16.5 million, which were primarily attributed tothe remeasurement of the Indian rupee denominated net monetary assets on the books of our India subsidiaries tothe U.S. dollar functional currency. On an ongoing basis, we manage a portion of this risk by limiting our netmonetary asset exposure to certain currencies in our foreign subsidiaries, primarily the Indian rupee.
We entered into a series of foreign exchange forward contracts that are designated as cash flow hedges ofcertain Indian rupee denominated payments in India. Cognizant India converts U.S. dollar receipts fromintercompany billings to Indian rupees to fund local expenses. These hedges to buy Indian rupees and sell U.S.dollars are intended to partially offset the impact of movement of exchange rates on future operating costs. In2014, we reported net losses of $136.6 million on contracts that settled during the year. As of December 31,2014, we have outstanding contracts with a notional value of $2,460.0 million and weighted average contract rateof 64.8 Indian rupees to the U.S. dollar. These contracts are scheduled to mature as follows:
Notional Value(in thousands)
Weighted AverageContract Rate
(Indian rupee toU.S. dollar)
2015 . . . . . . . . . . . . . . . . . . . . . . . . . . . . . . . . . . $1,320,000 60.82016 . . . . . . . . . . . . . . . . . . . . . . . . . . . . . . . . . . 720,000 68.12017 . . . . . . . . . . . . . . . . . . . . . . . . . . . . . . . . . . 420,000 71.8
Total . . . . . . . . . . . . . . . . . . . . . . . . . . . . . . . . . . $2,460,000 64.8
58
Our foreign subsidiaries are exposed to foreign currency exchange rate risk for transactions and balancesdenominated in currencies other than the functional currency of the respective subsidiary. We also use foreignexchange forward contracts to hedge balance sheet exposure to certain monetary assets and liabilitiesdenominated in currencies other than the functional currency of the subsidiary. These contracts are notdesignated as hedges and are intended to offset the foreign currency exchange gains or losses uponremeasurement of these net monetary assets. We entered into a series of foreign exchange forward contractsscheduled to mature in 2015 which are used to hedge our foreign currency denominated net monetary assets. AtDecember 31, 2014, the notional value of the outstanding contracts was $215.6 million and the related fair valuewas an asset of $2.0 million. During 2014, inclusive of losses of $3.9 million on our undesignated balance sheethedges, we reported net foreign currency exchange losses of approximately $20.4 million.
Off-Balance Sheet Arrangements
Other than our foreign exchange forward contracts, there were no off-balance sheet transactions,arrangements or other relationships with unconsolidated entities or other persons in 2014, 2013 and 2012 thathave, or are reasonably likely to have, a current or future effect on our financial condition, revenues or expenses,results of operations, liquidity, capital expenditures or capital resources.
Effects of Inflation
Our most significant costs are the salaries and related benefits for our programming staff and otherprofessionals. In certain regions, competition for professionals with advanced technical skills necessary toperform our services has caused wages to increase at a rate greater than the general rate of inflation. As withother service providers in our industry, we must adequately anticipate wage increases, particularly on our fixed-price contracts. Historically, we have experienced increases in compensation and benefit costs, includingincentive-based compensation, in India; however, this has not had a material impact on our results of operationsas we have been able to absorb such cost increases through price increases or cost management strategies such asmanaging discretionary costs, mix of professional staff and utilization levels and achieving other operatingefficiencies. There can be no assurance that we will be able to offset such cost increases in the future.
Critical Accounting Estimates
Management’s discussion and analysis of our financial condition and results of operations is based on ouraccompanying consolidated financial statements that have been prepared in accordance with accounting principlesgenerally accepted in the United States of America, or U.S. GAAP. The preparation of these financial statementsrequires management to make estimates and assumptions that affect the amounts reported for assets and liabilities,including the recoverability of tangible and intangible assets, disclosure of contingent assets and liabilities as of thedate of the financial statements, and the reported amounts of revenues and expenses during the reported period. On anon-going basis, we evaluate our estimates. The most significant estimates relate to the recognition of revenue andprofits based on the percentage of completion method of accounting for certain fixed-bid contracts, the allowance fordoubtful accounts, income taxes, assumptions used in valuing stock-based compensation arrangements, derivativefinancial instruments and investments, goodwill, intangible assets and other long-lived assets, contingencies andlitigation. We base our estimates on historical experience and on various other assumptions that are believed to bereasonable under the circumstances, the results of which form the basis for making judgments about the carryingvalues of assets and liabilities that are not readily apparent from other sources. The actual amounts may differ from theestimates used in the preparation of the accompanying consolidated financial statements. Our significant accountingpolicies are described in Note 1 to the accompanying consolidated financial statements.
We believe the following critical accounting policies require a higher level of management judgments andestimates than others in preparing the consolidated financial statements:
Revenue Recognition. Revenues related to our highly complex information technology applicationdevelopment contracts, which are predominantly fixed-price contracts, are recognized as the services are
59

performed using the percentage of completion method of accounting. Under this method, total contract revenueduring the term of an agreement is recognized on the basis of the percentage that each contract’s total labor costto date bears to the total expected labor cost (cost to cost method). This method is followed where reasonablydependable estimates of revenues and costs can be made. Management reviews total expected labor costs on anongoing basis. Revisions to our estimates may result in increases or decreases to revenues and income and arereflected in the consolidated financial statements in the periods in which they are first identified. If our estimatesindicate that a contract loss will be incurred, a loss provision is recorded in the period in which the loss firstbecomes probable and reasonably estimable. Contract losses are determined to be the amount by which theestimated costs of the contract exceed the estimated total revenues that will be generated by the contract and areincluded in cost of revenues in our consolidated statement of operations. Changes in estimates related to ourrevenue contracts and contract losses were immaterial for the periods presented.
Allowance for Doubtful Accounts. We maintain an allowance for doubtful accounts for estimated lossesresulting from the inability of our customers to make required payments. The allowance for doubtful accounts isdetermined by evaluating the relative credit-worthiness of each customer, historical collections experience andother information, including the aging of the receivables. If the financial condition of our customers were todeteriorate, resulting in an impairment of their ability to make payments, additional allowances may be required.
Income Taxes. Determining the consolidated provision for income tax expense, deferred income tax assets(and related valuation allowance, if any) and liabilities requires significant judgment. We are required tocalculate and provide for income taxes in each of the jurisdictions where we operate. Changes in the geographicmix of income before taxes or estimated level of annual pre-tax income can affect our overall effective incometax rate. The consolidated provision for income taxes may also change period to period based on non-recurringevents, such as the settlement of income tax audits and changes in tax laws, regulations, or accounting principles.
Our provision for income taxes also includes the impact of reserves established for uncertain income taxpositions, as well as the related interest, which can involve complex issues and may require an extended period oftime to resolve. Although we believe we have adequately reserved for our uncertain tax positions, no assurancecan be given that the final outcome of these matters will not differ from our recorded amounts. We adjust thesereserves in light of changing facts and circumstances, such as the closing of a tax audit. To the extent that thefinal outcome of these matters differs from the amounts recorded, such differences will impact the provision forincome taxes in the period in which such determination is made.
Significant judgment is also required in determining any valuation allowance recorded against deferredincome tax assets. In assessing the need for a valuation allowance, we consider all available evidence for eachjurisdiction including past operating results, estimates of future taxable income and the feasibility of tax planningstrategies. If it is determined that it is more likely than not that future tax benefits associated with a deferredincome tax asset will not be realized, a valuation allowance is provided. In the event we change ourdetermination as to the amount of deferred income tax assets that can be realized, we will adjust the valuationallowance with a corresponding impact recorded to income tax expense in the period in which suchdetermination is made.
Our Indian subsidiaries, collectively referred to as Cognizant India, are primarily export-oriented companiesand are eligible for certain income tax holiday benefits granted by the government of India for export activitiesconducted within SEZs for periods of up to 15 years. Our SEZ income tax holiday benefits are currentlyscheduled to expire in whole or in part during the years 2016 to 2024 and may be extended on a limited basis foran additional five years per unit if certain reinvestment criteria are met. We have constructed and expect tocontinue to locate most of our newer development facilities in SEZs. Our Indian profits ineligible for SEZbenefits are subject to corporate income tax at the current rate of 33.99%. In addition, all Indian profits, includingthose generated within SEZs, are subject to the MAT, at the current rate of approximately 21.0% includingsurcharges. Any MAT paid is creditable against future corporate income tax, subject to limitations. Currently, weanticipate utilizing our existing MAT balances against our future corporate income tax obligations in India.
60
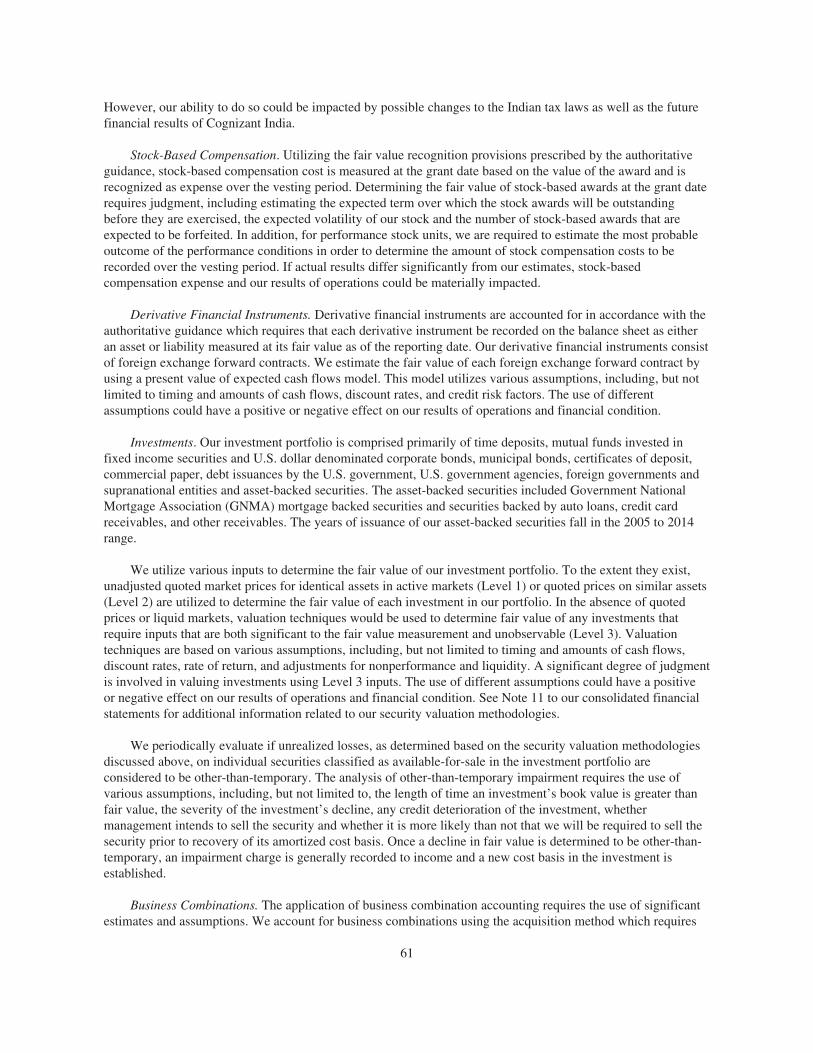
However, our ability to do so could be impacted by possible changes to the Indian tax laws as well as the futurefinancial results of Cognizant India.
Stock-Based Compensation. Utilizing the fair value recognition provisions prescribed by the authoritativeguidance, stock-based compensation cost is measured at the grant date based on the value of the award and isrecognized as expense over the vesting period. Determining the fair value of stock-based awards at the grant daterequires judgment, including estimating the expected term over which the stock awards will be outstandingbefore they are exercised, the expected volatility of our stock and the number of stock-based awards that areexpected to be forfeited. In addition, for performance stock units, we are required to estimate the most probableoutcome of the performance conditions in order to determine the amount of stock compensation costs to berecorded over the vesting period. If actual results differ significantly from our estimates, stock-basedcompensation expense and our results of operations could be materially impacted.
Derivative Financial Instruments. Derivative financial instruments are accounted for in accordance with theauthoritative guidance which requires that each derivative instrument be recorded on the balance sheet as eitheran asset or liability measured at its fair value as of the reporting date. Our derivative financial instruments consistof foreign exchange forward contracts. We estimate the fair value of each foreign exchange forward contract byusing a present value of expected cash flows model. This model utilizes various assumptions, including, but notlimited to timing and amounts of cash flows, discount rates, and credit risk factors. The use of differentassumptions could have a positive or negative effect on our results of operations and financial condition.
Investments. Our investment portfolio is comprised primarily of time deposits, mutual funds invested infixed income securities and U.S. dollar denominated corporate bonds, municipal bonds, certificates of deposit,commercial paper, debt issuances by the U.S. government, U.S. government agencies, foreign governments andsupranational entities and asset-backed securities. The asset-backed securities included Government NationalMortgage Association (GNMA) mortgage backed securities and securities backed by auto loans, credit cardreceivables, and other receivables. The years of issuance of our asset-backed securities fall in the 2005 to 2014range.
We utilize various inputs to determine the fair value of our investment portfolio. To the extent they exist,unadjusted quoted market prices for identical assets in active markets (Level 1) or quoted prices on similar assets(Level 2) are utilized to determine the fair value of each investment in our portfolio. In the absence of quotedprices or liquid markets, valuation techniques would be used to determine fair value of any investments thatrequire inputs that are both significant to the fair value measurement and unobservable (Level 3). Valuationtechniques are based on various assumptions, including, but not limited to timing and amounts of cash flows,discount rates, rate of return, and adjustments for nonperformance and liquidity. A significant degree of judgmentis involved in valuing investments using Level 3 inputs. The use of different assumptions could have a positiveor negative effect on our results of operations and financial condition. See Note 11 to our consolidated financialstatements for additional information related to our security valuation methodologies.
We periodically evaluate if unrealized losses, as determined based on the security valuation methodologiesdiscussed above, on individual securities classified as available-for-sale in the investment portfolio areconsidered to be other-than-temporary. The analysis of other-than-temporary impairment requires the use ofvarious assumptions, including, but not limited to, the length of time an investment’s book value is greater thanfair value, the severity of the investment’s decline, any credit deterioration of the investment, whethermanagement intends to sell the security and whether it is more likely than not that we will be required to sell thesecurity prior to recovery of its amortized cost basis. Once a decline in fair value is determined to be other-than-temporary, an impairment charge is generally recorded to income and a new cost basis in the investment isestablished.
Business Combinations. The application of business combination accounting requires the use of significantestimates and assumptions. We account for business combinations using the acquisition method which requires
61
us to estimate the fair value of assets acquired, liabilities assumed, and any noncontrolling interest in the acquireeto properly allocate purchase price consideration between assets that are depreciated and amortized fromgoodwill and indefinite-lived intangible assets. The allocation of the purchase price utilizes significant estimatesin determining the fair values of assets acquired and liabilities assumed, especially with respect to intangibleassets. The significant estimates and assumptions include, but are not limited to, the timing and amount of futurerevenue and cash flows based on, among other things, anticipated growth rates and customer attrition rates, andthe discount rate reflecting the risk inherent in future cash flows.
Long-lived Assets and Finite-lived Intangibles. We review long-lived assets and certain finite-livedidentifiable intangibles for impairment whenever events or changes in circumstances indicate that the carryingamount of an asset may not be recoverable. In general, we will recognize an impairment loss when the sum ofundiscounted expected future cash flows is less than the carrying amount of such asset. The measurement forsuch an impairment loss is then based on the fair value of the asset. If such assets were determined to beimpaired, it could have a material adverse effect on our business, results of operations and financial condition.
Goodwill and Indefinite-lived Intangibles. We evaluate goodwill and indefinite-lived intangible assets forimpairment at least annually, or as circumstances warrant. When determining the fair value of our reportingunits, we utilize various assumptions, including discount rates and projections of future cash flows. Any adversechanges in key assumptions about our businesses and their prospects or an adverse change in market conditionsmay cause a change in the estimation of fair value and could result in an impairment charge. Based upon ourmost recent valuation of goodwill, there are no significant risks of impairment for any of our reporting units. Asof December 31, 2014, our goodwill balance was $2,413.6 million.
Recently Adopted Accounting Pronouncement
In July 2013, the FASB issued new guidance which requires the netting of any unrecognized tax benefitsagainst all available same-jurisdiction deferred income tax carryforward assets that would apply if the uncertaintax positions were settled. We adopted this standard on January 1, 2014. As of December 31, 2014, we netted anunrecognized tax benefit of $94,784 against same-jurisdiction non-current deferred income tax assets. In ourDecember 31, 2013 consolidated statement of financial position, we reclassified $74,196 from “other non-currentliabilities” to non-current “deferred income tax assets, net” to conform to current period’s presentation. Theadoption of this standard had no effect on our consolidated results of operations or stockholder’s equity.
New Accounting Pronouncement
In May 2014, the FASB issued a standard on revenue from contracts with customers. The new standard setsforth a single comprehensive model for recognizing and reporting revenue. The standard also requires additionalfinancial statement disclosures that will enable users to understand the nature, amount, timing and uncertainty ofrevenue and cash flows relating to customer contracts. The new standard will be effective for periods beginningon or after January 1, 2017. Early adoption is not permitted. The standard allows for two methods of adoption:the full retrospective adoption, which requires the standard to be applied to each prior period presented, or themodified retrospective adoption, which requires the cumulative effect of adoption to be recognized as anadjustment to opening retained earnings in the period of adoption. We are currently evaluating the effect the newstandard will have on our consolidated financial statements and related disclosures.
Forward Looking Statements
The statements contained in this Annual Report on Form 10-K that are not historical facts are forward-looking statements (within the meaning of Section 21E of the Securities Exchange Act of 1934, as amended) thatinvolve risks and uncertainties. Such forward-looking statements may be identified by, among other things, theuse of forward-looking terminology such as “believes,” “expects,” “may,” “could,” “would,” “plan,” “intend,”“estimate,” “predict,” “potential,” “continue,” “should” or “anticipates” or the negative thereof or other
62
variations thereon or comparable terminology, or by discussions of strategy that involve risks and uncertainties.From time to time, we or our representatives have made or may make forward-looking statements, orally or inwriting.
Such forward-looking statements may be included in various filings made by us with the Securities andExchange Commission, or press releases or oral statements made by or with the approval of one of ourauthorized executive officers. These forward-looking statements, such as statements regarding anticipated futurerevenues or operating margins, contract percentage completions, earnings, capital expenditures, liquidity, plans,objectives and other statements regarding matters that are not historical facts, are based on our currentexpectations, estimates and projections, management’s beliefs and certain assumptions made by management,many of which, by their nature, are inherently uncertain and beyond our control. Our actual results, performanceor achievements could differ materially from the results expressed in, or implied by, these forward-lookingstatements. There are a number of important factors that could cause our results to differ materially from thoseindicated by such forward-looking statements, including, but not limited to:
• competition from other service providers;
• the risk that our operating margin may decline and we may not be able to sustain our current level ofprofitability;
• the risk of liability or damage to our reputation resulting from security breaches;
• any possible failure to comply with or adapt to changes in healthcare-related data protection andprivacy laws;
• the loss of customers, especially as a few customers account for a large portion of our revenues;
• the risk that we may not be able to keep pace with the rapidly evolving technological environment;
• the rate of growth in the use of technology in business and the type and level of technology spendingby our clients;
• mispricing of our services, especially as an increasing percentage of our revenues are derived fromfixed-price contracts;
• the risk that we might not be able to maintain effective internal controls, including as we acquire andintegrate other companies;
• our inability to successfully acquire or integrate target companies;
• system failure or disruptions in our communications or information technology;
• the risk that we may lose key executives and not be able to enforce non-competition agreements withthem;
• competition for hiring highly-skilled technical personnel;
• possible failure to provide end-to-end business solutions and deliver complex and large projects for ourclients;
• the risk of reputational harm to us;
• our revenues being highly dependent on clients concentrated in certain industries, including financialservices and healthcare, and located primarily in the United States and Europe;
• risks relating to our global operations, including our operations in India;
• the effects of fluctuations in the Indian rupee and other currency exchange rates;
• the effect of our use of derivative instruments;
• the risk of war, terrorist activities, pandemics and natural disasters;
63
• the possibility that we may be required, as a result of our indebtedness, or otherwise choose torepatriate foreign earnings or that our foreign earnings or profits may become subject to U.S. taxes;
• the possibility that we may lose certain tax benefits provided to companies in our industry by theIndian government;
• the risk that we may not be able to enforce or protect our intellectual property rights, or that we mayinfringe upon the intellectual property rights of others;
• changes in domestic and international regulations and legislation relating to immigration and anti-outsourcing;
• increased regulation of the financial services and healthcare industries, as well as other industries inwhich our clients operate; and
• the factors set forth in Part I, in the section entitled “Item 1A. Risk Factors” in this report.
You are advised to consult any further disclosures we make on related subjects in the reports we file withthe Securities and Exchange Commission, including this report in the sections titled “Part I, Item 1. Business,”“Part I, Item 1A. Risk Factors” and “Part II, Item 7. Management’s Discussion and Analysis of FinancialCondition and Results of Operations.” We undertake no obligation to update or revise any forward-lookingstatements, whether as a result of new information, future events or otherwise, except as may be required underapplicable securities laws.
Item 7A. Quantitative and Qualitative Disclosures about Market Risk.
We are exposed to foreign currency exchange rate risk in the ordinary course of doing business as wetransact or hold a portion of our funds in foreign currencies, particularly the Indian rupee. Accordingly, weperiodically evaluate the need for hedging strategies, including the use of derivative financial instruments, tomitigate the effect of foreign currency exchange rate fluctuations and expect to continue to use such instrumentsin the future to reduce foreign currency exposure to appreciation or depreciation in the value of certain foreigncurrencies. All hedging transactions are authorized and executed pursuant to regularly reviewed policies andprocedures.
We have entered into a series of foreign exchange forward contracts that are designated as cash flow hedgesof certain Indian rupee denominated payments in India. Cognizant India converts U.S. dollar receipts fromintercompany billings to Indian rupees to fund local expenses. These U.S. dollar / Indian rupee hedges areintended to partially offset the impact of movement of exchange rates on future operating costs. As ofDecember 31, 2014, the notional value and weighted average contract rates of these contracts were as follows:
Notional Value(in thousands)
Weighted AverageContract Rate
(Indian rupee toU.S. dollar)
2015 . . . . . . . . . . . . . . . . . . . . . . . . . . . . . . . . . . $1,320,000 60.82016 . . . . . . . . . . . . . . . . . . . . . . . . . . . . . . . . . . 720,000 68.12017 . . . . . . . . . . . . . . . . . . . . . . . . . . . . . . . . . . 420,000 71.8
Total . . . . . . . . . . . . . . . . . . . . . . . . . . . . . . . . . . $2,460,000 64.8
As of December 31, 2014, the net unrealized loss on our outstanding foreign exchange forward contractswas $102.6 million. Based upon a sensitivity analysis of our foreign exchange forward contracts at December 31,2014, which estimates the fair value of the contracts based upon market exchange rate fluctuations, a 10.0%change in the foreign currency exchange rate against the U.S. dollar with all other variables held constant wouldhave resulted in a change in the fair value of approximately $222.3 million.
64
Our foreign subsidiaries are exposed to foreign currency exchange rate risk for transactions denominated incurrencies other than the functional currency of the respective subsidiary. We also use foreign exchange forwardcontracts to hedge balance sheet exposure to certain monetary assets and liabilities denominated in currenciesother than the functional currency of the subsidiary. These contracts are not designated as hedges and areintended to offset the foreign currency exchange gains or losses upon remeasurement of these net monetaryassets. We entered into a series of foreign exchange forward contracts scheduled to mature in 2015 which areused to hedge our foreign currency denominated net monetary assets. At December 31, 2014, the notional valueof the outstanding contracts was $215.6 million and the related fair value was an asset of $2.0 million. Basedupon a sensitivity analysis of our foreign exchange forward contracts at December 31, 2014, which estimates thefair value of the contracts based upon market exchange rate fluctuations, a 10.0% change in the foreign currencyexchange rate against the U.S. dollar with all other variables held constant would have resulted in a change in thefair value of approximately $21.1 million.
In the fourth quarter of 2014, we entered into the Credit Agreement providing for a $1,000 millionunsecured Term Loan and a $750.0 million unsecured Revolving Facility. The Term Loan and the RevolvingFacility both mature on November 20, 2019. As of December 31, 2014, we have drawn down $650.0 millionunder the Revolving Facility. The Credit Agreement requires interest to be paid at either the base rate or theEurocurrency rate, plus a margin. The margin over the base rate is 0.00%, and the margin over the Eurocurrencyrate ranges from 0.75% to 1.125%, depending on our debt ratings (or, if we have not received debt ratings,from 0.875% to 1.00%, depending on our debt to total stockholders’ equity ratio). Thus, our debt exposes us tomarket risk from changes in interest rates. We performed a sensitivity analysis to determine the effect of interestrate fluctuations on our interest expense. A 10% change in interest rates, with all other variables held constant,would have resulted in a 1.5% change to our reported interest expense.
In addition, our cash, cash equivalents and short-term investments are subject to market risk from changes ininterest rates. As of December 31, 2014, a 10% change in interest rates, with all other variables held constant,would result in a change in the fair market value of our available-for-sale investment securities of approximately$1.9 million.
Information provided by the sensitivity analysis does not necessarily represent the actual changes that wouldoccur under normal market conditions.
We typically invest in highly-rated securities and our policy generally limits the amount of credit exposureto any one issuer. Our investment policy requires investments to be investment grade with the objective ofminimizing the potential risk of principal loss. We may sell our investments prior to their stated maturities forstrategic purposes, in anticipation of credit deterioration, or for duration management. As of December 31, 2014,our short-term investments totaled $1,764.6 million. Our investment portfolio is comprised primarily of timedeposits, mutual funds invested in fixed income securities and U.S. dollar denominated corporate bonds,municipal bonds, certificates of deposit, commercial paper, debt issuances by the U.S. government, U.S.government agencies, foreign governments and supranational entities and asset-backed securities. The asset-backed securities included Government National Mortgage Association (GNMA) mortgage backed securities andsecurities backed by auto loans, credit card receivables, and other receivables.
Item 8. Financial Statements and Supplementary Data
The financial statements required to be filed pursuant to this Item 8 are appended to this Annual Report onForm 10-K. A list of the financial statements filed herewith is found in Part IV, “Item 15. Exhibits, FinancialStatements and Financial Statement Schedule”.
Item 9. Changes in and Disagreements with Accountants on Accounting and Financial Disclosure
Not applicable.
65
Item 9A. Controls and Procedures
Evaluation of Disclosure Controls and Procedures
Our management under the supervision and with the participation of our chief executive officer and ourchief financial officer, evaluated the effectiveness of our disclosure controls and procedures (as defined inRules 13a-15(e) and 15d-15(e) under the Securities Exchange Act of 1934, as amended, or the Exchange Act) asof December 31, 2014. Based on this evaluation, our chief executive officer and our chief financial officerconcluded that, as of December 31, 2014, our disclosure controls and procedures were effective to ensure thatinformation required to be disclosed by us in our reports that we file or submit under the Exchange Act is(i) recorded, processed, summarized and reported within the time periods specified in the SEC’s rules and formsand (ii) accumulated and communicated to our management, including our chief executive officer and our chieffinancial officer, as appropriate, to allow timely decisions regarding required disclosure.
Changes in Internal Control over Financial Reporting
No changes in our internal control over financial reporting (as defined in Rules 13a-15(f) and 15d-15(f)under the Exchange Act) occurred during the fiscal quarter ended December 31, 2014 that have materiallyaffected, or are reasonably likely to materially affect, our internal control over financial reporting.
Management’s Responsibility for Financial Statements
Our management is responsible for the integrity and objectivity of all information presented in this annualreport. The consolidated financial statements were prepared in conformity with accounting principles generallyaccepted in the United States of America and include amounts based on management’s best estimates andjudgments. Management believes the consolidated financial statements fairly reflect the form and substance oftransactions and that the financial statements fairly represent the Company’s financial position and results ofoperations.
The Audit Committee of the Board of Directors, which is composed solely of independent directors, meetsregularly with the Company’s independent registered public accounting firm and representatives of managementto review accounting, financial reporting, internal control and audit matters, as well as the nature and extent ofthe audit effort. The Audit Committee is responsible for the engagement of the independent registered publicaccounting firm. The independent registered public accounting firm has free access to the Audit Committee.
Management’s Report on Internal Control Over Financial Reporting
Our management is responsible for establishing and maintaining adequate internal control over financialreporting. Internal control over financial reporting is defined in Rule 13a-15(f) and 15d-15(f) of the ExchangeAct and is a process designed by, or under the supervision of, our chief executive and chief financial officers andeffected by our Board of Directors, management and other personnel, to provide reasonable assurance regardingthe reliability of financial reporting and the preparation of financial statements for external purposes inaccordance with generally accepted accounting principles and includes those policies and procedures that:
• Pertain to the maintenance of records that, in reasonable detail, accurately and fairly reflect thetransactions and dispositions of our assets;
• Provide reasonable assurance that transactions are recorded as necessary to permit preparation offinancial statements in accordance with generally accepted accounting principles, and that receipts andexpenditures of the Company are being made only in accordance with authorizations of ourmanagement and directors; and
• Provide reasonable assurance regarding prevention or timely detection of unauthorized acquisition, useor disposition of the Company’s assets that could have a material effect on the financial statements.
66

Our management assessed the effectiveness of the Company’s internal control over financial reporting as ofDecember 31, 2014. In making this assessment, the Company’s management used the criteria set forth by theCommittee of Sponsoring Organizations of the Treadway Commission (COSO) in Internal Control-IntegratedFramework (2013). The scope of management’s assessment of the effectiveness of our internal control overfinancial reporting included all of our consolidated operations except for the operations of TriZetto, which weacquired in November 2014. TriZetto’s operations represented approximately 28.1% of our consolidated totalassets and 0.8% of our consolidated revenues as of and for the year ended December 31, 2014.
Based on its evaluation, our management has concluded that, as of December 31, 2014, our internal controlover financial reporting was effective. PricewaterhouseCoopers LLP, the independent registered publicaccounting firm that audited the financial statements included in this annual report, has issued an attestationreport on our internal control over financial reporting, as stated in their report which is included on page F-2.
Inherent Limitations of Internal Controls
Because of its inherent limitations, internal control over financial reporting may not prevent or detect allmisstatements. Projections of any evaluation of effectiveness to future periods are subject to the risk that controlsmay become inadequate because of changes in conditions, or that the degree of compliance with the policies orprocedures may deteriorate.
Item 9B. Other Information
None.
67
PART III
Item 10. Directors, Executive Officers and Corporate Governance
The information relating to our directors and nominees for election as directors under the heading “Electionof Directors” in our definitive proxy statement for the 2015 Annual Meeting of Stockholders is incorporatedherein by reference to such proxy statement. The information relating to our executive officers in response to thisitem is contained in part under the caption “Our Executive Officers” in Part I of this Annual Report onForm 10-K and the remainder is incorporated herein by reference to our definitive proxy statement for the 2015Annual Meeting of Stockholders under the headings “Section 16(a) Beneficial Ownership ReportingCompliance,” “Corporate Governance-Code of Ethics” and “Committees of the Board-Audit Committee.”
We have adopted a written code of business conduct and ethics, entitled “Cognizant’s Core Values andStandards of Business Conduct,” that applies to all of our employees, including our principal executive officer,principal financial officer, principal accounting officer and controller, or persons performing similar functions.We make available our code of business conduct and ethics free of charge through our website which is locatedat www.cognizant.com. We intend to post on our website all disclosures that are required by law or NASDAQStock Market listing standards concerning any amendments to, or waivers from, any provision of our code ofbusiness conduct and ethics.
Item 11. Executive Compensation
The discussion under the headings “Executive Compensation,” “Compensation Committee Report,”“Executive Compensation Tables” and “Compensation Committee Interlocks and Insider Participation” in ourdefinitive proxy statement for the 2015 Annual Meeting of Stockholders is incorporated herein by reference tosuch proxy statement.
Item 12. Security Ownership of Certain Beneficial Owners and Management and Related StockholderMatters
The discussion under the heading “Security Ownership of Certain Beneficial Owners and Management” and“Executive Compensation Tables-Equity Compensation Plan Information” in our definitive proxy statement forthe 2015 Annual Meeting of Stockholders is incorporated herein by reference to such proxy statement.
Item 13. Certain Relationships and Related Transactions, and Director Independence
The discussion under the headings “Certain Relationships and Related Person Transactions” and “CorporateGovernance—Determination of Independence” in our definitive proxy statement for the 2015 Annual Meeting ofStockholders is incorporated herein by reference to such proxy statement.
Item 14. Principal Accountant Fees and Services
The discussion under the heading “Independent Registered Public Accounting Firm Fees and Other Matters”in our definitive proxy statement for the 2015 Annual Meeting of Stockholders is incorporated herein byreference to such proxy statement.
68

PART IV
Item 15. Exhibits, Financial Statement Schedules
(a) (1) Consolidated Financial Statements.Reference is made to the Index to Consolidated Financial Statements on Page F-1.
(2) Consolidated Financial Statement Schedule.Reference is made to the Index to Financial Statement Schedule on Page F-1.
(3) Exhibits.Reference is made to the Index to Exhibits on Page 71.
Schedules other than as listed above are omitted as not required or inapplicable or because the requiredinformation is provided in the consolidated financial statements, including the notes thereto.
69

SIGNATURES
Pursuant to the requirements of Section 13 or 15(d) of the Securities Exchange Act of 1934, the Registranthas duly caused this report to be signed on its behalf by the undersigned, thereunto duly authorized.
COGNIZANT TECHNOLOGY SOLUTIONSCORPORATION
By: /s/ FRANCISCO D’SOUZA
Francisco D’Souza,Chief Executive Officer
(Principal Executive Officer)
Date: February 27, 2015
Pursuant to the requirements of the Securities Exchange Act of 1934, this report has been signed below bythe following persons on behalf of the Registrant and in the capacities and on the dates indicated.
Signature Title Date
/S/ FRANCISCO D’SOUZA
Francisco D’SouzaChief Executive Officer and Director(Principal Executive Officer)
February 27, 2015
/S/ KAREN MCLOUGHLIN
Karen McLoughlinChief Financial Officer(Principal Financial and AccountingOfficer)
February 27, 2015
/S/ JOHN E. KLEIN
John E. KleinChairman of the Board and Director February 27, 2015
/S/ LAKSHMI NARAYANAN
Lakshmi NarayananVice Chairman of the Board andDirector
February 27, 2015
/S/ THOMAS M. WENDEL
Thomas M. WendelDirector February 27, 2015
/S/ ROBERT E. WEISSMAN
Robert E. WeissmanDirector February 27, 2015
/S/ JOHN N. FOX, JR.John N. Fox, Jr.
Director February 27, 2015
/S/ MAUREEN BREAKIRON-EVANS
Maureen Breakiron-EvansDirector February 27, 2015
/S/ MICHAEL PATSALOS-FOX
Michael Patsalos-FoxDirector February 27, 2015
/S/ LEO S. MACKAY, JR.Leo S. Mackay, Jr.
Director February 27, 2015
70
EXHIBIT INDEX
Incorporated by Reference
Number Exhibit Description Form File No. Exhibit Date
Filed orFurnishedHerewith
2.1 Stock Purchase Agreement, by and amongTZ Holdings, L.P., TZ US Parent, Inc. andCognizant Domestic Holdings Corporation,dates as of September 14, 2014 8-K 000-24429 2.1 9/15/2014
3.1 Restated Certificate of Incorporation 8-K 000-24429 3.2 9/17/2013
3.2 Amended and Restated By-laws of theCompany, as amended on June 4, 2013 8-K 000-24429 3.2 6/5/2013
4.1 Specimen Certificate for shares of Class Acommon stock S-4/A 333-101216 4.2 1/30/2003
10.1† Form of Indemnification Agreement forDirectors and Officers 10-Q 000-24429 10.1 8/7/2013
10.2† Form of Amended and Restated ExecutiveEmployment and Non-Disclosure, Non-Competition, and Invention AssignmentAgreement, between the Company and eachof the following Executive Officers: LakshmiNarayanan, Francisco D’Souza, GordonCoburn, Karen McLoughlin, RamakrishnanChandrasekaran, Rajeev Mehta, MalcolmFrank, Steven Schwartz, SridharThiruvengadam 10-K 000-24429 10.4 2/26/2013
10.3† Amended and Restated 1999 IncentiveCompensation Plan (as Amended andRestated Through April 26, 2007) 8-K 000-24429 10.1 6/8/2007
10.4† 2004 Employee Stock Purchase Plan (asamended and restated effective as of April 1,2013) 8-K 000-24429 10.1 6/5/2013
10.5† Form of Stock Option Certificate 10-Q 000-24429 10.1 11/8/2004
10.6 Distribution Agreement between IMS HealthIncorporated and the Company, datedJanuary 7, 2003 S-4/A 333-101216 10.13 1/9/2003
10.7† Amended and Restated Key Employees’Stock Option Plan Amendment No. 1, whichbecame effective on March 2, 2007 10-Q 000-24429 10.2 5/10/2007
10.8† Amended and Restated Non-EmployeeDirectors’ Stock Option Plan AmendmentNo. 1, which became effective on March 2,2007 10-Q 000-24429 10.3 5/10/2007
10.9† Form of Performance Unit Award for grantsto certain executive officers 8-K 000-24429 10.1 12/7/2007
71
Incorporated by Reference
Number Exhibit Description Form File No. Exhibit Date
Filed orFurnishedHerewith
10.10† Form of Stock Unit Award Agreementpursuant to the Cognizant TechnologySolutions Corporation Amended and Restated1999 Incentive Compensation Plan 8-K 000-24429 10.1 9/5/2008
10.11† The Cognizant Technology SolutionsExecutive Pension Plan, as amended andrestated 8-K 000-24429 10.2 12/5/2008
10.12† Cognizant Technology Solutions Corporation2009 Incentive Compensation Plan 8-K 000-24429 10.1 6/11/2009
10.13† First Amendment to Cognizant TechnologySolutions Corporation 2009 IncentiveCompensation Plan (effective March 1, 2014) 8-K 000-24429 10.1 6/5/2014
10.14† Second Amendment to Cognizant TechnologySolutions Corporation 2009 IncentiveCompensation Plan (effective September 18,2014) Filed
10.15† Form of Cognizant Technology SolutionsCorporation Stock Option Agreement 8-K 000-24429 10.1 7/6/2009
10.16† Form of Cognizant Technology SolutionsCorporation Notice of Grant of Stock Option 8-K 000-24429 10.2 7/6/2009
10.17† Form of Cognizant Technology SolutionsCorporation Restricted Stock Unit AwardAgreement Time-Based Vesting 8-K 000-24429 10.3 7/6/2009
10.18† Form of Cognizant Technology SolutionsCorporation Notice of Award of RestrictedStock Units Time-Based Vesting 8-K 000-24429 10.4 7/6/2009
10.19† Form of Cognizant Technology SolutionsCorporation Restricted Stock Unit AwardAgreement Performance-Based Vesting 8-K 000-24429 10.5 7/6/2009
10.20† Form of Cognizant Technology SolutionsCorporation Notice of Award of RestrictedStock Units Performance-Based Vesting 8-K 000-24429 10.6 7/6/2009
10.21† Form of Restricted Stock Unit AwardAgreement Non-Employee Director DeferredIssuance 8-K 000-24429 10.7 7/6/2009
10.22† Form of Cognizant Technology SolutionsCorporation Notice of Award of RestrictedStock Units Non-Employee Director DeferredIssuance 8-K 000-24429 10.8 7/6/2009
72
Incorporated by Reference
Number Exhibit Description Form File No. Exhibit Date
Filed orFurnishedHerewith
10.23† Credit Agreement, dated as of November20, 2014 among Cognizant TechnologySolutions Corporation, the lenders partythereto and JPMorgan Chase Bank, N.A. asadministrative agent for the Lenders 8-K 000-24429 10.1 11/20/2014
21.1 List of subsidiaries of the Company Filed
23.1 Consent of PricewaterhouseCoopers LLP Filed
31.1 Certification Pursuant to Rule 13a-14(a)and 15d-14(a) of the Exchange Act, asAdopted Pursuant to Section 302 of theSarbanes-Oxley Act of 2002 (ChiefExecutive Officer) Filed
31.2 Certification Pursuant to Rule 13a-14(a)and 15d-14(a) of the Exchange Act, asAdopted Pursuant to Section 302 of theSarbanes-Oxley Act of 2002 (ChiefFinancial Officer) Filed
32.1 Certification Pursuant to 18 U.S.C.Section 1350 (Chief Executive Officer) Furnished
32.2 Certification Pursuant to 18 U.S.C.Section 1350 (Chief Financial Officer) Furnished
101.INS XBRL Instance Document Filed
101.SCH XBRL Taxonomy Extension SchemaDocument Filed
101.CAL XBRL Taxonomy Extension CalculationLinkbase Document Filed
101.DEF XBRL Taxonomy Extension DefinitionLinkbase Document Filed
101.LAB XBRL Taxonomy Extension LabelLinkbase Document Filed
101.PRE XBRL Taxonomy Extension PresentationLinkbase Document Filed
† A management contract or compensatory plan or arrangement required to be filed as an exhibit pursuant toItem 15(a)(3) of Form 10-K.
73

[THIS PAGE INTENTIONALLY LEFT BLANK]
COGNIZANT TECHNOLOGY SOLUTIONS CORPORATION
INDEX TO CONSOLIDATED FINANCIAL STATEMENTSAND FINANCIAL STATEMENT SCHEDULE
Page
Consolidated Financial Statements:Report of Independent Registered Public Accounting Firm . . . . . . . . . . . . . . . . . . . . . . . . . . . . . . . . . . F-2Consolidated Statements of Financial Position as of December 31, 2014 and 2013 . . . . . . . . . . . . . . . F-4Consolidated Statements of Operations for the years ended December 31, 2014, 2013 and 2012 . . . . . F-5Consolidated Statements of Comprehensive Income for the years ended December 31, 2014, 2013
and 2012 . . . . . . . . . . . . . . . . . . . . . . . . . . . . . . . . . . . . . . . . . . . . . . . . . . . . . . . . . . . . . . . . . . . . . . . . F-6Consolidated Statements of Stockholders’ Equity for the years ended December 31, 2014, 2013 and
2012 . . . . . . . . . . . . . . . . . . . . . . . . . . . . . . . . . . . . . . . . . . . . . . . . . . . . . . . . . . . . . . . . . . . . . . . . . . . F-7Consolidated Statements of Cash Flows for the years ended December 31, 2014, 2013 and 2012 . . . . F-8Notes to Consolidated Financial Statements . . . . . . . . . . . . . . . . . . . . . . . . . . . . . . . . . . . . . . . . . . . . . . F-9
Financial Statement Schedule:Schedule of Valuation and Qualifying Accounts . . . . . . . . . . . . . . . . . . . . . . . . . . . . . . . . . . . . . . . . . . F-39
F-1
Report of Independent Registered Public Accounting Firm
To the Board of Directors and Stockholders of Cognizant Technology Solutions Corporation:
In our opinion, the consolidated financial statements listed in the accompanying index appearing underItem 15(a)(1) present fairly, in all material respects, the financial position of Cognizant Technology SolutionsCorporation (the “Company”) and its subsidiaries at December 31, 2014 and December 31, 2013, and the resultsof their operations and their cash flows for each of the three years in the period ended December 31, 2014 inconformity with accounting principles generally accepted in the United States of America. In addition, in ouropinion, the financial statement schedule listed in the accompanying index presents fairly, in all materialrespects, the information set forth therein when read in conjunction with the related consolidated financialstatements. Also in our opinion, the Company maintained, in all material respects, effective internal control overfinancial reporting as of December 31, 2014, based on criteria established in Internal Control—IntegratedFramework (2013) issued by the Committee of Sponsoring Organizations of the Treadway Commission (COSO).The Company’s management is responsible for these financial statements and financial statement schedule, formaintaining effective internal control over financial reporting and for its assessment of the effectiveness ofinternal control over financial reporting, included in Management’s Report on Internal Control Over FinancialReporting appearing under Item 9A. Our responsibility is to express opinions on these financial statements, onthe financial statement schedule, and on the Company’s internal control over financial reporting based on ourintegrated audits. We conducted our audits in accordance with the standards of the Public Company AccountingOversight Board (United States). Those standards require that we plan and perform the audits to obtainreasonable assurance about whether the financial statements are free of material misstatement and whethereffective internal control over financial reporting was maintained in all material respects. Our audits of thefinancial statements included examining, on a test basis, evidence supporting the amounts and disclosures in thefinancial statements, assessing the accounting principles used and significant estimates made by management,and evaluating the overall financial statement presentation. Our audit of internal control over financial reportingincluded obtaining an understanding of internal control over financial reporting, assessing the risk that a materialweakness exists, and testing and evaluating the design and operating effectiveness of internal control based onthe assessed risk. Our audits also included performing such other procedures as we considered necessary in thecircumstances. We believe that our audits provide a reasonable basis for our opinions.
A company’s internal control over financial reporting is a process designed to provide reasonable assuranceregarding the reliability of financial reporting and the preparation of financial statements for external purposes inaccordance with generally accepted accounting principles. A company’s internal control over financial reportingincludes those policies and procedures that (i) pertain to the maintenance of records that, in reasonable detail,accurately and fairly reflect the transactions and dispositions of the assets of the company; (ii) provide reasonableassurance that transactions are recorded as necessary to permit preparation of financial statements in accordancewith generally accepted accounting principles, and that receipts and expenditures of the company are being madeonly in accordance with authorizations of management and directors of the company; and (iii) provide reasonableassurance regarding prevention or timely detection of unauthorized acquisition, use, or disposition of thecompany’s assets that could have a material effect on the financial statements.
Because of its inherent limitations, internal control over financial reporting may not prevent or detectmisstatements. Also, projections of any evaluation of effectiveness to future periods are subject to the risk thatcontrols may become inadequate because of changes in conditions, or that the degree of compliance with thepolicies or procedures may deteriorate.
As described in Management’s Report on Internal Control over Financial Reporting appearing in Item 9A,management has excluded TriZetto US Parent, Inc. and its subsidiaries (“TriZetto”) from its assessment ofinternal control over financial reporting as of December 31, 2014, because it was acquired by the Company in apurchase business combination on November 20, 2014. We have also excluded TriZetto from our audit ofinternal control over financial reporting. TriZetto is a consolidated entity whose total assets and total revenues
F-2

represent 28.1% and 0.8%, respectively, of the related consolidated financial statement amounts as of and for theyear ended December 31, 2014.
PricewaterhouseCoopers LLP
New York, New YorkFebruary 27, 2015
F-3
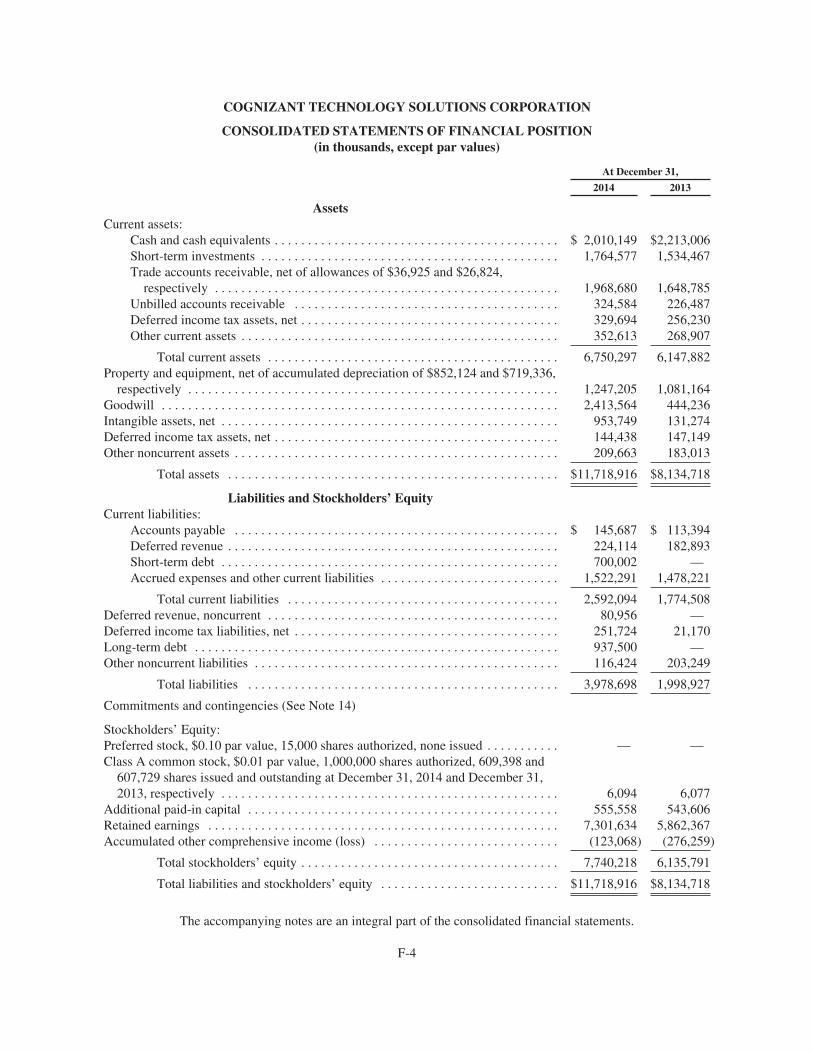
COGNIZANT TECHNOLOGY SOLUTIONS CORPORATION
CONSOLIDATED STATEMENTS OF FINANCIAL POSITION(in thousands, except par values)
At December 31,
2014 2013
AssetsCurrent assets:
Cash and cash equivalents . . . . . . . . . . . . . . . . . . . . . . . . . . . . . . . . . . . . . . . . . . . $ 2,010,149 $2,213,006Short-term investments . . . . . . . . . . . . . . . . . . . . . . . . . . . . . . . . . . . . . . . . . . . . . 1,764,577 1,534,467Trade accounts receivable, net of allowances of $36,925 and $26,824,
respectively . . . . . . . . . . . . . . . . . . . . . . . . . . . . . . . . . . . . . . . . . . . . . . . . . . . . 1,968,680 1,648,785Unbilled accounts receivable . . . . . . . . . . . . . . . . . . . . . . . . . . . . . . . . . . . . . . . . 324,584 226,487Deferred income tax assets, net . . . . . . . . . . . . . . . . . . . . . . . . . . . . . . . . . . . . . . . 329,694 256,230Other current assets . . . . . . . . . . . . . . . . . . . . . . . . . . . . . . . . . . . . . . . . . . . . . . . . 352,613 268,907
Total current assets . . . . . . . . . . . . . . . . . . . . . . . . . . . . . . . . . . . . . . . . . . . . 6,750,297 6,147,882Property and equipment, net of accumulated depreciation of $852,124 and $719,336,
respectively . . . . . . . . . . . . . . . . . . . . . . . . . . . . . . . . . . . . . . . . . . . . . . . . . . . . . . . . 1,247,205 1,081,164Goodwill . . . . . . . . . . . . . . . . . . . . . . . . . . . . . . . . . . . . . . . . . . . . . . . . . . . . . . . . . . . . 2,413,564 444,236Intangible assets, net . . . . . . . . . . . . . . . . . . . . . . . . . . . . . . . . . . . . . . . . . . . . . . . . . . . 953,749 131,274Deferred income tax assets, net . . . . . . . . . . . . . . . . . . . . . . . . . . . . . . . . . . . . . . . . . . . 144,438 147,149Other noncurrent assets . . . . . . . . . . . . . . . . . . . . . . . . . . . . . . . . . . . . . . . . . . . . . . . . . 209,663 183,013
Total assets . . . . . . . . . . . . . . . . . . . . . . . . . . . . . . . . . . . . . . . . . . . . . . . . . . $11,718,916 $8,134,718
Liabilities and Stockholders’ EquityCurrent liabilities:
Accounts payable . . . . . . . . . . . . . . . . . . . . . . . . . . . . . . . . . . . . . . . . . . . . . . . . . $ 145,687 $ 113,394Deferred revenue . . . . . . . . . . . . . . . . . . . . . . . . . . . . . . . . . . . . . . . . . . . . . . . . . . 224,114 182,893Short-term debt . . . . . . . . . . . . . . . . . . . . . . . . . . . . . . . . . . . . . . . . . . . . . . . . . . . 700,002 —Accrued expenses and other current liabilities . . . . . . . . . . . . . . . . . . . . . . . . . . . 1,522,291 1,478,221
Total current liabilities . . . . . . . . . . . . . . . . . . . . . . . . . . . . . . . . . . . . . . . . . 2,592,094 1,774,508Deferred revenue, noncurrent . . . . . . . . . . . . . . . . . . . . . . . . . . . . . . . . . . . . . . . . . . . . 80,956 —Deferred income tax liabilities, net . . . . . . . . . . . . . . . . . . . . . . . . . . . . . . . . . . . . . . . . 251,724 21,170Long-term debt . . . . . . . . . . . . . . . . . . . . . . . . . . . . . . . . . . . . . . . . . . . . . . . . . . . . . . . 937,500 —Other noncurrent liabilities . . . . . . . . . . . . . . . . . . . . . . . . . . . . . . . . . . . . . . . . . . . . . . 116,424 203,249
Total liabilities . . . . . . . . . . . . . . . . . . . . . . . . . . . . . . . . . . . . . . . . . . . . . . . 3,978,698 1,998,927
Commitments and contingencies (See Note 14)
Stockholders’ Equity:Preferred stock, $0.10 par value, 15,000 shares authorized, none issued . . . . . . . . . . . — —Class A common stock, $0.01 par value, 1,000,000 shares authorized, 609,398 and
607,729 shares issued and outstanding at December 31, 2014 and December 31,2013, respectively . . . . . . . . . . . . . . . . . . . . . . . . . . . . . . . . . . . . . . . . . . . . . . . . . . . 6,094 6,077
Additional paid-in capital . . . . . . . . . . . . . . . . . . . . . . . . . . . . . . . . . . . . . . . . . . . . . . . 555,558 543,606Retained earnings . . . . . . . . . . . . . . . . . . . . . . . . . . . . . . . . . . . . . . . . . . . . . . . . . . . . . 7,301,634 5,862,367Accumulated other comprehensive income (loss) . . . . . . . . . . . . . . . . . . . . . . . . . . . . (123,068) (276,259)
Total stockholders’ equity . . . . . . . . . . . . . . . . . . . . . . . . . . . . . . . . . . . . . . . 7,740,218 6,135,791
Total liabilities and stockholders’ equity . . . . . . . . . . . . . . . . . . . . . . . . . . . $11,718,916 $8,134,718
The accompanying notes are an integral part of the consolidated financial statements.
F-4
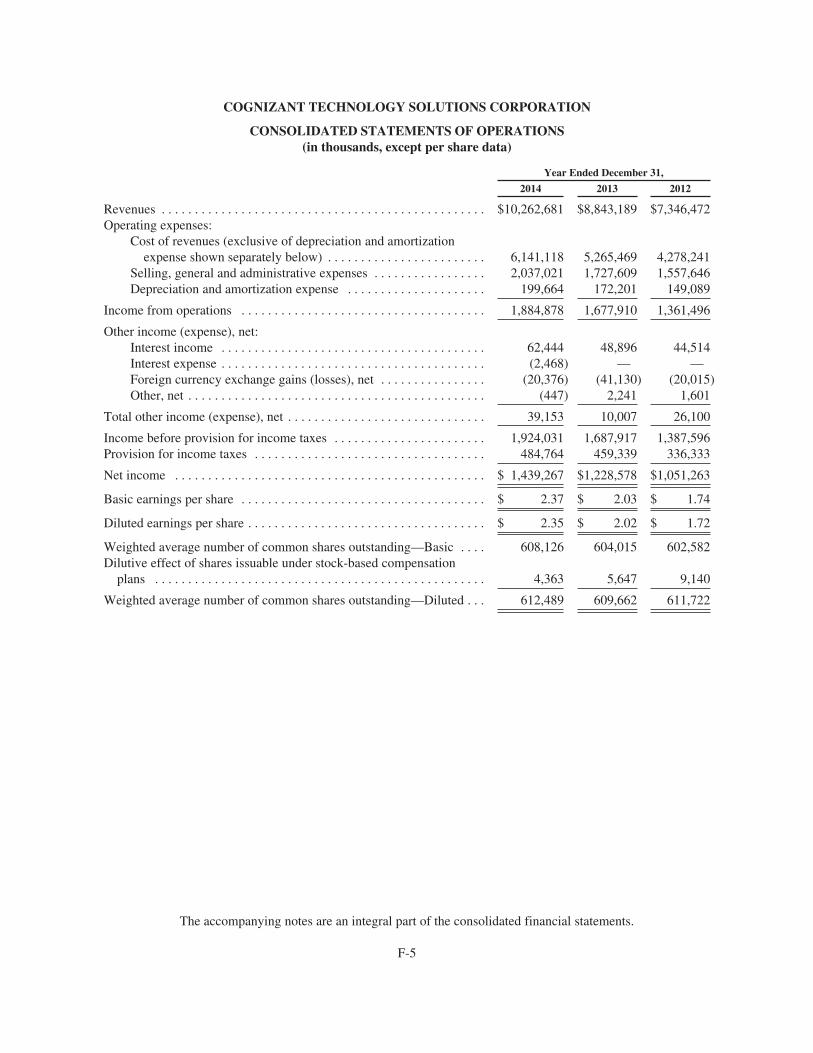
COGNIZANT TECHNOLOGY SOLUTIONS CORPORATION
CONSOLIDATED STATEMENTS OF OPERATIONS(in thousands, except per share data)
Year Ended December 31,
2014 2013 2012
Revenues . . . . . . . . . . . . . . . . . . . . . . . . . . . . . . . . . . . . . . . . . . . . . . . . . $10,262,681 $8,843,189 $7,346,472Operating expenses:
Cost of revenues (exclusive of depreciation and amortizationexpense shown separately below) . . . . . . . . . . . . . . . . . . . . . . . . 6,141,118 5,265,469 4,278,241
Selling, general and administrative expenses . . . . . . . . . . . . . . . . . 2,037,021 1,727,609 1,557,646Depreciation and amortization expense . . . . . . . . . . . . . . . . . . . . . 199,664 172,201 149,089
Income from operations . . . . . . . . . . . . . . . . . . . . . . . . . . . . . . . . . . . . . 1,884,878 1,677,910 1,361,496
Other income (expense), net:Interest income . . . . . . . . . . . . . . . . . . . . . . . . . . . . . . . . . . . . . . . . 62,444 48,896 44,514Interest expense . . . . . . . . . . . . . . . . . . . . . . . . . . . . . . . . . . . . . . . . (2,468) — —Foreign currency exchange gains (losses), net . . . . . . . . . . . . . . . . (20,376) (41,130) (20,015)Other, net . . . . . . . . . . . . . . . . . . . . . . . . . . . . . . . . . . . . . . . . . . . . . (447) 2,241 1,601
Total other income (expense), net . . . . . . . . . . . . . . . . . . . . . . . . . . . . . . 39,153 10,007 26,100
Income before provision for income taxes . . . . . . . . . . . . . . . . . . . . . . . 1,924,031 1,687,917 1,387,596Provision for income taxes . . . . . . . . . . . . . . . . . . . . . . . . . . . . . . . . . . . 484,764 459,339 336,333
Net income . . . . . . . . . . . . . . . . . . . . . . . . . . . . . . . . . . . . . . . . . . . . . . . $ 1,439,267 $1,228,578 $1,051,263
Basic earnings per share . . . . . . . . . . . . . . . . . . . . . . . . . . . . . . . . . . . . . $ 2.37 $ 2.03 $ 1.74
Diluted earnings per share . . . . . . . . . . . . . . . . . . . . . . . . . . . . . . . . . . . . $ 2.35 $ 2.02 $ 1.72
Weighted average number of common shares outstanding—Basic . . . . 608,126 604,015 602,582Dilutive effect of shares issuable under stock-based compensation
plans . . . . . . . . . . . . . . . . . . . . . . . . . . . . . . . . . . . . . . . . . . . . . . . . . . 4,363 5,647 9,140
Weighted average number of common shares outstanding—Diluted . . . 612,489 609,662 611,722
The accompanying notes are an integral part of the consolidated financial statements.
F-5
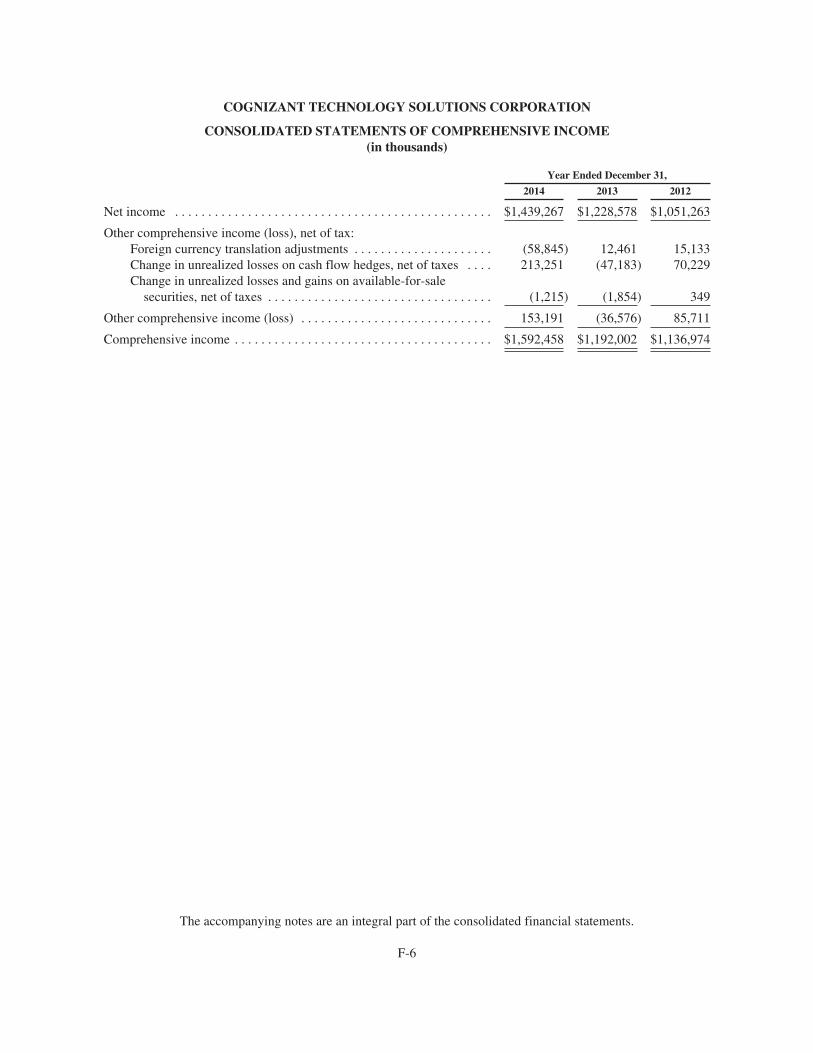
COGNIZANT TECHNOLOGY SOLUTIONS CORPORATION
CONSOLIDATED STATEMENTS OF COMPREHENSIVE INCOME(in thousands)
Year Ended December 31,
2014 2013 2012
Net income . . . . . . . . . . . . . . . . . . . . . . . . . . . . . . . . . . . . . . . . . . . . . . . . $1,439,267 $1,228,578 $1,051,263
Other comprehensive income (loss), net of tax:Foreign currency translation adjustments . . . . . . . . . . . . . . . . . . . . . (58,845) 12,461 15,133Change in unrealized losses on cash flow hedges, net of taxes . . . . 213,251 (47,183) 70,229Change in unrealized losses and gains on available-for-sale
securities, net of taxes . . . . . . . . . . . . . . . . . . . . . . . . . . . . . . . . . . (1,215) (1,854) 349
Other comprehensive income (loss) . . . . . . . . . . . . . . . . . . . . . . . . . . . . . 153,191 (36,576) 85,711
Comprehensive income . . . . . . . . . . . . . . . . . . . . . . . . . . . . . . . . . . . . . . . $1,592,458 $1,192,002 $1,136,974
The accompanying notes are an integral part of the consolidated financial statements.
F-6
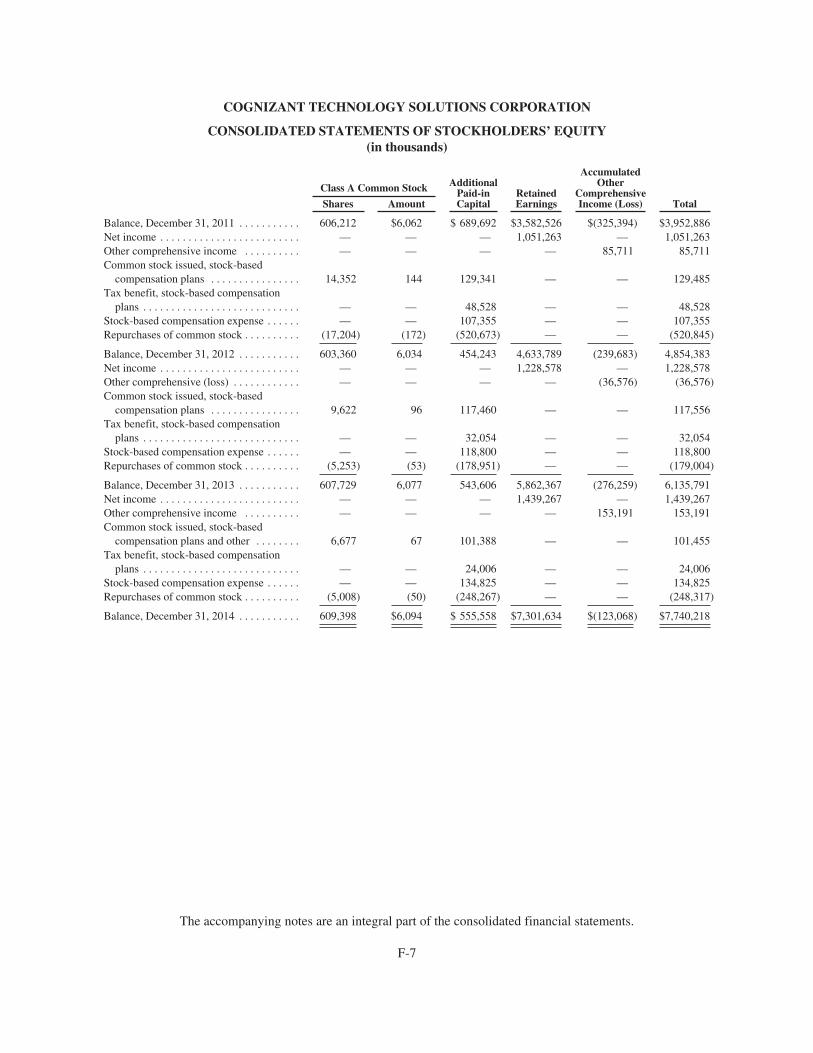
COGNIZANT TECHNOLOGY SOLUTIONS CORPORATION
CONSOLIDATED STATEMENTS OF STOCKHOLDERS’ EQUITY(in thousands)
Class A Common Stock AdditionalPaid-inCapital
RetainedEarnings
AccumulatedOther
ComprehensiveIncome (Loss) TotalShares Amount
Balance, December 31, 2011 . . . . . . . . . . . 606,212 $6,062 $ 689,692 $3,582,526 $(325,394) $3,952,886Net income . . . . . . . . . . . . . . . . . . . . . . . . . — — — 1,051,263 — 1,051,263Other comprehensive income . . . . . . . . . . — — — — 85,711 85,711Common stock issued, stock-based
compensation plans . . . . . . . . . . . . . . . . 14,352 144 129,341 — — 129,485Tax benefit, stock-based compensation
plans . . . . . . . . . . . . . . . . . . . . . . . . . . . . — — 48,528 — — 48,528Stock-based compensation expense . . . . . . — — 107,355 — — 107,355Repurchases of common stock . . . . . . . . . . (17,204) (172) (520,673) — — (520,845)
Balance, December 31, 2012 . . . . . . . . . . . 603,360 6,034 454,243 4,633,789 (239,683) 4,854,383Net income . . . . . . . . . . . . . . . . . . . . . . . . . — — — 1,228,578 — 1,228,578Other comprehensive (loss) . . . . . . . . . . . . — — — — (36,576) (36,576)Common stock issued, stock-based
compensation plans . . . . . . . . . . . . . . . . 9,622 96 117,460 — — 117,556Tax benefit, stock-based compensation
plans . . . . . . . . . . . . . . . . . . . . . . . . . . . . — — 32,054 — — 32,054Stock-based compensation expense . . . . . . — — 118,800 — — 118,800Repurchases of common stock . . . . . . . . . . (5,253) (53) (178,951) — — (179,004)
Balance, December 31, 2013 . . . . . . . . . . . 607,729 6,077 543,606 5,862,367 (276,259) 6,135,791Net income . . . . . . . . . . . . . . . . . . . . . . . . . — — — 1,439,267 — 1,439,267Other comprehensive income . . . . . . . . . . — — — — 153,191 153,191Common stock issued, stock-based
compensation plans and other . . . . . . . . 6,677 67 101,388 — — 101,455Tax benefit, stock-based compensation
plans . . . . . . . . . . . . . . . . . . . . . . . . . . . . — — 24,006 — — 24,006Stock-based compensation expense . . . . . . — — 134,825 — — 134,825Repurchases of common stock . . . . . . . . . . (5,008) (50) (248,267) — — (248,317)
Balance, December 31, 2014 . . . . . . . . . . . 609,398 $6,094 $ 555,558 $7,301,634 $(123,068) $7,740,218
The accompanying notes are an integral part of the consolidated financial statements.
F-7
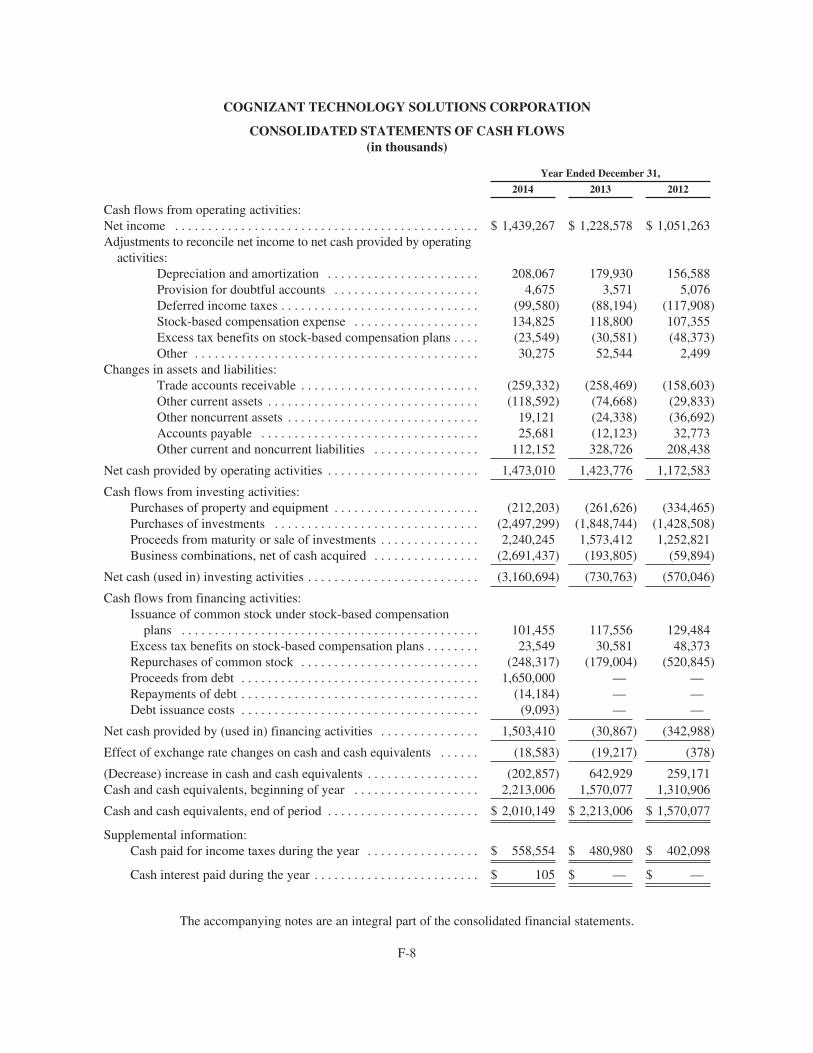
COGNIZANT TECHNOLOGY SOLUTIONS CORPORATION
CONSOLIDATED STATEMENTS OF CASH FLOWS(in thousands)
Year Ended December 31,
2014 2013 2012
Cash flows from operating activities:Net income . . . . . . . . . . . . . . . . . . . . . . . . . . . . . . . . . . . . . . . . . . . . . . $ 1,439,267 $ 1,228,578 $ 1,051,263Adjustments to reconcile net income to net cash provided by operating
activities:Depreciation and amortization . . . . . . . . . . . . . . . . . . . . . . . 208,067 179,930 156,588Provision for doubtful accounts . . . . . . . . . . . . . . . . . . . . . . 4,675 3,571 5,076Deferred income taxes . . . . . . . . . . . . . . . . . . . . . . . . . . . . . . (99,580) (88,194) (117,908)Stock-based compensation expense . . . . . . . . . . . . . . . . . . . 134,825 118,800 107,355Excess tax benefits on stock-based compensation plans . . . . (23,549) (30,581) (48,373)Other . . . . . . . . . . . . . . . . . . . . . . . . . . . . . . . . . . . . . . . . . . . 30,275 52,544 2,499
Changes in assets and liabilities:Trade accounts receivable . . . . . . . . . . . . . . . . . . . . . . . . . . . (259,332) (258,469) (158,603)Other current assets . . . . . . . . . . . . . . . . . . . . . . . . . . . . . . . . (118,592) (74,668) (29,833)Other noncurrent assets . . . . . . . . . . . . . . . . . . . . . . . . . . . . . 19,121 (24,338) (36,692)Accounts payable . . . . . . . . . . . . . . . . . . . . . . . . . . . . . . . . . 25,681 (12,123) 32,773Other current and noncurrent liabilities . . . . . . . . . . . . . . . . 112,152 328,726 208,438
Net cash provided by operating activities . . . . . . . . . . . . . . . . . . . . . . . 1,473,010 1,423,776 1,172,583
Cash flows from investing activities:Purchases of property and equipment . . . . . . . . . . . . . . . . . . . . . . (212,203) (261,626) (334,465)Purchases of investments . . . . . . . . . . . . . . . . . . . . . . . . . . . . . . . (2,497,299) (1,848,744) (1,428,508)Proceeds from maturity or sale of investments . . . . . . . . . . . . . . . 2,240,245 1,573,412 1,252,821Business combinations, net of cash acquired . . . . . . . . . . . . . . . . (2,691,437) (193,805) (59,894)
Net cash (used in) investing activities . . . . . . . . . . . . . . . . . . . . . . . . . . (3,160,694) (730,763) (570,046)
Cash flows from financing activities:Issuance of common stock under stock-based compensation
plans . . . . . . . . . . . . . . . . . . . . . . . . . . . . . . . . . . . . . . . . . . . . . 101,455 117,556 129,484Excess tax benefits on stock-based compensation plans . . . . . . . . 23,549 30,581 48,373Repurchases of common stock . . . . . . . . . . . . . . . . . . . . . . . . . . . (248,317) (179,004) (520,845)Proceeds from debt . . . . . . . . . . . . . . . . . . . . . . . . . . . . . . . . . . . . 1,650,000 — —Repayments of debt . . . . . . . . . . . . . . . . . . . . . . . . . . . . . . . . . . . . (14,184) — —Debt issuance costs . . . . . . . . . . . . . . . . . . . . . . . . . . . . . . . . . . . . (9,093) — —
Net cash provided by (used in) financing activities . . . . . . . . . . . . . . . 1,503,410 (30,867) (342,988)
Effect of exchange rate changes on cash and cash equivalents . . . . . . (18,583) (19,217) (378)
(Decrease) increase in cash and cash equivalents . . . . . . . . . . . . . . . . . (202,857) 642,929 259,171Cash and cash equivalents, beginning of year . . . . . . . . . . . . . . . . . . . 2,213,006 1,570,077 1,310,906
Cash and cash equivalents, end of period . . . . . . . . . . . . . . . . . . . . . . . $ 2,010,149 $ 2,213,006 $ 1,570,077
Supplemental information:Cash paid for income taxes during the year . . . . . . . . . . . . . . . . . $ 558,554 $ 480,980 $ 402,098
Cash interest paid during the year . . . . . . . . . . . . . . . . . . . . . . . . . $ 105 $ — $ —
The accompanying notes are an integral part of the consolidated financial statements.
F-8
Notes to Consolidated Financial Statements(Dollars in thousands, except share data)
Note 1 — Summary of Significant Accounting Policies
The terms “Cognizant,” “we,” “our,” “us” and “the Company” refer to Cognizant Technology SolutionsCorporation and its subsidiaries unless the context indicates otherwise.
Description of Business. We are a leading provider of information technology (IT), consulting and businessprocess services, dedicated to helping the world’s leading companies innovate and build stronger businesses. Ourclients engage us to help them operate more efficiently, provide solutions to critical business and technologyproblems, and help them drive technology-based innovation and growth. Our core competencies include:Business, Process, Operations and IT Consulting, Application Development and Systems Integration, EnterpriseInformation Management, or EIM, Application Testing, Application Maintenance, IT Infrastructure Services, orIT IS and Business Process Services, or BPS. We tailor our services to specific industries and utilize anintegrated global delivery model. This seamless global sourcing model combines industry-specific expertise,client service teams based on-site at the client locations and delivery teams located at dedicated near-shore andoffshore global delivery centers.
Basis of Presentation and Principles of Consolidation. The consolidated financial statements are presentedin accordance with generally accepted accounting principles in the United States of America, or U.S. GAAP, andreflect the consolidated financial position, results of operations, comprehensive income and cash flows of ourconsolidated subsidiaries for all periods presented. All intercompany balances and transactions have beeneliminated in consolidation.
Stock Split. On February 4, 2014, our Board of Directors declared a two-for-one stock split of our Class Acommon stock in the form of a 100% stock dividend, which was paid on March 7, 2014 to stockholders of recordas of February 21, 2014. The stock split has been reflected in the accompanying consolidated financialstatements, and all applicable references as to the number of outstanding common shares and per shareinformation herein, except par values, have been retroactively adjusted to reflect the stock split as if it occurred atthe beginning of the earliest period presented. In addition, our stockholders’ equity accounts were restated toreflect the reclassification of an amount equal to the par value of the increase in issued common shares from theadditional paid-in-capital account to the common stock accounts.
Cash and Cash Equivalents and Investments. Cash and cash equivalents consist of all cash balances,including money market funds and liquid instruments. Liquid instruments are classified as cash equivalents whentheir maturities at the date of purchase are three months or less and as short-term investments when theirmaturities at the date of purchase are greater than three months.
We determine the appropriate classification of our investments in marketable securities at the date ofpurchase and reevaluate such designation at each balance sheet date. We have classified and accounted for ourmarketable securities as available-for-sale. After consideration of our risk versus reward objectives, as well asour liquidity requirements, we may sell these securities prior to their stated maturities. As we view thesemarketable securities as available to support current operations, we classify such securities with maturities at thedate of purchase beyond twelve months as short-term investments because such investments represent aninvestment in cash that is available for current operations.
Available-for-sale securities are reported at fair value with changes in unrealized gains and losses recordedas a separate component of accumulated other comprehensive income (loss) until realized. We determine the costof the securities sold based on the specific identification method. Time deposits with financial institutions arevalued at cost, which approximates fair value.
Interest and amortization of premiums and discounts for debt securities are included in interest income. Wealso evaluate our available-for-sale investments periodically for possible other-than-temporary impairment by
F-9
reviewing factors such as the length of time and extent to which fair value has been below cost basis, thefinancial condition of the issuer, whether we intend to sell the security and whether it is more likely than not thatwe will be required to sell the security prior to recovery of its amortized cost basis. Once a decline in fair value isdetermined to be other-than-temporary, an impairment charge is generally recorded to income and a new costbasis in the investment is established.
Allowance for Doubtful Accounts. We maintain an allowance for doubtful accounts for estimated lossesresulting from the inability of our customers to make required payments. The allowance for doubtful accounts isdetermined by evaluating the relative credit-worthiness of each customer, historical collections experience andother information, including the aging of the receivables. We evaluate the collectibility of our accountsreceivable on an on-going basis and write-off accounts when they are deemed to be uncollectible.
Unbilled Accounts Receivable. Unbilled accounts receivable represent revenues on contracts to be billed, insubsequent periods, as per the terms of the related contracts.
Short-term Financial Assets and Liabilities. Cash and cash equivalents, trade receivables, accounts payable andother accrued liabilities are short-term in nature and, accordingly, their carrying values approximate fair value.
Property and Equipment. Property and equipment are stated at cost, net of accumulated depreciation.Depreciation is calculated on the straight-line basis over the estimated useful lives of the assets. Leaseholdimprovements are amortized on a straight-line basis over the shorter of the term of the lease or the estimateduseful life of the improvement. In India, leasehold land is leased by us from the government of India with leaseterms ranging up to 99 years. Lease payments are made at the inception of the lease agreement and amortizedover the lease term. Maintenance and repairs are expensed as incurred, while renewals and betterments arecapitalized. Deposits paid towards acquisition of long-lived assets and the cost of assets not put in use before thebalance sheet date are disclosed under the caption “capital work-in-progress” in Note 4.
Internal Use Software. We capitalize certain costs that are incurred to purchase, develop and implementinternal-use software during the application development phase, which primarily includes coding and testing andcertain data conversion activities. Capitalized costs are amortized on a straight-line basis over the useful life ofthe software. Costs incurred performing activities associated with the preliminary project phases and post-implementation phases are expensed as incurred.
Business Combinations. We account for business combinations using the acquisition method, which requiresthe identification of the acquirer, the determination of the acquisition date, and the allocation of the purchaseprice paid by the acquirer to the identifiable tangible and intangible assets acquired, the liabilities assumed, andany noncontrolling interest in the acquiree at their acquisition date fair values. Goodwill represents the excess ofthe purchase price over the fair value of net assets acquired, including the amount assigned to identifiableintangible assets. Identifiable intangible assets with finite lives are amortized over their useful lives. Acquisition-related costs are expensed in the periods in which the costs are incurred. The results of operations of acquiredbusinesses are included in our consolidated financial statements from the acquisition date.
Long-lived Assets and Finite-lived Intangibles. We review long-lived assets and certain finite-livedidentifiable intangibles for impairment whenever events or changes in circumstances indicate that the carryingamount of an asset may not be recoverable. We recognize an impairment loss when the sum of undiscountedexpected future cash flows is less than the carrying amount of such assets. The impairment loss would equal theamount by which the carrying amount of the asset exceeds the fair value of the asset. Other intangibles consistprimarily of customer relationships and developed technology, which are being amortized on a straight-line basisover their estimated useful lives.
Goodwill and Indefinite-lived Intangibles. We evaluate goodwill and indefinite-lived intangible assets, at thereporting unit level, for impairment at least annually, or as circumstances warrant. If an impairment is indicated,a write down to fair value (normally measured by discounting estimated future cash flows) is recorded.
F-10
Stock Repurchase Program. Our existing stock repurchase program, as amended and approved by our Boardof Directors, allows for the repurchase of $2,000,000 of our outstanding shares of Class A common stock andexpires on December 31, 2015. Through December 31, 2014, we completed stock repurchases of 35,242,550shares for $1,186,369, inclusive of fees and expenses, under this program. Additional stock repurchases weremade in connection with our stock-based compensation plans, whereby Company shares were tendered byemployees for payment of applicable statutory tax withholdings. During 2014, 2013, and 2012 such repurchasestotaled 1,207,595, 1,165,872 and 1,065,184 shares, respectively, at an aggregate cost of $60,075, $47,442 and$34,925, respectively. At the time of repurchase, shares are returned to the status of authorized and unissuedshares. We account for the repurchases as constructively retired and record such repurchases as a reduction ofClass A common stock and additional paid-in capital.
Revenue Recognition. Revenues related to time-and-material contracts are recognized as the service isperformed and amounts are earned. Revenues from transaction-priced contracts are recognized as transactions areprocessed and amounts are earned. Revenues related to fixed-price contracts for highly complex applicationdevelopment and systems integration services are recognized as the service is performed using the percentage ofcompletion method of accounting, under which the total value of revenue is recognized on the basis of thepercentage that each contract’s total labor cost to date bears to the total expected labor costs (cost to costmethod). Revenues related to fixed price outsourcing services are recognized on a straight-line basis unlessrevenues are earned and obligations are fulfilled in a different pattern. Revenues related to fixed-price contractsfor consulting or other IT services are recognized as services are performed on a proportional performance basisbased upon the level of effort.
For all services, revenue is earned and recognized only when all of the following criteria are met: evidenceof an arrangement is obtained, the price is fixed or determinable, the services have been rendered andcollectibility is reasonably assured. Contingent or incentive revenues are recognized when the contingency issatisfied and we conclude the amounts are earned. Volume discounts are recorded as a reduction of revenue overthe contract period as services are provided. Revenues also include the reimbursement of out-of-pocket expenses.
Costs to deliver services are expensed to cost of revenues as incurred with the exception of specific costsdirectly related to transition or set-up activities for outsourcing contracts. Transition costs are deferred andexpensed ratably over the period of service. Generally, deferred amounts are protected in the event of earlytermination of the contract and are monitored regularly for impairment. Impairment losses are recorded whenprojected remaining undiscounted operating cash flows of the related contract are not sufficient to recover thecarrying amount of the contract assets. Deferred transition costs were approximately $98,172 and $80,254 asof December 31, 2014 and 2013, respectively, and are included in other noncurrent assets in our consolidatedstatements of financial position. Costs related to warranty provisions are accrued at the time the related revenuesare recorded.
We may enter into arrangements that consist of multiple elements. Such arrangements may include anycombination of our consulting and technology services and outsourcing services. For arrangements with multipledeliverables, we evaluate at the inception of each new arrangement all deliverables to determine whether theyrepresent separate units of accounting. For arrangements with multiple units of accounting, other thanarrangements that contain software licenses and software-related services, we allocate consideration among theunits of accounting, where separable, based on their relative selling price. Relative selling price is determinedbased on vendor-specific objective evidence, or VSOE, if it exists. Otherwise, third-party evidence of sellingprice is used, when it is available, and in circumstances when neither VSOE nor third-party evidence of sellingprice is available, management’s best estimate of selling price is used. Revenue is recognized for each unit ofaccounting based on our revenue recognition policy described above.
Fixed-price contracts are generally cancelable subject to a specified notice period. All services provided by usthrough the date of cancellation are due and payable under the contract terms. We issue invoices related to fixed-price contracts based upon achievement of milestones during a project or other contractual terms. Differences
F-11
between the timing of billing, based on contract milestones or other contractual terms, and the recognition ofrevenue are recognized as either unbilled receivables or deferred revenue. Estimates of certain fixed-price contractsare subject to adjustment as a project progresses to reflect changes in expected completion costs or efforts. Thecumulative impact of any revision in estimates is reflected in the financial reporting period in which the change inestimate becomes known and any anticipated losses on contracts are recognized immediately.
We also generate product revenue from licensing our software. For perpetual software license arrangementsthat do not require significant modification or customization of the underlying software, revenue is recognizedwhen the software is delivered and all other software revenue recognition criteria are met. For software licensearrangements that require significant functionality enhancements or modification of the software, revenue for thesoftware license and those services is recognized as those services are performed. For software licensearrangements that include a right to use the product for a defined period of time, we recognize revenue ratablyover the term of the license.
We may enter into arrangements with customers that purchase both software licenses and software-relatedservices from us at the same time, or within close proximity of one another (referred to as software-relatedmultiple-element arrangements). Such software related multiple-element arrangements may include softwarelicenses, software license updates, product support contracts and other software-related services. For thosesoftware related multiple-element arrangements, we apply the residual method to determine the amount ofsoftware license revenue. Under the residual method, if VSOE of fair value exists for undelivered elements in amultiple-element arrangement, such fair value of the undelivered elements is deferred with the remaining portionof the arrangement consideration generally recognized upon delivery of the software license. For arrangements inwhich VSOE of fair value does not exist for each software-related undelivered element, revenue for the softwarelicense is deferred and not recognized until VSOE of fair value is available for the undelivered element ordelivery of each element has occurred. If the only undelivered element is a service, revenue from the deliveredelement is recognized over the service period.
We also enter into multiple-element arrangements that may include a combination of software licenses andvarious software-related and non-software-related services. In such arrangements, we first allocate the totalarrangement consideration, based on relative selling prices, between the software group of elements and the non-software group of elements. We then further allocate consideration within the software group to the respectiveelements within that group following the software-related multiple-element arrangements policies describedabove. For the non-software group of elements, we further allocate consideration to the respective elementsbased on relative selling prices. After the arrangement consideration has been allocated to the individualelements, we account for each respective element in the arrangement as described above.
Stock-Based Compensation. Stock-based compensation expense for awards of equity instruments toemployees and non-employee directors is determined based on the grant-date fair value of those awards. Werecognize these compensation costs net of an estimated forfeiture rate over the requisite service period of theaward. Forfeitures are estimated on the date of grant and revised if actual or expected forfeiture activity differsmaterially from original estimates.
Foreign Currency. The assets and liabilities of our foreign subsidiaries whose functional currency is not theU.S. dollar are translated into U.S. dollars from local currencies at current exchange rates and revenues andexpenses are translated from local currencies at average monthly exchange rates. The resulting translationadjustments are recorded in accumulated other comprehensive income (loss) on the accompanying consolidatedstatements of financial position.
Foreign currency transactions and balances are those that are denominated in a currency other than thesubsidiary’s functional currency. The U.S. dollar is the functional currency for certain foreign subsidiaries whoconduct business predominantly in U.S. dollars. For these subsidiaries, transactions and balances denominated inthe local currency are foreign currency transactions. Foreign currency transactions and balances related to
F-12
non-monetary assets and liabilities are remeasured to the functional currency of the subsidiary at historicalexchange rates while monetary assets and liabilities are remeasured to the functional currency of the subsidiary atcurrent exchange rates. Foreign currency exchange gains or losses from remeasurement are included in income.Net foreign currency exchange (losses) reported on our consolidated statement of operations are inclusive ofgains or losses on our undesignated foreign currency hedges.
Derivative Financial Instruments. Derivative financial instruments are accounted for in accordance with theauthoritative guidance which requires that each derivative instrument be recorded on the balance sheet as eitheran asset or liability measured at its fair value as of the reporting date. Our derivative financial instruments consistof foreign exchange forward contracts. For derivative financial instruments to qualify for hedge accounting, thefollowing criteria must be met: (1) the hedging instrument must be designated as a hedge; (2) the hedgedexposure must be specifically identifiable and expose us to risk; and (3) it is expected that a change in fair valueof the derivative financial instrument and an opposite change in the fair value of the hedged exposure will have ahigh degree of correlation. The authoritative guidance also requires that changes in our derivatives’ fair values berecognized in income unless specific hedge accounting and documentation criteria are met (i.e., the instrumentsare accounted for as hedges). For items to which hedge accounting is applied, we record the effective portion ofour derivative financial instruments that are designated as cash flow hedges in accumulated other comprehensiveincome (loss) in the accompanying consolidated statements of financial position. Any ineffectiveness or excludedportion of a designated cash flow hedge is recognized in income.
Use of Estimates. The preparation of financial statements requires management to make estimates andassumptions that affect the reported amounts of assets and liabilities, including the recoverability of tangible andintangible assets, disclosure of contingent assets and liabilities as of the date of the financial statements, and thereported amounts of revenues and expenses during the period. On an on-going basis, management reevaluatesthese estimates. The most significant estimates relate to the recognition of revenue and profits based on thepercentage of completion method of accounting for certain fixed-bid contracts, the allowance for doubtfulaccounts, income taxes, valuation of goodwill, intangible assets and other long-lived assets, valuation ofinvestments and derivative financial instruments, assumptions used in valuing stock-based compensationarrangements, contingencies and litigation. Management bases its estimates on historical experience and onvarious other assumptions that are believed to be reasonable under the circumstances. The actual amounts mayvary from the estimates used in the preparation of the accompanying consolidated financial statements.
Risks and Uncertainties. The majority of our development and delivery centers and employees are located inIndia. As a result, we may be subject to certain risks associated with international operations, including risksassociated with foreign currency exchange rate fluctuations and risks associated with the application andimposition of protective legislation and regulations relating to import and export or otherwise resulting fromforeign policy or the variability of foreign economic or political conditions. Additional risks associated withinternational operations include difficulties in enforcing intellectual property rights, the burdens of complyingwith a wide variety of foreign laws, potential geo-political and other risks associated with terrorist activities andlocal or cross border conflicts and potentially adverse tax consequences, tariffs, quotas and other barriers.
Concentration of Credit Risk. Financial instruments that potentially subject us to significant concentrationsof credit risk consist primarily of cash and cash equivalents, time deposits, investments in securities, derivativefinancial instruments and trade accounts receivable. We maintain our cash and cash equivalents and investmentswith high credit quality financial institutions, invest in investment-grade debt securities and limit the amount ofcredit exposure to any one commercial issuer. Trade accounts receivable are dispersed across many customersoperating in different industries; therefore, concentration of credit risk is limited.
Income Taxes. We provide for income taxes utilizing the asset and liability method of accounting. Underthis method, deferred income taxes are recorded to reflect the tax consequences in future years of differencesbetween the tax basis of assets and liabilities and their financial reporting amounts at each balance sheet date,based on enacted tax laws and statutory tax rates applicable to the periods in which the differences are expected
F-13
to affect taxable income. If it is determined that it is more likely than not that future tax benefits associated with adeferred income tax asset will not be realized, a valuation allowance is provided. The effect on deferred incometax assets and liabilities of a change in the tax rates is recognized in income in the period that includes theenactment date. Tax benefits earned on exercise of employee stock options in excess of compensation charged toincome are credited to additional paid-in capital. Our provision for income taxes also includes the impact ofprovisions established for uncertain income tax positions, as well as the related interest.
Earnings Per Share, or EPS. Basic EPS excludes dilution and is computed by dividing earnings available tocommon stockholders by the weighted-average number of common shares outstanding for the period. DilutedEPS includes all potential dilutive common stock in the weighted average shares outstanding. For purposes ofcomputing diluted earnings per share for the years ended December 31, 2014, 2013 and 2012, respectively,4,363,000, 5,647,000, and 9,140,000 shares were assumed to have been outstanding related to common shareequivalents. We exclude options with exercise prices that are greater than the average market price for the periodfrom the calculation of diluted EPS because their effect would be anti-dilutive. We excluded 4,300 shares in2014, 6,800 shares in 2013, and 39,000 in 2012 from our diluted EPS calculation. Also, in accordance with theauthoritative guidance, we excluded from the calculation of diluted EPS an additional 78,800 shares in 2014,97,800 shares in 2013, and 158,600 shares in 2012, related to stock based awards whose combined exercise price,unamortized fair value and excess tax benefits were greater in each of those periods than the average marketprice of our common stock because their effect would be anti-dilutive. We include performance stock unitawards in the dilutive potential common shares when they become contingently issuable per the authoritativeguidance and exclude the awards when they are not contingently issuable.
Recently Adopted Accounting Pronouncement.
In July 2013, the Financial Accounting Standards Board, or FASB, issued new guidance which requires thenetting of any unrecognized tax benefits against all available same-jurisdiction deferred income tax carryforwardassets that would apply if the uncertain tax positions were settled. We adopted this standard on January 1, 2014.As of December 31, 2014, we netted an unrecognized tax benefit of $94,784 against same-jurisdiction noncurrentdeferred income tax assets. In our December 31, 2013 consolidated statement of financial position, wereclassified $74,196 from “other non-current liabilities” to non-current “deferred income tax assets, net” toconform to current period’s presentation. The adoption of this standard had no effect on our consolidated resultsof operations or stockholder’s equity.
New Accounting Pronouncement.
In May 2014, the FASB issued a standard on revenue from contracts with customers. The new standard setsforth a single comprehensive model for recognizing and reporting revenue. The standard also requires additionalfinancial statement disclosures that will enable users to understand the nature, amount, timing and uncertainty ofrevenue and cash flows relating to customer contracts. The new standard will be effective for periods beginningon or after January 1, 2017. Early adoption is not permitted. The standard allows for two methods of adoption:the full retrospective adoption, which requires the standard to be applied to each prior period presented, or themodified retrospective adoption, which requires the cumulative effect of adoption to be recognized as anadjustment to opening retained earnings in the period of adoption. We are currently evaluating the effect the newstandard will have on our consolidated financial statements and related disclosures.
Note 2 — Business Combinations
TriZetto Acquisition:
On November 20, 2014, we completed the acquisition of TZ US Parent, Inc. (“TriZetto”), a private U.S.healthcare information technology company for an aggregate purchase price, after giving effect to variouspurchase price adjustments, of approximately $2,627,830 (net of cash acquired of $170,510) (“the TriZetto
F-14
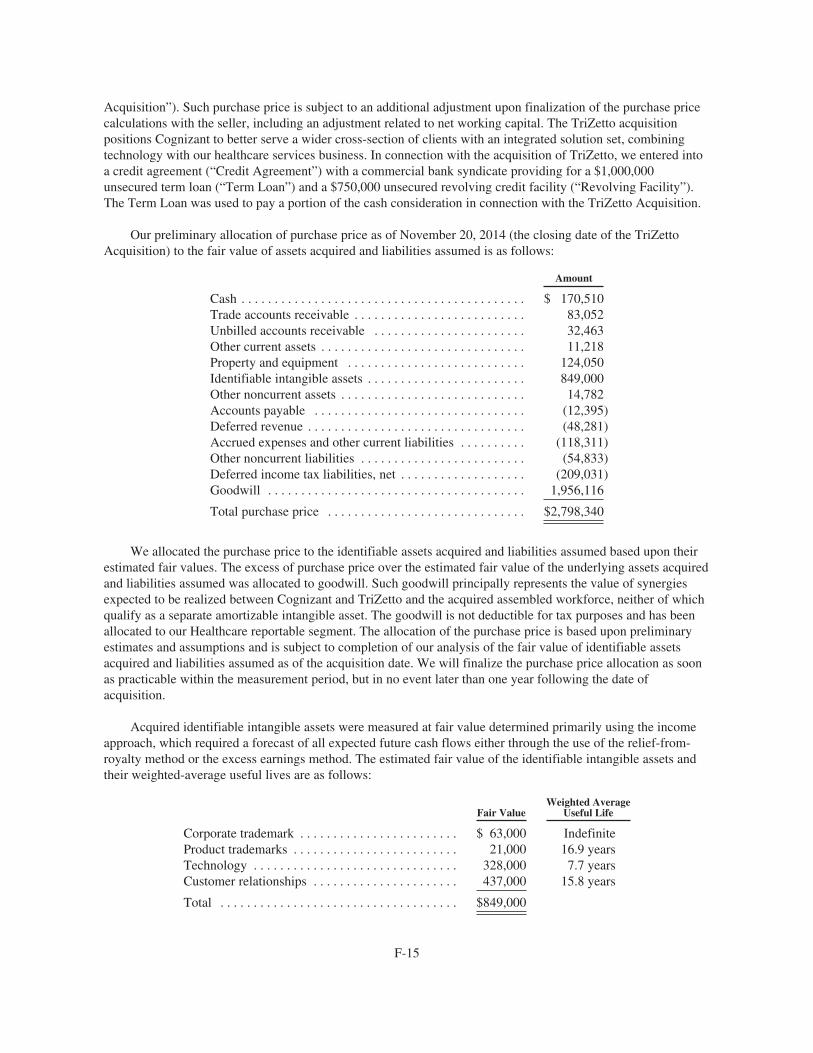
Acquisition”). Such purchase price is subject to an additional adjustment upon finalization of the purchase pricecalculations with the seller, including an adjustment related to net working capital. The TriZetto acquisitionpositions Cognizant to better serve a wider cross-section of clients with an integrated solution set, combiningtechnology with our healthcare services business. In connection with the acquisition of TriZetto, we entered intoa credit agreement (“Credit Agreement”) with a commercial bank syndicate providing for a $1,000,000unsecured term loan (“Term Loan”) and a $750,000 unsecured revolving credit facility (“Revolving Facility”).The Term Loan was used to pay a portion of the cash consideration in connection with the TriZetto Acquisition.
Our preliminary allocation of purchase price as of November 20, 2014 (the closing date of the TriZettoAcquisition) to the fair value of assets acquired and liabilities assumed is as follows:
Amount
Cash . . . . . . . . . . . . . . . . . . . . . . . . . . . . . . . . . . . . . . . . . . . $ 170,510Trade accounts receivable . . . . . . . . . . . . . . . . . . . . . . . . . . 83,052Unbilled accounts receivable . . . . . . . . . . . . . . . . . . . . . . . 32,463Other current assets . . . . . . . . . . . . . . . . . . . . . . . . . . . . . . . 11,218Property and equipment . . . . . . . . . . . . . . . . . . . . . . . . . . . 124,050Identifiable intangible assets . . . . . . . . . . . . . . . . . . . . . . . . 849,000Other noncurrent assets . . . . . . . . . . . . . . . . . . . . . . . . . . . . 14,782Accounts payable . . . . . . . . . . . . . . . . . . . . . . . . . . . . . . . . (12,395)Deferred revenue . . . . . . . . . . . . . . . . . . . . . . . . . . . . . . . . . (48,281)Accrued expenses and other current liabilities . . . . . . . . . . (118,311)Other noncurrent liabilities . . . . . . . . . . . . . . . . . . . . . . . . . (54,833)Deferred income tax liabilities, net . . . . . . . . . . . . . . . . . . . (209,031)Goodwill . . . . . . . . . . . . . . . . . . . . . . . . . . . . . . . . . . . . . . . 1,956,116
Total purchase price . . . . . . . . . . . . . . . . . . . . . . . . . . . . . . $2,798,340
We allocated the purchase price to the identifiable assets acquired and liabilities assumed based upon theirestimated fair values. The excess of purchase price over the estimated fair value of the underlying assets acquiredand liabilities assumed was allocated to goodwill. Such goodwill principally represents the value of synergiesexpected to be realized between Cognizant and TriZetto and the acquired assembled workforce, neither of whichqualify as a separate amortizable intangible asset. The goodwill is not deductible for tax purposes and has beenallocated to our Healthcare reportable segment. The allocation of the purchase price is based upon preliminaryestimates and assumptions and is subject to completion of our analysis of the fair value of identifiable assetsacquired and liabilities assumed as of the acquisition date. We will finalize the purchase price allocation as soonas practicable within the measurement period, but in no event later than one year following the date ofacquisition.
Acquired identifiable intangible assets were measured at fair value determined primarily using the incomeapproach, which required a forecast of all expected future cash flows either through the use of the relief-from-royalty method or the excess earnings method. The estimated fair value of the identifiable intangible assets andtheir weighted-average useful lives are as follows:
Fair ValueWeighted Average
Useful Life
Corporate trademark . . . . . . . . . . . . . . . . . . . . . . . . $ 63,000 IndefiniteProduct trademarks . . . . . . . . . . . . . . . . . . . . . . . . . 21,000 16.9 yearsTechnology . . . . . . . . . . . . . . . . . . . . . . . . . . . . . . . 328,000 7.7 yearsCustomer relationships . . . . . . . . . . . . . . . . . . . . . . 437,000 15.8 years
Total . . . . . . . . . . . . . . . . . . . . . . . . . . . . . . . . . . . . $849,000
F-15
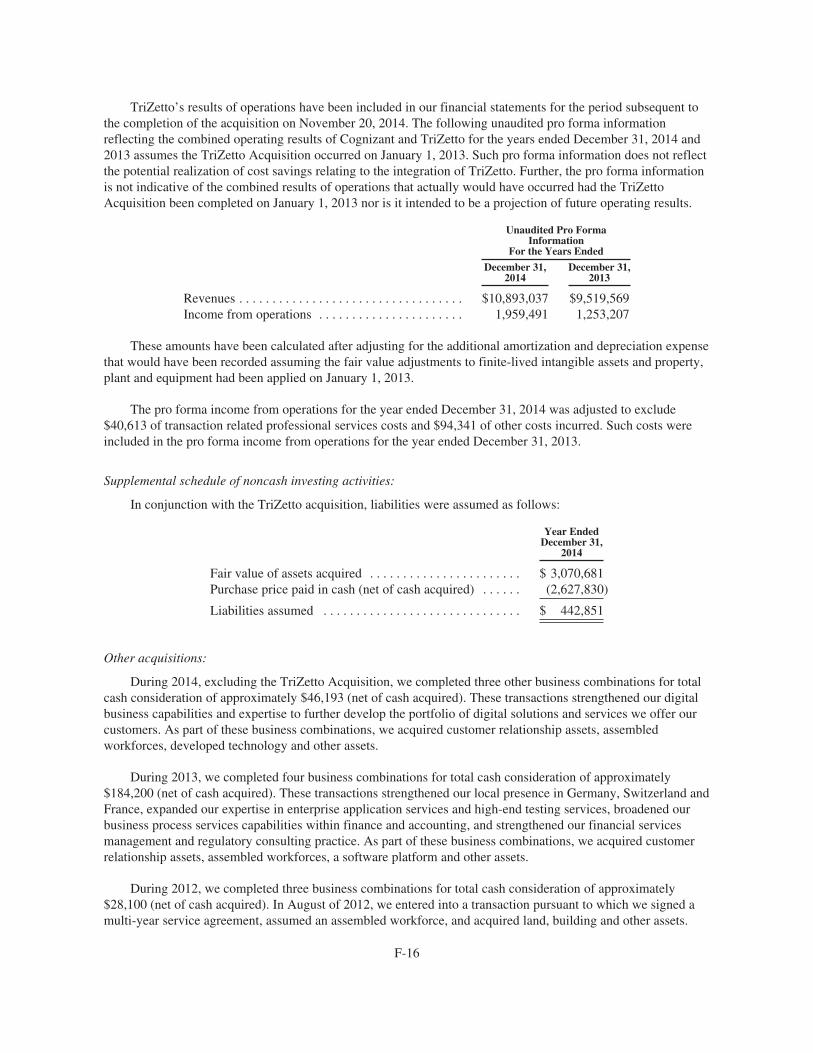
TriZetto’s results of operations have been included in our financial statements for the period subsequent tothe completion of the acquisition on November 20, 2014. The following unaudited pro forma informationreflecting the combined operating results of Cognizant and TriZetto for the years ended December 31, 2014 and2013 assumes the TriZetto Acquisition occurred on January 1, 2013. Such pro forma information does not reflectthe potential realization of cost savings relating to the integration of TriZetto. Further, the pro forma informationis not indicative of the combined results of operations that actually would have occurred had the TriZettoAcquisition been completed on January 1, 2013 nor is it intended to be a projection of future operating results.
Unaudited Pro FormaInformation
For the Years Ended
December 31,2014
December 31,2013
Revenues . . . . . . . . . . . . . . . . . . . . . . . . . . . . . . . . . . $10,893,037 $9,519,569Income from operations . . . . . . . . . . . . . . . . . . . . . . 1,959,491 1,253,207
These amounts have been calculated after adjusting for the additional amortization and depreciation expensethat would have been recorded assuming the fair value adjustments to finite-lived intangible assets and property,plant and equipment had been applied on January 1, 2013.
The pro forma income from operations for the year ended December 31, 2014 was adjusted to exclude$40,613 of transaction related professional services costs and $94,341 of other costs incurred. Such costs wereincluded in the pro forma income from operations for the year ended December 31, 2013.
Supplemental schedule of noncash investing activities:
In conjunction with the TriZetto acquisition, liabilities were assumed as follows:
Year EndedDecember 31,
2014
Fair value of assets acquired . . . . . . . . . . . . . . . . . . . . . . . $ 3,070,681Purchase price paid in cash (net of cash acquired) . . . . . . (2,627,830)
Liabilities assumed . . . . . . . . . . . . . . . . . . . . . . . . . . . . . . $ 442,851
Other acquisitions:
During 2014, excluding the TriZetto Acquisition, we completed three other business combinations for totalcash consideration of approximately $46,193 (net of cash acquired). These transactions strengthened our digitalbusiness capabilities and expertise to further develop the portfolio of digital solutions and services we offer ourcustomers. As part of these business combinations, we acquired customer relationship assets, assembledworkforces, developed technology and other assets.
During 2013, we completed four business combinations for total cash consideration of approximately$184,200 (net of cash acquired). These transactions strengthened our local presence in Germany, Switzerland andFrance, expanded our expertise in enterprise application services and high-end testing services, broadened ourbusiness process services capabilities within finance and accounting, and strengthened our financial servicesmanagement and regulatory consulting practice. As part of these business combinations, we acquired customerrelationship assets, assembled workforces, a software platform and other assets.
During 2012, we completed three business combinations for total cash consideration of approximately$28,100 (net of cash acquired). In August of 2012, we entered into a transaction pursuant to which we signed amulti-year service agreement, assumed an assembled workforce, and acquired land, building and other assets.
F-16
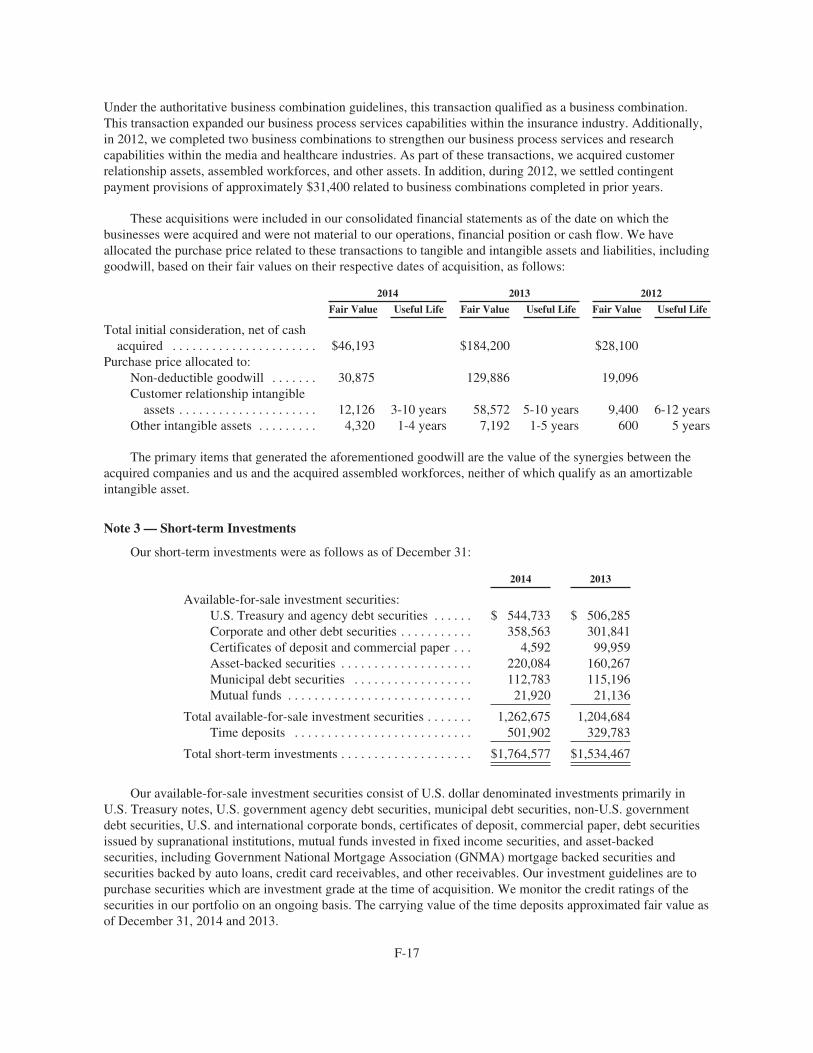
Under the authoritative business combination guidelines, this transaction qualified as a business combination.This transaction expanded our business process services capabilities within the insurance industry. Additionally,in 2012, we completed two business combinations to strengthen our business process services and researchcapabilities within the media and healthcare industries. As part of these transactions, we acquired customerrelationship assets, assembled workforces, and other assets. In addition, during 2012, we settled contingentpayment provisions of approximately $31,400 related to business combinations completed in prior years.
These acquisitions were included in our consolidated financial statements as of the date on which thebusinesses were acquired and were not material to our operations, financial position or cash flow. We haveallocated the purchase price related to these transactions to tangible and intangible assets and liabilities, includinggoodwill, based on their fair values on their respective dates of acquisition, as follows:
2014 2013 2012
Fair Value Useful Life Fair Value Useful Life Fair Value Useful Life
Total initial consideration, net of cashacquired . . . . . . . . . . . . . . . . . . . . . . $46,193 $184,200 $28,100
Purchase price allocated to:Non-deductible goodwill . . . . . . . 30,875 129,886 19,096Customer relationship intangible
assets . . . . . . . . . . . . . . . . . . . . . 12,126 3-10 years 58,572 5-10 years 9,400 6-12 yearsOther intangible assets . . . . . . . . . 4,320 1-4 years 7,192 1-5 years 600 5 years
The primary items that generated the aforementioned goodwill are the value of the synergies between theacquired companies and us and the acquired assembled workforces, neither of which qualify as an amortizableintangible asset.
Note 3 — Short-term Investments
Our short-term investments were as follows as of December 31:
2014 2013
Available-for-sale investment securities:U.S. Treasury and agency debt securities . . . . . . $ 544,733 $ 506,285Corporate and other debt securities . . . . . . . . . . . 358,563 301,841Certificates of deposit and commercial paper . . . 4,592 99,959Asset-backed securities . . . . . . . . . . . . . . . . . . . . 220,084 160,267Municipal debt securities . . . . . . . . . . . . . . . . . . 112,783 115,196Mutual funds . . . . . . . . . . . . . . . . . . . . . . . . . . . . 21,920 21,136
Total available-for-sale investment securities . . . . . . . 1,262,675 1,204,684Time deposits . . . . . . . . . . . . . . . . . . . . . . . . . . . 501,902 329,783
Total short-term investments . . . . . . . . . . . . . . . . . . . . $1,764,577 $1,534,467
Our available-for-sale investment securities consist of U.S. dollar denominated investments primarily inU.S. Treasury notes, U.S. government agency debt securities, municipal debt securities, non-U.S. governmentdebt securities, U.S. and international corporate bonds, certificates of deposit, commercial paper, debt securitiesissued by supranational institutions, mutual funds invested in fixed income securities, and asset-backedsecurities, including Government National Mortgage Association (GNMA) mortgage backed securities andsecurities backed by auto loans, credit card receivables, and other receivables. Our investment guidelines are topurchase securities which are investment grade at the time of acquisition. We monitor the credit ratings of thesecurities in our portfolio on an ongoing basis. The carrying value of the time deposits approximated fair value asof December 31, 2014 and 2013.
F-17
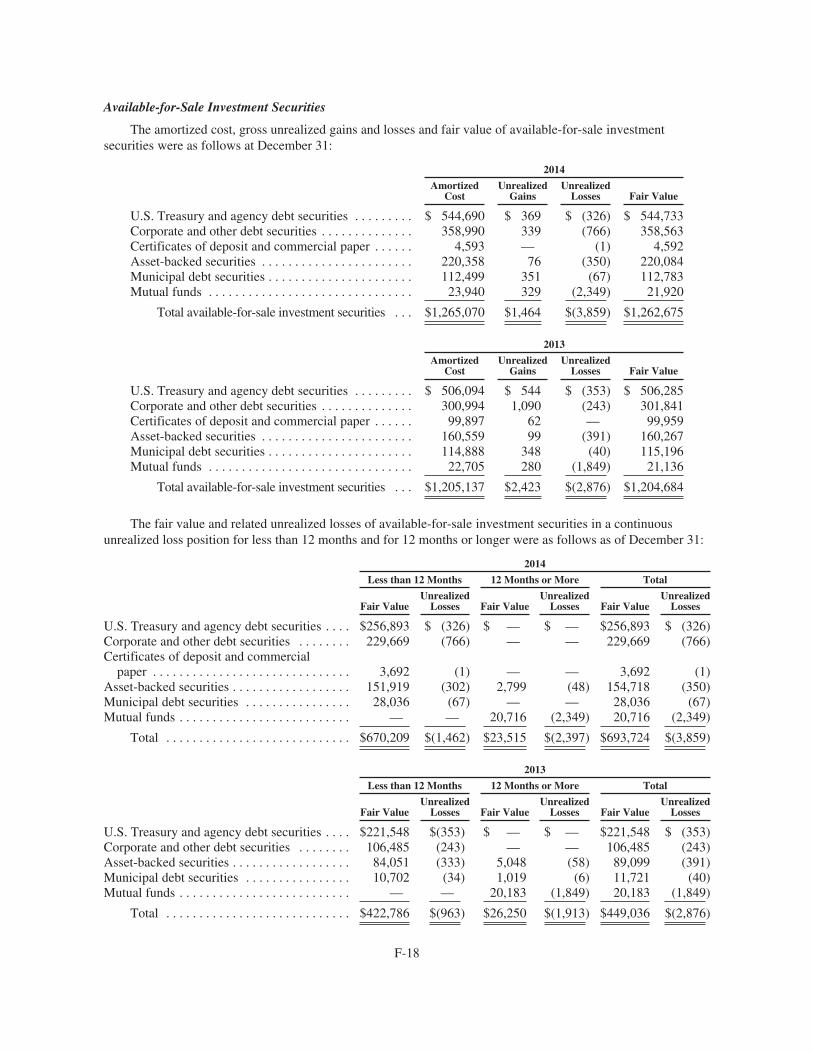
Available-for-Sale Investment Securities
The amortized cost, gross unrealized gains and losses and fair value of available-for-sale investmentsecurities were as follows at December 31:
2014
AmortizedCost
UnrealizedGains
UnrealizedLosses Fair Value
U.S. Treasury and agency debt securities . . . . . . . . . $ 544,690 $ 369 $ (326) $ 544,733Corporate and other debt securities . . . . . . . . . . . . . . 358,990 339 (766) 358,563Certificates of deposit and commercial paper . . . . . . 4,593 — (1) 4,592Asset-backed securities . . . . . . . . . . . . . . . . . . . . . . . 220,358 76 (350) 220,084Municipal debt securities . . . . . . . . . . . . . . . . . . . . . . 112,499 351 (67) 112,783Mutual funds . . . . . . . . . . . . . . . . . . . . . . . . . . . . . . . 23,940 329 (2,349) 21,920
Total available-for-sale investment securities . . . $1,265,070 $1,464 $(3,859) $1,262,675
2013
AmortizedCost
UnrealizedGains
UnrealizedLosses Fair Value
U.S. Treasury and agency debt securities . . . . . . . . . $ 506,094 $ 544 $ (353) $ 506,285Corporate and other debt securities . . . . . . . . . . . . . . 300,994 1,090 (243) 301,841Certificates of deposit and commercial paper . . . . . . 99,897 62 — 99,959Asset-backed securities . . . . . . . . . . . . . . . . . . . . . . . 160,559 99 (391) 160,267Municipal debt securities . . . . . . . . . . . . . . . . . . . . . . 114,888 348 (40) 115,196Mutual funds . . . . . . . . . . . . . . . . . . . . . . . . . . . . . . . 22,705 280 (1,849) 21,136
Total available-for-sale investment securities . . . $1,205,137 $2,423 $(2,876) $1,204,684
The fair value and related unrealized losses of available-for-sale investment securities in a continuousunrealized loss position for less than 12 months and for 12 months or longer were as follows as of December 31:
2014
Less than 12 Months 12 Months or More Total
Fair ValueUnrealized
Losses Fair ValueUnrealized
Losses Fair ValueUnrealized
Losses
U.S. Treasury and agency debt securities . . . . $256,893 $ (326) $ — $ — $256,893 $ (326)Corporate and other debt securities . . . . . . . . 229,669 (766) — — 229,669 (766)Certificates of deposit and commercial
paper . . . . . . . . . . . . . . . . . . . . . . . . . . . . . . 3,692 (1) — — 3,692 (1)Asset-backed securities . . . . . . . . . . . . . . . . . . 151,919 (302) 2,799 (48) 154,718 (350)Municipal debt securities . . . . . . . . . . . . . . . . 28,036 (67) — — 28,036 (67)Mutual funds . . . . . . . . . . . . . . . . . . . . . . . . . . — — 20,716 (2,349) 20,716 (2,349)
Total . . . . . . . . . . . . . . . . . . . . . . . . . . . . $670,209 $(1,462) $23,515 $(2,397) $693,724 $(3,859)
2013
Less than 12 Months 12 Months or More Total
Fair ValueUnrealized
Losses Fair ValueUnrealized
Losses Fair ValueUnrealized
Losses
U.S. Treasury and agency debt securities . . . . $221,548 $(353) $ — $ — $221,548 $ (353)Corporate and other debt securities . . . . . . . . 106,485 (243) — — 106,485 (243)Asset-backed securities . . . . . . . . . . . . . . . . . . 84,051 (333) 5,048 (58) 89,099 (391)Municipal debt securities . . . . . . . . . . . . . . . . 10,702 (34) 1,019 (6) 11,721 (40)Mutual funds . . . . . . . . . . . . . . . . . . . . . . . . . . — — 20,183 (1,849) 20,183 (1,849)
Total . . . . . . . . . . . . . . . . . . . . . . . . . . . . $422,786 $(963) $26,250 $(1,913) $449,036 $(2,876)
F-18
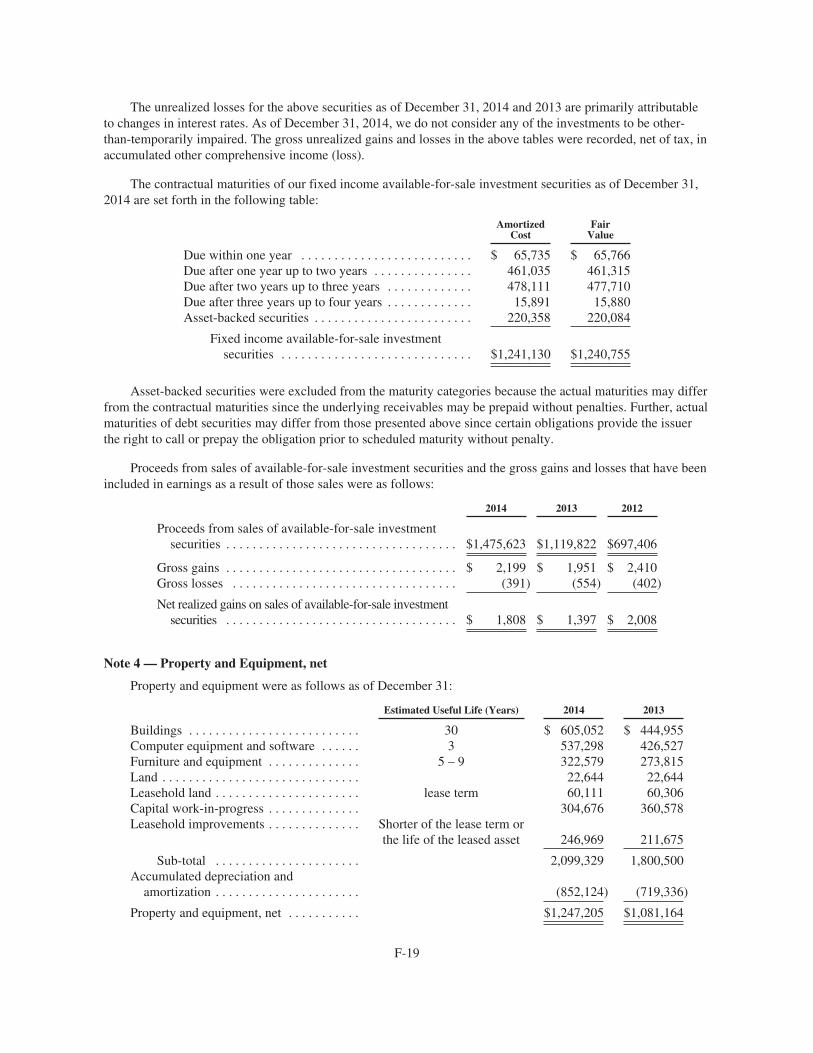
The unrealized losses for the above securities as of December 31, 2014 and 2013 are primarily attributableto changes in interest rates. As of December 31, 2014, we do not consider any of the investments to be other-than-temporarily impaired. The gross unrealized gains and losses in the above tables were recorded, net of tax, inaccumulated other comprehensive income (loss).
The contractual maturities of our fixed income available-for-sale investment securities as of December 31,2014 are set forth in the following table:
AmortizedCost
FairValue
Due within one year . . . . . . . . . . . . . . . . . . . . . . . . . . $ 65,735 $ 65,766Due after one year up to two years . . . . . . . . . . . . . . . 461,035 461,315Due after two years up to three years . . . . . . . . . . . . . 478,111 477,710Due after three years up to four years . . . . . . . . . . . . . 15,891 15,880Asset-backed securities . . . . . . . . . . . . . . . . . . . . . . . . 220,358 220,084
Fixed income available-for-sale investmentsecurities . . . . . . . . . . . . . . . . . . . . . . . . . . . . . $1,241,130 $1,240,755
Asset-backed securities were excluded from the maturity categories because the actual maturities may differfrom the contractual maturities since the underlying receivables may be prepaid without penalties. Further, actualmaturities of debt securities may differ from those presented above since certain obligations provide the issuerthe right to call or prepay the obligation prior to scheduled maturity without penalty.
Proceeds from sales of available-for-sale investment securities and the gross gains and losses that have beenincluded in earnings as a result of those sales were as follows:
2014 2013 2012
Proceeds from sales of available-for-sale investmentsecurities . . . . . . . . . . . . . . . . . . . . . . . . . . . . . . . . . . . $1,475,623 $1,119,822 $697,406
Gross gains . . . . . . . . . . . . . . . . . . . . . . . . . . . . . . . . . . . $ 2,199 $ 1,951 $ 2,410Gross losses . . . . . . . . . . . . . . . . . . . . . . . . . . . . . . . . . . (391) (554) (402)
Net realized gains on sales of available-for-sale investmentsecurities . . . . . . . . . . . . . . . . . . . . . . . . . . . . . . . . . . . $ 1,808 $ 1,397 $ 2,008
Note 4 — Property and Equipment, net
Property and equipment were as follows as of December 31:
Estimated Useful Life (Years) 2014 2013
Buildings . . . . . . . . . . . . . . . . . . . . . . . . . . 30 $ 605,052 $ 444,955Computer equipment and software . . . . . . 3 537,298 426,527Furniture and equipment . . . . . . . . . . . . . . 5 – 9 322,579 273,815Land . . . . . . . . . . . . . . . . . . . . . . . . . . . . . . 22,644 22,644Leasehold land . . . . . . . . . . . . . . . . . . . . . . lease term 60,111 60,306Capital work-in-progress . . . . . . . . . . . . . . 304,676 360,578Leasehold improvements . . . . . . . . . . . . . . Shorter of the lease term or
the life of the leased asset 246,969 211,675
Sub-total . . . . . . . . . . . . . . . . . . . . . . 2,099,329 1,800,500Accumulated depreciation and
amortization . . . . . . . . . . . . . . . . . . . . . . (852,124) (719,336)
Property and equipment, net . . . . . . . . . . . $1,247,205 $1,081,164
F-19
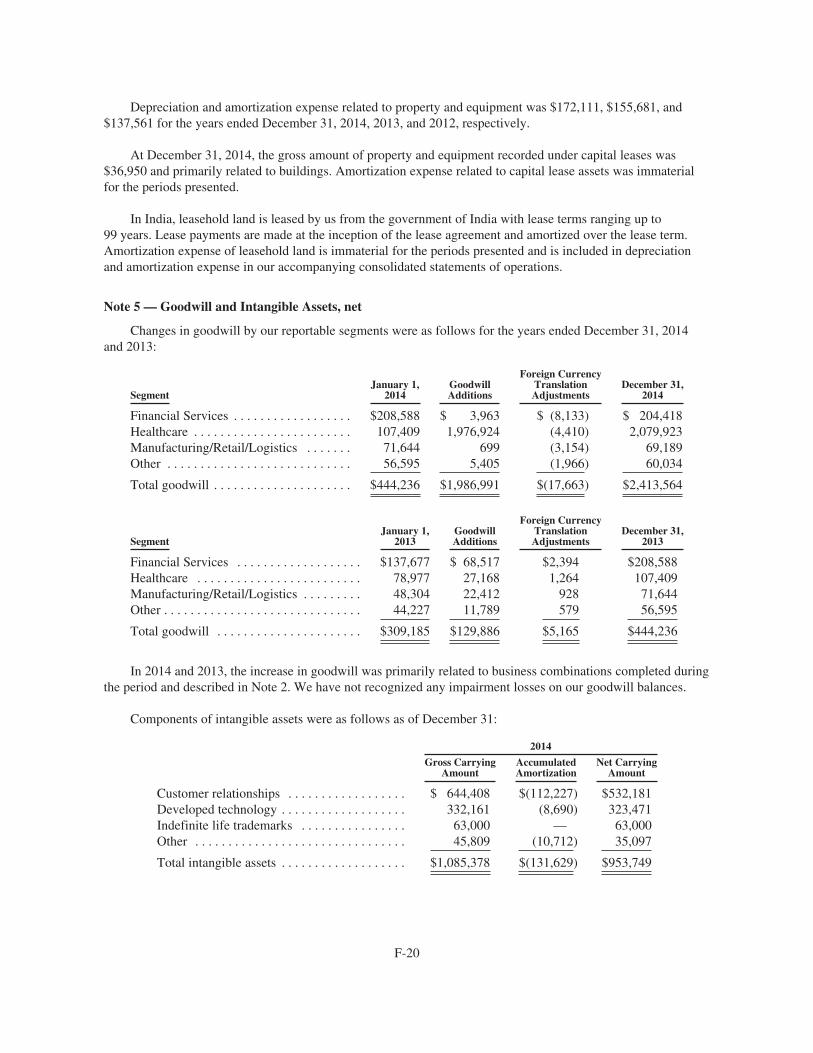
Depreciation and amortization expense related to property and equipment was $172,111, $155,681, and$137,561 for the years ended December 31, 2014, 2013, and 2012, respectively.
At December 31, 2014, the gross amount of property and equipment recorded under capital leases was$36,950 and primarily related to buildings. Amortization expense related to capital lease assets was immaterialfor the periods presented.
In India, leasehold land is leased by us from the government of India with lease terms ranging up to99 years. Lease payments are made at the inception of the lease agreement and amortized over the lease term.Amortization expense of leasehold land is immaterial for the periods presented and is included in depreciationand amortization expense in our accompanying consolidated statements of operations.
Note 5 — Goodwill and Intangible Assets, net
Changes in goodwill by our reportable segments were as follows for the years ended December 31, 2014and 2013:
SegmentJanuary 1,
2014GoodwillAdditions
Foreign CurrencyTranslationAdjustments
December 31,2014
Financial Services . . . . . . . . . . . . . . . . . . $208,588 $ 3,963 $ (8,133) $ 204,418Healthcare . . . . . . . . . . . . . . . . . . . . . . . . 107,409 1,976,924 (4,410) 2,079,923Manufacturing/Retail/Logistics . . . . . . . 71,644 699 (3,154) 69,189Other . . . . . . . . . . . . . . . . . . . . . . . . . . . . 56,595 5,405 (1,966) 60,034
Total goodwill . . . . . . . . . . . . . . . . . . . . . $444,236 $1,986,991 $(17,663) $2,413,564
SegmentJanuary 1,
2013GoodwillAdditions
Foreign CurrencyTranslationAdjustments
December 31,2013
Financial Services . . . . . . . . . . . . . . . . . . . $137,677 $ 68,517 $2,394 $208,588Healthcare . . . . . . . . . . . . . . . . . . . . . . . . . 78,977 27,168 1,264 107,409Manufacturing/Retail/Logistics . . . . . . . . . 48,304 22,412 928 71,644Other . . . . . . . . . . . . . . . . . . . . . . . . . . . . . . 44,227 11,789 579 56,595
Total goodwill . . . . . . . . . . . . . . . . . . . . . . $309,185 $129,886 $5,165 $444,236
In 2014 and 2013, the increase in goodwill was primarily related to business combinations completed duringthe period and described in Note 2. We have not recognized any impairment losses on our goodwill balances.
Components of intangible assets were as follows as of December 31:
2014
Gross CarryingAmount
AccumulatedAmortization
Net CarryingAmount
Customer relationships . . . . . . . . . . . . . . . . . . $ 644,408 $(112,227) $532,181Developed technology . . . . . . . . . . . . . . . . . . . 332,161 (8,690) 323,471Indefinite life trademarks . . . . . . . . . . . . . . . . 63,000 — 63,000Other . . . . . . . . . . . . . . . . . . . . . . . . . . . . . . . . 45,809 (10,712) 35,097
Total intangible assets . . . . . . . . . . . . . . . . . . . $1,085,378 $(131,629) $953,749
F-20
2013
Gross CarryingAmount
AccumulatedAmortization
Net CarryingAmount
Customer relationships . . . . . . . . . . . . . . . . . . $ 203,543 $ (88,159) $115,384Developed technology . . . . . . . . . . . . . . . . . . . 4,250 (2,994) 1,256Other . . . . . . . . . . . . . . . . . . . . . . . . . . . . . . . . 21,438 (6,804) 14,634
Total intangible assets . . . . . . . . . . . . . . . . . . . $ 229,231 $ (97,957) $131,274
Other than certain trademarks with indefinite lives, our intangible assets have finite lives and as such aresubject to amortization. Amortization of intangible assets totaled $35,956 for 2014, $24,249 for 2013, and$19,027 for 2012. During 2014, 2013 and 2012, amortization of $8,403, $7,729 and $7,499, respectively, relatingto customer relationship intangible assets was recorded as a reduction of revenues. These intangible assets areattributed to direct revenue contracts with sellers of acquired businesses.
Estimated amortization expense related to our existing intangible assets for the next five years are asfollows:
Year Amount
2015 . . . . . . . . . . . . . . . . . . . . . . . . . . . . . . . . . . . . . . . . . . . . . $97,0952016 . . . . . . . . . . . . . . . . . . . . . . . . . . . . . . . . . . . . . . . . . . . . . 95,4672017 . . . . . . . . . . . . . . . . . . . . . . . . . . . . . . . . . . . . . . . . . . . . . 92,5782018 . . . . . . . . . . . . . . . . . . . . . . . . . . . . . . . . . . . . . . . . . . . . . 84,9032019 . . . . . . . . . . . . . . . . . . . . . . . . . . . . . . . . . . . . . . . . . . . . . 82,691
Note 6 — Accrued Expenses and Other Current Liabilities
Accrued expenses and other current liabilities were as follows as of December 31:
2014 2013
Compensation and benefits . . . . . . . . . . . . . . . . . . . . . . . $ 906,747 $ 894,986Income taxes . . . . . . . . . . . . . . . . . . . . . . . . . . . . . . . . . . 23,846 24,312Professional fees . . . . . . . . . . . . . . . . . . . . . . . . . . . . . . . 82,664 45,453Travel and entertainment . . . . . . . . . . . . . . . . . . . . . . . . . 35,013 29,645Customer volume incentives . . . . . . . . . . . . . . . . . . . . . . 192,114 170,669Derivative financial instruments . . . . . . . . . . . . . . . . . . . 97,302 191,584Other . . . . . . . . . . . . . . . . . . . . . . . . . . . . . . . . . . . . . . . . 184,605 121,572
Total accrued expenses and other current liabilities . . . . $1,522,291 $1,478,221
Note 7 — Debt
On November 20, 2014, we entered into a Credit Agreement with a commercial bank syndicate providingfor a $1,000,000 unsecured Term Loan and a $750,000 unsecured Revolving Facility. The Term Loan was usedto pay a portion of the cash consideration in connection with the TriZetto Acquisition. The Revolving Facility isavailable for general corporate purposes. The Term Loan and the Revolving Facility both mature on November20, 2019. As of December 31, 2014, we have drawn down $650,000 under the Revolving Facility. We arerequired under the Credit Agreement to make scheduled quarterly principal payments on the Term Loan.
The Credit Agreement requires interest to be paid at either the base rate or the Eurocurrency rate, plus amargin. The margin over the base rate is 0.00%, and the margin over the Eurocurrency rate ranges from 0.75% to1.125%, depending on our debt ratings (or, if we have not received debt ratings, from 0.875% to 1.00%,
F-21

depending on our debt to total stockholders’ equity ratio). Under the Credit Agreement, we are required to paycommitment fees on the unused portion of the Revolving Facility, which fees vary based on our debt ratings (or,if we have not received debt ratings, our debt to total stockholders’ equity ratio). At December 31, 2014, theinterest rates on the Term Loan and Revolving Facility were 1.23% and 1.16%, respectively.
The Credit Agreement contains certain negative covenants, including limitations on liens, mergers,consolidations and acquisitions, subsidiary indebtedness and affiliate transactions, as well as certain affirmativecovenants. In addition, the Credit Agreement requires us to maintain a debt to total stockholders’ equity ratio notin excess of 0.40:1.00. As of December 31, 2014, we are in compliance with our debt covenants.
Deferred financing costs of $6,047 related to the Credit Agreement are being amortized over 5 years. As ofDecember 31, 2014, $5,705 of deferred financing costs are reflected in other noncurrent assets in theaccompanying consolidated statement of financial position.
On September 14, 2014, we entered into an unsecured bridge facility (the “Bridge Facility”) that allowed usto borrow up to $1,000,000 to finance the TriZetto Acquisition and to pay fees and expenses in connectiontherewith. Upon entering into the Credit Agreement, the Bridge Facility was terminated and financing costs of$3,046, related to the Bridge Facility, were expensed.
There were no short-term or long-term debt balances outstanding as of December 31, 2013.
Short-term Debt
The following summarizes our short-term debt balances as of December 31:
2014
Notes drawn under Revolving Facility . . . . . . . . . . . . . . . . . . $650,000Term Loan—current maturities . . . . . . . . . . . . . . . . . . . . . . . 50,000Other . . . . . . . . . . . . . . . . . . . . . . . . . . . . . . . . . . . . . . . . . . . . 2
Total short-term debt . . . . . . . . . . . . . . . . . . . . . . . . . . . . . . . $700,002
We have classified debt outstanding under our Revolving Facility as a short-term obligation on ourconsolidated statement of financial position. While the Revolving Facility has a contractual term beyond oneyear, it requires an execution of a note for each borrowing under the facility and such notes are each less than oneyear in duration. In addition, management does not intend to continuously replace the notes executed under theRevolving Facility for a continuous period that extends beyond one year.
Long-term Debt
The following summarizes our long-term debt balances as of December 31:
2014
Term Loan, due 2019 . . . . . . . . . . . . . . . . . . . . . . . . . . . . . . . $987,500Less: current maturities . . . . . . . . . . . . . . . . . . . . . . . . . . . . . (50,000)
Long-term debt, net of current maturities . . . . . . . . . . . . . . . $937,500
F-22
The following represents the schedule of maturities of long-term debt during the next five fiscal years:
Years Amounts
2015 . . . . . . . . . . . . . . . . . . . . . . . . . . . . . . . . . . . . . . . . . . . . $ 50,0002016 . . . . . . . . . . . . . . . . . . . . . . . . . . . . . . . . . . . . . . . . . . . . 56,2502017 . . . . . . . . . . . . . . . . . . . . . . . . . . . . . . . . . . . . . . . . . . . . 81,2502018 . . . . . . . . . . . . . . . . . . . . . . . . . . . . . . . . . . . . . . . . . . . . 100,0002019 . . . . . . . . . . . . . . . . . . . . . . . . . . . . . . . . . . . . . . . . . . . . 700,000
$987,500
Note 8 — Accumulated Other Comprehensive Income (Loss)
Changes in accumulated other comprehensive income (loss) by component were as follows for the yearended December 31, 2014:
2014
Before TaxAmount
TaxEffect
Net of TaxAmount
Foreign currency translation adjustments:Beginning balance . . . . . . . . . . . . . . . . . . . . . . . . . . . . . . . . . . . . . . . . . . $ 24,033 $ — $ 24,033
Change in foreign currency translation adjustments . . . . . . . . . . . . (58,845) — (58,845)
Ending balance . . . . . . . . . . . . . . . . . . . . . . . . . . . . . . . . . . . . . . . . . . . . . $ (34,812) $ — $ (34,812)
Unrealized gains (losses) on available-for-sale investment securities:Beginning balance . . . . . . . . . . . . . . . . . . . . . . . . . . . . . . . . . . . . . . . . . . $ (453) $ 154 $ (299)
Net unrealized gains arising during the period . . . . . . . . . . . . . . . . (159) 73 (86)Reclassification of net (gains) to Other, net . . . . . . . . . . . . . . . . . . . (1,783) 654 (1,129)
Net change . . . . . . . . . . . . . . . . . . . . . . . . . . . . . . . . . . . . . . . . . . . . (1,942) 727 (1,215)
Ending balance . . . . . . . . . . . . . . . . . . . . . . . . . . . . . . . . . . . . . . . . . . . . . $ (2,395) $ 881 $ (1,514)
Unrealized gains (losses) on cash flow hedges:Beginning balance . . . . . . . . . . . . . . . . . . . . . . . . . . . . . . . . . . . . . . . . . . $(354,876) $ 54,883 $(299,993)
Unrealized gains arising during the period . . . . . . . . . . . . . . . . . . . 115,651 (17,885) 97,766Reclassifications of losses to:
Cost of revenues . . . . . . . . . . . . . . . . . . . . . . . . . . . . . . . . . . . . 113,367 (17,533) 95,834Selling, general and administrative expenses . . . . . . . . . . . . . . 23,245 (3,594) 19,651
Net change . . . . . . . . . . . . . . . . . . . . . . . . . . . . . . . . . . . . . . . . . . . . 252,263 (39,012) 213,251
Ending balance . . . . . . . . . . . . . . . . . . . . . . . . . . . . . . . . . . . . . . . . . . . . . $(102,613) $ 15,871 $ (86,742)
Accumulated other comprehensive income (loss):Beginning balance . . . . . . . . . . . . . . . . . . . . . . . . . . . . . . . . . . . . . . . . . . $(331,296) $ 55,037 $(276,259)
Other comprehensive income (loss) . . . . . . . . . . . . . . . . . . . . . . . . . 191,476 (38,285) 153,191
Ending balance . . . . . . . . . . . . . . . . . . . . . . . . . . . . . . . . . . . . . . . . . . . . . $(139,820) $ 16,752 $(123,068)
F-23
Changes in accumulated other comprehensive income (loss) by component were as follows for the yearsended December 31, 2013 and 2012:
2013 2012
Before TaxAmount
TaxEffect
Net of TaxAmount
Before TaxAmount
TaxEffect
Net of TaxAmount
Foreign currency translation adjustments:Beginning balance . . . . . . . . . . . . . . . . . $ 11,572 $ — $ 11,572 $ (3,561) $ — $ (3,561)
Change in foreign currencytranslation adjustments . . . . . . . 12,461 — 12,461 15,133 — 15,133
Ending balance . . . . . . . . . . . . . . . . . . . $ 24,033 $ — $ 24,033 $ 11,572 $ — $ 11,572
Unrealized gains (losses) on available-for-sale investment securities:
Beginning balance . . . . . . . . . . . . . . . . . $ 2,440 $ (885) $ 1,555 $ 1,986 $ (780) $ 1,206
Net unrealized (losses) gainsarising during the period . . . . . . (1,638) 582 (1,056) 1,970 (727) 1,243
Reclassification of net (gains) toOther, net . . . . . . . . . . . . . . . . . . (1,255) 457 (798) (1,516) 622 (894)
Net change . . . . . . . . . . . . . . . . . . . . . . . (2,893) 1,039 (1,854) 454 (105) 349
Ending balance . . . . . . . . . . . . . . . . . . . $ (453) $ 154 $ (299) $ 2,440 $ (885) $ 1,555
Unrealized gains (losses) on cash flow hedges:Beginning balance . . . . . . . . . . . . . . . . . $(296,595) $ 43,785 $(252,810) $(385,640) $ 62,601 $(323,039)
Unrealized (losses) arising duringthe period . . . . . . . . . . . . . . . . . . (221,275) 36,248 (185,027) (7,065) (3,548) (10,613)
Reclassifications of net losses to:Cost of revenues . . . . . . . . . . 135,044 (20,839) 114,205 79,335 (12,601) 66,734Selling, general and
administrative expenses . . 27,950 (4,311) 23,639 16,775 (2,667) 14,108
Net change . . . . . . . . . . . . . . . . . . . (58,281) 11,098 (47,183) 89,045 (18,816) 70,229
Ending balance . . . . . . . . . . . . . . . . . . . $(354,876) $ 54,883 $(299,993) $(296,595) $ 43,785 $(252,810)
Accumulated other comprehensive income(loss):
Beginning balance . . . . . . . . . . . . . . . . . $(282,583) $ 42,900 $(239,683) $(387,215) $ 61,821 $(325,394)Other comprehensive income
(loss) . . . . . . . . . . . . . . . . . . . . . (48,713) 12,137 (36,576) 104,632 (18,921) 85,711
Ending balance . . . . . . . . . . . . . . . . . . . $(331,296) $ 55,037 $(276,259) $(282,583) $ 42,900 $(239,683)
Note 9 — Employee Benefits
We contribute to defined contribution plans in the United States and Europe, including 401(k) savings andsupplemental retirement plans in the United States. Total expenses for Company contributions to these planswere $45,061, $34,628, and $24,789 for the years ended December 31, 2014, 2013, and 2012, respectively.
We maintain employee benefit plans that cover substantially all India-based employees. The employees’provident fund, pension and family pension plans are statutorily defined contribution retirement benefit plans.Under the plans, employees contribute up to 12% of their base compensation, which is matched by an equalcontribution by the Company. For these plans, we recognized a contribution expense of $63,397, $56,070, and$54,125 for the years ended December 31, 2014, 2013, and 2012, respectively.
F-24
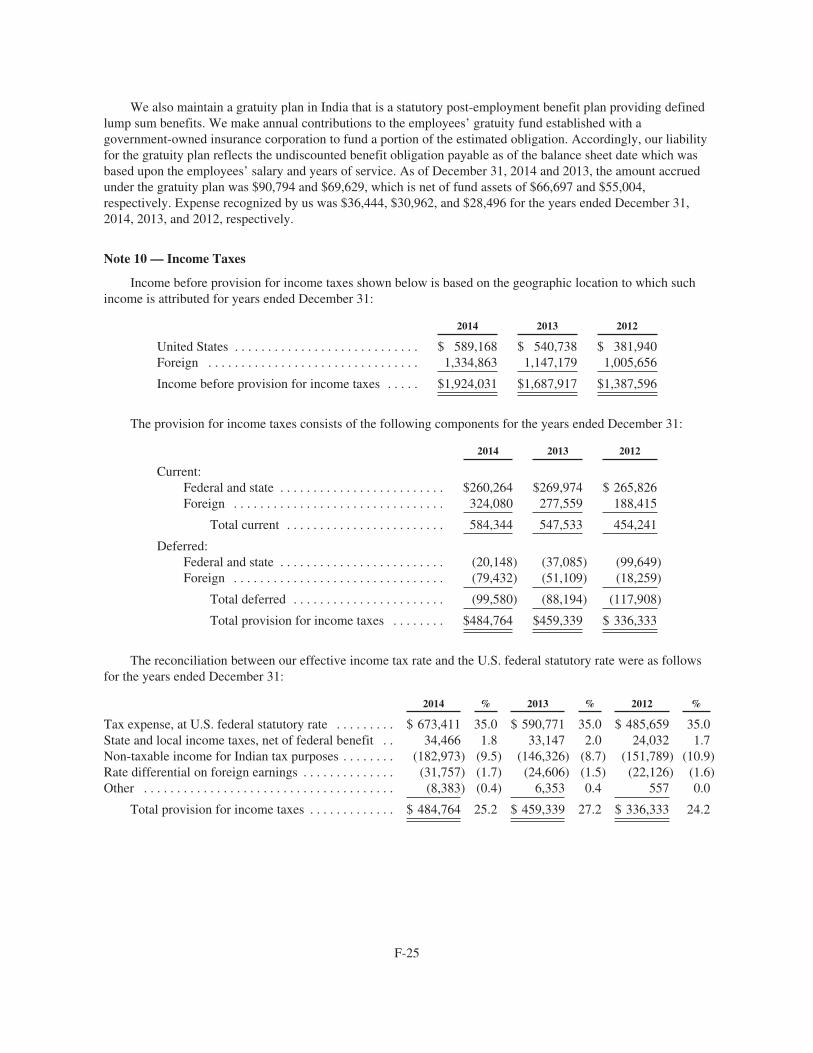
We also maintain a gratuity plan in India that is a statutory post-employment benefit plan providing definedlump sum benefits. We make annual contributions to the employees’ gratuity fund established with agovernment-owned insurance corporation to fund a portion of the estimated obligation. Accordingly, our liabilityfor the gratuity plan reflects the undiscounted benefit obligation payable as of the balance sheet date which wasbased upon the employees’ salary and years of service. As of December 31, 2014 and 2013, the amount accruedunder the gratuity plan was $90,794 and $69,629, which is net of fund assets of $66,697 and $55,004,respectively. Expense recognized by us was $36,444, $30,962, and $28,496 for the years ended December 31,2014, 2013, and 2012, respectively.
Note 10 — Income Taxes
Income before provision for income taxes shown below is based on the geographic location to which suchincome is attributed for years ended December 31:
2014 2013 2012
United States . . . . . . . . . . . . . . . . . . . . . . . . . . . . $ 589,168 $ 540,738 $ 381,940Foreign . . . . . . . . . . . . . . . . . . . . . . . . . . . . . . . . 1,334,863 1,147,179 1,005,656
Income before provision for income taxes . . . . . $1,924,031 $1,687,917 $1,387,596
The provision for income taxes consists of the following components for the years ended December 31:
2014 2013 2012
Current:Federal and state . . . . . . . . . . . . . . . . . . . . . . . . . $260,264 $269,974 $ 265,826Foreign . . . . . . . . . . . . . . . . . . . . . . . . . . . . . . . . 324,080 277,559 188,415
Total current . . . . . . . . . . . . . . . . . . . . . . . . 584,344 547,533 454,241
Deferred:Federal and state . . . . . . . . . . . . . . . . . . . . . . . . . (20,148) (37,085) (99,649)Foreign . . . . . . . . . . . . . . . . . . . . . . . . . . . . . . . . (79,432) (51,109) (18,259)
Total deferred . . . . . . . . . . . . . . . . . . . . . . . (99,580) (88,194) (117,908)
Total provision for income taxes . . . . . . . . $484,764 $459,339 $ 336,333
The reconciliation between our effective income tax rate and the U.S. federal statutory rate were as followsfor the years ended December 31:
2014 % 2013 % 2012 %
Tax expense, at U.S. federal statutory rate . . . . . . . . . $ 673,411 35.0 $ 590,771 35.0 $ 485,659 35.0State and local income taxes, net of federal benefit . . 34,466 1.8 33,147 2.0 24,032 1.7Non-taxable income for Indian tax purposes . . . . . . . . (182,973) (9.5) (146,326) (8.7) (151,789) (10.9)Rate differential on foreign earnings . . . . . . . . . . . . . . (31,757) (1.7) (24,606) (1.5) (22,126) (1.6)Other . . . . . . . . . . . . . . . . . . . . . . . . . . . . . . . . . . . . . . (8,383) (0.4) 6,353 0.4 557 0.0
Total provision for income taxes . . . . . . . . . . . . . $ 484,764 25.2 $ 459,339 27.2 $ 336,333 24.2
F-25
The significant components of deferred income tax assets and liabilities recorded on the consolidatedstatements of financial position were as follows as of December 31:
2014 2013
Deferred income tax assets:Net operating losses . . . . . . . . . . . . . . . . . . . . . . . . . $ 9,999 $ 8,831Revenue recognition . . . . . . . . . . . . . . . . . . . . . . . . . 56,478 34,368Compensation and benefits . . . . . . . . . . . . . . . . . . . . 145,633 132,134Stock-based compensation . . . . . . . . . . . . . . . . . . . . 22,532 23,202Minimum alternative tax (MAT) and other
credits . . . . . . . . . . . . . . . . . . . . . . . . . . . . . . . . . . 184,257 142,903Depreciation and amortization . . . . . . . . . . . . . . . . . — 4,720Other accrued expenses . . . . . . . . . . . . . . . . . . . . . . . 101,669 70,193Other . . . . . . . . . . . . . . . . . . . . . . . . . . . . . . . . . . . . . 15,078 10,170
535,646 426,521Less: valuation allowance . . . . . . . . . . . . . . . . . . . . . (11,420) (5,659)
Deferred income tax assets, net . . . . . . . . . . . . . . . . . 524,226 420,862
Deferred income tax liabilities:Depreciation and amortization . . . . . . . . . . . . . . . . . 21,169 —Intangible assets . . . . . . . . . . . . . . . . . . . . . . . . . . . . 280,649 38,653
Deferred income tax liabilities . . . . . . . . . . . . . . . . . . . . . 301,818 38,653
Net deferred income tax assets . . . . . . . . . . . . . . . . . . . . . $222,408 $382,209
At December 31, 2014, we had foreign and U.S. net operating loss carryforwards of approximately $20,085and $19,715, respectively. We have recorded valuation allowances on certain foreign net operating losscarryforwards. As of December 31, 2014 and 2013, deferred income tax assets related to the minimum alternativetax, or MAT, were approximately $218,500 and $195,000, respectively. The calculation of the MAT includes allprofits realized by our Indian subsidiaries and any MAT paid is creditable against future corporate income tax,subject to certain limitations. Our existing MAT assets expire between March 2018 and March 2025 and weexpect to fully utilize them within the applicable 10-year expiration periods. In the table above, certainunrecognized income tax benefits have been netted against available same-jurisdiction deferred income taxcarryforward assets.
Our Indian subsidiaries, collectively referred to as Cognizant India, are primarily export-oriented and areeligible for certain income tax holiday benefits granted by the government of India for export activitiesconducted within Special Economic Zones, or SEZs, for periods of up to 15 years. Our SEZ income tax holidaybenefits are currently scheduled to expire in whole or in part during the years 2016 to 2024 and may be extendedon a limited basis for an additional five years per unit if certain reinvestment criteria are met. Our Indian profitsineligible for SEZ benefits are subject to corporate income tax at the rate of 33.99%. In addition, all Indianprofits, including those generated within SEZs, are subject to the MAT, at the current rate of approximately21.0%, including surcharges. For the years ended December 31, 2014, 2013, and 2012, the effect of the incometax holidays granted by the Indian government was to reduce the overall income tax provision and increase netincome by approximately $182,973, $146,326, and $151,789, respectively, and increase diluted EPS by $0.30,$0.24, and $0.25, respectively.
We pursue an international strategy that includes expanded infrastructure investments in India andgeographic expansion outside the United States. Therefore, other than foreign earnings for which we havealready accrued U.S. taxes, we do not intend to repatriate our foreign earnings as such earnings are deemed to beindefinitely reinvested outside the United States. As of December 31, 2014, the amount of unrepatriated Indianearnings and total foreign earnings (including unrepatriated Indian earnings) upon which no incremental U.S.
F-26
taxes have been recorded is approximately $5,455,000 and $6,121,000, respectively. If such earnings arerepatriated in the future, or are no longer deemed to be indefinitely reinvested, we will accrue the applicableamount of taxes associated with such earnings at that time. Due to the various methods by which such earningscould be repatriated in the future, it is not practicable to determine the amount of applicable taxes that wouldresult from such repatriation.
Due to the geographical scope of our operations, we are subject to tax examinations in various jurisdictions.Accordingly, we record incremental tax expense, based upon the more-likely-than-not standard, for any uncertaintax positions. In addition, when applicable, we adjust the previously recorded income tax expense to reflectexamination results when the position is effectively settled or otherwise resolved. Our ongoing evaluations of themore-likely-than-not outcomes of the examinations and related tax positions require judgment and can result inadjustments that increase or decrease our effective income tax rate, as well as impact our operating results. Thespecific timing of when the resolution of each tax position will be reached is uncertain.
Changes in unrecognized income tax benefits were as follows for the years ended December 31:
2014 2013
Balance, beginning of year . . . . . . . . . . . . . . . . . . . . . . . . . . . . . . . . . . . . . . . . $ 96,610 $ 92,721Additions based on tax positions related to the current year . . . . . . . . . . . 7,787 12,982Additions for tax positions of prior years . . . . . . . . . . . . . . . . . . . . . . . . . 5,836 14,854Additions for tax positions of acquired subsidiaries . . . . . . . . . . . . . . . . . 29,238 —Reductions for tax positions due to lapse of statutes of limitations . . . . . — (4,353)Reductions for tax positions of prior years . . . . . . . . . . . . . . . . . . . . . . . . — (10,199)Settlements . . . . . . . . . . . . . . . . . . . . . . . . . . . . . . . . . . . . . . . . . . . . . . . . . — —Foreign currency exchange movement . . . . . . . . . . . . . . . . . . . . . . . . . . . (3,900) (9,395)
Balance, end of year . . . . . . . . . . . . . . . . . . . . . . . . . . . . . . . . . . . . . . . . . . . . . . $135,571 $ 96,610
At December 31, 2014, the entire balance of unrecognized income tax benefits would affect our effectiveincome tax rate, if recognized. While the Company believes uncertain tax positions may be settled or resolvedwithin the next twelve months, it is difficult to estimate the income tax impact of these potential resolutions atthis time. We recognize accrued interest and any penalties associated with uncertain tax positions as part of ourprovision for income taxes. The total amount of accrued interest and penalties at December 31, 2014 and 2013was approximately $11,153 and $8,725, respectively, and relates to U.S. and foreign tax matters. The amounts ofinterest and penalties expensed in 2014, 2013, and 2012 were immaterial.
We file a U.S. federal consolidated income tax return. The U.S. federal statute of limitations remains openfor the years 2011 and onward. The statute of limitations for state audits varies by state. Years still underexamination by foreign tax authorities are years 2001 and forward.
Note 11 — Fair Value Measurements
We measure our cash equivalents, investments and foreign exchange forward contracts at fair value. Theauthoritative guidance defines fair value as the exit price, or the amount that would be received to sell an asset orpaid to transfer a liability in an orderly transaction between market participants as of the measurement date. Theauthoritative guidance also establishes a fair value hierarchy that is intended to increase consistency andcomparability in fair value measurements and related disclosures. The fair value hierarchy is based on inputs tovaluation techniques that are used to measure fair value that are either observable or unobservable. Observableinputs reflect assumptions market participants would use in pricing an asset or liability based on market dataobtained from independent sources while unobservable inputs reflect a reporting entity’s pricing based upon theirown market assumptions.
F-27
The fair value hierarchy consists of the following three levels:
• Level 1—Inputs are quoted prices in active markets for identical assets or liabilities.
• Level 2—Inputs are quoted prices for similar assets or liabilities in an active market, quoted prices foridentical or similar assets or liabilities in markets that are not active, inputs other than quoted pricesthat are observable and market-corroborated inputs which are derived principally from or corroboratedby observable market data.
• Level 3—Inputs are derived from valuation techniques in which one or more significant inputs or valuedrivers are unobservable.
The following table summarizes our financial assets and (liabilities) measured at fair value on a recurringbasis as of December 31, 2014:
Level 1 Level 2 Level 3 Total
Cash equivalents:Money market funds . . . . . . . . . . . . . . . . . . . . . . . . . . . . . . . . $176,474 $ — $— $ 176,474Commercial paper . . . . . . . . . . . . . . . . . . . . . . . . . . . . . . . . . — 7,400 — 7,400
Total cash equivalents . . . . . . . . . . . . . . . . . . . . . . . . . . . . . . . . . . 176,474 7,400 — 183,874
Short-term investments:Time deposits . . . . . . . . . . . . . . . . . . . . . . . . . . . . . . . . . . . . . — 501,902 — 501,902
Available-for-sale investment securities:U.S. Treasury and agency debt securities . . . . . . . . . . . . 426,847 117,886 — 544,733Corporate and other debt securities . . . . . . . . . . . . . . . . — 358,563 — 358,563Certificates of deposit and commercial paper . . . . . . . . — 4,592 — 4,592Asset-backed securities . . . . . . . . . . . . . . . . . . . . . . . . . — 220,084 — 220,084Municipal debt securities . . . . . . . . . . . . . . . . . . . . . . . . — 112,783 — 112,783Mutual funds . . . . . . . . . . . . . . . . . . . . . . . . . . . . . . . . . . — 21,920 — 21,920
Total available-for-sale investment securities . . . . . . . . . . . . 426,847 835,828 — 1,262,675
Total short-term investments . . . . . . . . . . . . . . . . . . . . . . . . . . . . . 426,847 1,337,730 — 1,764,577
Derivative financial instruments - foreign exchange forwardcontracts:
Other current assets . . . . . . . . . . . . . . . . . . . . . . . . . . . . . . . . — 2,731 — 2,731Accrued expenses and other current liabilities . . . . . . . . . . . . — (97,302) — (97,302)Other noncurrent assets . . . . . . . . . . . . . . . . . . . . . . . . . . . . . — 3,879 — 3,879Other noncurrent liabilities . . . . . . . . . . . . . . . . . . . . . . . . . . . — (9,962) — (9,962)
Total . . . . . . . . . . . . . . . . . . . . . . . . . . . . . . . . . . . . . . . . . . . . . . . . $603,321 $1,244,476 $— $1,847,797
F-28
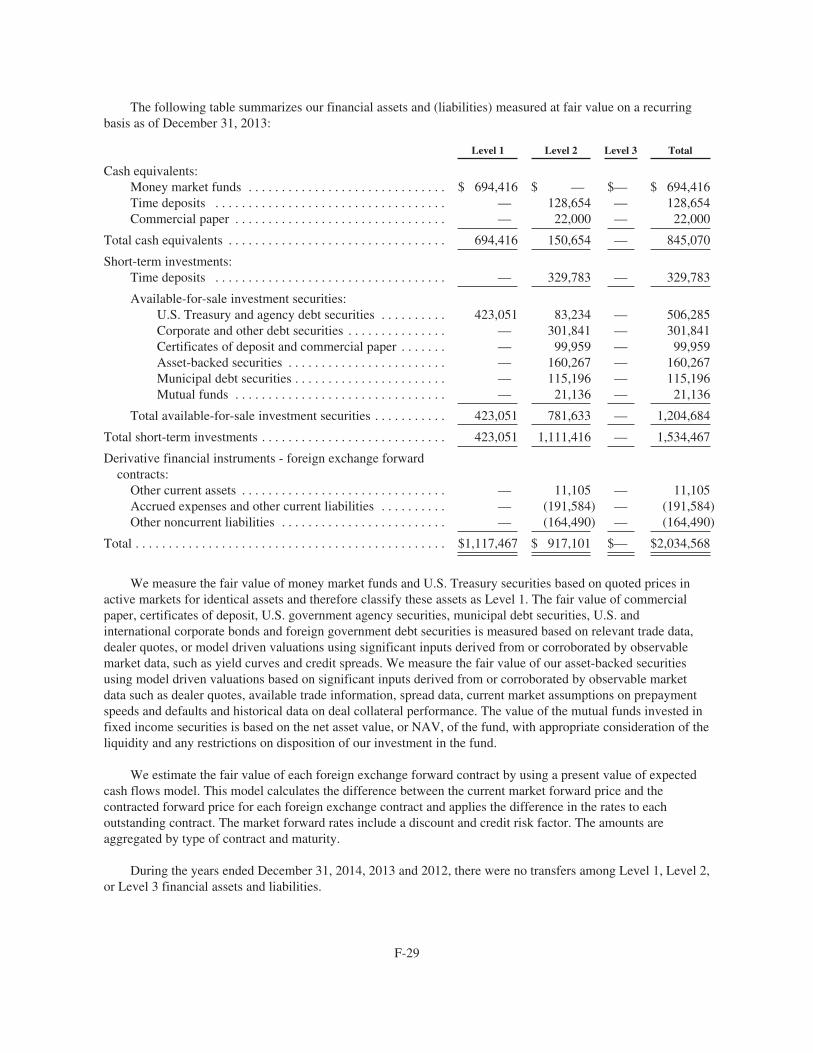
The following table summarizes our financial assets and (liabilities) measured at fair value on a recurringbasis as of December 31, 2013:
Level 1 Level 2 Level 3 Total
Cash equivalents:Money market funds . . . . . . . . . . . . . . . . . . . . . . . . . . . . . . $ 694,416 $ — $— $ 694,416Time deposits . . . . . . . . . . . . . . . . . . . . . . . . . . . . . . . . . . . — 128,654 — 128,654Commercial paper . . . . . . . . . . . . . . . . . . . . . . . . . . . . . . . . — 22,000 — 22,000
Total cash equivalents . . . . . . . . . . . . . . . . . . . . . . . . . . . . . . . . . 694,416 150,654 — 845,070
Short-term investments:Time deposits . . . . . . . . . . . . . . . . . . . . . . . . . . . . . . . . . . . — 329,783 — 329,783
Available-for-sale investment securities:U.S. Treasury and agency debt securities . . . . . . . . . . 423,051 83,234 — 506,285Corporate and other debt securities . . . . . . . . . . . . . . . — 301,841 — 301,841Certificates of deposit and commercial paper . . . . . . . — 99,959 — 99,959Asset-backed securities . . . . . . . . . . . . . . . . . . . . . . . . — 160,267 — 160,267Municipal debt securities . . . . . . . . . . . . . . . . . . . . . . . — 115,196 — 115,196Mutual funds . . . . . . . . . . . . . . . . . . . . . . . . . . . . . . . . — 21,136 — 21,136
Total available-for-sale investment securities . . . . . . . . . . . 423,051 781,633 — 1,204,684
Total short-term investments . . . . . . . . . . . . . . . . . . . . . . . . . . . . 423,051 1,111,416 — 1,534,467
Derivative financial instruments - foreign exchange forwardcontracts:
Other current assets . . . . . . . . . . . . . . . . . . . . . . . . . . . . . . . — 11,105 — 11,105Accrued expenses and other current liabilities . . . . . . . . . . — (191,584) — (191,584)Other noncurrent liabilities . . . . . . . . . . . . . . . . . . . . . . . . . — (164,490) — (164,490)
Total . . . . . . . . . . . . . . . . . . . . . . . . . . . . . . . . . . . . . . . . . . . . . . . $1,117,467 $ 917,101 $— $2,034,568
We measure the fair value of money market funds and U.S. Treasury securities based on quoted prices inactive markets for identical assets and therefore classify these assets as Level 1. The fair value of commercialpaper, certificates of deposit, U.S. government agency securities, municipal debt securities, U.S. andinternational corporate bonds and foreign government debt securities is measured based on relevant trade data,dealer quotes, or model driven valuations using significant inputs derived from or corroborated by observablemarket data, such as yield curves and credit spreads. We measure the fair value of our asset-backed securitiesusing model driven valuations based on significant inputs derived from or corroborated by observable marketdata such as dealer quotes, available trade information, spread data, current market assumptions on prepaymentspeeds and defaults and historical data on deal collateral performance. The value of the mutual funds invested infixed income securities is based on the net asset value, or NAV, of the fund, with appropriate consideration of theliquidity and any restrictions on disposition of our investment in the fund.
We estimate the fair value of each foreign exchange forward contract by using a present value of expectedcash flows model. This model calculates the difference between the current market forward price and thecontracted forward price for each foreign exchange contract and applies the difference in the rates to eachoutstanding contract. The market forward rates include a discount and credit risk factor. The amounts areaggregated by type of contract and maturity.
During the years ended December 31, 2014, 2013 and 2012, there were no transfers among Level 1, Level 2,or Level 3 financial assets and liabilities.
F-29
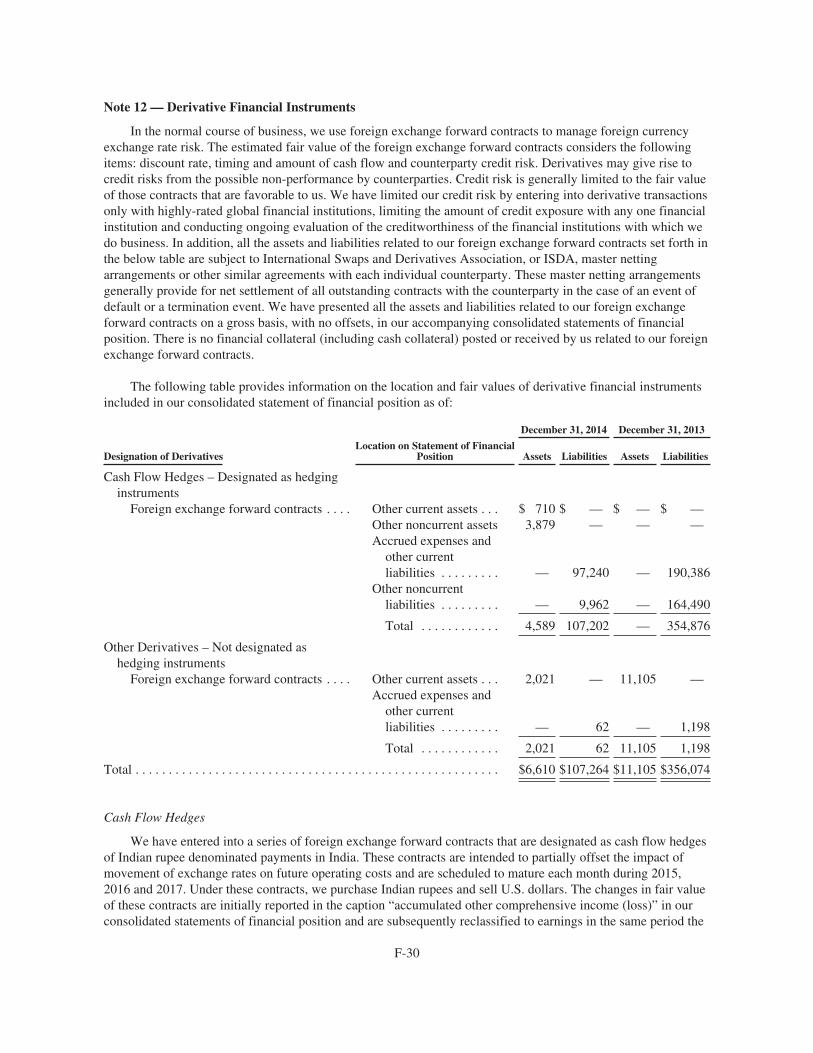
Note 12 — Derivative Financial Instruments
In the normal course of business, we use foreign exchange forward contracts to manage foreign currencyexchange rate risk. The estimated fair value of the foreign exchange forward contracts considers the followingitems: discount rate, timing and amount of cash flow and counterparty credit risk. Derivatives may give rise tocredit risks from the possible non-performance by counterparties. Credit risk is generally limited to the fair valueof those contracts that are favorable to us. We have limited our credit risk by entering into derivative transactionsonly with highly-rated global financial institutions, limiting the amount of credit exposure with any one financialinstitution and conducting ongoing evaluation of the creditworthiness of the financial institutions with which wedo business. In addition, all the assets and liabilities related to our foreign exchange forward contracts set forth inthe below table are subject to International Swaps and Derivatives Association, or ISDA, master nettingarrangements or other similar agreements with each individual counterparty. These master netting arrangementsgenerally provide for net settlement of all outstanding contracts with the counterparty in the case of an event ofdefault or a termination event. We have presented all the assets and liabilities related to our foreign exchangeforward contracts on a gross basis, with no offsets, in our accompanying consolidated statements of financialposition. There is no financial collateral (including cash collateral) posted or received by us related to our foreignexchange forward contracts.
The following table provides information on the location and fair values of derivative financial instrumentsincluded in our consolidated statement of financial position as of:
December 31, 2014 December 31, 2013
Designation of DerivativesLocation on Statement of Financial
Position Assets Liabilities Assets Liabilities
Cash Flow Hedges – Designated as hedginginstruments
Foreign exchange forward contracts . . . . Other current assets . . . $ 710 $ — $ — $ —Other noncurrent assets 3,879 — — —Accrued expenses and
other currentliabilities . . . . . . . . . — 97,240 — 190,386
Other noncurrentliabilities . . . . . . . . . — 9,962 — 164,490
Total . . . . . . . . . . . . 4,589 107,202 — 354,876
Other Derivatives – Not designated ashedging instruments
Foreign exchange forward contracts . . . . Other current assets . . . 2,021 — 11,105 —Accrued expenses and
other currentliabilities . . . . . . . . . — 62 — 1,198
Total . . . . . . . . . . . . 2,021 62 11,105 1,198
Total . . . . . . . . . . . . . . . . . . . . . . . . . . . . . . . . . . . . . . . . . . . . . . . . . . . . . . . $6,610 $107,264 $11,105 $356,074
Cash Flow Hedges
We have entered into a series of foreign exchange forward contracts that are designated as cash flow hedgesof Indian rupee denominated payments in India. These contracts are intended to partially offset the impact ofmovement of exchange rates on future operating costs and are scheduled to mature each month during 2015,2016 and 2017. Under these contracts, we purchase Indian rupees and sell U.S. dollars. The changes in fair valueof these contracts are initially reported in the caption “accumulated other comprehensive income (loss)” in ourconsolidated statements of financial position and are subsequently reclassified to earnings in the same period the
F-30

hedge contract matures. As of December 31, 2014, we estimate that $81,601, net of tax, of the net losses relatedto derivatives designated as cash flow hedges recorded in accumulated other comprehensive income (loss) isexpected to be reclassified into earnings within the next 12 months.
The notional value of our outstanding contracts by year of maturity and the net unrealized (loss) included inaccumulated other comprehensive income (loss) for such contracts were as follows as of:
December 31,2014
December 31,2013
2014 . . . . . . . . . . . . . . . . . . . . . . . . . . . . . . . . . . . . . . . . . . . . . . . . . . . . . . $ — $1,200,0002015 . . . . . . . . . . . . . . . . . . . . . . . . . . . . . . . . . . . . . . . . . . . . . . . . . . . . . . 1,320,000 900,0002016 . . . . . . . . . . . . . . . . . . . . . . . . . . . . . . . . . . . . . . . . . . . . . . . . . . . . . . 720,000 240,0002017 . . . . . . . . . . . . . . . . . . . . . . . . . . . . . . . . . . . . . . . . . . . . . . . . . . . . . . 420,000 —
Total notional value of contracts outstanding . . . . . . . . . . . . . . . . . . . . . . $2,460,000 $2,340,000
Net unrealized (loss) included in accumulated other comprehensiveincome (loss), net of taxes . . . . . . . . . . . . . . . . . . . . . . . . . . . . . . . . . . . $ (86,742) $ (299,993)
Upon settlement or maturity of the cash flow hedge contracts, we record the related gain or loss, based onour designation at the commencement of the contract, with the hedged Indian rupee denominated expensereported within cost of revenues and selling, general and administrative expenses. Hedge ineffectiveness wasimmaterial for all periods presented.
The following table provides information on the location and amounts of pre-tax (losses) on our cash flowhedges for the year ended December 31:
Decrease (Increase) inDerivative
Losses Recognizedin Accumulated Other
Comprehensive Income (Loss)(effective portion)
Location of Net Derivative(Losses) Reclassified
from Accumulated OtherComprehensive Income (Loss)
into Income(effective portion)
Net (Losses) Reclassifiedfrom Accumulated Other
Comprehensive Income (Loss)into Income
(effective portion)
2014 2013 2014 2013
Cash Flow Hedges – Designated ashedging instruments
Foreign exchange forwardcontracts . . . . . . . . . . . . . . . $115,651 $(221,275) Cost of revenues . . $(113,367) $(135,044)
Selling, generaland administrativeexpenses . . . . . . . (23,245) (27,950)
Total . . . . . . . . . . $(136,612) $(162,994)
The activity related to the change in net unrealized (losses) on our cash flow hedges included inaccumulated other comprehensive income (loss) is presented in Note 8.
Other Derivatives
We use foreign exchange forward contracts, which have not been designated as hedges, to hedge balancesheet exposure to certain monetary assets and liabilities denominated in currencies other than the functionalcurrency of our foreign subsidiaries. Contracts outstanding as of December 31, 2014 are schedule to mature in2015. Realized gains or losses and changes in the estimated fair value of these derivative financial instrumentsare reported in the caption “Foreign currency exchange gains (losses), net” in our consolidated statements ofoperations.
F-31
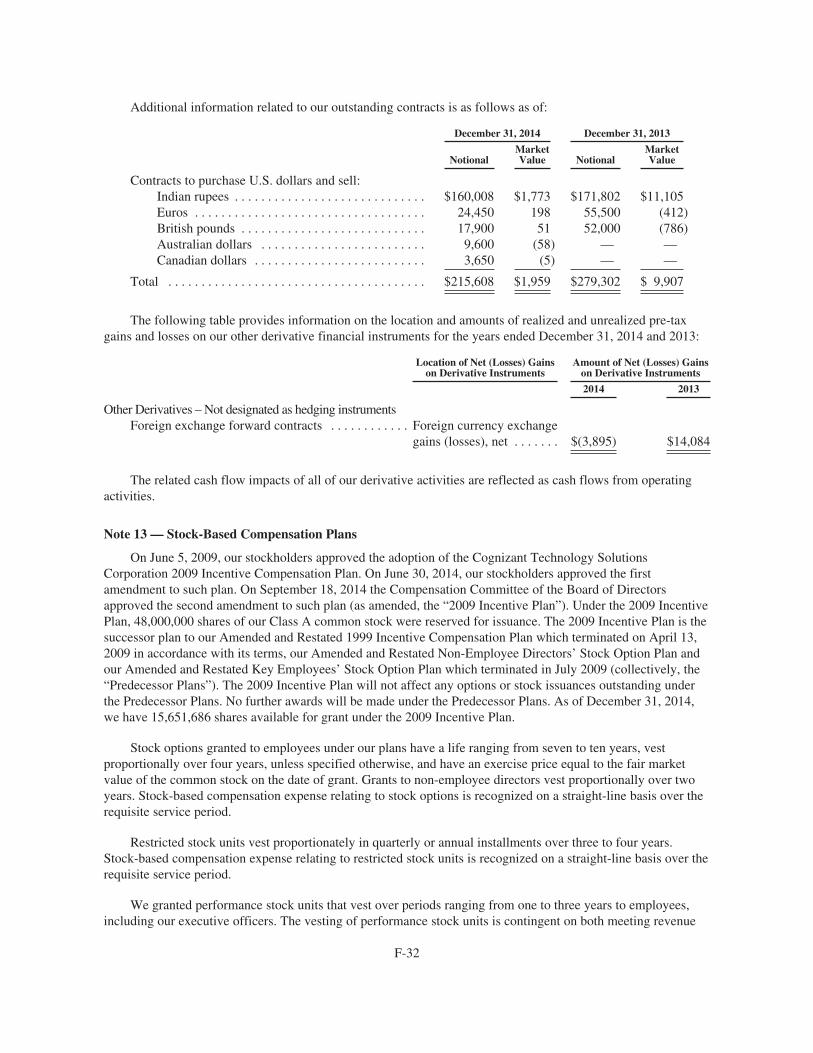
Additional information related to our outstanding contracts is as follows as of:
December 31, 2014 December 31, 2013
NotionalMarketValue Notional
MarketValue
Contracts to purchase U.S. dollars and sell:Indian rupees . . . . . . . . . . . . . . . . . . . . . . . . . . . . . $160,008 $1,773 $171,802 $11,105Euros . . . . . . . . . . . . . . . . . . . . . . . . . . . . . . . . . . . 24,450 198 55,500 (412)British pounds . . . . . . . . . . . . . . . . . . . . . . . . . . . . 17,900 51 52,000 (786)Australian dollars . . . . . . . . . . . . . . . . . . . . . . . . . 9,600 (58) — —Canadian dollars . . . . . . . . . . . . . . . . . . . . . . . . . . 3,650 (5) — —
Total . . . . . . . . . . . . . . . . . . . . . . . . . . . . . . . . . . . . . . . $215,608 $1,959 $279,302 $ 9,907
The following table provides information on the location and amounts of realized and unrealized pre-taxgains and losses on our other derivative financial instruments for the years ended December 31, 2014 and 2013:
Location of Net (Losses) Gainson Derivative Instruments
Amount of Net (Losses) Gainson Derivative Instruments
2014 2013
Other Derivatives – Not designated as hedging instrumentsForeign exchange forward contracts . . . . . . . . . . . . Foreign currency exchange
gains (losses), net . . . . . . . $(3,895) $14,084
The related cash flow impacts of all of our derivative activities are reflected as cash flows from operatingactivities.
Note 13 — Stock-Based Compensation Plans
On June 5, 2009, our stockholders approved the adoption of the Cognizant Technology SolutionsCorporation 2009 Incentive Compensation Plan. On June 30, 2014, our stockholders approved the firstamendment to such plan. On September 18, 2014 the Compensation Committee of the Board of Directorsapproved the second amendment to such plan (as amended, the “2009 Incentive Plan”). Under the 2009 IncentivePlan, 48,000,000 shares of our Class A common stock were reserved for issuance. The 2009 Incentive Plan is thesuccessor plan to our Amended and Restated 1999 Incentive Compensation Plan which terminated on April 13,2009 in accordance with its terms, our Amended and Restated Non-Employee Directors’ Stock Option Plan andour Amended and Restated Key Employees’ Stock Option Plan which terminated in July 2009 (collectively, the“Predecessor Plans”). The 2009 Incentive Plan will not affect any options or stock issuances outstanding underthe Predecessor Plans. No further awards will be made under the Predecessor Plans. As of December 31, 2014,we have 15,651,686 shares available for grant under the 2009 Incentive Plan.
Stock options granted to employees under our plans have a life ranging from seven to ten years, vestproportionally over four years, unless specified otherwise, and have an exercise price equal to the fair marketvalue of the common stock on the date of grant. Grants to non-employee directors vest proportionally over twoyears. Stock-based compensation expense relating to stock options is recognized on a straight-line basis over therequisite service period.
Restricted stock units vest proportionately in quarterly or annual installments over three to four years.Stock-based compensation expense relating to restricted stock units is recognized on a straight-line basis over therequisite service period.
We granted performance stock units that vest over periods ranging from one to three years to employees,including our executive officers. The vesting of performance stock units is contingent on both meeting revenue
F-32
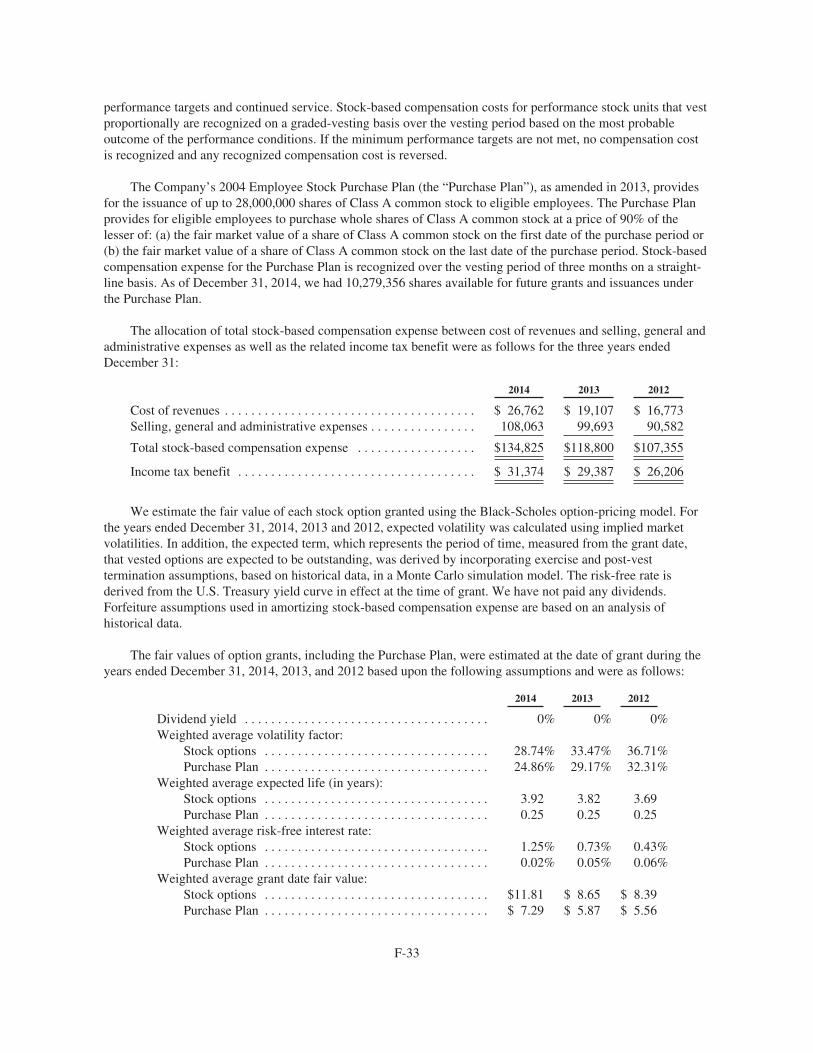
performance targets and continued service. Stock-based compensation costs for performance stock units that vestproportionally are recognized on a graded-vesting basis over the vesting period based on the most probableoutcome of the performance conditions. If the minimum performance targets are not met, no compensation costis recognized and any recognized compensation cost is reversed.
The Company’s 2004 Employee Stock Purchase Plan (the “Purchase Plan”), as amended in 2013, providesfor the issuance of up to 28,000,000 shares of Class A common stock to eligible employees. The Purchase Planprovides for eligible employees to purchase whole shares of Class A common stock at a price of 90% of thelesser of: (a) the fair market value of a share of Class A common stock on the first date of the purchase period or(b) the fair market value of a share of Class A common stock on the last date of the purchase period. Stock-basedcompensation expense for the Purchase Plan is recognized over the vesting period of three months on a straight-line basis. As of December 31, 2014, we had 10,279,356 shares available for future grants and issuances underthe Purchase Plan.
The allocation of total stock-based compensation expense between cost of revenues and selling, general andadministrative expenses as well as the related income tax benefit were as follows for the three years endedDecember 31:
2014 2013 2012
Cost of revenues . . . . . . . . . . . . . . . . . . . . . . . . . . . . . . . . . . . . . . $ 26,762 $ 19,107 $ 16,773Selling, general and administrative expenses . . . . . . . . . . . . . . . . 108,063 99,693 90,582
Total stock-based compensation expense . . . . . . . . . . . . . . . . . . $134,825 $118,800 $107,355
Income tax benefit . . . . . . . . . . . . . . . . . . . . . . . . . . . . . . . . . . . . $ 31,374 $ 29,387 $ 26,206
We estimate the fair value of each stock option granted using the Black-Scholes option-pricing model. Forthe years ended December 31, 2014, 2013 and 2012, expected volatility was calculated using implied marketvolatilities. In addition, the expected term, which represents the period of time, measured from the grant date,that vested options are expected to be outstanding, was derived by incorporating exercise and post-vesttermination assumptions, based on historical data, in a Monte Carlo simulation model. The risk-free rate isderived from the U.S. Treasury yield curve in effect at the time of grant. We have not paid any dividends.Forfeiture assumptions used in amortizing stock-based compensation expense are based on an analysis ofhistorical data.
The fair values of option grants, including the Purchase Plan, were estimated at the date of grant during theyears ended December 31, 2014, 2013, and 2012 based upon the following assumptions and were as follows:
2014 2013 2012
Dividend yield . . . . . . . . . . . . . . . . . . . . . . . . . . . . . . . . . . . . . 0% 0% 0%Weighted average volatility factor:
Stock options . . . . . . . . . . . . . . . . . . . . . . . . . . . . . . . . . . 28.74% 33.47% 36.71%Purchase Plan . . . . . . . . . . . . . . . . . . . . . . . . . . . . . . . . . . 24.86% 29.17% 32.31%
Weighted average expected life (in years):Stock options . . . . . . . . . . . . . . . . . . . . . . . . . . . . . . . . . . 3.92 3.82 3.69Purchase Plan . . . . . . . . . . . . . . . . . . . . . . . . . . . . . . . . . . 0.25 0.25 0.25
Weighted average risk-free interest rate:Stock options . . . . . . . . . . . . . . . . . . . . . . . . . . . . . . . . . . 1.25% 0.73% 0.43%Purchase Plan . . . . . . . . . . . . . . . . . . . . . . . . . . . . . . . . . . 0.02% 0.05% 0.06%
Weighted average grant date fair value:Stock options . . . . . . . . . . . . . . . . . . . . . . . . . . . . . . . . . . $11.81 $ 8.65 $ 8.39Purchase Plan . . . . . . . . . . . . . . . . . . . . . . . . . . . . . . . . . . $ 7.29 $ 5.87 $ 5.56
F-33
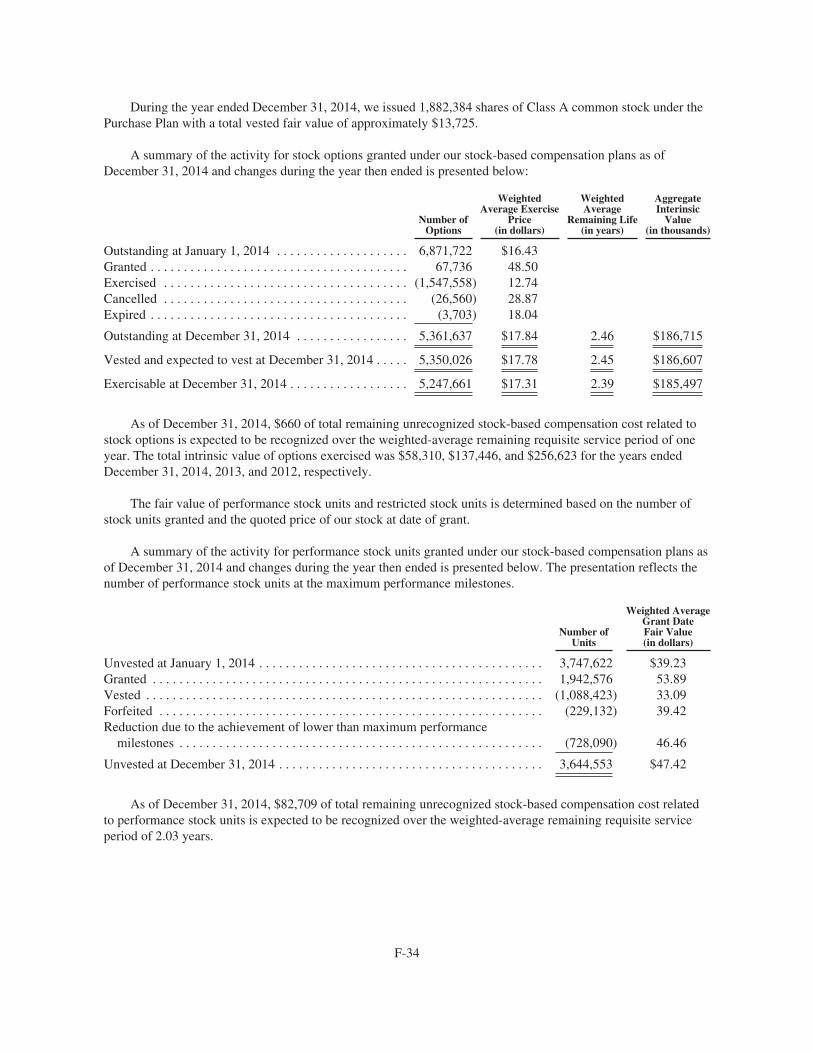
During the year ended December 31, 2014, we issued 1,882,384 shares of Class A common stock under thePurchase Plan with a total vested fair value of approximately $13,725.
A summary of the activity for stock options granted under our stock-based compensation plans as ofDecember 31, 2014 and changes during the year then ended is presented below:
Number ofOptions
WeightedAverage Exercise
Price(in dollars)
WeightedAverage
Remaining Life(in years)
AggregateInterinsic
Value(in thousands)
Outstanding at January 1, 2014 . . . . . . . . . . . . . . . . . . . . 6,871,722 $16.43Granted . . . . . . . . . . . . . . . . . . . . . . . . . . . . . . . . . . . . . . . 67,736 48.50Exercised . . . . . . . . . . . . . . . . . . . . . . . . . . . . . . . . . . . . . (1,547,558) 12.74Cancelled . . . . . . . . . . . . . . . . . . . . . . . . . . . . . . . . . . . . . (26,560) 28.87Expired . . . . . . . . . . . . . . . . . . . . . . . . . . . . . . . . . . . . . . . (3,703) 18.04
Outstanding at December 31, 2014 . . . . . . . . . . . . . . . . . 5,361,637 $17.84 2.46 $186,715
Vested and expected to vest at December 31, 2014 . . . . . 5,350,026 $17.78 2.45 $186,607
Exercisable at December 31, 2014 . . . . . . . . . . . . . . . . . . 5,247,661 $17.31 2.39 $185,497
As of December 31, 2014, $660 of total remaining unrecognized stock-based compensation cost related tostock options is expected to be recognized over the weighted-average remaining requisite service period of oneyear. The total intrinsic value of options exercised was $58,310, $137,446, and $256,623 for the years endedDecember 31, 2014, 2013, and 2012, respectively.
The fair value of performance stock units and restricted stock units is determined based on the number ofstock units granted and the quoted price of our stock at date of grant.
A summary of the activity for performance stock units granted under our stock-based compensation plans asof December 31, 2014 and changes during the year then ended is presented below. The presentation reflects thenumber of performance stock units at the maximum performance milestones.
Number ofUnits
Weighted AverageGrant DateFair Value(in dollars)
Unvested at January 1, 2014 . . . . . . . . . . . . . . . . . . . . . . . . . . . . . . . . . . . . . . . . . . . 3,747,622 $39.23Granted . . . . . . . . . . . . . . . . . . . . . . . . . . . . . . . . . . . . . . . . . . . . . . . . . . . . . . . . . . . 1,942,576 53.89Vested . . . . . . . . . . . . . . . . . . . . . . . . . . . . . . . . . . . . . . . . . . . . . . . . . . . . . . . . . . . . (1,088,423) 33.09Forfeited . . . . . . . . . . . . . . . . . . . . . . . . . . . . . . . . . . . . . . . . . . . . . . . . . . . . . . . . . . (229,132) 39.42Reduction due to the achievement of lower than maximum performance
milestones . . . . . . . . . . . . . . . . . . . . . . . . . . . . . . . . . . . . . . . . . . . . . . . . . . . . . . . (728,090) 46.46
Unvested at December 31, 2014 . . . . . . . . . . . . . . . . . . . . . . . . . . . . . . . . . . . . . . . . 3,644,553 $47.42
As of December 31, 2014, $82,709 of total remaining unrecognized stock-based compensation cost relatedto performance stock units is expected to be recognized over the weighted-average remaining requisite serviceperiod of 2.03 years.
F-34
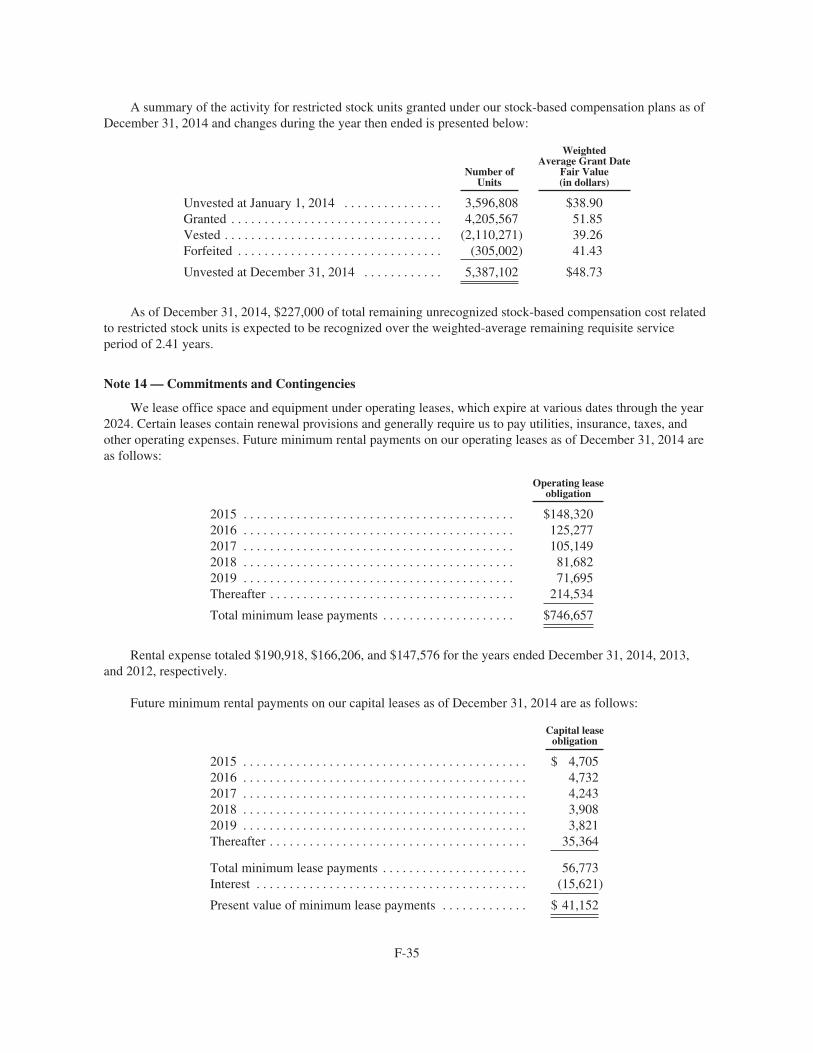
A summary of the activity for restricted stock units granted under our stock-based compensation plans as ofDecember 31, 2014 and changes during the year then ended is presented below:
Number ofUnits
WeightedAverage Grant Date
Fair Value(in dollars)
Unvested at January 1, 2014 . . . . . . . . . . . . . . . 3,596,808 $38.90Granted . . . . . . . . . . . . . . . . . . . . . . . . . . . . . . . . 4,205,567 51.85Vested . . . . . . . . . . . . . . . . . . . . . . . . . . . . . . . . . (2,110,271) 39.26Forfeited . . . . . . . . . . . . . . . . . . . . . . . . . . . . . . . (305,002) 41.43
Unvested at December 31, 2014 . . . . . . . . . . . . 5,387,102 $48.73
As of December 31, 2014, $227,000 of total remaining unrecognized stock-based compensation cost relatedto restricted stock units is expected to be recognized over the weighted-average remaining requisite serviceperiod of 2.41 years.
Note 14 — Commitments and Contingencies
We lease office space and equipment under operating leases, which expire at various dates through the year2024. Certain leases contain renewal provisions and generally require us to pay utilities, insurance, taxes, andother operating expenses. Future minimum rental payments on our operating leases as of December 31, 2014 areas follows:
Operating leaseobligation
2015 . . . . . . . . . . . . . . . . . . . . . . . . . . . . . . . . . . . . . . . . . $148,3202016 . . . . . . . . . . . . . . . . . . . . . . . . . . . . . . . . . . . . . . . . . 125,2772017 . . . . . . . . . . . . . . . . . . . . . . . . . . . . . . . . . . . . . . . . . 105,1492018 . . . . . . . . . . . . . . . . . . . . . . . . . . . . . . . . . . . . . . . . . 81,6822019 . . . . . . . . . . . . . . . . . . . . . . . . . . . . . . . . . . . . . . . . . 71,695Thereafter . . . . . . . . . . . . . . . . . . . . . . . . . . . . . . . . . . . . . 214,534
Total minimum lease payments . . . . . . . . . . . . . . . . . . . . $746,657
Rental expense totaled $190,918, $166,206, and $147,576 for the years ended December 31, 2014, 2013,and 2012, respectively.
Future minimum rental payments on our capital leases as of December 31, 2014 are as follows:
Capital leaseobligation
2015 . . . . . . . . . . . . . . . . . . . . . . . . . . . . . . . . . . . . . . . . . . . $ 4,7052016 . . . . . . . . . . . . . . . . . . . . . . . . . . . . . . . . . . . . . . . . . . . 4,7322017 . . . . . . . . . . . . . . . . . . . . . . . . . . . . . . . . . . . . . . . . . . . 4,2432018 . . . . . . . . . . . . . . . . . . . . . . . . . . . . . . . . . . . . . . . . . . . 3,9082019 . . . . . . . . . . . . . . . . . . . . . . . . . . . . . . . . . . . . . . . . . . . 3,821Thereafter . . . . . . . . . . . . . . . . . . . . . . . . . . . . . . . . . . . . . . . 35,364
Total minimum lease payments . . . . . . . . . . . . . . . . . . . . . . 56,773Interest . . . . . . . . . . . . . . . . . . . . . . . . . . . . . . . . . . . . . . . . . (15,621)
Present value of minimum lease payments . . . . . . . . . . . . . $ 41,152
F-35
As of December 31, 2014, we had outstanding fixed capital commitments of approximately $20,452 relatedto our India real estate development program to build new Company-owned state-of-the-art IT development anddelivery centers.
We are involved in various claims and legal actions arising in the ordinary course of business. We accrue aliability when a loss is considered probable and the amount can be reasonably estimated. In the opinion ofmanagement, the outcome of any existing claims and legal or regulatory proceedings, if decided adversely, is notexpected to have a material adverse effect on our business, financial condition, results of operations and cashflows. Additionally, many of our engagements involve projects that are critical to the operations of ourcustomers’ business and provide benefits that are difficult to quantify. Any failure in a customer’s systems or ourfailure to meet our contractual obligations to our clients, including any breach involving a customer’sconfidential information or sensitive data, or our obligations under applicable laws or regulations could result ina claim for substantial damages against us, regardless of our responsibility for such failure. Although we attemptto contractually limit our liability for damages arising from negligent acts, errors, mistakes, or omissions inrendering our services, there can be no assurance that the limitations of liability set forth in our contracts will beenforceable in all instances or will otherwise protect us from liability for damages. Although we have generalliability insurance coverage, including coverage for errors or omissions, there can be no assurance that suchcoverage will cover all types of claims, continue to be available on reasonable terms or will be available insufficient amounts to cover one or more large claims, or that the insurer will not disclaim coverage as to anyfuture claim. The successful assertion of one or more large claims against us that exceed or are not covered byour insurance coverage or changes in our insurance policies, including premium increases or the imposition oflarge deductible or co-insurance requirements, could have a material adverse effect on our business, results ofoperations, financial condition and cash flows.
In the normal course of business and in conjunction with certain client engagements, we have entered intocontractual arrangements through which we may be obligated to indemnify clients or other parties with whom weconduct business with respect to certain matters. These arrangements can include provisions whereby we agree tohold the indemnified party and certain of their affiliated entities harmless with respect to third-party claimsrelated to such matters as our breach of certain representations or covenants, or out of our intellectual propertyinfringement, our gross negligence or willful misconduct or certain other claims made against certain parties.Payments by us under any of these arrangements are generally conditioned on the client making a claim andproviding us with full control over the defense and settlement of such claim. It is not possible to determine themaximum potential amount under these indemnification agreements due to the unique facts and circumstancesinvolved in each particular agreement. Historically, we have not made payments under these indemnificationagreements and therefore they have not had any impact on our operating results, financial position, or cash flows.However, if events arise requiring us to make payment for indemnification claims under our indemnificationobligations in contracts we have entered, such payments could have material impact on our business, results ofoperations, financial condition and cash flows.
Note 15 — Segment Information
Our reportable segments are:
• Financial Services, which includes customers providing banking/transaction processing, capitalmarkets and insurance services;
• Healthcare, which includes healthcare providers and payers as well as life sciences customers. OurHealthcare business segment includes the post-acquisition operating results of TriZetto;
• Manufacturing/Retail/Logistics, which includes manufacturers, retailers, travel and other hospitalitycustomers, as well as customers providing logistics services; and
• Other, which is an aggregation of industries each of which, individually, represents less than 10% ofconsolidated revenues and segment operating profit. The Other reportable segment includes ourinformation, media and entertainment services, communications and high technology operating segments.
F-36
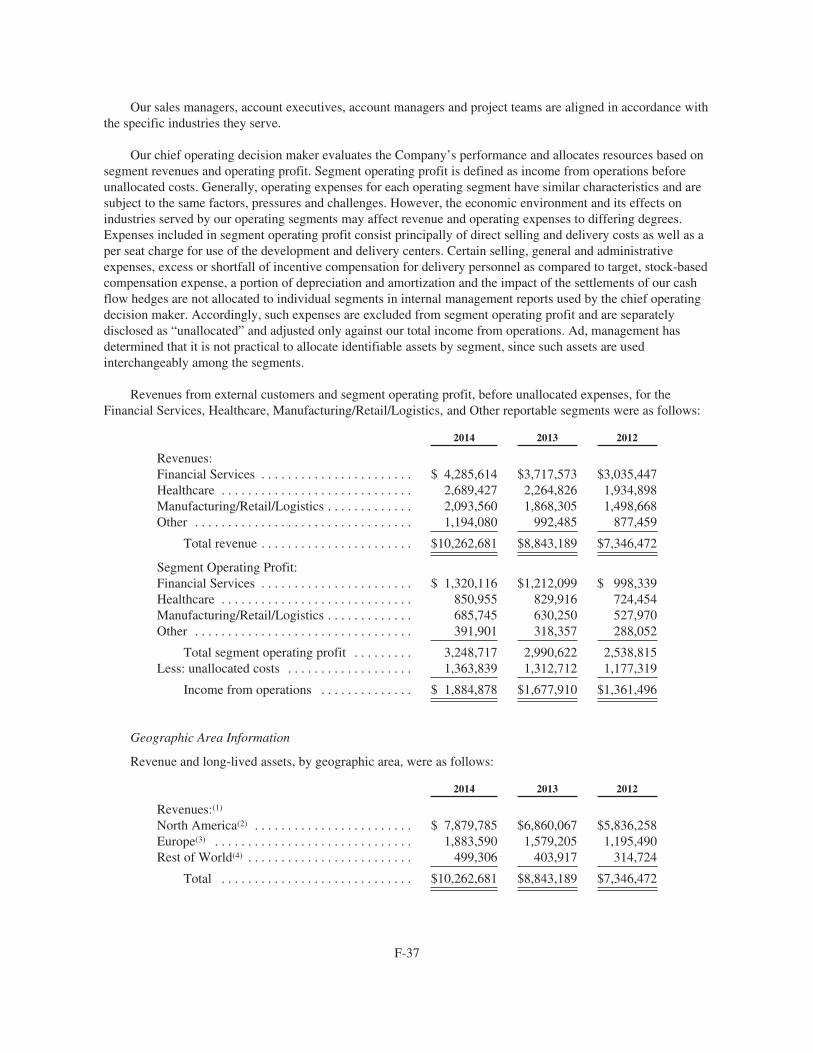
Our sales managers, account executives, account managers and project teams are aligned in accordance withthe specific industries they serve.
Our chief operating decision maker evaluates the Company’s performance and allocates resources based onsegment revenues and operating profit. Segment operating profit is defined as income from operations beforeunallocated costs. Generally, operating expenses for each operating segment have similar characteristics and aresubject to the same factors, pressures and challenges. However, the economic environment and its effects onindustries served by our operating segments may affect revenue and operating expenses to differing degrees.Expenses included in segment operating profit consist principally of direct selling and delivery costs as well as aper seat charge for use of the development and delivery centers. Certain selling, general and administrativeexpenses, excess or shortfall of incentive compensation for delivery personnel as compared to target, stock-basedcompensation expense, a portion of depreciation and amortization and the impact of the settlements of our cashflow hedges are not allocated to individual segments in internal management reports used by the chief operatingdecision maker. Accordingly, such expenses are excluded from segment operating profit and are separatelydisclosed as “unallocated” and adjusted only against our total income from operations. Ad, management hasdetermined that it is not practical to allocate identifiable assets by segment, since such assets are usedinterchangeably among the segments.
Revenues from external customers and segment operating profit, before unallocated expenses, for theFinancial Services, Healthcare, Manufacturing/Retail/Logistics, and Other reportable segments were as follows:
2014 2013 2012
Revenues:Financial Services . . . . . . . . . . . . . . . . . . . . . . . $ 4,285,614 $3,717,573 $3,035,447Healthcare . . . . . . . . . . . . . . . . . . . . . . . . . . . . . 2,689,427 2,264,826 1,934,898Manufacturing/Retail/Logistics . . . . . . . . . . . . . 2,093,560 1,868,305 1,498,668Other . . . . . . . . . . . . . . . . . . . . . . . . . . . . . . . . . 1,194,080 992,485 877,459
Total revenue . . . . . . . . . . . . . . . . . . . . . . . $10,262,681 $8,843,189 $7,346,472
Segment Operating Profit:Financial Services . . . . . . . . . . . . . . . . . . . . . . . $ 1,320,116 $1,212,099 $ 998,339Healthcare . . . . . . . . . . . . . . . . . . . . . . . . . . . . . 850,955 829,916 724,454Manufacturing/Retail/Logistics . . . . . . . . . . . . . 685,745 630,250 527,970Other . . . . . . . . . . . . . . . . . . . . . . . . . . . . . . . . . 391,901 318,357 288,052
Total segment operating profit . . . . . . . . . 3,248,717 2,990,622 2,538,815Less: unallocated costs . . . . . . . . . . . . . . . . . . . 1,363,839 1,312,712 1,177,319
Income from operations . . . . . . . . . . . . . . $ 1,884,878 $1,677,910 $1,361,496
Geographic Area Information
Revenue and long-lived assets, by geographic area, were as follows:
2014 2013 2012
Revenues:(1)
North America(2) . . . . . . . . . . . . . . . . . . . . . . . . $ 7,879,785 $6,860,067 $5,836,258Europe(3) . . . . . . . . . . . . . . . . . . . . . . . . . . . . . . 1,883,590 1,579,205 1,195,490Rest of World(4) . . . . . . . . . . . . . . . . . . . . . . . . . 499,306 403,917 314,724
Total . . . . . . . . . . . . . . . . . . . . . . . . . . . . . $10,262,681 $8,843,189 $7,346,472
F-37
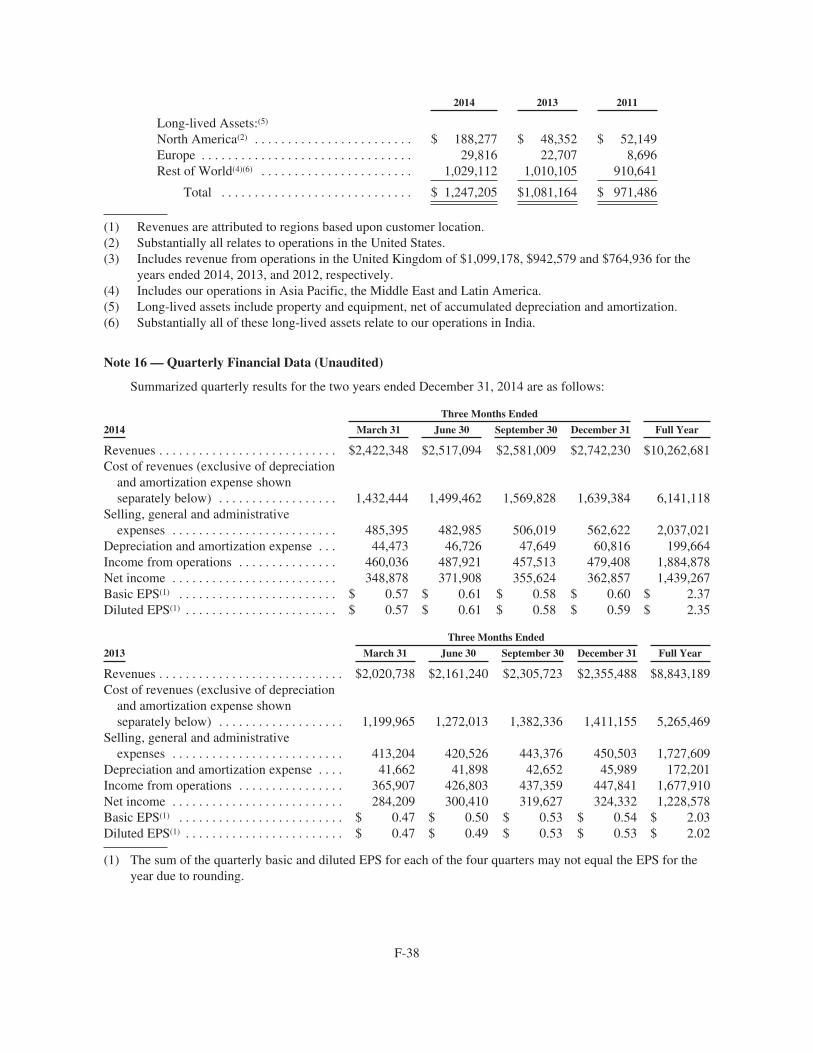
2014 2013 2011
Long-lived Assets:(5)
North America(2) . . . . . . . . . . . . . . . . . . . . . . . . $ 188,277 $ 48,352 $ 52,149Europe . . . . . . . . . . . . . . . . . . . . . . . . . . . . . . . . 29,816 22,707 8,696Rest of World(4)(6) . . . . . . . . . . . . . . . . . . . . . . . 1,029,112 1,010,105 910,641
Total . . . . . . . . . . . . . . . . . . . . . . . . . . . . . $ 1,247,205 $1,081,164 $ 971,486
(1) Revenues are attributed to regions based upon customer location.(2) Substantially all relates to operations in the United States.(3) Includes revenue from operations in the United Kingdom of $1,099,178, $942,579 and $764,936 for the
years ended 2014, 2013, and 2012, respectively.(4) Includes our operations in Asia Pacific, the Middle East and Latin America.(5) Long-lived assets include property and equipment, net of accumulated depreciation and amortization.(6) Substantially all of these long-lived assets relate to our operations in India.
Note 16 — Quarterly Financial Data (Unaudited)
Summarized quarterly results for the two years ended December 31, 2014 are as follows:
Three Months Ended
2014 March 31 June 30 September 30 December 31 Full Year
Revenues . . . . . . . . . . . . . . . . . . . . . . . . . . . $2,422,348 $2,517,094 $2,581,009 $2,742,230 $10,262,681Cost of revenues (exclusive of depreciation
and amortization expense shownseparately below) . . . . . . . . . . . . . . . . . . 1,432,444 1,499,462 1,569,828 1,639,384 6,141,118
Selling, general and administrativeexpenses . . . . . . . . . . . . . . . . . . . . . . . . . 485,395 482,985 506,019 562,622 2,037,021
Depreciation and amortization expense . . . 44,473 46,726 47,649 60,816 199,664Income from operations . . . . . . . . . . . . . . . 460,036 487,921 457,513 479,408 1,884,878Net income . . . . . . . . . . . . . . . . . . . . . . . . . 348,878 371,908 355,624 362,857 1,439,267Basic EPS(1) . . . . . . . . . . . . . . . . . . . . . . . . $ 0.57 $ 0.61 $ 0.58 $ 0.60 $ 2.37Diluted EPS(1) . . . . . . . . . . . . . . . . . . . . . . . $ 0.57 $ 0.61 $ 0.58 $ 0.59 $ 2.35
Three Months Ended
2013 March 31 June 30 September 30 December 31 Full Year
Revenues . . . . . . . . . . . . . . . . . . . . . . . . . . . . $2,020,738 $2,161,240 $2,305,723 $2,355,488 $8,843,189Cost of revenues (exclusive of depreciation
and amortization expense shownseparately below) . . . . . . . . . . . . . . . . . . . 1,199,965 1,272,013 1,382,336 1,411,155 5,265,469
Selling, general and administrativeexpenses . . . . . . . . . . . . . . . . . . . . . . . . . . 413,204 420,526 443,376 450,503 1,727,609
Depreciation and amortization expense . . . . 41,662 41,898 42,652 45,989 172,201Income from operations . . . . . . . . . . . . . . . . 365,907 426,803 437,359 447,841 1,677,910Net income . . . . . . . . . . . . . . . . . . . . . . . . . . 284,209 300,410 319,627 324,332 1,228,578Basic EPS(1) . . . . . . . . . . . . . . . . . . . . . . . . . $ 0.47 $ 0.50 $ 0.53 $ 0.54 $ 2.03Diluted EPS(1) . . . . . . . . . . . . . . . . . . . . . . . . $ 0.47 $ 0.49 $ 0.53 $ 0.53 $ 2.02
(1) The sum of the quarterly basic and diluted EPS for each of the four quarters may not equal the EPS for theyear due to rounding.
F-38
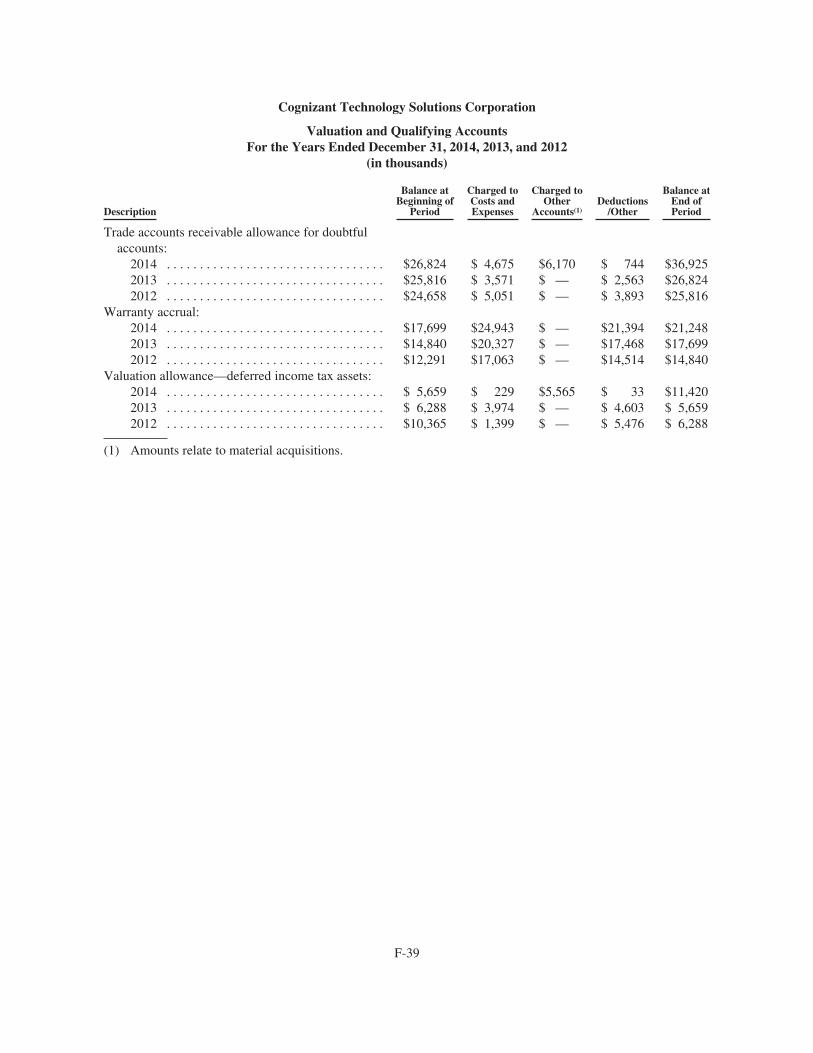
Cognizant Technology Solutions Corporation
Valuation and Qualifying AccountsFor the Years Ended December 31, 2014, 2013, and 2012
(in thousands)
Description
Balance atBeginning of
Period
Charged toCosts andExpenses
Charged toOther
Accounts(1)Deductions
/Other
Balance atEnd ofPeriod
Trade accounts receivable allowance for doubtfulaccounts:
2014 . . . . . . . . . . . . . . . . . . . . . . . . . . . . . . . . . $26,824 $ 4,675 $6,170 $ 744 $36,9252013 . . . . . . . . . . . . . . . . . . . . . . . . . . . . . . . . . $25,816 $ 3,571 $ — $ 2,563 $26,8242012 . . . . . . . . . . . . . . . . . . . . . . . . . . . . . . . . . $24,658 $ 5,051 $ — $ 3,893 $25,816
Warranty accrual:2014 . . . . . . . . . . . . . . . . . . . . . . . . . . . . . . . . . $17,699 $24,943 $ — $21,394 $21,2482013 . . . . . . . . . . . . . . . . . . . . . . . . . . . . . . . . . $14,840 $20,327 $ — $17,468 $17,6992012 . . . . . . . . . . . . . . . . . . . . . . . . . . . . . . . . . $12,291 $17,063 $ — $14,514 $14,840
Valuation allowance—deferred income tax assets:2014 . . . . . . . . . . . . . . . . . . . . . . . . . . . . . . . . . $ 5,659 $ 229 $5,565 $ 33 $11,4202013 . . . . . . . . . . . . . . . . . . . . . . . . . . . . . . . . . $ 6,288 $ 3,974 $ — $ 4,603 $ 5,6592012 . . . . . . . . . . . . . . . . . . . . . . . . . . . . . . . . . $10,365 $ 1,399 $ — $ 5,476 $ 6,288
(1) Amounts relate to material acquisitions.
F-39

[THIS PAGE INTENTIONALLY LEFT BLANK]

EXHIBIT 31.1
CERTIFICATION
I, Francisco D’Souza, certify that:
1. I have reviewed this Annual Report on Form 10-K of Cognizant Technology Solutions Corporation;
2. Based on my knowledge, this report does not contain any untrue statement of a material fact or omit tostate a material fact necessary to make the statements made, in light of the circumstances under whichsuch statements were made, not misleading with respect to the period covered by this report;
3. Based on my knowledge, the financial statements, and other financial information included in thisreport, fairly present in all material respects the financial condition, results of operations and cashflows of the registrant as of, and for, the periods presented in this report;
4. The registrant’s other certifying officer and I are responsible for establishing and maintainingdisclosure controls and procedures (as defined in Exchange Act Rules 13a-15(e) and 15d-15(e)) andinternal control over financial reporting (as defined in Exchange Act Rules 13a-15(f) and 15d-15(f)) forthe registrant and have:
a) Designed such disclosure controls and procedures, or caused such disclosure controls andprocedures to be designed under our supervision, to ensure that material information relating tothe registrant, including its consolidated subsidiaries, is made known to us by others within thoseentities, particularly during the period in which this report is being prepared;
b) Designed such internal control over financial reporting, or caused such internal control overfinancial reporting to be designed under our supervision, to provide reasonable assuranceregarding the reliability of financial reporting and the preparation of financial statements forexternal purposes in accordance with generally accepted accounting principles;
c) Evaluated the effectiveness of the registrant’s disclosure controls and procedures and presented inthis report our conclusions about the effectiveness of the disclosure controls and procedures, as ofthe end of the period covered by this report based on such evaluation; and
d) Disclosed in this report any change in the registrant’s internal control over financial reporting thatoccurred during the registrant’s most recent fiscal quarter (the registrant’s fourth fiscal quarter inthe case of an annual report) that has materially affected, or is reasonably likely to materiallyaffect, the registrant’s internal control over financial reporting; and
5. The registrant’s other certifying officer and I have disclosed, based on our most recent evaluation ofinternal control over financial reporting, to the registrant’s auditors and the audit committee of theregistrant’s board of directors (or persons performing the equivalent function):
a) All significant deficiencies and material weaknesses in the design or operation of internal controlover financial reporting which are reasonably likely to adversely affect the registrant’s ability torecord, process, summarize and report financial information; and
b) Any fraud, whether or not material, that involves management or other employees who have asignificant role in the registrant’s internal control over financial reporting.
Dated: February 27, 2015
/S/ FRANCISCO D’SOUZA
Francisco D’SouzaChief Executive Officer
(Principal Executive Officer)

EXHIBIT 31.2
CERTIFICATION
I, Karen McLoughlin, certify that:
1. I have reviewed this Annual Report on Form 10-K of Cognizant Technology Solutions Corporation;
2. Based on my knowledge, this report does not contain any untrue statement of a material fact or omit tostate a material fact necessary to make the statements made, in light of the circumstances under whichsuch statements were made, not misleading with respect to the period covered by this report;
3. Based on my knowledge, the financial statements, and other financial information included in thisreport, fairly present in all material respects the financial condition, results of operations and cashflows of the registrant as of, and for, the periods presented in this report;
4. The registrant’s other certifying officer and I are responsible for establishing and maintainingdisclosure controls and procedures (as defined in Exchange Act Rules 13a-15(e) and 15d-15(e)) andinternal control over financial reporting (as defined in Exchange Act Rules 13a-15(f) and 15d-15(f)) forthe registrant and have:
a) Designed such disclosure controls and procedures, or caused such disclosure controls andprocedures to be designed under our supervision, to ensure that material information relating tothe registrant, including its consolidated subsidiaries, is made known to us by others within thoseentities, particularly during the period in which this report is being prepared;
b) Designed such internal control over financial reporting, or caused such internal control overfinancial reporting to be designed under our supervision, to provide reasonable assuranceregarding the reliability of financial reporting and the preparation of financial statements forexternal purposes in accordance with generally accepted accounting principles;
c) Evaluated the effectiveness of the registrant’s disclosure controls and procedures and presented inthis report our conclusions about the effectiveness of the disclosure controls and procedures, as ofthe end of the period covered by this report based on such evaluation; and
d) Disclosed in this report any change in the registrant’s internal control over financial reporting thatoccurred during the registrant’s most recent fiscal quarter (the registrant’s fourth fiscal quarter inthe case of an annual report) that has materially affected, or is reasonably likely to materiallyaffect, the registrant’s internal control over financial reporting; and
5. The registrant’s other certifying officer and I have disclosed, based on our most recent evaluation ofinternal control over financial reporting, to the registrant’s auditors and the audit committee of theregistrant’s board of directors (or persons performing the equivalent function):
a) All significant deficiencies and material weaknesses in the design or operation of internal controlover financial reporting which are reasonably likely to adversely affect the registrant’s ability torecord, process, summarize and report financial information; and
b) Any fraud, whether or not material, that involves management or other employees who have asignificant role in the registrant’s internal control over financial reporting.
Dated: February 27, 2015
/S/ KAREN MCLOUGHLIN
Karen McLoughlinChief Financial Officer
(Principal Financial and Accounting Officer)
EXHIBIT 32.1
CERTIFICATION PURSUANT TO 18 U.S.C. SECTION 1350,AS ADOPTED PURSUANT TO
SECTION 906 OF THE SARBANES-OXLEY ACT OF 2002
In connection with the Annual Report on Form 10-K of Cognizant Technology Solutions Corporation (the“Company”) for the period ended December 31, 2014 as filed with the Securities and Exchange Commission onthe date hereof (the “Report”), the undersigned, Francisco D’Souza, Chief Executive Officer of the Company,hereby certifies, pursuant to 18 U. S.C. Section 1350, that:
(1) The Report fully complies with the requirements of Section 13(a) or 15(d) of the Securities ExchangeAct of 1934; and
(2) The information contained in the Report fairly presents, in all material respects, the financial conditionand results of operations of the Company.
Dated: February 27, 2015
/S/ FRANCISCO D’SOUZA
Francisco D’SouzaChief Executive Officer
(Principal Executive Officer)
* A signed original of this written statement required by Section 906 has been provided to CognizantTechnology Solutions Corporation and will be retained by Cognizant Technology Solutions Corporation andfurnished to the Securities and Exchange Commission or its staff upon request.
EXHIBIT 32.2
CERTIFICATION PURSUANT TO 18 U.S.C. SECTION 1350,AS ADOPTED PURSUANT TO
SECTION 906 OF THE SARBANES-OXLEY ACT OF 2002
In connection with the Annual Report on Form 10-K of Cognizant Technology Solutions Corporation (the“Company”) for the period ended December 31, 2014 as filed with the Securities and Exchange Commission onthe date hereof (the “Report”), the undersigned, Karen McLoughlin, Chief Financial Officer of the Company,hereby certifies, pursuant to 18 U.S.C. Section 1350, that:
(1) The Report fully complies with the requirements of Section 13(a) or 15(d) of the Securities ExchangeAct of 1934; and
(2) The information contained in the Report fairly presents, in all material respects, the financial conditionand results of operations of the Company.
Dated: February 27, 2015
/S/ KAREN MCLOUGHLIN
Karen McLoughlinChief Financial Officer
(Principal Financial and Accounting Officer)
* A signed original of this written statement required by Section 906 has been provided to CognizantTechnology Solutions Corporation and will be retained by Cognizant Technology Solutions Corporation andfurnished to the Securities and Exchange Commission or its staff upon request.

[THIS PAGE INTENTIONALLY LEFT BLANK]

[THIS PAGE INTENTIONALLY LEFT BLANK]
DIRECTORS
John E. Klein (1) (2) (3) Chairman of the Board Cognizant
President
Polarex, Inc.
Lakshmi Narayanan Vice Chairman Cognizant
Maureen Breakiron-Evans (2) (3)
Towers Perrin
Francisco D’Souza
Cognizant
John N. Fox, Jr. (1) (3) Former Vice Chairman Deloitte & Touche LLP
Leo S. Mackay, Jr. (2) Vice President Lockheed Martin Corporation
Michael Patsalos-Fox (1) (3)
Stroz Friedberg
Robert E. Weissman (1) (3)
Chairman Shelburne Partners
Thomas M. Wendel (2) (3)
Bridge Information Systems
BOARD COMMITTEES
1 Compensation 2 Audit 3 Nominating and Corporate Governance
EXECUTIVE OFFICERS
Francisco D’Souza
Gordon J. Coburn President
Malcolm Frank Executive Vice President, Strategy and Marketing
Karen McLoughlin
Rajeev Mehta
IT Services
Steven Schwartz Executive Vice President Chief Legal and Corporate
Chandra Sekaran Executive Vice Chairman Cognizant India
Sridhar Thiruvengadam
EXECUTIVE OFFICES
Glenpointe Centre West 500 Frank W. Burr Blvd. Teaneck, NJ 07666 Phone: 201.801.0233
FORM 10-K
A copy of the Company’s Form 10-K is available without charge upon request by contacting Investor Relations at the address or phone number listed.
COMMON STOCK INFORMATION
The Company’s Class A common stock (CTSH) is listed on the NASDAQ Global Select Market.
ANNUAL MEETING
The Company’s annual meeting of stockholders will be held at 9:30 am on Tuesday, June 2, 2015 at the Company’s headquarters:
Glenpointe Centre West 500 Frank W. Burr Blvd. Teaneck, NJ 07666
LEGAL COUNSEL
Latham & Watkins LLP 885 Third Avenue New York, NY 10022-4834
INDEPENDENT REGISTERED PUBLIC ACCOUNTING FIRM
PricewaterhouseCoopers LLP 300 Madison Avenue New York, NY 10017
TRANSFER AGENT
American Stock Transfer & Trust Company, LLC 6201 15th Avenue Brooklyn, NY 11219
INTERNET
Additional company information is available on the World Wide Web: www.cognizant.com
INVESTOR RELATIONS
should be sent to:
David Nelson Cognizant Technology Solutions Glenpointe Centre West 500 Frank W. Burr Blvd. Teaneck, NJ 07666 Phone: 201.801.0233
CCOORRPPOORRAAATE INNFOOORRMMAAATTIOONNN
This Annual Report contains “forward-looking statements” within the meaning of the U.S. Private Securities Litigation Reform Act of 1995, including statements regarding the Company’s expectations for growth in 2015. Forward-looking statements are based on our current expectations and assumptions regarding our business, the economy and other future
These statements involve known and unknown risks, uncertainties and other important factors that may cause our actual results, performance or achievements to be materially different from those expressed or implied by the forward-looking statements. For further information about the important factors that could cause actual results to differ materially from those in the forward-looking statements, please see the section entitled “Risk Factors” in Item 1A of Part I of our Annual Report on Form 10-K, which is included in this Annual Report. You should evaluate all forward-looking statements made in this Annual Report in the context of these risks and uncertainties.
22

World Headquarters 500 Frank W. Burr Blvd. Teaneck, NJ 07666 USAPhone: +1 201 801 0233 Toll Free: +1 888 937 3277 www.cognizant.com