diffusion of iso 14001 environmental management system: global, regional and country-level analyses
TRANSCRIPT

Accepted Manuscript
Diffusion of ISO 14001 environmental management system: global, regional andcountry-level analyses
W.M. To, P.K.C. Lee
PII: S0959-6526(13)00852-4
DOI: 10.1016/j.jclepro.2013.11.076
Reference: JCLP 3845
To appear in: Journal of Cleaner Production
Received Date: 30 April 2013
Revised Date: 24 September 2013
Accepted Date: 29 November 2013
Please cite this article as: To WM, Lee PKC, Diffusion of ISO 14001 environmental managementsystem: global, regional and country-level analyses, Journal of Cleaner Production (2014), doi: 10.1016/j.jclepro.2013.11.076.
This is a PDF file of an unedited manuscript that has been accepted for publication. As a service toour customers we are providing this early version of the manuscript. The manuscript will undergocopyediting, typesetting, and review of the resulting proof before it is published in its final form. Pleasenote that during the production process errors may be discovered which could affect the content, and alllegal disclaimers that apply to the journal pertain.

MANUSCRIP
T
ACCEPTED
ACCEPTED MANUSCRIPT
1
Diffusion of ISO 14001 environmental management system: global, regional and
country-level analyses
W.M. To a* , P.K.C. Lee b
a Macao Polytechnic Institute, Macao SAR, the People’s Republic of China
b The Hong Kong Polytechnic University, Hong Kong SAR, the People’s Republic of
China
* Corresponding author: W.M. To
Macao Polytechnic Institute, Rua de Luis Gonzaga Gomes, Macao SAR, the
People’s Republic of China
Tel: +853 8599 3319; fax: +853 2872 7653
Email: [email protected]

MANUSCRIP
T
ACCEPTED
ACCEPTED MANUSCRIPT
2
Abstract
This paper explores the diffusion patterns of the ISO 14001 environmental management
system worldwide. By using the data obtained from the ISO Survey of Certifications,
the diffusion of ISO 14001 was investigated at global, regional, and country-specific
levels. The results showed that both global and regional patterns resembled a typical
logistic growth curve. The parameters of logistic curves were identified using nonlinear
regression estimation, and the total number of ISO 14001 certificates issued was
projected. At the country-specific level, correlation analysis was performed and three
distinct groups were identified. The three groups resembled logistic growth curves with
different growth rates. The spatial-temporal analysis showed that the diffusion of ISO
14001 was from west to east due to supply chain dynamics and change in the volume of
total exports.
Keywords: ISO 14001; diffusion; logistic growth; global, regional and country levels
1. Introduction
Green production is a business strategy and an innovation that focuses on
effectiveness and profitability through environmentally friendly design, procurement,
production, and delivery processes. The ISO 14000 family of standards is designed to
enable worldwide adoption of green production (ISO, 2012a, 2012b) and covers
various aspects of environmental management, assessment, and auditing at

MANUSCRIP
T
ACCEPTED
ACCEPTED MANUSCRIPT
3
organizational, process, and product levels. In particular, the certification standard ISO
14001 has been widely adopted in a wide variety of organizations across the world
since its creation in 1996.
ISO 14001 has been widely researched in different disciplines in the past twelve
years (Albuquerque et al., 2007; Bansal and Bogner, 2002; Bansal and Hunter, 2003;
Boiral, 2007; Corbett and Kirsch, 2001; Delmas, 2001, 2002; Gavronski et al., 2008;
González-Benito and González-Benito, 2005; Heras-Saizarbitoria and Boiral, 2013;
King et al., 2005; Lagodimos et al., 2007; Marimon et al., 2011; Morrow and
Rondinelli, 2002; Nawrocka et al., 2009; Nishitani, 2010; Potoski and Prakash, 2004;
Prakash and Potoski, 2006; Qi et al., 2011; To et al., 2012a; Viadiu et al., 2006; Vastag,
2004; Zeng et al., 2005). Some researchers focused on motivations for the standard’s
implementation (e.g. Bansal and Bogner, 2002; Bansal and Hunter, 2003; Boiral, 2007;
Chan and Wong, 2006; Gavronski et al., 2008; González-Benito and González-Benito,
2005; Jiang and Bansel, 2003; Morrow and Rondinelli, 2002; Prajogo et al., 2012;
Vastag, 2004), while others offered insights into the standard’s potential benefits (e.g.
Gavronski et al., 2008; Prajogo et al., 2012; Summers Raines, 2002; To et al., 2012b).
One particular research area that has drawn a lot of attention is the diffusion of ISO
14001. A significant body of literature on this research area has been available, offering
insights into ‘how’ ISO 14001 diffuses at the country level (Casadesus et al., 2008;
Delmas, 2002; Lagodimos et al., 2007; Qi et al., 2011), regional level (Delmas, 2002),
and global level (Alburquerque et al., 2007; Corbett and Kirsch, 2001; Nishitani, 2010;
Viadiu et al., 2006). Recently, Heras-Saizarbitoria and Boiral (2013) have performed a
meta-analysis of research articles published between 1995 and 2012 on meta-
management standards including ISO 9001 and ISO 14001. They suggested that future

MANUSCRIP
T
ACCEPTED
ACCEPTED MANUSCRIPT
4
research should be devoted to a number of areas including creation of meta-standards
for global governance, international diffusion of meta-standards, motivations for and
benefits of adoption of meta-standards, and difference in internationalization of meta-
standards, among others.
The insights into the diffusion patterns of ISO 14001 at country, regional and
global levels enable stakeholders of ISO 14001, including ISO Technical Committees,
government accreditation agencies, and certification bodies, to tailor their promotion
and marketing strategies to suit the characteristics of their target markets. On the other
hand, they help researchers forecast the trend and development of ISO 14001 adoption
at various levels, thereby facilitating worldwide sustainability development (Robèrt,
2000). This paper aims at (i) identifying the stages of ISO 14001 diffusion at global,
regional, and country-specific levels, (ii) predicting the future growth of ISO 14001
certification at these levels, and (iii) exploring the spatial-temporal diffusion of ISO
14001 and the relationship between ISO 14001 diffusion and exports.
2. Literature Review
2.1 ISO 14001 environmental management system
In 1987, the World Commission on the Environment and Development of the
United Nations published the report “Our Common Future” in which sustainable
development is defined as the principle of “meeting the needs of the present without
compromising the ability of future generations to meet their own needs” (WCED, 1987;
p.12). The report also calls for new insights into effective environmental management

MANUSCRIP
T
ACCEPTED
ACCEPTED MANUSCRIPT
5
by means of, for example, decision support systems. When the United Nations hosted
the Earth Summit in Rio de Janeiro in 1992, ISO collaborated with the International
Electrotechnical Commission (IEC) on development of environmental standards (ISO,
2012a). A few months later, ISO and the IEC formed a technical committee TC207 to
oversee the development of the environmental management system (Bansal and Bogner,
2002). The ISO 14001 environmental management system was launched in 1996 and
updated in 2000 and 2004.
As stated in the ISO website (ISO, 2012b), an environmental management
system that meets the requirements of ISO 14001:2004 has the following characteristics.
It is a management system (or part of an overall system) that (i) identifies significant
environmental aspects and controls the environmental impacts of an organization’s
activities, products or services; (ii) uses a systematic approach to setting and achieving
environmental objectives and targets and demonstrating that the objectives and targets
are achieved; and (ii) improves an organization’s environmental performance
continually. ISO suggests that the main aim of ISO 14001 provides a framework for a
holistic, strategic approach for an organization for setting its environmental policy,
plans, and actions. ISO 14001 is also applicable to all sizes and types of organizations.
Many researchers (Chan and Wong, 2006; Gavronski et al., 2008; Jiang and
Bansal, 2003; Morrow and Rondinelli, 2002; Prajogo et al., 2012, Summers Raines,
2002; To et al., 2012a; Zeng et al., 2005) focused on motivations for and benefits of
ISO 14001 certification, while (Bansal and Hunter, 2003; Nishitani, 2010; Potoski and
Prakash, 2004; Prakash and Potoski, 2006) tried to explain why organizations in certain
countries adopted this innovation. Potoski and Prakash (2004, 2006) reported that the
adoption rate of ISO 14001 varied between countries. Analyzing raw data from 108

MANUSCRIP
T
ACCEPTED
ACCEPTED MANUSCRIPT
6
countries, they reported that the adoption rate tended to be higher in countries where
trading partners adopted this innovation and consumers wanted mechanisms for
identifying environmentally friendly firms (Prakash and Potoski, 2006). For the lack of
diffusion studies of ISO 14001, Casadesus et al. (2008) used logistic functions to study
the diffusion of ISO 14001 at the global level and in 13 selected countries with datasets
from 1995 to 2005. Casadesus et al. (2008) reported that the global saturation level of
ISO 14001 certificates was 64.6% in 2005 and forecast that the maximum number
would be 160,000. They also argued that by 2008 the saturation level would reach 95%
in most of the 13 selected countries, including Japan, China, and Spain (i.e. countries
with the highest numbers of ISO 14001 certificates at that time). Unfortunately,
Casadesus et al. (2008) underestimated the number of ISO14001 certificates in the
global level as well as in country-specific levels quite significantly because of the lack
of a sufficiently long time series of data – a problem that is not unusual in innovation
diffusion studies (Gatignon et al., 1989). Lagodimos et al. (2007) focused on ISO
14001 certification in Greece and showed that ISO 14001 penetrated more effectively
in the country’s manufacturing sector than services and commerce sectors. Qi et al.
(2011) studied the diffusion of ISO 14001 in China and found that signaling to foreign
customers and community stakeholders had a positive effect on the diffusion. Marimon
et al. (2011) analyzed the same subject and concluded that the diffusion among sectors
tended to be homogenous. Despite the fact that many researchers recognized the
importance of diffusion of ISO14000, studies investigating the details, the stages in
particular, of ISO14000 diffusion at the global, regional, and country-specific levels are
almost unavailable. Consequently, the first question of this study is as follows:

MANUSCRIP
T
ACCEPTED
ACCEPTED MANUSCRIPT
7
Question 1: What are the stages of ISO 14001 diffusion at the global, regional and
country-specific levels?
2.2 Innovation diffusion
The diffusion of innovations has been studied by researchers over the past
decades (Bass, 1969; Fisher and Pry, 1971; Rogers, 2003; Ryan and Gross, 1943).
Rogers (2003) argued that an innovation, such as an idea or an organization practice
perceived as new by other units of adoption, was communicated among members of a
community while non-users might start adopting the innovation in the course of time.
More specifically, the diffusion of an innovation normally followed an S-shaped curve
with an initially slow rate of adoption, followed by a rapid rate of adoption, and leveled
off at the saturation level. Bass (1969) borrowed the ideas from ecology and
epidemiology and showed that the diffusion was governed by the following differential
equation:
( ) ( )[ ] ( )[ ]tFtFqp
dt
tdFtf −×+== 1)( Eq. (1)
where )(tf is the diffusion rate at time t, )(tF the cumulative fraction of adopters at
time t, p the coefficient of innovation and q the coefficient of imitation. By integrating
( )dt
tdFinto Eq. (1) with respect to time, the S-shaped cumulative distribution of
adopters is given as:
MANUSCRIP
T
ACCEPTED
ACCEPTED MANUSCRIPT
8
( )
( ) ( )tqp
tqp
epq
etF +−
+−
+−=
1
1)( Eq. (2)
Fisher and Pry (1971) proposed a simple innovation/technology substitution model as:
( ) ( ) ( )[ ]tFtFrdt
tdF −×= 1 Eq. (3)
where )(tF is the fractional market share of the innovation at time t, and r is a constant
of proportionality. The time scale t may be chosen such that 2
1)( =midtF . By solving Eq.
(3), the fractional market share of the innovation is obtained as follows:
( ) ( )midttretF −−+
=1
1 Eq. (4)
In terms of diffusion of ISO 14001, Eq. (4) is rewritten as
( ) ( )midYeartrsaturation
e
NtN −−+
=1
Eq. (5)
where N(t) is the number of ISO 14001 certificates in a specific year t, Nsaturation is the
saturation level of ISO 14001, r is the growth rate, and Yearmid is the year with the
highest growth.
Norton and Bass (1987) compared Bass’s model and the logistic growth model
shown in Eq. (4) and found that the two models performed almost equally well when

MANUSCRIP
T
ACCEPTED
ACCEPTED MANUSCRIPT
9
fitted to real innovations’ data. The logistic growth model is simple to use and able to
make accurate predictions with modern data on innovation or utility (Yang and
Williams, 2009; Lai and To, 2012), and adoption of organizational practices (Attewell,
1992; Casadesus et al., 2008; Guler et al., 2002; Viadiu et al., 2006). Attewell (1992)
reconceptualized the diffusion of an organizational practice in terms of organizational
learning, skill development and knowledge barriers. He argued that government service
bureaus, consultants, and simplification of the technology could facilitate the diffusion.
Guler et al. (2002) studied the diffusion of ISO 9001 certification in 85 countries
between 1993 and 1998 and argued that the coercive effects of multinational
corporations and government agencies, and competition-based mimicry generated by
role equivalence in trade facilitate the diffusion of ISO 9001 certification. Thus,
globalization has quickened its pace since the 1990s and so has the diffusion of
organizational practices such as ISO 9001 and ISO 14001 (Guler et al., 2002). In this
study, we also applied the logistic growth model as an analysis technique. In order to
update the literature on the recent ISO14000 diffusion, we investigated the following
two research questions,
Question 2: How many organizations will adopt ISO 14001 in future?
Question 3: What was the spatial-temporal diffusion of ISO 14001 between 1998
and 2009 based on the analysis of the logistic growth model?
3. Methodology

MANUSCRIP
T
ACCEPTED
ACCEPTED MANUSCRIPT
10
3.1 Data sources
The number of ISO 14001 certificates issued in each region and country was
obtained from the ISO Survey of Certifications – 2009 (ISO, 2011). The survey
included data on ISO 14001 from 1998 to 2009. The numbers of ISO 14001 certificates
issued in 1996 and 1997 were obtained from the ISO Survey of ISO 9000 and ISO
14000 Certificates – 10th Cycle (ISO, 2000) respectively.
3.2 Data analysis
The data were transferred from an Excel file provided by ISO (ISO, 2011) to a
working file. Non-linear regression was applied using the logistic model as shown in
Eq. (5) and the solution was obtained through minimization of the sum of errors
between the actual data and the fitted data (i.e. the mean error (ME)). The other
measures of errors, including the mean percentage error (MPE) and the mean absolute
percentage error (MAPE), were also adopted to check the overall fit of the logistic
model. The results obtained were checked using nonlinear regression in the SPSS 17.0
statistical package.
4. Results
4.1 Global level

MANUSCRIP
T
ACCEPTED
ACCEPTED MANUSCRIPT
11
According to the data provided by ISO, the total number of ISO 14001
certificates issued by the end of 1996 was 1,491. The total number increased to 13,994
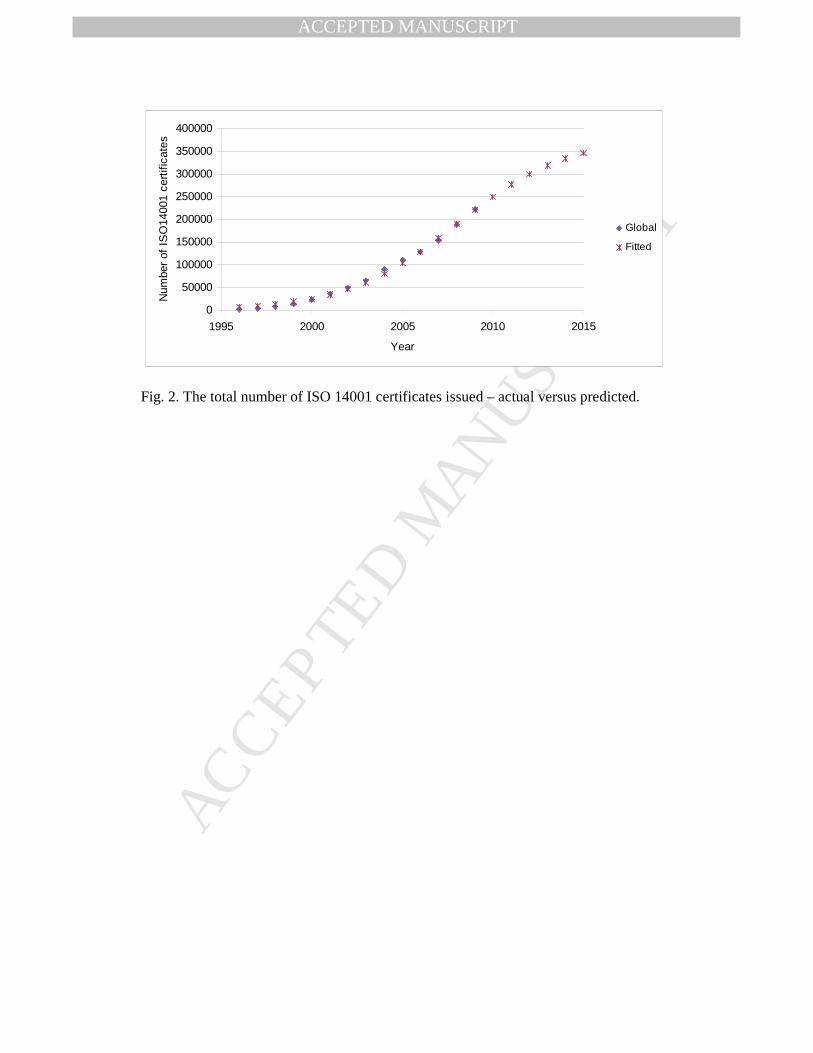
in 1999, 49,440 in 2002, 111,163 in 2005, and 223,149 in 2009. Figure 1 shows the
numbers of ISO 14001 certificates issued worldwide from 1996 to 2009.
“Take in Figure 1”
Figure 1 shows that the growth of ISO 14001 certificates follows an exponential
curve in the beginning but has slowed down since 2008. The total number of ISO
14001 certificates was fitted to a logistic function using nonlinear regression estimation.
The resulting function is given below.
( ) ( )200833.01
379900−−+
=tGlobal e
tN Eq. (6)
where )(tNGlobal is the total number of ISO 14001 certificates issued by the end
of year t, 379900 is the total number of ISO 14001 certificates at the saturation level,
0.33 is the constant, and the middle of growth occurred in 2008 as determined from the
nonlinear algorithm. Figure 2 shows the actual data and the predicted data using Eq. (6).
The R2 between these two series is 0.995 and the mean error (ME) is 12. However,
since the total number of ISO 14001 certificates was 223,149 in 2009, the ME value is
very small. In addition, the mean percentage error (MPE) and the mean absolute
percentage error (MAPE) are 41.3% and 46.8% respectively, which are relatively high
mainly because of the percentage error going from 71.3 to 376.6% in the period 1996 to

MANUSCRIP
T
ACCEPTED
ACCEPTED MANUSCRIPT
12
1998. The high percentage errors are related to the low adoption rates of ISO 14001 in
the early years (i.e. fewer than 10,000 certificates annually). By dismissing these three
years, MPE and MAPE become as low as 0.8% and 7.8% respectively. Overall, these
results suggest that our estimation (Figure 2) could adequately predict the future
ISO14000 diffusion in the global market. According to Figure 2, the number of ISO
14001 certificates will be close to 300,000 in 2012 and 346,000 in 2015.
“Take in Figure 2”
4.2 Regional level
The regional numbers of ISO 14001 certificates issued are also shown in Figure
1. Europe and the Far East have the highest percentages of ISO 14001 adoption. In
2007, the Far East surpassed Europe and has since been the biggest user of ISO 14001
certificates. Similar to the global-level analysis, nonlinear regression estimation was
applied to each region, while the certificate numbers at saturation isaturationN , , the time
constantir , and the middle of growth in year imidYear , of Eq. (7) were determined.
( ) ( )imidi Yeartrisaturation
ie
NtN
,1,
−−+= Eq. (7)
Table 1 shows the values of isaturationN , , ir , and imidYear , for each region. The R2 values
between the actual and predicted time series, the mean error, and the mean percentage
error are also shown in Table 1.
MANUSCRIP
T
ACCEPTED
ACCEPTED MANUSCRIPT
13
“Take in Table 1”
Table 1 shows the growth rates of the analyzed regions. The results suggest that
these countries can be divided into two groups. The first group includes Europe,
Africa/West Asia and the Far East with similar values of r ranging from 0.3 to 0.37. For
example, the number of ISO 14001 certificates issued in Europe is characterized by Eq.
(8).
( ) ( )20083.01157870
−−+=
tEurope etN Eq. (8)
The second group includes Australia/New Zealand, North America and
Central/South America as their growth rates (i.e. values of r) are markedly higher than
those in the first group. It should be noted that the values of R2 of Australia and New
Zealand are relatively low, while their mean error and mean percentage error are
relatively high in comparison with the number of certificates issued. Figures 3 and 4
show the actual and predicted time series of the two groups of regions.
“Take in Figure 3”
“Take in Figure 4”
After determining the growth patterns at the regional level, the total number of
ISO 14001 certificates worldwide was obtained by summing up the contribution from
each region. This bottom-up prediction was then compared with the actual data and the

MANUSCRIP
T
ACCEPTED
ACCEPTED MANUSCRIPT
14
predictions obtained in Section 4.1. The R2 between the actual data and the predicted
values using the regional-level approach is 0.996, and the mean error is 514. The mean
percentage error (MPE) and the mean absolute percentage error (MAPE) are 0.6% and
6.8% respectively for years from 1999 to 2009. The R2 value between the two predicted
time series, the mean percentage difference and the mean absolute percentage
difference are 0.999, 0.5% and 3.6% respectively using the data from 1996 to 2009. In
terms of forecasting, the predicted value for 2012 is 299,810 using Eq. (6) and 320,024
using the regional-level estimates, indicating a 6.7% difference. The predicted value for
2015 is 345,596 using Eq. (6) and 375,449 using the regional-level estimates, indicating
an 8.6% difference. Eventually, the total number of ISO 14001 certificates issued will
be 416,230 using the regional-level approach and 379,900 using the global-level
approach, leading to at least a 70% increase since 2009.
4.3 Country level
The top 30 countries in terms of ISO 14001 certificates in 2009 are shown in
Table 2. The table shows that the top 5 countries were from the Far East and Europe,
namely China, Japan, Spain, Italy and the United Kingdom. There were more than 10
thousand ISO 14001-certified organizations in these countries by the end of 2009. In
fact, China, Japan, Spain and Italy export a wide range of consumer products. The total
number of certificates issued in the top 30 countries was 204,942, accounting for 91.8%
of ISO 14001 certificates issued in 2009.
“Take in Table 2”

MANUSCRIP
T
ACCEPTED
ACCEPTED MANUSCRIPT
15
In order to group these 30 countries by similar growth patterns, pair-wise
correlations between countries in terms of the number of certificates issued from 1996
to 2009 were determined. Three distinct groups are shown in Table 3. It should be
noted that Thailand, Australia and Brazil do not belong to any of these groups and
hardly correlate with each other. In fact, the total number of ISO14001 certificates
dropped significantly between 24 and 62 percent in 2007 in these three countries. The
pattern of ISO 14001 adoption could not be fitted by a logistic curve.
“Take in Table 3”
Figures 5 to 7 show the 12 countries with more than 4,000 ISO 14001
certificates issued by the end of 2009. In Group 1, most of the six countries (i.e. China,
Spain, Italy, Korea, Romania and Czech Republic) have passed their maximum growth
recently but still have relatively high potential to grow in terms of ISO 14001
certificates as shown in Figure 5. In fact, Group 1 includes most of the major export-
oriented countries in the global market. In Group 2, three developed countries (i.e.
Japan, the United Kingdom and France) reached their maximum growth in 2006 or
2008 but their growth rates of ISO 14001 certificates will sustain in the near future. The
same goes for most of the other countries in this group, including Switzerland, Hungary,
Poland and Austria. Group 2 mostly consists of developed European countries while
Poland, Austria and Hungary have focused on heavy industry in recent years. In Group
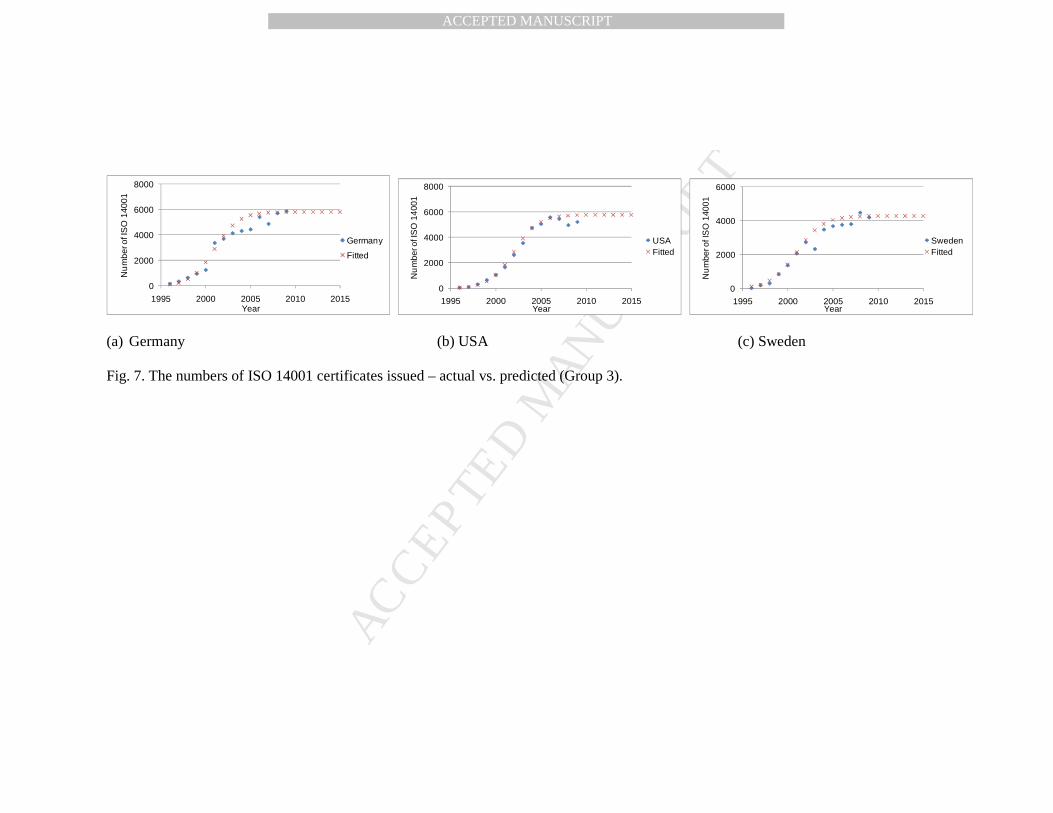
3, organizations in three developed countries, including Germany, the USA and
Sweden, have adopted ISO 14001 widely and their numbers of ISO 14001 certificates
MANUSCRIP
T
ACCEPTED
ACCEPTED MANUSCRIPT
16
have saturated at 5,800, 5,800 and 4,300 respectively. A similar situation happened in
most of the other developed countries in the group, such as the Netherlands, Canada,
Finland and Denmark.
“Take in Figure 5”
“Take in Figure 6”
“Take in Figure 7”
Table 4 shows the projected saturation level, the rate of growth, the year of
maximum growth and the correlation between fitted data and actual data of each
country with more than 4,000 ISO 14001 certificates issued by the end of 2009. It is
observed that these 3 groups had very different growth rates and the logistic curve
generally reproduced accurate actual data.
“Take in Table 4”
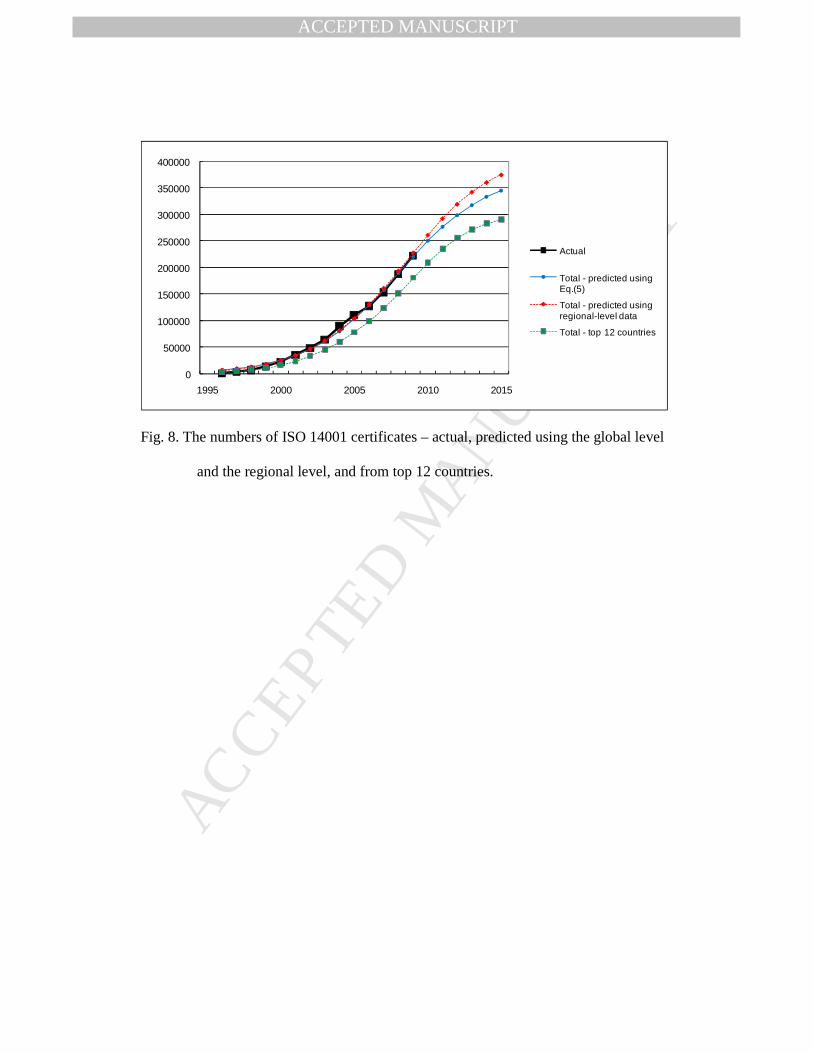
After determining the growth patterns at the country level, the total numbers of
ISO 14001 certificates in the top 12 countries, accounting for 81.2% of ISO certificates
issued in 2009 (Figures 5-7), were obtained by summing up the contribution from each
country. This bottom-up prediction was then compared with the actual data and the
predictions obtained in Sections 4.1 and 4.2 (Figure 8). In fact, the total number of ISO
14001 certificates issued in these 12 countries will account for 76% of the total number
of ISO 14001 certificates issued in 2015 based on the projection by the global model.

MANUSCRIP
T
ACCEPTED
ACCEPTED MANUSCRIPT
17
China alone will contribute to 30% in 2015 in comparison with 55,316 certificates
issued in 2009, accounting for 25% of the total number, which was 223,149.
“Take in Figure 8”
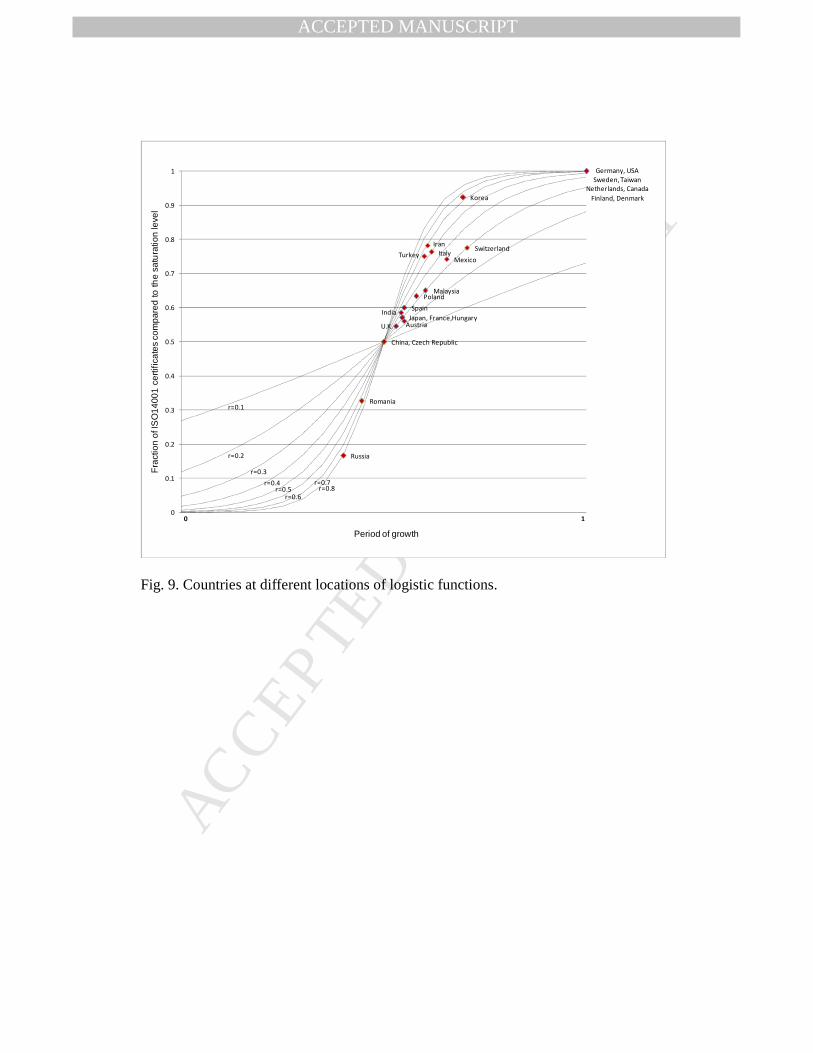
By normalizing the number of ISO 14001 certificates to the projected number at
saturation, the top 30 countries in Table 2 (excluding Thailand, Australia and Brazil)
are plotted in Figure 9. It can be observed that most of the countries passed the
maximum growth (except Romania and Russia) and had a medium growth rate of r=0.3
to 0.7.
“Take in Figure 9”
Rogers (2003) proposed that innovation adopters could be broadly categorized
into innovators (the first 2.5%), early adopters (the second 13.5%), early majorities (the
third 34%), late majorities (the next 34%), and laggards (the final 16%) based on the
percentage of an area under the first derivative of the logistic function. Hence,
Germany, the Netherlands, Finland, Denmark, the USA, Canada and Taiwan, are
considered innovators as shown in Figure 9. The figure also shows that the early
adopters were Korea and Switzerland, the early majorities were Italy, Iran, Turkey,
Mexico, Malaysia, Poland, Spain, India, Japan, France, Hungary, Austria and the UK,
and the late majorities were China, Czech Republic, Romania, and Russia. None of the
top 30 countries were laggards as most laggards are developing countries.

MANUSCRIP
T
ACCEPTED
ACCEPTED MANUSCRIPT
18
4.4. Accuracy of logistic models
The models developed above were checked using the data obtained from the
summary of the ISO Survey of Certifications – 2010 (ISO, 2012c). At the global level,
Eq. (6) predicted that the number of ISO 14001 certificates would reach 250,453 by the
end of 2010, which was 519 (or 0.21%) less than the actual number (250,972) reported
by ISO (2012).
At the regional level, the logistic models using the coefficients in Table 1
predicted that the number of ISO 14001 certificates would be 9,820 for Africa/West
Asia, 4,334 for Central/South America, 7,811 for North America, 101,930 for Europe,
135,645 for the Far East, and 2,199 for Australia/New Zealand, while the actual
numbers in these regions were 8,557, 6,423, 6,302, 103,126, 124,922, and 1,642
respectively in 2010 as reported by ISO (2012). The percentage errors ranged from
1.16% for Europe to -33.91% for Australia/New Zealand. If the aggregated values were
used, the predicted global number of ISO 14001 certificates was 261,739 which was
10,767 (or 4.29%) more than the actual number in 2010.
At the country-specific level, the top 10 countries in terms of ISO 14001
certificates in 2010 were China, Japan, Spain, Italy, the UK, Korea, Romania, Czech
Republic, Germany and Sweden. The predicted numbers of ISO 14001 certificates
using the coefficients in Table 4 are shown in Table 5, as well as the actual numbers. It
is found that the percentage errors ranged from -1.88% for China to 24.77% for
Romania. If the sum of these numbers was used, the predicted number of the total ISO
14001 certificates for the top 10 countries was 189,477 in 2010, which was 569 (or
0.30%) more than the actual sum of 188,908.

MANUSCRIP
T
ACCEPTED
ACCEPTED MANUSCRIPT
19
“Take in Table 5”
The above analyses illustrate that the logistic function obtained in Eq. (6)
accurately predicted the number of ISO 14001 certificates in 2010 at the global level.
At the regional level, the coefficients shown in Table 1 accurately predicted the
numbers of ISO 14001 certificates in 2010 for Europe and the Far East with 2.33 and -
6.53 percentage errors respectively. However, the differences between the predicted
and actual numbers in 2010 for the other regions were quite large in percentage terms,
ranging from 17.90 to 33.90 percentage error. At the country-specific level, the
coefficients obtained in Table 4 predicted the number of ISO 14001 certificates in 2010
for the top 10 countries with 1.88 to 24.77 percentage error.
5. Spatial-temporal Diffusion of ISO 14001
Past research (Potoski and Prakash, 2004, 2006) showed that globalization
promoted the diffusion of ISO 14001 via trade linkages. Looking back at the
development of world trade in the past fifteen years, we observed that organizations in
North American and West European countries adopted ISO 14001 much earlier than
those in other parts of the world in the mid 90s. However, as world trade expanded
rapidly through global supply chains, trading partners of the West in the Far East
started adopting ISO 14001 in the early 2000s. Recently, global supply chains have
extended to countries in South America and Euro-Asia.

MANUSCRIP
T
ACCEPTED
ACCEPTED MANUSCRIPT
20
Figure 10 shows the spatial-temporal plots of ISO 14001 adoption based on the
ISO data in 1997, 2001, 2005 and 2009, indicating that only the UK and Japan had
more than 500 ISO 14001-certified organizations by the end of 1997, and 17 countries,
including 10 EU countries, Canada, the USA, Australia, Japan, Korea, China and
Taiwan had more than 500 ISO 14001-certified organizations by the end of 2001. The
number of countries with more than 500 ISO 14001-certified organizations increased to
29 and Japan had the largest number of organizations at 23,466 by the end of 2005. The
number of countries with more than 500 ISO 14001-certified organizations further
increased to 48 and China was the country with the largest number at 55,316 by the end
of 2009.
“Take in Figure 10”
To substantiate the linkage between ISO 14001 and cross-country trading, we
carried out a post-hoc analysis of the association between the number of ISO 14001
certificates and the statistical data on international trade from the World Trade
Organization (WTO, 2010), and the plot of the number of ISO 14001 certificates
against export volumes in 2001, 2005, and 2009 was produced. Figure 11 shows that
there is a relationship between these two variables (R = 0.686, p <0.01 for 2001 and
2005; R = 0.537, p <0.01 for 2009), thereby confirming the linkage between ISO 14001
adoption and international trading. However, the linkage between ISO 14001 and
international trading becomes less significant when the number of ISO 14001
certificates increases, suggesting that competition-based mimicry (Guler et al. 2002)
diminishes when the adoption of ISO 14001 reaches the final stage.

MANUSCRIP
T
ACCEPTED
ACCEPTED MANUSCRIPT
21
“Take in Figure 11”
6. Discussions and Conclusion
The findings of the study illustrate that the diffusion of ISO 14001 closely
resembles a logistic function and the number of ISO 14001 certificates tends to saturate
at 379,900 worldwide, representing a 51.5% increase from 250,972 by the end of 2010.
Eq. (6) shows that there would be an increase of 50,000 certificates each in 2011 and
2012 and the increase in 45,800 certificates from the beginning of 2013 to the end of
2015. The biggest number of new ISO 14001 certificates issued will be in the Far East,
followed by Europe and Africa/West Asia.
The study contributes to the understanding of how the environmental
management practice (i.e. ISO 14001) has diffused worldwide. New ideas and practices
are normally adopted by organizations in developed countries which have more
resources. Through the close collaboration among firms in cross-country supply chains,
ISO 14001 has diffused from developed countries to major exporting countries, mostly
located in the Far East. In recent years, as globalization evolves more rapidly, emerging
nations such as Brazil, Russia, India and some Middle East and African countries start
promoting ISO 14001 nationwide to increase their organizations’ competitiveness.
Nevertheless, it should be noted that the logistic model did not apply to Australia,
Thailand, and Brazil that experienced a significant drop after 2006. This is disturbing
because, Brazil and Thailand were considered early adopters of ISO 14001, and now
they seem to be "early abandoners". There could be some events (e.g., pollution

MANUSCRIP
T
ACCEPTED
ACCEPTED MANUSCRIPT
22
problems caused by certain well-known ISO 14001 certified firms) occurred in these
countries, that triggered their firms to question the effectiveness of ISO 14000. Future
research needs to be carried out to study this specific phenomenon.
The logistic functions developed in the present study have significant
implications for national bodies and certification companies. National bodies can
review the development of ISO 14001 in their own countries and assist organizations in
extending the scope of environmental certification beyond the organizational level and
to the process and product levels. For instance, relevant approaches, such as energy
management, life cycle assessment and eco-labeling, can be applied to different
process- and product-level activities. For certification companies, the findings of the
study enable them to better allocate resources to different regions for training and
certification purposes, and to explore the opportunities in countries in the categories of
late majorities and laggards.
With regard to the implications for organizations, our results suggest that ISO
14001 is a highly popular management standard for firms of both developed and
developing countries. While ISO 14001 requires certified firms to establish
environmental objectives and goals, many firms simply look at electricity savings, less
paper and water consumption, and reduction in pollutant emissions as environmental
goals. On the other hand, stakeholders, such as customers and governments, tend to
have high expectations of the scopes and levels of environmental practices adopted by
organizations. However, it is quite possible that an organization might shift its
environmental burden from one area to another unless a holistic approach, such as life
cycle analysis, is adopted (Shrivastava, 1995; To et al., 2012b).

MANUSCRIP
T
ACCEPTED
ACCEPTED MANUSCRIPT
23
The correlation analysis between the number of ISO 14001 certificates and
export volumes in three discrete time periods, namely 2001, 2005, and 2009, indicates
that there is a significant linkage between ISO 14001 adoption and international trading.
The results show that the strength of the relationship weakens when the adoption of
ISO 14001 reaches a more mature stage. The finding also indicated that geographic
distance may not be an issue in innovation diffusion, in particular with the advent of
information and communication technology. Nevertheless, one should note that the
models presented in this paper should be used to explain ‘how’ and predict ‘how far’
the diffusion would proceed. The drivers and enablers of, and motivations for the
diffusion need to be further explored.
Acknowledgments
The authors gratefully acknowledge the constructive comments given by anonymous
reviewers and the Subject Editor, whose suggestions helped improve the quality of the
paper substantially.
References
Albuquerque, P., Bronnenberg, B.J., Corbett, C.J., 2007. A spatiotemporal analysis of
the global diffusion of ISO 9000 and ISO 14000 certification. Management
science 53(3), 451-468.
Attewell, P., 1992. Technology diffusion and organizational learning: The case of
business computing. Organization Science 3(1), 1-19.

MANUSCRIP
T
ACCEPTED
ACCEPTED MANUSCRIPT
24
Bansal, P., Bogner, W.C., 2002. Deciding on ISO 14001: economics, institutions, and
context. Long Range Planning 35 (3), 269-290.
Bansal, P., Hunter, T., 2003. Strategic explanations for the early adoption of ISO 14001.
Journal of Business Ethics 46 (3), 289-299.
Bass, F.M., 1969. A new-product growth model for consumer durables. Management
Science 15 (5), 215-227.
Boiral, O., 2007. Corporate greening through ISO 14001: a rational myth? Organization
Science 18(1), 127-146.
Casadesus, M., Marimon, F., Heras, I., 2008. ISO 14001 diffusion after the success of
the ISO 9001 model. Journal of Cleaner Production 16 (16), 1741-1754.
Chan, E.S.W., Wong, S.C.K., 2006. Motivations for ISO 14001 in the hotel industry.
Tourism Management 27 (3), 481-492.
Corbett, C.J., Kirsch, D.A., 2001. International diffusion of ISO 14000 certification.
Production and Operations Management 10(3), 327-342.
Delmas, M.A., 2001. Stakeholders and competitive advantage: the case of ISO 14001.
Production and Operations Management 10(3), 343-358.
Delmas, M.A., 2002. The diffusion of environmental management standards in Europe
and in the United States: an institutional perspective. Policy Sciences 35(1), 91-
119.
Fisher, J.C., Pry, R.H., 1971. A simple substitution model of technological change.
Technological Forecasting and Social Change 3 (March), 75-88.
Gatignon, H., Eliashberg, J., Robertson, T.S. 1989. Modeling multinational diffusion
patterns: an efficient methodology. Marketing Science 8(3), 231-247.

MANUSCRIP
T
ACCEPTED
ACCEPTED MANUSCRIPT
25
Gavronski, I., Ferrer, G., Paiva, E.L., 2008. ISO 14001 certification in Brazil:
motivations and benefits. Journal of Cleaner Production 16 (1), 87-94.
González-Benito, J., González-Benito, O., 2005. An analysis of the relationship
between environmental motivations and ISO14001 certification. British Journal
of Management 16(2), 133-148.
Guler, I., Guillén, M.F., Macpherson, J.M., 2002. Global competition, institutions, and
the diffusion of organizational practices: the international spread of ISO 9000
quality certificates. Administrative Science Quarterly 47(2), 207-232.
Heras-Saizarbitoria, I., Boiral, O., 2013. ISO 9001 and ISO 14001: towards a research
agenda on management system standards. International Journal of Management
Reviews 15(1), 47-65.
ISO, 2000. The ISO Survey of ISO 9000 and ISO 14000 Certificates - 10th Cycle. The
International Organization for Standardization.
ISO, 2011. The ISO Survey of Certifications – 2009. The International Organization for
Standardization.
ISO, 2012a. Environmental Management - The ISO 14000 family of International
Standards. Available at http://www.iso.org/iso/theiso14000family_2009.pdf .
ISO, 2012b. ISO 14000 - Environmental Management. Available at
http://www.iso.org/iso/iso14000 .
ISO, 2012c. ISO Survey 2010 – Principal Findings. Available at
http://www.iso.org/iso/iso-survey2010.pdf .
Jiang, J.R., Bansal, P., 2003. Seeing the need for ISO 14001. Journal of Management
Studies 40 (4), 1047-1067.

MANUSCRIP
T
ACCEPTED
ACCEPTED MANUSCRIPT
26
Katz, E., Levin, M.L., Hamilton, H., 1963. Traditions of research on the diffusion of
innovation. American Sociology Review 28 (2), 237-252.
King, A.A., Lenox, M.J., Terlaak, A., 2005. The strategic use of decentralized
institutions: exploring certification with the ISO 14001 management standard.
Academy of Management Journal 48(6), 1091-1106.
Lai, L.S.L., To, W.M., 2012. The economic and social implications of Internet
diffusion trend in China. IT Professional 14 (6), 16-21.
Lagodimos, A.G., Chountalas, P.T., Chatzi, K., 2007. The state of ISO 14001
certification in Greece. Journal of Cleaner Production 15 (18), 1743-1754.
Marimon, F., Llach, J, Bernardo, M. 2011. Comparative analysis of diffusion of the
ISO 14001 standard by sector of activity. Journal of Cleaner Production 19 (15),
1734-1744.
Morrow, D., Rondinelli, D., 2002. Adopting corporate environmental management
systems: motivations and results of ISO 14001 and EMAS certification.
European Management Journal 20 (2), 159-171.
Nawrocka, D., Brorson, T., Lindhqvist, T., 2009. ISO 14001 in environmental supply
chain practices. Journal of Cleaner Production 17 (16), 1435-1443.
Nishitani, K., 2010. Demand for ISO 14001 adoption in the global supply chain: an
empirical analysis focusing on environmentally conscious markets. Resource
and Energy Economics 32 (3), 395-407.
Norton, J.A., Bass, F.M., 1987. A diffusion theory model of adoption and substitution
for successive generations of high-technology products. Management Science
33 (9), 1069-1086.

MANUSCRIP
T
ACCEPTED
ACCEPTED MANUSCRIPT
27
Prajogo, D., Tang, A.K.Y., Lai, K.H., 2012. Do firms get what they want from ISO
14001 adoption?: an Australian perspective. Journal of Cleaner Production 33,
117-126.
Potoski, M., Prakash, A., 2004. Regulatory convergence in nongovernmental regimes?
Cross-national adoption of ISO 14001 certifications. Journal of Politics 66 (3),
885-905.
Prakash, A., Potoski, M., 2006. Racing to the bottom? Trade, environmental
governance, and ISO 14001. American Journal of Political Science 50 (2), 350-
364.
Qi, G.Y., Zeng, S.X., Tam, C.M., Yin, H.T., Wu, J.F., Dai, Z.H., 2011. Diffusion of
ISO 14001 environmental management systems in China: rethinking on
stakeholders’ roles. Journal of Cleaner Production 19 (11), 1250-1256.
Robèrt, K.H., 2000. Tools and concepts for sustainable development, how do they
relate to a general framework for sustainable development, and to each other?
Journal of Cleaner Production 8(3), 243-254.
Rogers, E.M., 2003. Diffusion of Innovation, 5th edition, New York: Free Press.
Ryan, B., Gross, N.C., 1943. The diffusion of hybrid seed corn in two Iowa
communities. Rural Sociology 13, 15-24.
Shrivastava, P., 1995. Environmental technologies and competitive advantage.
Strategic Management Journal 16(S1), 183-200.
Summers Raines, S., 2002. Implementing ISO 14001 - an international survey
assessing the benefits of certification. Corporate Environmental Strategy 9 (4),
418-426.

MANUSCRIP
T
ACCEPTED
ACCEPTED MANUSCRIPT
28
To, W.M., Lee, P.K.C., Yu, B.T.W., 2012a. Benefits of implementing management
system standards – a case study of certified companies in the Pearl River Delta,
China. TQM Journal 24 (1), 17-28.
To, W.M., Lai, T.M., Lo, W.C., Lam, H.K., Chung, W.L., 2012b. The growth pattern
and fuel life cycle analysis of the electricity consumption of Hong Kong.
Environmental Pollution 165, 1-10.
Vastag, G., 2004. Revisiting ISO 14000 diffusion: a new “look” at the drivers of
certification. Production and Operations Management 13(3), 260-267.
Viadiu, F.M., Fa, M.C., Saizarbitoria, I.H., 2006. ISO 9000 and ISO 14000 standards:
an international diffusion model. International Journal of Operations &
Production Management 26(2), 141-165.
WCED, 1987. Our Common Future. The United Nations World Commission on the
Environment and Development.
WTO, 2010. International Trade Statistics – 2011. World Trade Organization.
Available at:
http://www.wto.org/english/res_e/statis_e/its2010_e/its10_toc_e.htm .
Yang, Y., Williams, E., 2009. Logistic model-based forecast of sales and generation of
obsolete computers in the U.S. Technological Forecasting and Social Change 76
(8),1105-1114.
Zeng, S.X., Tam, C.M., Tam, V.W.Y., Deng, Z.M., 2005. Towards implementation of
ISO 14001 environmental management systems in selected industries in China.
Journal of Cleaner Production 13(7), 645-656.

MANUSCRIP
T
ACCEPTED
ACCEPTED MANUSCRIPT
Figure captions
Fig. 1. The number of ISO 14001 certificates issued from 1996 to 2009.
Fig. 2. The total number of ISO 14001 certificates issued – actual versus predicted.
Fig. 3. The numbers of ISO 14001 certificates issued – actual vs. predicted.
Fig. 4. The numbers of ISO 14001 certificates issued – actual vs. predicted.
Fig. 5. The numbers of ISO 14001 certificates issued – actual vs. predicted (Group 1).
Fig. 6. The numbers of ISO 14001 certificates issued – actual vs. predicted (Group 2).
Fig. 7. The numbers of ISO 14001 certificates issued – actual vs. predicted (Group 3).
Fig. 8. The numbers of ISO 14001 certificates – actual, predicted using the global level
and the regional level, and from top 12 countries.
Fig. 9. Countries at different locations of logistic functions.
Fig. 10. Countries had more than 500 ISO 14001 certificates in 1997, 2001, 2005, and
2009 respectively.
Fig. 11. The number of ISO 14001 certificates vs. export volumes in 2001, 2005, and 2009.

MANUSCRIP
T
ACCEPTED
ACCEPTED MANUSCRIPT
Table 1. Coefficients of Eq. (7) and accuracy of predicted models.
Coefficients Accuracy (from 1999 to 2009) Region isaturationN ,
ir
imidYear , R2 Mean Error Mean Percent Error
Europe 157870 0.3 2008 0.995 1 -3.2
North America 7840 0.7 2002 0.992 -1 -1.9
Australia / New Zealand 2200 0.75 2000 0.749 348 28.5
Central / South America 4380 0.65 2003 0.979 1 4.7
Africa / West Asia 14600 0.36 2008 0.996 -1 9.1
Far East 229340 0.37 2009 0.995 1 -0.5

MANUSCRIP
T
ACCEPTED
ACCEPTED MANUSCRIPT
Table 2. Top 30 countries in terms of ISO 14001 certificates in 2009.
Country Number of
ISO 14001
certificates
(2009)
Region Exports
US billion
in 2009
(ranking)
Country Number of
ISO 14001
certificates
(2009)
Region Exports
US billion
in 2009
(ranking)
China
Japan
Spain
Italy
United Kingdom
Korea
Romania
Germany
USA
Czech Republic
France
Sweden
India
Turkey
Switzerland
55316
39556
16527
14542
10912
7843
6863
5865
5225
4684
4678
4193
3799
2337
2324
Far East
Far East
Europe
Europe
Europe
Far East
Europe
Europe
North Am
Europe
Europe
Europe
West Asia
Europe
Europe
1202 (1)
581 (4)
219 (16)
406 (7)
352 (10)
364 (9)
41 (50)
1126 (2)
1056 (3)
113 (32)
4785 (6)
131 (28)
163 (21)
102 (33)
173 (20)
Taiwan
Thailand
Hungary
Russia
Poland
Australia
Brazil
Netherlands
Malaysia
Canada
Iran
Finland
Denmark
Austria
Mexico
2204
1864
1659
1503
1500
1432
1327
1326
1281
1221
1118
1107
947
919
870
Far East
Far East
Europe
Europe
Europe
Australia
South Am
Europe
Far East
North Am
West Asia
Europe
Europe
Europe
North Am
204 (17)
152 (25)
84 (35)
303 (13)
134 (27)
154 (23)
153 (24)
496 (5)
157 (22)
317 (12)
78 (36)
63 (37)
93 (34)
138 (26)
230 (15)

MANUSCRIP
T
ACCEPTED
ACCEPTED MANUSCRIPT
Table 3. Grouping of 30 countries by similarity of growth patterns.
Group 1 Group 2 Group 3
China
Spain
Italy
Korea
Romania
Czech Republic
India
Turkey
Russia
Malaysia
Iran
55316
16527
14542
7843
6863
4684
3799
2337
1503
1281
1118
Far East
Europe
Europe
Far East
Europe
Europe
West Asia
Europe
Europe
Far East
West Asia
Japan
United Kingdom
France
Switzerland
Hungary
Poland
Austria
Mexico
39556
10912
4678
2324
1659
1500
919
870
Far East
Europe
Europe
Europe
Europe
Europe
Europe
North Am
Germany
USA
Sweden
Taiwan
Netherlands
Canada
Finland
Denmark
5865
4684
4193
2204
1326
1221
1107
947
Europe
North Am
Europe
Far East
Europe
North Am
Europe
Europe
Note: Thailand, Australia, and Brazil do not belong to any of the above groups and do not form a group.

MANUSCRIP
T
ACCEPTED
ACCEPTED MANUSCRIPT
Table 4. The projected saturation level, the rate of growth, the year of the maximum
growth, and the correlation between fitted data and actual data.
Coefficients Accuracy iSaturationN ,
ri imidYear , R
Number of ISO 14001
certificates in 2009
Group 1
China
Spain
Italy
Korea
Romania
Czech Republic
Group 2
Japan
United Kingdom
France
Group 3
Germany
USA
Sweden
110000
22000
19000
8500
13500
9300
50000
20000
8200
5800
5800
4300
0.5
0.45
0.5
0.65
0.78
0.45
0.33
0.28
0.30
0.75
0.75
0.7
2009
2006
2006
2005
2009
2009
2006
2008
2008
2001
2002
2001
0.999
0.997
0.998
0.995
0.999
0.983
0.993
0.975
0.961
0.982
0.996
0.983
55316
16257
14542
7843
6863
4684
39556
10912
4678
5865
5225
4197

MANUSCRIP
T
ACCEPTED
ACCEPTED MANUSCRIPT
Table 5. Top 10 countries in terms of ISO 14001 certificates in 2010 with predicted
numbers.
Top 10 countries in
terms of ISO 14001 in
2010
Numbers of ISO 14001
certificates
Predicted numbers using the
coefficients given in Table 4
Error in percent
China
Japan
Spain
Italy
UK
Korea
Romania
Czech Republic
Germany
Sweden
Sum:
69784
35016
18347
17064
14346
9681
7418
6629
6001
4622
188908
68471
39459
18879
16735
12729
8183
9257
5679
5793
4292
191468
-1.88%
12.69%
2.90%
-1.93%
-11.27%
-15.47%
24.77%
-14.33%
3.46%
-7.14%
569 (0.30%)

MANUSCRIP
T
ACCEPTED
ACCEPTED MANUSCRIPT
0
50000
100000
150000
200000
250000
1995 1996 1997 1998 1999 2000 2001 2002 2003 2004 2005 2006 2007 2008 2009
Year
Num
ber
of I
SO
1400
1 ce
rtifi
cate
s
Far East
Africa / West Asia
Central / South America
Australia / New Zealand
North America
Europe
Fig. 1. The number of ISO 14001 certificates issued from 1996 to 2009.
MANUSCRIP
T
ACCEPTED
ACCEPTED MANUSCRIPT
0
50000
100000
150000
200000
250000
300000
350000
400000
1995 2000 2005 2010 2015
Year
Num
ber
of I
SO
1400
1 ce
rtifi
cate
s
Global
Fitted
Fig. 2. The total number of ISO 14001 certificates issued – actual versus predicted.

MANUSCRIP
T
ACCEPTED
ACCEPTED MANUSCRIPT
0200004000060000
80000100000120000140000160000
1995 2000 2005 2010 2015
Num
ber o
f IS
O 1
4001
ce
rtifi
cate
s
Year
Europe
Fitted
0
2000
4000
6000
8000
10000
12000
14000
16000
1995 2000 2005 2010 2015
Num
ber o
f IS
O 1
4001
ce
rtifi
cate
s
Year
Africa/West AsiaFiited
0
50000
100000
150000
200000
250000
1995 2000 2005 2010 2015
Nu
mb
er o
f IS
O 1
400
1 ce
rtifi
cate
s
Year
Far East
Fitted
(a) Europe (b) Africa/West Asia (c) Far East
Fig. 3. The numbers of ISO 14001 certificates issued – actual vs. predicted.

MANUSCRIP
T
ACCEPTED
ACCEPTED MANUSCRIPT
0100020003000400050006000700080009000
1995 2000 2005 2010 2015
Num
ber o
f IS
O 1
4001
ce
rtifi
cate
s
Year
North America
Fitted
0
500
1000
1500
2000
2500
1995 2000 2005 2010 2015
Nu
mb
er o
f IS
O 1
400
1
cert
ifica
tes
Year
Australia/ New Zealand
Fitted
0500
100015002000250030003500400045005000
1995 2000 2005 2010 2015
Nu
mb
er o
f IS
O 1
40
01
cert
ifica
tes
Year
Central/South America
Fitted
(a) North America (b) Australia/New Zealand (c) Central/South America
Fig. 4. The numbers of ISO 14001 certificates issued – actual vs. predicted.

MANUSCRIP
T
ACCEPTED
ACCEPTED MANUSCRIPT
0
20000
40000
60000
80000
100000
120000
1995 2000 2005 2010 2015
Nu
mbe
r of I
SO
140
01
Year
China
Fitted
0
5000
10000
15000
20000
25000
30000
1995 2000 2005 2010 2015
Nu
mbe
r of I
SO
140
01
Year
SpainFitted
0
5000
10000
15000
20000
25000
30000
1995 2000 2005 2010 2015
Nu
mbe
r of I
SO
140
01
Year
ItalyFitted
(a) China (b) Spain (c) Italy
0
2000
4000
6000
8000
10000
1995 2000 2005 2010 2015
Nu
mbe
r of S
O 1
4001
Year
KoreaFitted
0
5000
10000
15000
20000
25000
1995 2000 2005 2010 2015
Nu
mbe
r of I
SO
140
01
Year
Romania
Fitted
0
2000
4000
6000
8000
10000
1995 2000 2005 2010 2015
Nu
mb
er o
f IS
O 1
400
1
Year
Czech RepFitted
(d) Korea (e) Romania (f) Czech Republic
Fig. 5. The numbers of ISO 14001 certificates issued – actual vs. predicted (Group 1).

MANUSCRIP
T
ACCEPTED
ACCEPTED MANUSCRIPT
0
20000
40000
60000
80000
1995 2000 2005 2010 2015
Nu
mbe
r of I
SO
140
01
Year
JapanFitted
0
5000
10000
15000
20000
1995 2000 2005 2010 2015
Nu
mbe
r of I
SO
140
01
Year
UKFitted
0
2000
4000
6000
8000
1995 2000 2005 2010 2015
Nu
mbe
r of I
SO
140
01
Year
FranceFitted
(a) Japan (b) United Kingdom (c) France
Fig. 6. The numbers of ISO 14001 certificates issued – actual vs. predicted (Group 2).
MANUSCRIP
T
ACCEPTED
ACCEPTED MANUSCRIPT
0
2000
4000
6000
8000
1995 2000 2005 2010 2015
Nu
mbe
r of I
SO
140
01
Year
Germany
Fitted
0
2000
4000
6000
8000
1995 2000 2005 2010 2015
Nu
mbe
r of I
SO
140
01
Year
USAFitted
0
2000
4000
6000
1995 2000 2005 2010 2015
Nu
mbe
r of I
SO
140
01
Year
SwedenFitted
(a) Germany (b) USA (c) Sweden
Fig. 7. The numbers of ISO 14001 certificates issued – actual vs. predicted (Group 3).
MANUSCRIP
T
ACCEPTED
ACCEPTED MANUSCRIPT
0
50000
100000
150000
200000
250000
300000
350000
400000
1995 2000 2005 2010 2015
Actual
Total - predicted using Eq.(5)
Total - predicted using regional-level data
Total - top 12 countries
Fig. 8. The numbers of ISO 14001 certificates – actual, predicted using the global level
and the regional level, and from top 12 countries.
MANUSCRIP
T
ACCEPTED
ACCEPTED MANUSCRIPT
China, Czech Republic
Japan, France,Hungary
Spain
Italy
U.K.
Korea
Romania
Germany, USA
Sweden, Taiwan
Netherlands, Canada
Finland, Denmark
India
TurkeySwitzerland
Russia
PolandMalaysia
Iran
Austria
Mexico
r=0.1
r=0.2
r=0.3
r=0.4r=0.5
r=0.6
r=0.7r=0.8
0
0.1
0.2
0.3
0.4
0.5
0.6
0.7
0.8
0.9
1
Fra
ctio
n o
f IS
O14
001
certi
ficat
es c
ompa
red
to th
e sa
tura
tion
leve
l
0 1
Period of growth
Fig. 9. Countries at different locations of logistic functions.

MANUSCRIP
T
ACCEPTED
ACCEPTED MANUSCRIPT
(a) 1997 – Only Japan and U.K. (b) 2001 – West European countries, Far East, Australia, North America
(c) 2005 – West European countries, Asia, Australia, North & South America (d) 2009 – EuroAsia countries, Australia, North & South America, Middle East Notes: 500-999 1000-1999 2000-3999 4000-7999 8000-15999 16000-31999 32000 and above Fig. 10. Countries had more than 500 ISO 14001 certificates in 1997, 2001, 2005 and 2009 respectively.

MANUSCRIP
T
ACCEPTED
ACCEPTED MANUSCRIPT
y = 21.90x0.74
R² = 0.47
100
1,000
10,000
10 100 1,000Nu
mbe
r of I
SO
1400
1 ce
rtific
ates
(200
1)
Exports in USD billion (2001)
y = 38.39x0.76
R² = 0.47
100
1000
10000
100000
10 100 1000 10000Nu
mbe
r of I
SO
1400
1 ce
rtific
ates
(200
5)Exports in USD billion (2005)
y = 81.75x0.69
R2 = 0.29
100
1000
10000
100000
10 100 1000 10000Nu
mbe
r of I
SO
1400
1 ce
rtific
ates
(200
9)
Exports in USD billion (2009)
Fig. 11. The number of ISO 14001 certificates vs. export volumes for 2001, 2005, and 2009.

MANUSCRIP
T
ACCEPTED
ACCEPTED MANUSCRIPT
The growth of ISO 14001 worldwide resembles a logistic function closely. There is a sustained growth of ISO 14001 in the Far East and European Regions. A significant relationship exists between the number of ISO 14001 and export. Spatial-temporal analysis shows that the diffusion of ISO14001 was from west to east.