different skills? identifying differentially effective ... · if there are skills specific to...
TRANSCRIPT

Different Skills? Identifying Differentially Effective Teachers
of English Language Learners
Benjamin Master ([email protected])
Susanna Loeb ([email protected])
Camille Whitney ([email protected])
Stanford University
James Wyckoff ([email protected])
University of Virginia
DIFFERENT SKILLS
1
Nationwide, students designated as English language learners (ELLs) face a substantial academic
achievement gap. Nearly three times as many (72 percent) score “below basic” on the 8th grade
National Assessment of Education Progress (NAEP) math exam compared to the national average
(U.S. Department of Education, 2011). Many educators have suggested that developing teachers’
skills in areas specific to ELL instruction is a critical lever for reducing this achievement gap (Bunch,
2010; Bunch, Aguirre & Téllez., 2009; Casteel & Ballantyne, 2010; García, Arias, Murri, & Serna,
2010; Lucas, Villegas, & Freedson-Gonzalez, 2008). However, the available evidence base to test this
assertion is sparse. Are the characteristics that identify effective teachers for non-ELL students the
same as those for ELL students, or are there skills that make some teachers differentially effective
with ELLs? If there are skills specific to teaching ELLs, are these skills learned or are they a
function of underlying characteristics such as teachers' language proficiency or familiarity with the
community?
This study seeks to identify the characteristics and training experiences of teachers who are
differentially effective at promoting math achievement among ELLs. We begin with a review of
prior research. We then describe our data, methods and results, concluding with a discussion of their
implications. As described below, our analyses indicate that general skills reflected by scores on
teacher certification exams are less predictive of achievement for English language learners.
However, specific experience teaching ELL students is more important for predicting effectiveness
with future ELL students than experience teaching non-ELL students, as is both in-service and pre-
service training focused on ELL-specific instructional strategies.
English Language Learners and Academic Achievement
English language learners are a large and rapidly growing student population in K-12 schools.
Roughly 4.6 million students were estimated to be ELLs in school year (SY) 2009-10, representing

DIFFERENT SKILLS
2
10 percent of all public school students (U.S. Department of Education, 2010), with a rapid growth
rate of 27 percent between 2000-01 and 2009-10, compared to a 4 percent growth rate for all other
students. ELL students typically take from three to seven years to attain oral English proficiency,
and many still have significant challenges associated with academic language fluency for even longer
(Dixon et al., 2012; Hakuta, Butler & Witt, 2000). In line with these patterns, an increasingly large
proportion of general education teachers, across K-12 grades and subject specialties, will at some
point in their careers teach ELL students in their classrooms.
To date, ELLs face a substantial and well documented math achievement gap relative to other
groups of students. For instance, 72 percent of ELLs scored “below basic” on 8th grade NAEP math
exams in 2010-11, compared to 17 percent of white students, 40 percent of Hispanic students, and
41 percent of low-income students (U.S. Department of Education, 2011). Studies indicate a strong
correlation between children’s language proficiency and their math performance (Schleppegrell,
2007). ELL students must overcome deficiencies in English while simultaneously maintaining
academic progress, and many do not succeed. Their consistently low performance has been
highlighted in part by reporting requirements of the federal No Child Left Behind (NCLB) law
passed in 2001, and continues to be an area of focus both for lawmakers considering its
reauthorization and for educators challenged with serving ELLs in their schools.
Teacher Quality and English Language Learners
Teacher quality is an important, if not the most important, school-related factor that researchers
have identified for improving student academic performance (Rivkin, Hanushek, & Kain, 2005;
Rockoff, 2004). However, relatively little research has examined differences in teacher effectiveness
specifically for ELLs. This scarcity is in contrast to the larger evidence base comparing different
programmatic approaches to instructing ELLs (Slavin & Cheung, 2005; Slavin et al., 2010; Willig,

DIFFERENT SKILLS
3
1985). Greater attention to identifying the characteristics of teachers who are effective with ELLs –
whether within or across instructional programs – may be central to addressing the ELL math
achievement gap.
Teachers who are effective with English proficient students may be the same teachers who are
most effective with English learners; however, alternatively there may be some teachers - with a
specific set of skills - who are relatively more effective at teaching English learners. If a good teacher
is a good teacher for all then the most promising policies for closing ELL achievement gaps will aim
to place effective teachers with English learners. If specific skills are more important, then efforts to
improve the ELL-specific skills of teachers and place students with teachers who have these skills
would be more beneficial.
General teacher quality and student achievement. Substantial research has assessed the
characteristics of effective teachers for student math achievement. While many of the measured
characteristics of teachers, such as whether they have a masters’ degree, do not predict greater
effectiveness, a variety of identifying characteristics do. For example, tests assessing overall ability -
such as the SAT and the Liberal Arts and Science (LAST) exam in New York – are associated with
teachers’ performance in the classroom, though relatively weakly (Boyd, Lankford, Loeb, Rockoff, &
Wyckoff, 2008). Moreover, teachers’ content knowledge (Wenglinksy, 2002) and their pedagogical
content knowledge (Rockoff, Jacob, Kane, & Staiger, forthcoming) also predict higher performance
in math (Hill, Rowan, & Ball, 2005). Studies repeatedly show that teachers tend to improve with
experience, especially during the first few years of teaching (Clotfelter, Ladd & Vigdor, 2007; Nye,
Konstantopoulos, & Hedges, 2004; Rice, 2003; Rockoff, 2004). Finally, while the research on
teacher preparation is sparse, some studies have found benefits of particular teacher preparation
experiences. For instance, high quality field experiences and preparation directly linked to the

DIFFERENT SKILLS
4
practice of teaching predict instructional effectiveness (Boyd, Grossman, Lankford, Loeb, &
Wyckoff, 2009; Ronfeldt, forthcoming). Teachers’ effectiveness may also improve as a result of
high-quality school-based interventions, such as induction programs for new teachers (Ingersoll &
Strong, 2011), or as a result of intensive instructional mentoring (Rockoff, 2008).
While fewer studies have examined the relationship between teacher characteristics or training
experiences and ELL achievement, research suggests that teachers who are effective with one group
of students are often effective with another group of students as well (Lockwood & McCaffrey,
2009; Sanders & Rivers, 1996.). To the extent that this is the case for ELL teachers, identification of
higher quality teachers in general and their assignment to teach ELLs may help to support ELL
academic achievement. In this vein, many studies have called attention to the potentially problematic
tendency for ELLs in some regions to be taught by less skilled or credentialed teachers, in large part
due to the schools that they attend (Gandara, Rumberger, Maxwell-Jolly & Callahan, 2003; Grunow,
2011; Lankford, Loeb, & Wyckoff, 2002; Peske & Haycock, 2006).
Specific teacher quality and ELL achievement. It may also be the case that certain teacher
characteristics and training experiences predict differential teacher effectiveness with ELLs. A
growing body of theory and qualitative research– as well as some empirical work – has suggested
instructional practices and frameworks that may be specifically helpful for teachers of ELL students
(Cloud, Genesee & Hamayan, 2009; Echevarria, Vogt, & Short, 2010; Faltis, Arias, & Ramirez-
Marin, 2009; Genesee, Lindholm-Leary, Saunders, & Christian, 2006; Lucas et al., 2008). Research
indicates that math teachers in particular may benefit from employing techniques to help address the
unique challenges ELL students face in becoming familiar with technical language. They may also be
more effective when they demonstrate appreciation for children’s first language, culture, and the
challenges associated with attaining academic fluency, versus conventional fluency. Teachers who
DIFFERENT SKILLS
5
recognize and explicitly teach the semiotics and vocabulary used in math, and who successfully relate
the ‘language’ of math to ELLs’ existing knowledge of English, may therefore be more effective
(Garrison & Mora, 1999; Gutierrez 2002; Janzen, 2008; Schleppegrell, 2007).
Empirical studies of teachers’ effectiveness with ELLs provide some evidence regarding the
relevance of specific instructional skills to ELL student outcomes. In particular, teachers’ use of
instructional techniques emphasized in the sheltered instruction observation protocol (SIOP), a
comprehensive method developed for teaching ELLs, predicts greater teacher effectiveness with
ELLs on reading and writing exams assessing English proficiency (Short, Fidelman, & Louguit,
2012; Short, Echevarria, & Richards-Tutor, 2011). Research on SIOP also provides evidence of
benefits to ELL students following explicit training of teachers in these techniques. A separate,
unrelated study found that schools in which ELL students receive greater “ELL-specific academic
instruction” had higher school-wide ELL academic achievement, though the same study found no
link between teachers’ ESL certification rates and student learning (Williams et al., 2005).
In the study most similar to ours, Betts, Zau and Rice (2003) uses three years data from the San
Diego school district and links students to teachers to examine the relationship between teacher
characteristics and math and reading achievement for ELL and non-ELL students. They find no
relationship between experience or ELL-specific teaching credentials and math achievement for
ELLs. The study does not explicitly test the difference in effects between ELLs and non-ELLs.
Collectively, this research suggests that there may be specific skills that teachers can learn and
employ that yield differential effectiveness in teaching ELLs. However, the evidence base supporting
this contention comes primarily from studies with notable limitations in terms of their methods and
scope. For instance, most of the evidence regarding teacher preparation in the SIOP framework
comes from small-scale, matched-comparison studies that examine treatment and control groups of
uncertain comparability (Short et al., 2012; Short et al., 2011). The one experimental study in this

DIFFERENT SKILLS
6
vein did not identify any significant effects of ELL-specific professional development, perhaps due
to imperfect teacher implementation (Short et al., 2011). Other work relies on school-level
aggregates of teacher characteristics, rather than teacher-level data, compounding the likelihood of
bias due to differential sorting of students, by ability, into schools (Williams et al., 2005). In addition
to methodological limitations, empirical research in this area has tended to rely on tests of language
proficiency as outcomes, rather than students’ academic achievement gains. Math outcomes in
particular have received scant attention (Genesee et al., 2006). Finally, the extant empirical research
does not typically examine whether ELL-specific skills yield differential benefits for ELLs, or instead
are universally effective instructional practices that would benefit all students equally.
Other research suggests the possibility that more foundational teacher characteristics, such as
second-language fluency, motivation, or cultural affiliation, might be differentially relevant in ELL
instruction. The available research regarding these characteristics primarily consists of case studies of
effective second-language teachers, or of survey data on teachers’ perspectives about teaching that
are linked to student outcomes (Dixon et al., 2012). These studies suggest that some knowledge of a
second language may aid in instruction, and that motivation to teach second-language learners may
also be beneficial, though the evidence in support of either contention is limited. Another line of
research has examined how innate teacher characteristics, such as race or gender, influence
effectiveness differentially for certain students, for example through positive “same-race” effects
(Dee, 2005; Wayne & Youngs, 2003). However, there are no comparable studies explicitly linking
teacher characteristics such as cultural or race affiliation to ELL achievement gains.
Investigating differential teacher effectiveness with ELL students. The results of the prior
literature on teacher effectiveness generate three suppositions concerning the effectiveness of
teachers of English language learners. First, we might expect that characteristics associated with

DIFFERENT SKILLS
7
more effective teachers for students in general - such as test performance, content knowledge and
teaching experience - would also be associated with more effective teachers for ELL students.
Second, specific instructional skills and strategies that teachers can learn from training or practice
may support differential effectiveness with ELL students, relative to non-ELL students, in their
math instruction. Third and finally, in addition to general aspects of teacher quality, some
foundational teacher attributes - such as second language proficiency, motivation to teach ELLs, and
relevant cultural affinity - might differentially benefit math instruction for English learners.
In this study we use an unusually rich data set to examine these suppositions. We improve upon
existing studies by including a greater range of teacher characteristics, such as rich survey items that
identify the quantity and quality of the ELL-related training that individual teachers received; by
using student and teacher-level longitudinal data rather than school-level aggregates and cross-
sectional data; and by employing analytical methods that, while imperfect, more directly address
concerns of omitted variables bias than do prior studies.
Data and Methods
This study explores several research questions that bear on the teaching of English language
learners. In keeping with the discussion above, we assesses the extent to which teacher
characteristics that predict math achievement growth for non-ELL students, such as years of
experience and test performance, also predict math achievement growth for ELL students. We also
assess whether there are other characteristics of teachers, including second language fluency and
learning experiences focused on ELL students, that differentially predict math achievement growth
for ELL students more than for non-ELL students. We specifically consider the following questions
of interest:

DIFFERENT SKILLS
8
1. Do teacher characteristics that predict math achievement growth for non-ELL students also
predict math achievement growth for ELL students?
a. Does teachers' own test performance predict ELL and non-ELL math achievement gains?
b. Does teachers' teaching experience predict ELL and non-ELL math achievement gains?
2. Do specific teacher experiences that support learning to teach ELL students differentially predict
effectiveness with ELL students in math instruction?
a. Does past teaching experience with ELL students predict differential efficacy teaching ELLs?
b. Does pre-service teacher preparation that addresses specific instructional skills for teaching
ELLs predict differential efficacy in teaching ELLs?
c. Does in-service teacher professional development that addresses specific instructional skills
for teaching ELLs predict differential efficacy in teaching ELLs?
d. Does certification to teach English as a Second Language, certification as a bilingual
Education teacher, or teacher preparation via an alternative pathway predict differential
efficacy in teaching ELLs?
3. Do teacher background characteristics predict differential effectiveness with ELL students in math
instruction?
a. Does a teacher’s ability to speak Spanish fluently, either native or learned, predict differential
efficacy in teaching Hispanic English language learner students?
b. Does a teacher’s preference for teaching at sites with more ELLs predict differential efficacy
in teaching ELLs?
In the following sections, we detail the data that we use to answer these questions, and provide
descriptive information about the population of study. We then describe our methodology in depth.

DIFFERENT SKILLS
9
Data
Context and overview of the study sample. The data for this study come from the New York
City (NYC) public school system, which includes a large and diverse population of ELLs. We utilize
rich administrative information about teachers and students in NYC, as well as unique survey data
about teachers’ preparation experiences, to predict differences in ELL students’ math achievement
gains in grades four through eight. Specifically, the New York City Department of Education
(NYCDOE) provided student and teacher demographic data files and a student exam data file for
each school year from 2001-2002 through 2007-2008 for the study. To further enrich our data about
teachers, we also match NYC teachers to employee data from New York State Education
Department (NYSED) databases. Finally, we leverage a survey of all first year NYC teachers,
conducted in the spring of 2005, which asked teachers detailed questions about their pre-service
preparation experiences, in-service training in their first year of teaching, teaching practices, and
preferences.
Limiting our analysis to math teachers and outcomes. Although we have access to some
English language arts (ELA) achievement data, we ultimately chose to examine and report only on
math outcomes in this study, due to limitations in the available ELA data. First, ELL-designated
students were not consistently tested in ELA in NYC during much of this period (2001 to 2008).
Towards the end of the period, testing requirements were reformed with more inclusive mandates
for ELL student testing. For example, starting in 2007, the ELA exam was required after one year in
the district for ELL students, rather than after three years as had been the practice before. Thus, for
much of the study period, ELLs who were tested in ELA were likely quite dissimilar from those who
were not. In addition, during this time period, New York administered ELA exams, unlike math
exams, at mid-year, rather than near the end of the school year. Even with these limitations we do
run similar analyses using ELA scores to those presented in this study about math performance. In

DIFFERENT SKILLS
10
general, the results are directionally similar, but markedly attenuated. We would be happy to share
these results or a summary of findings upon request.
Administrative data on students, teachers, and schools. Our administrative data include a
range of demographic characteristics about students, teachers, and students’ classroom peers. In
addition, the combination of NYC and NYCDOE databases yields data on teachers’ certification
status, their performance on licensing exams, and their experience level within the NYC school
system.
Our primary student outcome measures consist of annual student achievement scores in math,
based on exams given in third through eighth grades to most NYC students. For each year, the data
include scores for approximately 65,000 to 80,000 NYC students in each grade. Using these data, we
construct a set of records with a student’s current math exam score standardized within each grade
level and year, as well as his or her lagged exam score. We then match individual students and
teachers across the district using a process recommended by the NYCDOE.
Identifying ELL students. In NYC, the vast majority (98 percent) of students are initially
designated as ELLs or non-ELLs based on a home survey that determines whether English is the
primary language spoken at home, followed by a Language Assessment Battery (LAB) exam
administered to students whose home language was not English, in order to determine their level of
English proficiency. Our data include an indicator for ELL status in each year in which a student
was present in the data set. The district was unable to provide the language proficiency scores that
students received on their initial LAB exam, or on subsequent exams that re-assess their status. Our
data also do not specify which ELL-specific programs students may have participated in.
Survey of first-year teachers. In addition to utilizing administrative data from 2001-2002 to
2007-2008, we also conducted a survey of all first year NYC teachers in the spring of 2005 which
asked detailed questions about teacher preparation experiences, in-service training in their first year

DIFFERENT SKILLS
11
of teaching, teaching practices, and preferences. Of particular interest for this analysis, the survey
included questions related to the quantity and efficacy of teachers’ ELL-specific pre-service and in-
service training, as well as their reported preferences to teach at school sites with more ELL
students. It also asked teachers about their fluency in languages other than English, including
Spanish. The overall response rate for this survey was 71.5 percent, representing 4303 teachers
across all grades and subjects. Of these, 1221 were math teachers present in our administrative data.
Descriptive information about students and teachers. We describe the characteristics and
distribution of ELL students across the district in Tables 1 and 2. In line with national trends in ELL
performance, district-wide ELL math achievement is substantially lower than that of non-ELLs in
NYC. The bulk of ELL students (70 percent) are classified as Hispanic, while the second largest
subgroup is those of Asian descent (18 percent). In comparison, 35 percent of non-ELLs are
Hispanic and 13 percent are Asian. ELLs are more likely to receive free or reduced price lunch (76
percent) than non-ELLs (68 percent).
The majority of ELLs in NYC (80 percent) attend math classrooms composed of both ELL and
non-ELL peer students. Table 3 details the proportion of classrooms district-wide that contain none,
minority, and majority populations of ELL students, and the demographic composition of those
classrooms. Forty-four percent of all ELLs attend classrooms that are predominantly (94 percent or
more) ELL students. In these classrooms, students are on average 78 percent Hispanic and 73
percent eligible for subsidized lunch.
While we do not find substantial differences in teachers of ELLs and non-ELLs in terms of
characteristics associated with generic teacher quality, we do see key differences in the assignment of
teachers with ELL-specific training or language skills. Table 4 shows that, on average, 25.7 percent
of non-ELL students in grades 4-8 were taught by a first or second year teacher, compared to 23.7
percent for ELL students. Liberal Arts and Sciences Test (LAST) scores, New York's general
DIFFERENT SKILLS
12
knowledge certification exam, were lower for the teachers of ELL students, 237 on average,
compared to 246 for non-ELL students. However, ELL students are more likely to be taught by a
math teacher who is certified as an ESL or bilingual education instructor, with 6.6 percent of ELLs
receiving math instruction from an ESL-certified teacher, and 21.7 percent from a bilingual
education certified teacher, in comparison to 1.6 and 4 percent, respectively, for non-ELLs. Finally,
within our sample of surveyed first year teachers, there is a clear tendency for Hispanic ELLs to be
taught by teachers who are fluent in Spanish compared to other students (38.8 percent versus 11.7
percent).
Table 5 describes the questions of interest from our survey of new teachers that addressed ELLs
and provides the distribution of teacher responses for each question. In line with previous research
on teacher preparation to teach ELLs (Boyd et. al., 2009), the proportion of teachers reporting
training to teach ELLs is low relative to the proportion likely to be supporting ELLs in their
classrooms. Only 14.1 percent reported a meaningful pre-service opportunity to learn instructional
strategies for teaching ELLs, and only 13.9 percent reported having more than nine hours of in-
service professional development focused on ELL instruction by the middle of their first year. Note
that this survey occurred during a period of substantial ELL-related professional development and
coaching across NYC, particularly in elementary and middle school grades (Horwitz et al., 2009).
Methods
This section details the empirical approach we use to answer each of our research questions. In
particular, we address two primary challenges to generating accurate results. First, teachers with a
characteristic that affects student learning may also have another set of characteristics that
independently affect student learning. For example, teachers who speak Spanish may also have
greater overall academic ability. If we do not adjust for this difference, we might attribute to Spanish

DIFFERENT SKILLS
13
fluency what is really the effect of academic ability. Second, teachers with given characteristics may
teach students with different propensities to learn. For example, if teachers who speak Spanish are
differentially assigned to students with more learning difficulties, we might see lower gains in those
classrooms even if teachers who speak Spanish are more effective. Under an ideal scenario, we
would test effects of teacher characteristics using a randomized experiment. Specifically, we would
randomly assign relevant skills (or training) to teachers to ensure comparable underlying teacher
ability across treatment and control teachers, and we would randomly assign students to teachers to
ensure comparable student ability across teacher groups.
We are unable to conduct an ideal experiment, but use both rich data and two empirical
approaches to reduce the likelihood of bias. First, we reduce the potential that we are attributing
effectiveness to one teacher characteristic when it is really a correlated teacher characteristic driving
the association by including theoretically appropriate controls in the models. Second, we reduce the
bias associated with the sorting of teachers to schools by comparing the achievement gains of
students within the same school but in classrooms with teachers who have different characteristics.
Third, we reduce the bias associated with students (both ELL and non-ELL) being assigned
differentially to teachers within a school by comparing the gains of ELL and non-ELL students
taught by the same teacher. We describe these methods in more detail below.
Model 1: A within-school achievement growth model. As a baseline, we consider how
student achievement outcomes in math vary across teachers with different characteristics by
comparing the math achievement gains of students within the same school. Equation 1 describes
this specification.
Here, the standardized achievement (A) of student i in year t with teacher j in school s is a
function of his or her prior achievement (A at t-1), time varying and fixed student characteristics (X),
DIFFERENT SKILLS
14
characteristics of the classroom (C), characteristics of the teacher (T), a fixed-effect for the school
( ), a fixed-effect for the grade level of the student ( ), a fixed effect for the year ( ), and a random
error term ( ). When controlling for prior achievement, we include both a linear and quadratic term
to represent the student’s standardized prior achievement result. Also at the student level, we include
observable characteristics that tend to predict differential achievement, including race and ethnicity,
gender, eligibility for free or reduced-price lunch, the number of school absences in the previous
year, and the number of suspensions in the previous year. At the classroom level, we control for
potentially relevant peer effects by including the average of all the student characteristics already
mentioned, as well as the percent of students in the classroom that are designated ELLs, and the
mean and standard deviation of student test scores in the prior year. At the teacher level, we include
observable teacher characteristics that tend to be associated with instructional efficacy, including
years of teaching experience in NYC (as a proxy for total years of experience), teacher
race/ethnicity, and teacher test scores on the Liberal Arts and Science Test (LAST) general
knowledge exam that teachers must pass to earn certification. In addition to these generic teacher-
level controls, we examine, in separate models detailed below, various teacher characteristics relevant
to our research questions. Including fixed effects at the school level reduces the potential bias
associated with teacher assignment to schools, and our controls for student, classroom, and teacher
characteristics reduce potential bias associated with student assignment to teachers within schools.
Differential effectiveness with ELLs. In order to assess whether the teacher characteristics in
question predict differential effectiveness for ELL students, we model, as specified in Equation 1,
the effects of ELL and non-ELL characteristics separately, across a sample of students of only those
teachers who teach mixed classes of ELLs and non-ELLs in a given year, grade, and school. We
then conduct an F-test on the coefficients of interest to see whether the effect size associated with
ELL students is significantly different from the effect associated with non-ELL students.
DIFFERENT SKILLS
15
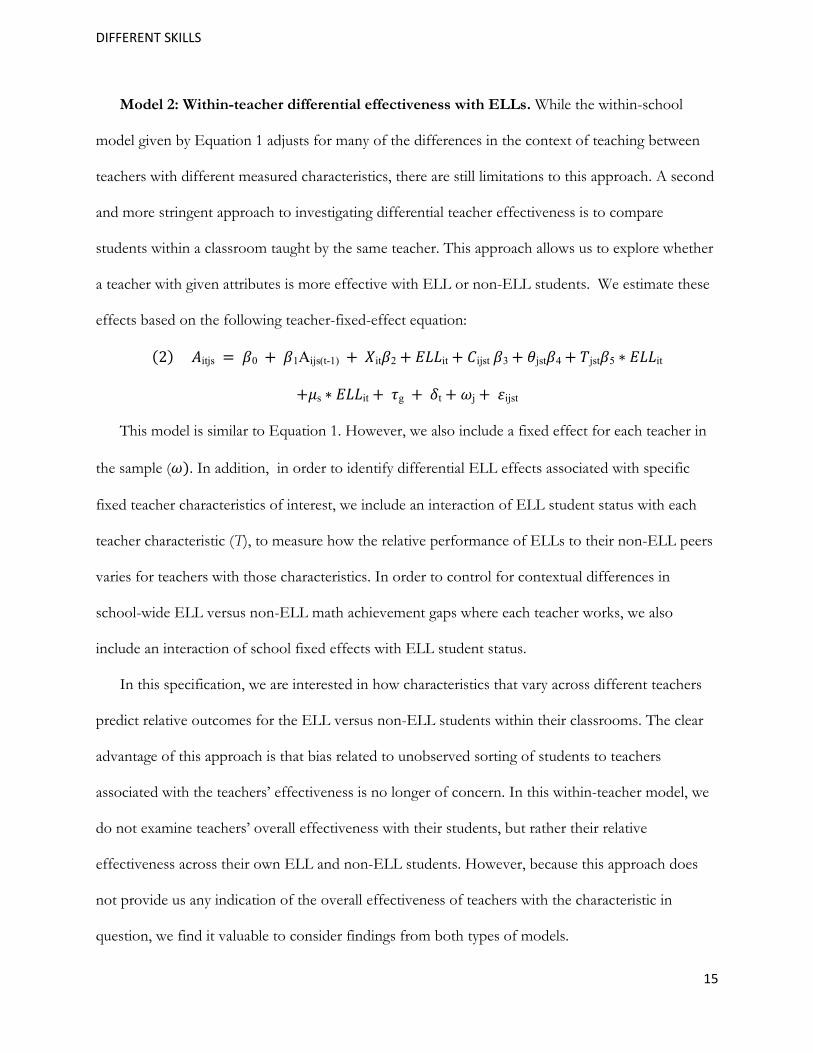
Model 2: Within-teacher differential effectiveness with ELLs. While the within-school
model given by Equation 1 adjusts for many of the differences in the context of teaching between
teachers with different measured characteristics, there are still limitations to this approach. A second
and more stringent approach to investigating differential teacher effectiveness is to compare
students within a classroom taught by the same teacher. This approach allows us to explore whether
a teacher with given attributes is more effective with ELL or non-ELL students. We estimate these
effects based on the following teacher-fixed-effect equation:
This model is similar to Equation 1. However, we also include a fixed effect for each teacher in
the sample ( . In addition, in order to identify differential ELL effects associated with specific
fixed teacher characteristics of interest, we include an interaction of ELL student status with each
teacher characteristic (T), to measure how the relative performance of ELLs to their non-ELL peers
varies for teachers with those characteristics. In order to control for contextual differences in
school-wide ELL versus non-ELL math achievement gaps where each teacher works, we also
include an interaction of school fixed effects with ELL student status.
In this specification, we are interested in how characteristics that vary across different teachers
predict relative outcomes for the ELL versus non-ELL students within their classrooms. The clear
advantage of this approach is that bias related to unobserved sorting of students to teachers
associated with the teachers’ effectiveness is no longer of concern. In this within-teacher model, we
do not examine teachers’ overall effectiveness with their students, but rather their relative
effectiveness across their own ELL and non-ELL students. However, because this approach does
not provide us any indication of the overall effectiveness of teachers with the characteristic in
question, we find it valuable to consider findings from both types of models.

DIFFERENT SKILLS
16
Applying study methodology to specific questions of interest. For each teacher
characteristic of interest, we leverage both modeling approaches to test for differential effectiveness
with ELLs. This requires us to tailor each model to account for the specific characteristic and
research question. A description of model variants addressing each of our research questions is
provided here. The covariates included in each model are detailed in Appendix 1 Table 1.
Q1: Teachers' own test performance and teaching experience. For test performance, we
include an indicator variable for whether the teacher failed his or her certification test for the within-
school analysis and an interaction between this variable and being an ELL student for the within-
teacher analysis. We use this variable instead of a continuous variable because the test has
significantly greater reliability around the cut-score. For experience, we similarly enter indicator
variables for each year of experience up to nine and an indicator variable for ten or greater years.
Q2: Teachers’ prior experience teaching ELL students, preparation and certification.
When investigating how prior experience with ELLs might predict future effectiveness with ELLs,
we consider a variety of measures of experience. These include the total number of ELL students
taught by the teacher in the prior year as well as in multiple prior years, with separate model
specifications to examine effects for teachers in their second year of teaching and for more
experienced teachers. For simplicity, the models we present define experience with ELLs as the
experience of teaching more than six ELL students in a single school year. The results are not
especially sensitive to this cutoff number, but the relationship does not appear to be linear so we do
not use the continuous measure of the number of ELL students taught. We choose six because it is
close to the estimated mean number of ELL students taught by teachers across NYC in each year,
and represents a sufficient quantity of ELL students to reasonably be expected to challenge a teacher
to modify his/her instruction in response. Finally, note that the teacher fixed effect models in this
DIFFERENT SKILLS
17
case examine the effects of ELL experience within each individual teacher over time (rather than the
ELL achievement gaps across fixed teacher characteristics).
There are additional sources of bias to consider when investigating effects of teacher experience
with ELLs, particularly for the within-school estimates. First, teachers who are assigned more ELL
students may differ from other teachers in ways that predict greater ELL-specific instructional
effectiveness, and this may have led to their assignment to ELL-populated classrooms in the first
place. To reduce this potential bias, when examining experience effects, we control for the number
of ELL students taught in the current year; this control is in addition to the classroom level control
for percent of ELLs taught, which is present in all model runs. Second, teachers of ELL students
could be different from comparison teachers in their pattern of attrition. Our tests for possible
attrition bias, which does not appear to be a factor, are detailed in the specification checks in
Appendix 2. Neither of these issues is relevant to the within-teacher models.
Our measures of teachers’ ELL-specific pre-service preparation and in-service PD come from
the 2005 survey. There are clear drawbacks to these measures. First, they have the flaws associated
with all self-reported measures. Moreover, teachers responded to the questions about pre-service
training experiences based on recollections from more than five months prior. There is potential for
respondents’ recollections to be colored by their actual success or challenges with ELL students over
their first several months of full time teaching. Nonetheless, measures of content-specific
preparation and experiences are difficult to come by and these analyses provide initial evidence of
the relationships in question. When considering survey reported experiences, we include other
reported experiences as controls only when the control experiences occurred prior to the
characteristic of interest. We model responses to each survey question as an indicator variable, and
detail the indicator threshold for each question in Table 5.
DIFFERENT SKILLS
18
When investigating teachers’ certification for teaching English as a second language (ESL) or
bilingual education, we first compare certified to non-certified teachers in the full population. We
then test whether this relationship differs for novice teachers, defined as those with three or fewer
years of experience, to test whether these certifications might represent a temporary early advantage
relative to other new teachers. In order to align with our estimates of the effects of survey-reported
pre-service training (as of 2005), we explore possible certification effects in the SY 2005 to 2008
time period.
Q3: Math teachers’ Spanish fluency and pre-service preferences. When investigating
possible associations between Spanish language fluency and ELL student achievement, we narrow
our focus from all ELL students to Hispanic ELL students. By definition, these are students whose
home language is not English, who do not possess English fluency, and who overwhelmingly will be
fluent in Spanish as their primary language. Moreover, we consider two types of reported teacher
fluency – those who report native fluency in Spanish and those who report non-native fluency. As
for all analyses related to the 2005 teacher survey sample, only teachers responding to the survey are
considered in this analysis.
The final teacher characteristic analyzed is teachers’ reported preferences to teach at sites with
more ELL students. This self-reported measure comes from the 2005 teacher survey, and is
modeled as an indicator variable as described in Table 5.
Possible limitations. The within-school and within-teacher modeling approaches described
above may not completely eliminate bias associated with non-random and unobserved student and
teacher sorting. Neither of our modeling approaches accounts for potential sorting to teachers
within schools that is different for ELL and non-ELL students. For example, if teachers with
characteristics of interest are systematically assigned different ELL students but not different non-
ELL students, the within-classroom difference between ELLs and non-ELLs could be driven in part

DIFFERENT SKILLS
19
by differences in sorting instead of differences in effectiveness, which is what we aim to measure. To
better gauge this potential bias, we examine each teacher characteristic of interest for evidence of
whether teachers possessing that trait are assigned ELL and non-ELL students that differ on “pre-
treatment” observable characteristics. Our specification section in Appendix 2 offers a more detailed
investigation of our response to these and other potential issues related to our analytical results.
Results
Do Teacher Characteristics that Predict Achievement Growth for Non-ELL Students Also
Predict Achievement Growth for ELL Students?
We find that the relationship between a teacher’s test scores and student math learning is weaker
for English learners than for non-English learners but the effects of generic teaching experience are
similar. Tables 6a and 6b show that low initial teacher scores on the LAST exam (failing the exam)
predict worse achievement outcomes for non-ELL students, but not for ELL students. This
differential effect is statistically significant, but modest in size, in the school fixed effect model
specification, but smaller and not significant in the within-teacher relative performance gaps. The
knowledge and skills measured by the LAST exam may not be as relevant for effective instruction
for ELL students as they are for non-ELL students.
Tables 6a and 6b also show that additional teacher experience yields similar math achievement
gains for ELL and non-ELL students. Second-year teachers, for example, see learning gains that are
0.056 standard deviations higher than first year teachers teaching non-English learners, while the
corresponding coefficient is 0.057 for teaching English learners. The within-teacher model in Table
6b that interacts years of experience with ELL student status similarly identifies little differential
return for ELL students associated with generic teacher experience.
DIFFERENT SKILLS
20
Do Teacher Experiences that Support Learning to Teach ELL Students Differentially
Predict Effectiveness with ELL Students?
Next we look at teachers' experiences that might differentially benefit English language learners.
First we explore teachers' experience teaching ELL students, then, pre-service preparation, in-service
professional development, and teacher certification or pathway.
Prior experience teaching ELL students. Generic returns to teaching experience are well
documented in both this and prior research. Less research has considered how teachers may benefit
from different kinds of teaching experience. Our investigation of the type of prior teaching
experience that teachers receive suggests that there are differential returns to experience teaching
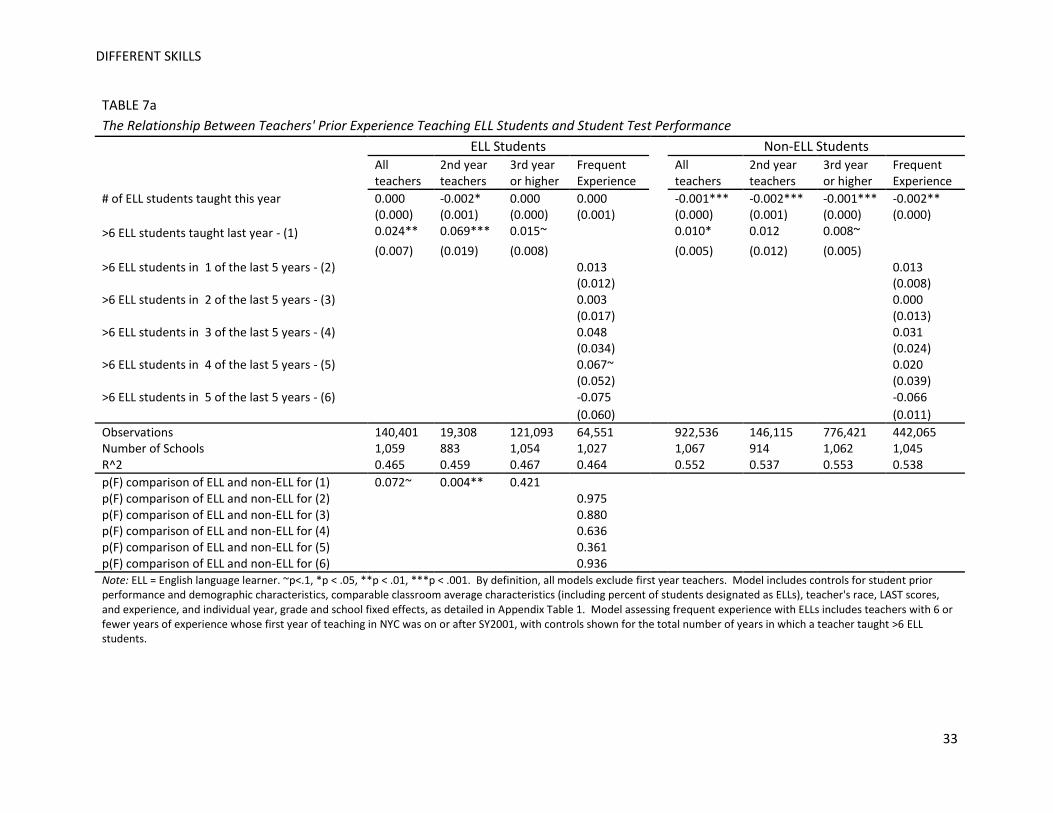
ELL students, particularly among novice teachers. Table 7a provides an overview of school fixed
effects analyses related to our research question. First, across all teachers, having taught more than
six ELL students in the prior school year predicts significantly higher student learning gains in math
in the current year. The comparative advantage in current year performance for this group is more
than twice as large for ELL students (0.024 standard deviations higher) as for non-ELL students
(0.010 standard deviations higher).
Digging deeper, we find that the bulk of this differential advantage is driven by differences in
performance among second year teachers. In this group, prior-year experience with ELL students
predicts much larger student achievement gains, particularly for ELL students, with 0.069 standard
deviations higher performance for ELL students, relative to just 0.012 standard deviations higher for
non-ELL students. These gains to experience with ELL students control for the typical gains of all
second-year teachers relative to their first-year colleagues. The difference in effect sizes for these
two groups is significant, and is comparable in magnitude to the average difference in learning gains
of all teachers between their first and second year of teaching that we report in Table 6a.

DIFFERENT SKILLS
21
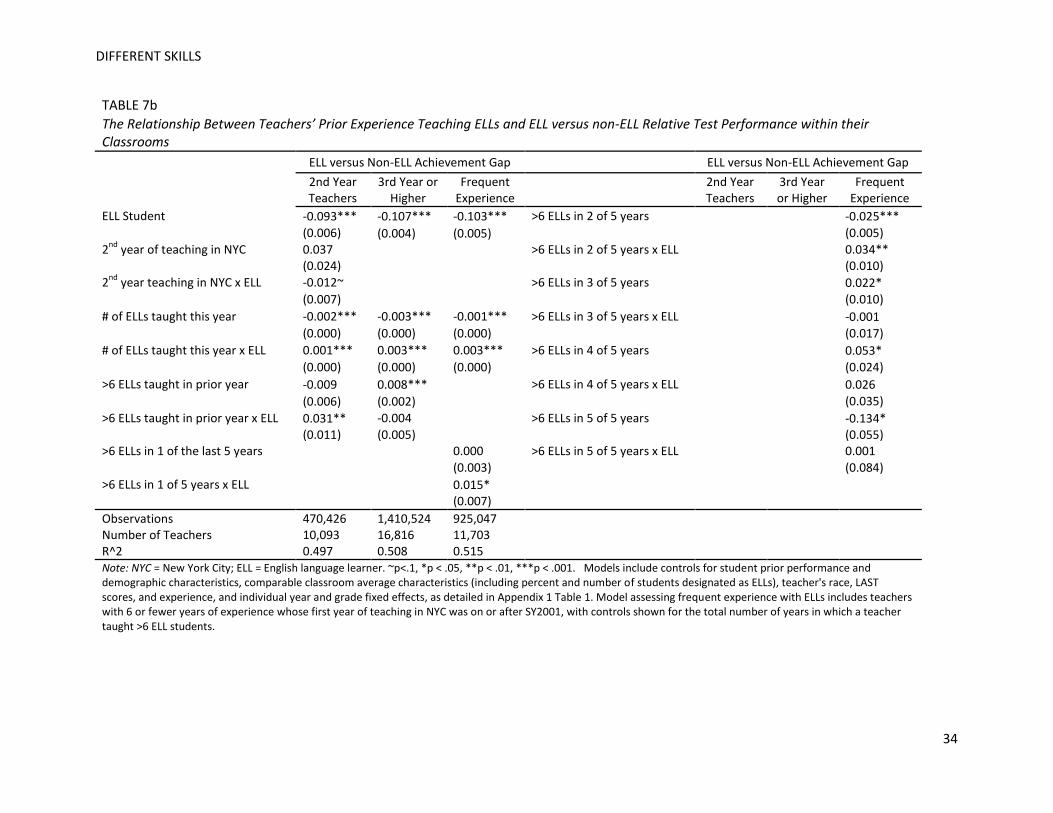
We find further corroboration of this differential return to prior experience teaching ELLs
among second year teachers in the teacher fixed effects model results shown in Table 7b. Here, we
compare teachers’ own performance between their first and second years, and investigate how the
relative ELL math learning gap of their own students varies over this period. For teachers in their
second year of teaching who taught more than six ELL students in their first year, we see a
significant 0.031 standard deviation improvement in their ELL versus non-ELL learning gap,
relative to an average ELL versus non-ELL learning gap of -0.093 standard deviations for all
teachers. Moreover, we observe that teachers in their second year who did not teach more than six
ELL students in their first year have 0.012 standard deviations larger ELL/non-ELL gaps, though
this effect is not significant at the .05 level (p=0.09). It may be that teachers are challenged to learn
different instructional skills in their first year of teaching, depending on whether or not they are
exposed to ELL students, with implications for the academic success of future students.
We also consider whether frequent experience with ELL students over a five year period
predicts a differential advantage for teaching ELLs. Our within-teacher analysis of this effect in
Table 7b indicates a differential advantage with ELL students predicted by both the first and second
years of accumulated prior experience teaching ELL students, but no apparent returns for additional
years of ELL experience beyond that. However, our within-school analysis of the same effect (Table
7a) does not find any significant differences in terms of effectiveness with ELLs.
Reported preparation to teach ELLs. While teacher learning experiences relevant to ELL
instruction may happen informally “on the job,” significant investment and attention has been
focused on formal teacher preparation to support ELL students, through both pre-service and in-
service training experiences. We find that reported training experiences that address specific
instructional strategies for teaching ELL students predict significant differential efficacy in ELL
math instruction. As shown in Table 8a, teachers who reported pre-service training experiences
DIFFERENT SKILLS
22
including opportunities to learn ELL-specific instructional strategies “in some depth” or
“extensively” were differentially more effective with their ELL students (0.090 standard deviations
higher gains) than their non-ELL students (0.035 standard deviations lower – but not statistically
different from zero) in within-school comparisons to other teachers who did not report such
preparation. This differential benefit to ELLs was somewhat smaller, but still statistically significant
in within-teacher analysis of relative ELL achievement gaps (see Table 8b), with relative ELL
learning gaps 0.091 standard deviations smaller for teachers who received this level of reported pre-
service training.
Table 8a also shows that teachers who reported receiving more than nine hours of in-service
professional development (PD) focused on ELL instructional strategies in the first half of their first
year of teaching, when compared to teachers who did not receive such PD, had greater differential
efficacy with ELLs. Following a similar pattern to pre-service results, effect sizes appear larger in the
within-school comparison (Table 8a), but directionally the same as in the within-teacher comparison
(Table 8b) of relative ELL achievement gaps. The observed in-service PD effect was most
pronounced in the same year in which the PD was received, with, for example, an advantage of
0.226 standard deviations in relative ELL versus non-ELL math learning gains in the within-teacher
analysis. It is notable that, overall across both ELLs and non-ELLs in the within-school analysis,
teachers who receive PD of this type appear less effective than their peers, but this is not necessarily
surprising given the non-random assignment of such PD to teachers – either at their request or that
of administrators.
Certification and pathway. Existing research on the effects of specialized certification to teach
ELL students has yielded inconclusive results. We find that ESL certification for math teachers in
NYC does predict differential effectiveness with ELL students, particularly when comparing novice
teachers with three or fewer years of teaching experience, as detailed in Tables 9a and 9b. For
DIFFERENT SKILLS
23
example, the within-teacher relative ELL learning gap is 0.106 standard deviations smaller for ESL
certified novice teachers than for other novice teachers. This pattern is also apparent in the school
fixed effect model specification. We find a smaller within-teacher ELL learning differential
associated with bilingual certification (0.043 standard deviations) among novice teachers. However,
our school fixed effect specification suggests a small, but counter-intuitive differential advantage for
non-ELL students among novice teachers with bilingual certification. Some caution is warranted in
interpreting both our ESL and bilingual certification findings. As detailed in Appendix 2, our
specification checks identify substantial conservative bias in differential assignment of ELLs and
non-ELLs to bilingual certified classrooms. This may serve to hide any true differential effectiveness
of these teachers. In contrast, ESL teacher classrooms show a modest bias in the opposite direction,
which might lead to some inflation of their differential impacts.
The ESL and Bilingual certification results are not the only indication that teachers' preparation
predicts teachers' abilities with ELLs. Teachers in NYC enter teaching through a variety of pathways
including university-based programs as well as alternative routes. Table 9a and 9b show differential
achievement for ELL students taught by teachers from alternate pathways, particularly Teach for
America teachers in middle school grades. Collectively, these results suggest that some teacher
preparation experiences may yield differential effectiveness at ELL math instruction.
Do Teacher Background Characteristics Predict Effectiveness with ELL Students?
Spanish fluency. Teacher fluency in ELL students’ primary language is a requirement for
teachers of bilingual education programs, which have usually been studied with regard to their
effects for reading comprehension or English language acquisition. However, fewer studies have
examined teacher fluency when it is not linked explicitly to a particular instructional program, or
among teachers of non-reading subjects. In our investigation, we do not find any association

DIFFERENT SKILLS
24
between math teachers’ reported fluency in Spanish and differential effectiveness with Hispanic ELL
students, as shown in Tables 10a and 10b. Neither native nor non-native fluency predicts
significantly different ELL learning gains, in either the within-school or the within-teacher models.
Preference to teach ELL students. We do, however, find teachers’ reported preferences to
teach at a school site with more ELL students to be a highly significant predictor of differential
effectiveness with ELL students. Tables 10a and 10b report these results, which are similar across
both within-school and within-teacher model specifications, with effect sizes comparable to many of
the teacher preparation findings discussed previously. For example, the within-teacher analysis
shows these teachers’ relative ELL versus non-ELL math learning gap to be 0.094 standard
deviations smaller than that of comparison teachers in the same school. Nevertheless, some caution
is merited in interpreting these results, as recalled site preferences were reported well after teachers’
first year of teaching was underway, and subsequent teaching experiences may have colored teachers’
responses.
Discussion and Conclusions
English learners are a large and growing portion of elementary and secondary students in the
United States, comprising approximately ten percent of all students. On average, English learners
also perform poorly on many measures of academic achievement. For example, 72 percent of
English learners scored “below basic” on the 8th grade 2011 NAEP math exam compared to 25
percent of English proficient students, and only 5 percent scored at proficient or advanced,
compared with 35 percent of non-English learners (U.S. Department of Education, 2011).
The research literature on effective schooling for English learners is also growing, particularly in
the areas of program effects and instructional practices. Substantial work has assessed the relative
benefits of different programmatic approaches such as comparing bilingual classrooms to

DIFFERENT SKILLS
25
classrooms with English immersion (Slavin and Cheung, 2005; Slavin et al., 2010; Willig, 1985).
Other work has looked at specific instructional techniques, such as those captured by the SIOP, an
observational protocol for measuring instruction (Short et al., 2012; Short et al., 2011).
Research on student achievement more generally has identified the important role of teachers,
but this research has not specifically investigated the effects of teachers on ELLs. Not only is it
clear that teachers vary in their effectiveness but also that some characteristics of teachers predict
increased effectiveness, such as teaching experience, knowledge, and teacher preparation linked to
practice (Boyd et. al., 2009; Rockoff, 2004; Rockoff, Jacob, Kane, & Staiger, forthcoming). The
contribution of this study is assess the extent to which math teachers who are effective with ELLs
have similar characteristics to those who are effective with English proficient students and to
identify characteristics of math teachers who are differentially more effective with ELLs.
In light of past research, we identify three suppositions regarding the characteristics of effective
teachers of ELLs: that characteristics that predict general teacher effectiveness will predict
effectiveness with ELLs, that specific practice or training may predict differential effectiveness with
ELLs, and that other foundational teacher characteristics may predict differential effectiveness with
ELLs. Our results partially confirm, but also partially challenge these hypotheses. First, we find that
characteristics associated with more effective teachers for students in general are not necessarily
associated with effective math teachers of ELL students. Overall teaching experience is predictive of
effectiveness with both ELL and non-ELL students. However, teachers’ LAST exam scores are less
predictive of math teacher effectiveness with ELL students. Second, we find that a variety of ELL-
specific instructional experiences or training predict differential effectiveness with ELL students,
particularly among novice teachers. Prior experience teaching ELL students and specialized training
and certification all hold promise as indicators of differential ELL instructional impact in
mathematics classrooms. The effect sizes we identify are in most cases larger than generic returns to
DIFFERENT SKILLS
26
teacher experience or other established indicators of general teacher ability. Finally, we see mixed
results with regard to other, more foundational teacher characteristics specific to ELLs. Teachers’
motivation to teach in schools with more ELLs is predictive of differential effectiveness with ELLs.
In contrast, teachers’ own language fluency in ELLs’ home language is not, by itself, predictive of
differential effectiveness in math instruction.
These findings provide evidence that closing the ELL achievement gap may benefit not only
from a focus on enlisting or training generically ‘better’ teachers for ELL classrooms, but also from
greater attention to those instructional skills and characteristics most relevant to ELL instruction. In
particular, the improvement in ELL effectiveness among teachers who gain experience teaching
ELL students provides credible evidence that a distinct skill-set is valuable for teaching math to
ELLs and that these skills can be learned through practice. In the cases of specialized certification or
pre-service and in-service training, we cannot definitively distinguish between those preparation
experiences that may have increased teachers’ instructional expertise at ELL instruction from those
that may simply help to sort teachers with differential ability, motivation, or programmatic supports
to teach ELL students. That said, in line with our findings about on-the-job experience, it is certainly
plausible that these types of ELL-specific training experiences also directly support teacher learning.
Separately, the observed association between differential effectiveness and teachers’ preferences to
teach ELL students suggests that teacher motivation or affinity may also be important factors in the
assignment and hiring of ELL teachers.
These results are not the first to suggest that teachers are important. Studies of instructional
practices are, by nature, studies of teachers and teaching. However, this study makes a number of
contributions to the existing research. First, it is the first study that we know of to compare the
effects of teacher characteristics on ELLs and non-ELLs, directly assessing whether there are
characteristics that predict differentially better outcomes for ELLs. A few prior studies have looked

DIFFERENT SKILLS
27
at the effects of teachers or teaching on ELLs but not at their relative effectiveness. The importance
of this aspect of our study is that it highlights that some experiences - such as practice teaching
ELLs and professional development specific to ELLs - are particularly important for teachers of
ELL students. While many teachers who are effective with English proficient students may also be
effective with ELLs, there are some skills that are more important for teaching ELL students and
these skills can be developed. Second, this study is a far larger scale study than most other studies of
teachers than earlier studies. For example, in the experimental study of the SIOP intervention there
were approximately 550 students (Short et al., 2011), while in this study we include more than 24,000
ELLs. There are many examples of interventions that work on a small scale that do not work on a
large scale. The associations that we find - for example, the relationships between learning and
experience - provide some evidence that large scale interventions have the potential to support math
learning for ELL students. Finally, while our methods do not completely rule out potential biases, by
comparing teachers within schools and students within classrooms, they provide more convincing
evidence of relationships between teacher characteristics and student achievement for ELLs than
prior studies that have used school average teacher characteristics or other correlational approaches.
While these results suggest that ELL-specific instructional practice and training may be
worthwhile investments, more research is needed to better understand which specific skills are most
relevant for supporting academic achievement among English language learners. First, while our
methodology is a step in the right direction for estimating causal effects of teachers on students, it
has a number of limitations. Most importantly, there may be omitted characteristics of teachers that
are related to the measures that we use and that drive the relationship with achievement. For
example, we do not know whether students were in an English as a second language or bilingual
program. Unfortunately, that information is not available to us. Further research could distinguish
the teacher and program effects more clearly. In addition to methodological drawbacks, our

DIFFERENT SKILLS
28
measures of teacher characteristics are relatively blunt. As an example, we use one measure of years
of teaching experience and another of years of teaching experience with at least six ELLs in the
class. This distinction turns out to be an important one. However, as a number of recent studies
point out, the effects of experience can vary depending on the type of experience (Ronfeldt,
forthcoming; NCATE, 2012). Our understanding of the importance of teaching experience for
ELLs would benefit from clearer measures of the teachers' experiences including information on the
opportunities they had to observe other teachers and the feedback they received on their own
teaching.
A significant body of theory exists recommending elements of effective ELL instruction, but
little evidence exists to test these assertions. Which important teacher practices are developed
through experience teaching ELLs? What, if any, key skills can be reliably developed through
training to improve instructional efficacy with ELLs? How important are motivation and awareness
of ELL students’ unique needs within heterogeneous classroom settings? Research that attends to
the learning gains of ELL students in particular and that examines specific instructional
interventions over time to directly assess improvement in teacher effectiveness with ELL students
could inform instructional decisions and reduce the gap in achievement between English learners
and other students. This study helps to lay the groundwork for additional exploration of these
topics, and our results indicate that such investigation may yield valuable insights for closing the
ELL achievement gap.

DIFFERENT SKILLS
29
Tables
TABLE 1 Percentage of students who are ELLs and standardized math test scores in New York City, by year
Year
Total
2002 2003 2004 2005 2006 2007 2008
Percentage of students who are ELLs 11.2
7.8 10.8 10.8 12.0 11.7 12.8 13.0
Percentage ELLs in each grade of study
Grade 4 11.9
6.9 10.2 10.3 13.2 12.3 15.9 15.7
Grade 5 10.5
6.5 10.0 11.1 10.4 11.1 12.1 13.1
Grade 6 10.8
7.5 9.9 10.6 12.5 10.7 11.7 12.4
Grade 7 11.1
8.5 10.9 10.5 12.3 12.1 11.2 12.1
Grade 8 11.5
8.8 12.5 11.1 11.8 12.2 12.5 11.4
Standardized math test scores -0.635 -0.642 -0.696 -0.664 -0.649 -0.604 -0.614 -0.585 Note: ELL = English language learner.
Table 2 Race/ethnicity and Free and reduced price lunch status, by ELL status
ELLs
Non-ELLs
White 7%
15% Black 6%
36%
Hispanic 70%
35%
Asian 18%
13%
Other race/ethnicity 0% 1%
Free or reduced price lunch status 76%
68% Note: ELL = English language learner. Data shown are for students in grades 4 through 8, from SY 2002 to SY 2008.
TABLE 3 Distribution of ELLs across math classrooms
% ELLs in the class
% FRPL status
% Hispanic
% Asian
% Black
% of all ELLs at or below percentile
(builds)
Mean across all classrooms 11 61 39 14 33 n/a
% of ELLs in Class, Percentiles
25th percentile 0 56 29 14 38 0
50th percentile 3 55 33 16 31 1
75th percentile 9 68 40 10 39 15
90th percentile 40 70 60 17 13 37
95th percentile 94 73 78 15 3 56 Note: ELL = English language learner; FRPL = Free or reduced price lunch. Students in grades 4 through 8, SY 2002 to SY 2008.

DIFFERENT SKILLS
30
TABLE 4 Characteristics of teachers serving ELL and non-ELL students in math classrooms, district-wide
% Taught by Teachers with 1 or
2 Years of Experience
Initial LAST Scores
(Std. Dev.)
% Taught by Teachers with
ESL Certification
% Taught by Teachers with Bilingual Ed. Certification
% Taught by Teachers Fluent in Spanish+
Mean across NYC 25.2 243 (30.2) 1.6 4.0 14.5
Mean for ELLs* 23.7 237 (33.8) 6.6 21.7 38.8
Mean for non-ELLs* 25.7 246 (29.6) 1.0 1.7 11.7
Note: LAST = Liberal Arts and Sciences Test. ESL = English as a Second Language. ELL = English language learner. Data shown are for students in grades 4 through 8, from SY 2002 to SY 2008. Of all math teachers with either ESL or bilingual education certification, 6% possessed both types of certification. +Data on Spanish fluency reflects available survey data from SY 2005 reported by first-year teachers, and is detailed for Hispanic ELLs, in comparison to all other students. Percent fluent here is assessed within the population of students taught by first-year teachers who responded to the survey.
TABLE 5 Responses and Number of respondents for first-year teacher survey questions of interest
% Yes Total N
1. Self-identified as fluent in Spanish 15.7 1185
2. Pre-service opportunity to learn instructional strategies for teaching ELLs: “explored in some depth” or “extensively”
14.1 1210
3. Number of hours of in-service PD focused on ELL instruction by mid-year: more than 9 hours 13.9 1202
4. Preparedness at the start of the year to teach ELLs: “prepared” or “very well prepared” 9.1 1092
5. Preference to teach at a school with many ELLs: “prefer” or “strongly prefer” a site with many ELLs 15.2 1202 Note: ELL = English language learner. Data shown are from math teacher respondents in their first year of teaching in NYC schools in SY2005.

DIFFERENT SKILLS
31
TABLE 6a The Relationship Between Teachers’ Experience and Teachers' Test Results and ELL versus non-ELL
Student Test Performance
ELL Students Non-ELL Students
Teacher initially failed the LAST exam – (1) 0.012 -0.014***
(0.009) (0.004) 2nd year teaching in NYC 0.056*** 0.057***
(0.011) (0.004) 3rd year teaching in NYC 0.091*** 0.076***
(0.011) (0.004) 4th year teaching in NYC 0.089*** 0.093***
(0.012) (0.004) 5th year teaching in NYC 0.092*** 0.098***
(0.012) (0.005) 6th year teaching in NYC 0.086*** 0.097***
(0.014) (0.005) 7th year teaching in NYC 0.079*** 0.094***
(0.015) (0.006) 8th year teaching in NYC 0.058*** 0.082***
(0.015) (0.006) 9th year teaching in NYC 0.068*** 0.088***
(0.016) (0.007) 10 or more years teaching in NYC 0.076*** 0.07***
(0.013) (0.006)
Observations 126,968 1,246,773
Number of Schools 1,060 1,097
R^2 0.459 0.549
p(F) comparison of ELL and non-ELL models for (1) above 0.003** Note: LAST = Liberal Arts and Science Test; NYC = New York City; ELL = English language learner. ~p<.1, *p < .05, **p < .01, ***p < .001. Data shown are for students in grades 4 through 8, from SY2002 to SY 2008. Model includes controls for student prior test performance and demographic characteristics, comparable classroom average characteristics (including percent of students designated as ELLs), teacher’s race, and individual year, grade and school fixed effects, as detailed in Appendix Table 1.

DIFFERENT SKILLS
32
TABLE 6b The Relationship Between Teachers’ Experience and Teachers' Test Results and ELL versus non-ELL Relative Test Performance Within their
Classrooms
ELL versus Non-ELL Achievement Gap
ELL versus Non-ELL Achievement Gap
Teacher initially failed the LAST exam x ELLs 0.005 6th year teaching in NYC x ELLs -0.005
(0.005) (0.009)
2nd year teaching in NYC x ELLs -0.002 7th year teaching in NYC x ELLs -0.005
(0.007) (0.010)
3rd year teaching in NYC x ELLs 0.007 8th year teaching in NYC x ELLs -0.003
(0.008) (0.011)
4th year teaching in NYC x ELLs -0.001 9th year teaching in NYC x ELLs -0.004
(0.008) (0.012)
5th year teaching in NYC x ELLs (0.004 10 or more years teaching in NYC x ELLs 0.029**
(0.009) (0.009)
Observations 1,051,374 Number of Teachers 15,403
R^2 0.533 Note: LAST = Liberal Arts and Science Test; NYC = New York City; ELL = English language learner. ~p<.1, *p < .05, **p < .01, ***p < .001. Data shown are for students in grades 4 through 8, from SY2002 to SY 2008. Model includes controls for student prior performance and demographic characteristics, comparable classroom average characteristics (including percent of students designated as ELLs), teacher’s race, and individual year, grade and school fixed effects, as detailed in Appendix Table 1.
DIFFERENT SKILLS
33
TABLE 7a
The Relationship Between Teachers' Prior Experience Teaching ELL Students and Student Test Performance
ELL Students
Non-ELL Students
All teachers
2nd year teachers
3rd year or higher
Frequent Experience
All teachers
2nd year teachers
3rd year or higher
Frequent Experience
# of ELL students taught this year 0.000 -0.002* 0.000 0.000 -0.001*** -0.002*** -0.001*** -0.002**
(0.000) (0.001) (0.000) (0.001) (0.000) (0.001) (0.000) (0.000)
>6 ELL students taught last year - (1) 0.024** 0.069*** 0.015~ 0.010* 0.012 0.008~
(0.007) (0.019) (0.008) (0.005) (0.012) (0.005)
>6 ELL students in 1 of the last 5 years - (2) 0.013
0.013 (0.012)
(0.008)
>6 ELL students in 2 of the last 5 years - (3) 0.003
0.000 (0.017)
(0.013)
>6 ELL students in 3 of the last 5 years - (4) 0.048
0.031 (0.034)
(0.024)
>6 ELL students in 4 of the last 5 years - (5) 0.067~
0.020 (0.052)
(0.039)
>6 ELL students in 5 of the last 5 years - (6) -0.075
-0.066
(0.060) (0.011)
Observations 140,401 19,308 121,093 64,551 922,536 146,115 776,421 442,065 Number of Schools 1,059 883 1,054 1,027 1,067 914 1,062 1,045 R^2 0.465 0.459 0.467 0.464 0.552 0.537 0.553 0.538
p(F) comparison of ELL and non-ELL for (1) 0.072~ 0.004** 0.421 p(F) comparison of ELL and non-ELL for (2) 0.975 p(F) comparison of ELL and non-ELL for (3) 0.880 p(F) comparison of ELL and non-ELL for (4) 0.636 p(F) comparison of ELL and non-ELL for (5) 0.361 p(F) comparison of ELL and non-ELL for (6) 0.936 Note: ELL = English language learner. ~p<.1, *p < .05, **p < .01, ***p < .001. By definition, all models exclude first year teachers. Model includes controls for student prior performance and demographic characteristics, comparable classroom average characteristics (including percent of students designated as ELLs), teacher's race, LAST scores, and experience, and individual year, grade and school fixed effects, as detailed in Appendix Table 1. Model assessing frequent experience with ELLs includes teachers with 6 or fewer years of experience whose first year of teaching in NYC was on or after SY2001, with controls shown for the total number of years in which a teacher taught >6 ELL students.
DIFFERENT SKILLS
34
TABLE 7b
The Relationship Between Teachers’ Prior Experience Teaching ELLs and ELL versus non-ELL Relative Test Performance within their Classrooms
ELL versus Non-ELL Achievement Gap ELL versus Non-ELL Achievement Gap
2nd Year Teachers
3rd Year or Higher
Frequent Experience
2nd Year Teachers
3rd Year or Higher
Frequent Experience
ELL Student -0.093*** -0.107*** -0.103*** >6 ELLs in 2 of 5 years
-0.025***
(0.006) (0.004) (0.005)
(0.005)
2nd
year of teaching in NYC 0.037
>6 ELLs in 2 of 5 years x ELL
0.034**
(0.024)
(0.010)
2nd
year teaching in NYC x ELL -0.012~
>6 ELLs in 3 of 5 years
0.022*
(0.007)
(0.010)
# of ELLs taught this year -0.002*** -0.003*** -0.001*** >6 ELLs in 3 of 5 years x ELL
-0.001
(0.000) (0.000) (0.000)
(0.017)
# of ELLs taught this year x ELL 0.001*** 0.003*** 0.003*** >6 ELLs in 4 of 5 years
0.053*
(0.000) (0.000) (0.000)
(0.024)
>6 ELLs taught in prior year -0.009 0.008***
>6 ELLs in 4 of 5 years x ELL
0.026
(0.006) (0.002)
(0.035)
>6 ELLs taught in prior year x ELL 0.031** -0.004
>6 ELLs in 5 of 5 years
-0.134*
(0.011) (0.005)
(0.055)
>6 ELLs in 1 of the last 5 years
0.000 >6 ELLs in 5 of 5 years x ELL
0.001
(0.003)
(0.084)
>6 ELLs in 1 of 5 years x ELL
0.015*
(0.007)
Observations 470,426 1,410,524 925,047
Number of Teachers 10,093 16,816 11,703
R^2 0.497 0.508 0.515 Note: NYC = New York City; ELL = English language learner. ~p<.1, *p < .05, **p < .01, ***p < .001. Models include controls for student prior performance and demographic characteristics, comparable classroom average characteristics (including percent and number of students designated as ELLs), teacher's race, LAST scores, and experience, and individual year and grade fixed effects, as detailed in Appendix 1 Table 1. Model assessing frequent experience with ELLs includes teachers with 6 or fewer years of experience whose first year of teaching in NYC was on or after SY2001, with controls shown for the total number of years in which a teacher taught >6 ELL students.

DIFFERENT SKILLS
35
TABLE 8a
The Relationship Between Teachers’ ELL-specific Training Experiences and ELL versus Non-ELL Student Test Performance
ELL Students Non-ELL Students
Pre-service training
In-service training
In-service (in ‘05)
Reported readiness
Pre-service training
In-service training
In-service (in '05)
Reported readiness
ELL-specific pre-service training – (1) 0.090* 0.093* 0.027 -0.035 0.014 0.016
(0.037) (0.045) (0.098) (0.027) (0.026) (0.040)
ELL-specific in-service PD– (2) 0.003 -0.120***
(0.040) (0.031)
ELL-specific PD, same year effects – (3) 0.294*** -0.112*
(0.089) (0.053)
Reported readiness to teach ELLs – (4) -0.061 0.029 0.101* -0.027 0.103~ -0.061
(0.064) (0.126) (0.051) (0.35) (0.062) (0.037)
Observations 7,051 6,121 1,774 6,555 38,233 31,131 10,131 16,724
Number of Schools 441 404 240 416 436 400 232 412
R^2 0.481 0.480 0.464 0.480 0.532 0.532 0.545 0.534
p(F) comparison of ELL and non-ELL for (1)
0.001***
p(F) comparison of ELL and non-ELL for (2)
0.011*
p(F) comparison of ELL and non-ELL for (3)
0.000***
p(F) comparison of ELL and non-ELL for (4)
0.0021**
Note: ELL = English language learner. ~p<.1, *p < .05, **p < .01, ***p < .001. Models include controls for student prior performance and demographic characteristics, comparable classroom average characteristics (including percent of students designated as ELLs), teacher's race, LAST scores, and experience, and individual year, grade and school fixed effects, as detailed in Appendix 1 Table 1. In-service training models also control for reported prior levels of pre-service training, any ESL certification, and readiness to teach ELLs as of the start of the school year.

DIFFERENT SKILLS
36
TABLE 8b
The Relationship Between Teachers’ ELL-specific Training Experiences and ELL versus non-ELL Relative Test Performance within their Classrooms
ELL versus Non-ELL Achievement Gap
Pre-service training
In-service training
In-service (’05)
Reported readiness
ELL-specific pre-service training x ELL 0.091* 0.042 -0.062
(0.038) (0.050) (0.102)
ELL-specific in-service PD x ELL 0.043
(0.056)
ELL-specific PD x ELL, same year effects 0.226*
(0.129)
Reported initial readiness to teach ELLs -0.043 -0.216 0.084
(0.072) (0.157) (0.056)
Observations 45,807 44,877 13,800 45,243
Number of Teachers 702 697 401 698
R^2 0.538 0.536 0.532 0.537
Note: NYC = New York City; ELL = English language learner. ~p<.1, *p < .05, **p < .01, ***p < .001. Note: ELL = English language learner. ~p<.1, *p < .05, **p < .01, ***p < .001. Models include controls for student prior performance and demographic characteristics, comparable classroom average characteristics (including percent and number of students designated as ELLs), teacher's race, LAST scores, and experience, individual year and grade fixed effects, and individual school fixed effects interacted with ELL status, as detailed in Appendix 1 Table 1. In-service training models also control for reported prior levels of pre-service training, any ESL certification, and readiness to teach ELLs as of the start of the school year.

DIFFERENT SKILLS
37
TABLE 9a
The Relationship Between Teachers with ELL-specific Certification or from Alternate Pathways and ELL versus non-ELL Student Test Performance
ELL Students Non-ELL Students
All teachers
Novices (<=3yrs)
Novices, ES
Novices, MS
All teachers
Novices (<=3yrs)
Novices, ES
Novices, MS
ESL Certification – (1) 0.064** 0.066* 0.058 0.064 0.033 -0.068* -0.065~ -0.135~
(0.020) (0.032) (0.037) (0.081) (0.025) (0.034) (0.036) (0.078)
Bilingual Education Certification – (2) 0.023 -0.019 -0.021 -0.010 0.046* 0.052~ 0.052 0.050
(0.019) (0.029) (0.035) (0.052) (0.018) (0.028) (0.034) (0.052)
TFA – (3) 0.073*** 0.085*** 0.044 0.120*** 0.033* 0.030~ 0.000 0.048*
(0.022) (0.024) (0.033) (0.035) (0.015) (0.017) (0.024) (0.022)
NYCTF – (4) -0.009 -0.003 0.003 0.008 -0.006 -0.015~ -0.034* -0.006
(0.012) (0.015) (0.023) (0.020) (0.007) (0.009) (0.016) (0.011)
Observations 78,398 32,841 15,579 17,262 446,099 190,660 62,598 128,062
Number of Schools 973 892 668 335 973 891 666 335
R^2 0.468 0.464 0.483 0.458 0.534 0.532 0.495 0.555
p(F) comparison of ELL and non-ELL models for (1)
0.265 0.001** 0.007** 0.107
p(F) comparison of ELL and non-ELL models for (2)
0.322 0.048* 0.082~ 0.374
p(F) comparison of ELL and non-ELL models for (3)
0.075~ 0.026* 0.189 0.039*
p(F) comparison of ELL and non-ELL models for (4)
0.815 0.241 0.126 0.474
Note: Novice teachers defined as <=3 years of teaching experience in NYC. ES = Elementary School Grades 4 and 5, MS = Middle School Grades 6, 7, and 8; ESL = English as a Second Language; TFA = Teach for America; NYCTF = New York City Teaching Fellows; ELL = English language learner. ~p<.1, *p < .05, **p < .01, ***p < .001. Models include controls for student prior performance and demographic characteristics, comparable classroom average characteristics (including percent of students designated as ELLs), teacher's race, LAST scores, and experience, and individual year, grade and school fixed effects, as detailed in Appendix Table 1.
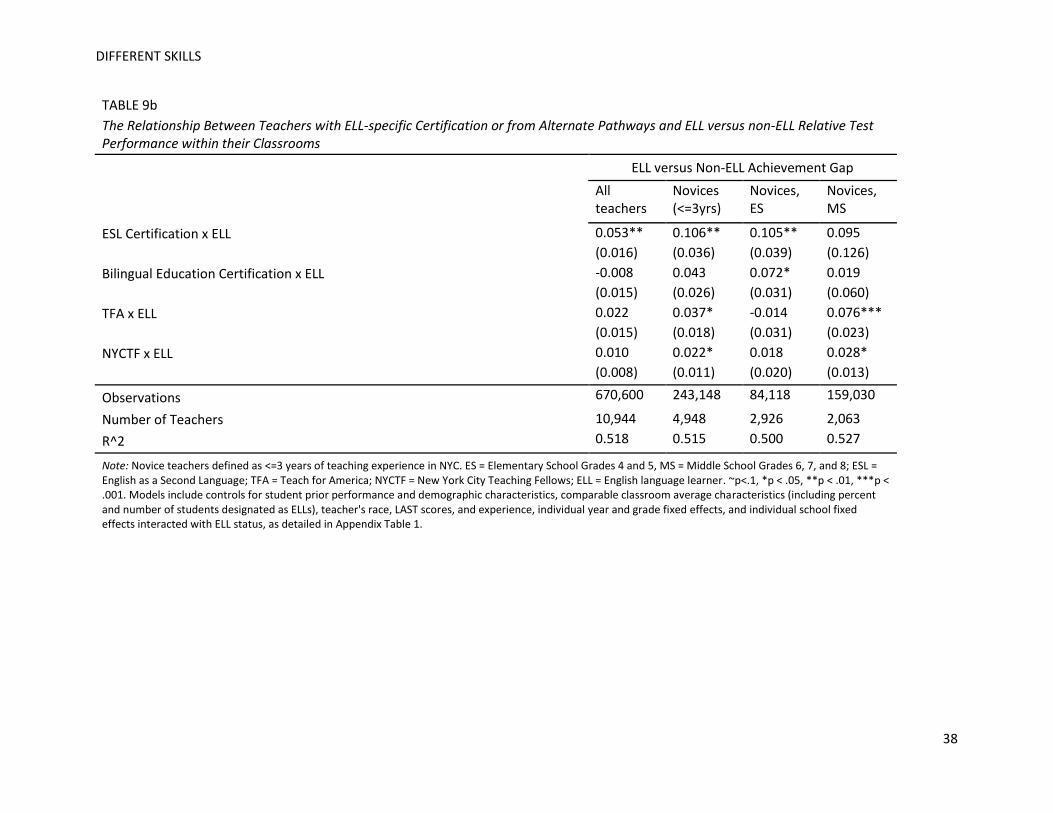
DIFFERENT SKILLS
38
TABLE 9b
The Relationship Between Teachers with ELL-specific Certification or from Alternate Pathways and ELL versus non-ELL Relative Test Performance within their Classrooms
ELL versus Non-ELL Achievement Gap
All teachers
Novices (<=3yrs)
Novices, ES
Novices, MS
ESL Certification x ELL 0.053** 0.106** 0.105** 0.095
(0.016) (0.036) (0.039) (0.126)
Bilingual Education Certification x ELL -0.008 0.043 0.072* 0.019
(0.015) (0.026) (0.031) (0.060)
TFA x ELL 0.022 0.037* -0.014 0.076***
(0.015) (0.018) (0.031) (0.023)
NYCTF x ELL 0.010 0.022* 0.018 0.028*
(0.008) (0.011) (0.020) (0.013)
Observations 670,600 243,148 84,118 159,030
Number of Teachers 10,944 4,948 2,926 2,063
R^2 0.518 0.515 0.500 0.527
Note: Novice teachers defined as <=3 years of teaching experience in NYC. ES = Elementary School Grades 4 and 5, MS = Middle School Grades 6, 7, and 8; ESL = English as a Second Language; TFA = Teach for America; NYCTF = New York City Teaching Fellows; ELL = English language learner. ~p<.1, *p < .05, **p < .01, ***p < .001. Models include controls for student prior performance and demographic characteristics, comparable classroom average characteristics (including percent and number of students designated as ELLs), teacher's race, LAST scores, and experience, individual year and grade fixed effects, and individual school fixed effects interacted with ELL status, as detailed in Appendix Table 1.

DIFFERENT SKILLS
39
TABLE 10a
The Relationship Between Teachers’ Background Characteristics and ELL versus non-ELL Student Test Performance
Hispanic ELL versus
Others ELL versus non-ELL
Hispanic ELL
All Other Students
ELL Students
Non-ELL Students
Native fluency in Spanish – (1) 0.005 0.018
(0.038) (0.039)
Non-native fluency in Spanish – (2) 0.031 0.028
(0.046) (0.050)
Preference to teach at school site with ELLs – (3) 0.120*** 0.019 (0.036) (0.029)
Observations 4,883 31,045 6,994 37,853 Number of Schools 384 381 438 432 R^2 0.452 0.536 0.482 0.531
p(F) comparison of Hispanic ELL and Other Students for (1) 0.985 p(F) comparison of Hispanic ELL and Other Students for (2) 0.526 p(F) comparison of ELL and non-ELL models for (3) 0.009** Note: LAST = Liberal Arts and Science Test; NYC = New York City; ELL = English language learner. ~p<.1, *p < .05, **p < .01, ***p < .001. Models include controls for student prior performance and demographic characteristics, comparable classroom average characteristics (including percent of students designated as ELLs), teacher's race, LAST scores, and experience, and individual year, grade and school fixed effects, as detailed in Appendix Table 1.

DIFFERENT SKILLS
40
TABLE 10b
The Relationship Between Teachers’ Background Characteristics and ELL versus non-ELL Relative Test Performance Within their Classrooms
Achievement Gaps
Hispanic ELL versus
others ELL versus non-ELL
Native fluency in Spanish x Hispanic ELL 0.023
(0.048)
Non-native fluency in Spanish x Hispanic ELL 0.034
(0.056)
Preference to teach at school site with ELLs x ELL 0.094* (0.041)
Observations 37,018 45,750 Number of Teachers 607 702 R^2 0.540 0.538 Note: ELL = English language learner. ~p<.1, *p < .05, **p < .01, ***p < .001. Models include controls for student prior performance and demographic characteristics, comparable classroom average characteristics (including percent and number of students designated as ELLs), teacher's race, LAST scores, and experience, individual year and grade fixed effects, and individual school fixed effects interacted with ELL or Hispanic ELL status, as detailed in Appendix Table 1.

DIFFERENT SKILLS
41
Appendix 1 TABLE 1 Summary of Control Covariates Included in Each Model
Within-school, Teacher
Characteristics
Within-teacher, Teacher
Characteristics
Within-school, Experience with ELLs
Within-teacher, Experience with
ELLs
Within-school, Spanish fluency
Within-teacher, Spanish fluency
Specification Checks, Predicting
Student Assignment
[Separate models for ELL
& non-ELL]
[ELL versus non-ELL achievement]
[Separate models for ELL & non-
ELL]
[ELL versus non-ELL achievement]
[Separate models for Hisp ELL &
non-ELL]
[Hisp. ELL versus non-ELL
achievement]
[Both within-teacher and within-school
models]
Student
Prior-year math (z-score) x x x x x x x
Prior-year math z-score, squared x x x x x x
Gender x x x x x x
Free Lunch x x x x x x x
Prior-year absences x x x x x x x
Prior-year suspensions x x x x x x
Race (Black, Hispanic, Asian) x x x x x x
Home language non-Eng. (non-ELL) x x x x x x
Classroom
Avg. of prior-year math scores x x x x x x
SD of prior-year math scores x x x x x x
Race and ELL proportions x x x x x x
Prior year-absences x x x x x x
Prior-year suspensions x x x x x x
Free Lunch proportion x x x x x x
Teacher
Years of experience in NYC x x x x x x
Teacher Race x x x x x x
Initial score on the LAST exam x x x x X x
Current # of ELLs taught x x
Cohort
Year effects x x x x X x x
Grade effects x x x x X x x
Interactions
School IDs by ELL status x x x (within teacher only)
Note: In school fixed effects models, standard errors are clustered at the teacher level. ELL = English language learner.
DIFFERENT SKILLS
42
Appendix 2 – Specification Checks
In order to better assess the robustness of our findings in light of potential limitations, we
consider a variety of secondary analyses and specification checks.
Identifying ELL students. Many ELL students in our sample are at some point
reclassified as non-ELLs. However, initially following reclassification they may still be more similar
to ELL students than to non-ELL students, and may be intentionally assigned in non-random ways
into classrooms based on those similarities. To assess whether this may have biased our results, we
replicate all of the analyses related to our questions of interest using alternative definitions of ELL
status: either including in the ELL category students who were reclassified as non-ELLs in the prior
year, or including in the ELL category students who had ever been classified as ELLs.
Using these alternate definitions of ELL status produces results in line with our expectations.
In general, model runs using a prior-year ELL definition produce similar, but slightly attenuated
findings for all of our research questions of interest. Model runs using the more conservative
definition of ELLs as any student ever classified also yield the same general findings, but with
greater attenuation. As a representative example, the effect size of the within-school ELL student
learning advantage associated with pre-service teacher preparation, reported as 0.090 in Table 8a,
was reduced to 0.078 under the first alternate definition of ELL students, and then to .049 under the
most conservative alternative definition of ELL students. Other model runs yield comparable and
similarly predictable trends in terms of attenuation of findings.
Exploring attrition relevant to experience with ELLs. As shown in Tables 7a and 7b, we
see significant differential returns to prior experience teaching ELLs among second year teachers.
However, if first year teachers of ELL students differ markedly in their attrition out of teaching in
ways that are related to their instructional effectiveness with ELL students, that could bias our
findings. To investigate possible bias related to attrition effects, we examine two areas of concern.

DIFFERENT SKILLS
43
First, we might be concerned if those teachers who taught ELL students in their first year and who
did not attrite from our sample between their first and second year of teaching were already
differentially more effective with ELL students in their first year of teaching. Second, we might be
concerned if those teachers who taught ELL students in their first year of teaching and who did
attrite from our sample after their first year of teaching were differentially worse with ELL students.
In both potential areas of concern, our analyses indicate no evidence of bias stemming from attrition
effects. We do not include the results here for reason of space, but are happy to do so at request.
Differential “pre-treatment” assignment of ELL and non-ELL students. Finally, we
investigate non-random sorting of ELL and non-ELL students to teachers in ways that are
associated with our teacher characteristics of interest. Given our lack of experimental design, we do
not expect to see a randomized assignment of students to our “treatment” teachers. To account for
non-random sorting, we explicitly control for a range of observable controls associated with student
achievement, including prior achievement. However, by identifying whether observable student
characteristics that we know to be associated with student ability are different between “treatment”
and comparison teachers at the time of assignment, we can spotlight instances where our
methodology is less likely to have eliminated bias and in which we are more reliant on our
observable controls.
Both our within-school and within-teacher model specifications eliminate student
assignment bias that occurs similarly for both ELL and non-ELL students of treatment teachers.
However, they do not eliminate bias in cases where the ELL and non-ELL students assigned to
these teachers differ systematically in their ability. Evidence of consistent assignment of higher-
ability ELL students or lower-ability non-ELL students to teachers with our characteristics of
interest would thus be potentially problematic. In order to investigate assignment of students by
teacher characteristics, we fit within-school and within-teacher models predicting each teacher

DIFFERENT SKILLS
44
characteristic of interest (e.g. ESL certification, pre-service training, etc.) as a function of ability-
related student characteristics that were determined prior to assignment to those teachers (i.e. prior-
year test scores, free/reduced price lunch status, and prior-year absences).
In our school fixed effects specification checks detailed in Appendix 2 Table 1a, some
significant differential sorting is apparent for teacher characteristics related to prior experience with
ELL students, ELL-specific in-service PD in the same year, preferences to teach at a school site with
many ELL students, bilingual certification, and teacher fluency in Spanish. The largest degree of bias
is among bilingual certified teachers. However, in each case the direction of sorting bias suggests
that our ELL students of interest may possess lower initial ability. Thus, if our control covariates fail
to control for the apparent differential initial ability in these cases, our estimated effect sizes for the
benefits of these teacher characteristics for ELL instruction may be overly conservative.
Our teacher fixed effects specification checks in Appendix 2 Table 1b show a slightly
different pattern of differential sorting. Here, we continue to see some evidence of differential ELL
versus non-ELL bias associated with prior experience with ELL students, ELL-specific PD, and
bilingual certification, in the same direction as for the school fixed effects specification checks.
However, ESL certified novice teachers do show some evidence of assignment to classrooms with
lower initial achievement and free/reduced lunch rate gaps between ELL and non-ELL students.
Similarly, teachers with a preference to teach at school sites with ELLs appear to receive ELL
students that are less likely to be classified as receiving free/reduced price lunch. For these two
groups, some caution is warranted in interpreting our within-teacher effect sizes, as we rely more
explicitly on our observable controls to account for differences in initial student academic ability,
and any lingering bias might inflate estimates. Overall, the variation in non-random student sorting
on observable characteristics that we observe across our two model specifications reinforces the
value of attending most to findings that are consistent across both of our analytical approaches.

DIFFERENT SKILLS
45
Appendix 2 TABLE 1a A Series of Specification Checks for Various School Fixed Effects Models: Predicting ELL and non-ELL Pre-treatment Student Assignment
ELL Students
Non-ELL Students
Prior-year test scores
FRPL status Prior-year absences
Prior-year test scores
FRPL status Prior-year absences
Experience with ELLs in prior year, novices – (1) -0.075** -0.009 -0.354~ 0.015 -0.012 0.013 (0.027) (0.012) (0.213) (0.018) (0.010) (0.165)
ELL-specific pre-service training – (2) 0.020 0.008 0.091 0.037 0.031 -0.283 (0.058) (0.017) (0.443) (0.059) (0.021) (0.534)
ELL-specific in-service PD– (3) -0.133* -0.001 -0.041 -0.131*** 0.028 0.929** (0.056) (0.018) (0.517) (0.033) (0.023) (0.336)
ELL-specific PD, same year effects – (4) -0.172~ 0.003 -0.740 0.030 0.066*** 0.151 (0.090) (0.019) (0.997) (0.046) (0.015) (0.569)
Reported initial readiness to teach ELLs – (5) -0.190** 0.038 0.145 -0.132* 0.073** 0.196 (0.060) (0.024) (0.542) (0.062) (0.026) (0.418)
ESL certification, novice teachers – (6) -0.054 0.012 -0.147 -0.082~ 0.028 -0.433 (0.036) (0.016) (0.278) (0.044) (0.022) (0.394)
Bilingual Education certification, novice teachers – (7) -0.166*** 0.006 -0.646 0.055 -0.034* -1.260***
(0.033) (0.010) (0.247) (0.035) (0.017) (0.336)
Preference to teach at school site with ELLs – (8) -0.155** 0.000 0.298 -0.030 0.016 -0.412 (0.053) (0.017) (0.392) (0.053) (0.021) (0.449)
Native or non-native fluency in Spanish – (9) -0.048 -0.019 -0.723 0.115** -0.042* -0.917** (0.051) (0.016) (0.568) (0.041) (0.020) (0.321)
p(F) comparison of ELL and non-ELL models for (1) 0.003** 0.425 0.087 p(F) comparison of ELL and non-ELL models for (2) 0.417 0.198 0.295 p(F) comparison of ELL and non-ELL models for (3) 0.488 0.161 0.058~ p(F) comparison of ELL and non-ELL models for (4) 0.023* 0.005** 0.218 p(F) comparison of ELL and non-ELL models for (5) 0.251 0.161 0.472 p(F) comparison of ELL and non-ELL models for (6) 0.312 0.278 0.278 p(F) comparison of ELL and non-ELL models for (7) 0.000*** 0.021* 0.071 p(F) comparison of ELL and non-ELL models for (8) 0.048* 0.278 0.117 p(F) comp. of Hispanic ELL vs. others models for (9) 0.006** 0.184 0.382 Note: ELL = English language learner. ESL=English as a Second Language. FRPL = Free or reduced price lunch. ~p<.1, *p < .05, **p < .01, ***p < .001.

DIFFERENT SKILLS
46
Appendix 2 TABLE 1b A Series of Specification Checks for Various Teacher Fixed Effects Models: Predicting ELL and non-ELL Pre-
treatment Student Assignment
ELL Versus non-ELL Relative Gaps
Prior-year test scores
FRPL status Prior-year absences
Experience with ELLs in prior year, novices – (1) -0.078*** 0.022*** 0.296 (0.015) (0.006) (0.223)
ELL-specific pre-service training – (2) 0.025 -0.029 0.003 (0.051) (0.026) (0.738)
ELL-specific in-service PD– (3) -0.136* -0.014 0.072 (0.064) (0.033) (0.926)
ELL-specific PD, same year effects – (4) -0.305* -0.031 1.790 (0.128) (0.063) (1.894)
Reported initial readiness to teach ELLs – (5) -0.026 -0.027 0.246 (0.075) (0.038) (1.086)
ESL certification, novice teachers – (6) 0.101* -0.48* 0.369 (0.049) (0.024) (0.753)
Bilingual Education certification, novice teachers – (7) -0.102** 0,030~ 1.504** (0.036) (0,018) (0.544)
Preference to teach at school site with ELLs – (8) -0.026 -0.066* 1.074 (0.057) (0.029) (0.822)
Native or non-native fluency in Spanish+ – (9) -0.046 0.012 -0.137 (0.053) (0.027) (0.776)
Note: ELL = English language learner. ESL = English as a Second Language. *p < .05, **p < .01, ***p < .001.
+Spanish fluency model reflects Hispanic ELL versus other student results

DIFFERENT SKILLS
47
References:
Betts, J., Zau, A., & Rice, L. (2003). Determinants of Student Achievement: New Evidence from San Diego.
San Francisco, CA: Public Policy Institute of California.
Boyd, D., Lankford, H., Loeb, S., Rockoff, J., & Wyckoff, J. (2008). The Narrowing Gap in New
York City Teacher Qualifications and its Implications for Student Achievement in High-
Poverty Schools. Journal of Policy Analysis and Management, 27(4), 793-818.
Boyd, D., Grossman, P., Lankford, H., Loeb, S., & Wyckoff, J. (2009). Teacher Preparation and
Student Achievement. Education Evaluation and Policy Analysis, 31(4), 416-440.
Bunch, G. C. (2010). Preparing mainstream secondary content-area teachers to facilitate English
language learners’ development of academic language. National Society for the Study of Education,
109(2), 351–383.
Bunch, G. C., Aguirre, J. M., & Téllez, K. (2009). Beyond the scores: Using candidate responses on
high stakes performance assessment to inform teacher preparation for English learners. Issues
in Teacher Education, 18(1), 103–127.
Casteel, C.J. & Ballantyne, K.G. (Eds.). (2010). Professional Development in Action: Improving Teaching for
English Learners. Washington, DC: National Clearinghouse for English Language Acquisition.
Available at http://www.ncela.gwu.edu/files/uploads/3/PD_in_Action.pdf
Clotfelter, C.T., Ladd, H.F., & Vigdor, J.L. (2007). How and why do teacher credentials matter for student
achievement? (Working Paper No. 2) Retrieved from National Center for Analysis of
Longitudinal Data in Education Research website:
http://www.caldercenter.org/PDF/1001058_Teacher_Credentials.pdf.
Cloud, N., Genesee, F., & Hamayan, E. (2009). Literacy instruction for English language learners: A teacher’s
guide to research-based practices. Portsmouth, NH: Heinemann.
DIFFERENT SKILLS
48
Dee, T.S. (2005). A teacher like me: Does race, ethnicity, or gender matter? American Economic Review,
95(2), 158–165.
Dixon, Q., Zhao, J., Shin, J., Wu, S., Su, J., Burgess-Brigham, R., Gezer, M., & Snow, C. (2012).
What We Know About Second Language Acquisition. A Synthesis From Four Perspectives.
Review of Educational Research, 82(1), 5-60. doi:10.3102/0034654311433587
Echevarria, J., Vogt, M. E., & Short, D. (2010). Making content comprehensible for secondary English
learners: The SIOP Model. Boston: Allyn and Bacon.
Faltis, C., Arias, M. B., & Ramirez-Marin, F. (2009). Building consensus: Critical competencies for secondary
teachers of English learners. Paper presented at the annual meeting of the Language Minority
Research Institute, Riverside, CA.
Gandara, P., Rumberger, R., Maxwell-Jolly, J. & Callahan, R. (2003). English Learners in California
Schools: Unequal resources, unequal outcomes. Education Policy Analysis Archives, 11(36).
Retrieved from http://epaa.asu.edu/ojs/article/view/264
Garcia, E., Arias, M. B., Murri, N. J. H., & Serna, C. (2010). Developing responsive teachers: A
challenge for a demographic reality. Journal of Teacher Education, 61(1-2), 132-142.
Garrison, L., & Mora, J. K. Adapting Mathematics Instruction for English Language Learners: The
Language-Concept Connections. Changing the Faces of Mathematics: Perspectives on
Latinos (March 1999): 35-48.
Genesee, F., Lindholm-Leary, K., Saunders, W.M., & Christian, D. (2006). Educating English language
learners: A synthesis of research evidence. New York: Cambridge University Press.
Grunow, A. J. (2011). Access to English: resources for Spanish-speaking children’s academic development.
Unpublished thesis submitted to the School of Education at Stanford University. Retrieved
from: http://purl.stanford.edu/mj490dq2140

DIFFERENT SKILLS
49
Gutiérrez, R. (2002). Beyond essentialism: The complexity of language in teaching mathematics to
Latina/o students. American Educational Research Journal, 39(4), 1047–1088.
Hakuta, K., Butler, Y.G., & Witt, D. (2000). How long does it take for English learners to attain proficiency?
Santa Barbara, CA: Linguistic Minority Research Institute.
Hill, H. C., Rowan, B., & Ball, D. L. (2005). Effects of teachers’ mathematical knowledge for
teaching on student achievement. American Education Research Journal, 42(2), 371-406.
Horwitz, A., Uro, G., Price-Baugh, R., Simon, C., Uzzell, R., Lewis, S., & Casserly, M. (2009).
Succeeding with English Language Learners: Lessons Learned from the Great City Schools. Washington,
DC: Council of the Great City Schools.
Ingersoll, R. M., & Strong, M. (2011). The impact of induction and mentoring programs for
beginning teachers: A critical review of the research. Review of Educational Research, 81(2), 201-
233.
Janzen, J. (2008). Teaching English language learners in the content areas. Review of Educational
Research, 78(4), 1010–1038. doi:10.3102/0034654308325580.
Lankford, H., Loeb, S., & Wyckoff, J. (2002). Teacher Sorting and the Plight of Urban Schools: A
Descriptive Analysis. Educational Evaluation and Policy Analysis, 24(1), 37–62.
Lockwood, J. R., & McCaffrey, D. F. (2009). Exploring student-teacher interactions in longitudinal
achievement data. Education Finance and Policy, 4(4), 439-467. doi: 10.1162/edfp.2009.4.4.439
Lucas, T., Villegas, A. M., & Freedson-Gonzalez, M. (2008). Linguistically responsive teacher
education: Preparing classroom teachers to teach English language learners. Teacher Education
Quarterly, 59(4), 361-373.
NCATE (2012). What Makes a Teacher Effective? What Research Says About Teacher Preparation.
Washington, DC: National Council for Accreditation of Teacher Education. Retrieved from
http://www.ncate.org/LinkClick.aspx?fileticket=JFRrmWqa1jU%3d&tabid=361.

DIFFERENT SKILLS
50
Nye, B., Konstantopoulos, S., & Hedges, L. V., (2004). How large are teacher effects?. Educational
Evaluation and Policy Analysis, 26(3), 237–257.
Peske, H., & Haycock, K. (2006). Teaching Inequality: How Poor and Minority Students are Shortchanged on
Teacher Quality. A Report and Recommendations by the Education Trust. Washington, DC: The
Education Trust.
Rice, J. K. (2003). Teacher Quality: Understanding the Effectiveness of Teacher Attributes. Washington, DC:
Economic Policy Institute.
Rivkin, S. G., Hanushek, E. A., & Kain, J. F. (2005). Teachers, schools, and academic achievement.
Econometrica, 73(2), 417–458.
Rockoff, J. (2004). The Impact of Individual Teachers on Student Achievement: Evidence from
Panel Data. American Economic Review, 94(2), 247-252.
Rockoff, J., Jacob, B., Kane, T., and Staiger, D. (forthcoming). Can You Recognize an Effective
Teacher When You Recruit One? Education Finance and Policy.
Rockoff, J. (2008). Does Mentoring Reduce Turnover and Improve Skills of New Employees? Evidence from
Teachers in New York City. National Bureau of Economic Research Working Paper 13868.
Ronfeldt, M. (forthcoming). Where should student teachers learn to teach? Effects of field
placement school characteristics on teacher retention and effectiveness. Education Evaluation
and Policy Analysis.
Sanders, W., & Rivers, J. C. (1996). Cumulative and residual effects of teachers on future student academic
achievement. Knoxville: University of Tennessee Value‐Added Research and Assessment
Center.
Schleppegrell, M. J. (2007). The linguistic challenges of mathematics learning and teaching: A
research review. Reading & Writing Quarterly, 23, 139–159.

DIFFERENT SKILLS
51
Short, D., Fidelman, C., & Louguit, M. (2012). Developing academic language in English language
learners through sheltered instruction. TESOL Quarterly, 46, 333-360.
Short, D., Echevarria, J., & Richards-Tutor, C. (2011). Research on academic literacy development in
sheltered instruction classrooms. Language Teaching Research, 15(3), 363-380.
Slavin, R., & Cheung, A. (2005). A Synthesis of Research on Language of Reading Instruction for
English Language Learners. Review of Education Research, 75(2), 247–84.
Slavin, R., Madden, N., Calderon, M., Chamberlain, A., & Hennessy, M. (2010). Reading and language
outcomes of a five-year randomized evaluation of transitional bilingual education. Baltimore, MD: Johns
Hopkins University.
U.S. Department of Education, National Center for Education Statistics (2011). The Nation’s Report
Card: Mathematics 2011 (NCES 2012-458). Washington, D.C.: Author.
U.S. Department of Education, National Center for Education Statistics (2010). The Condition of
Education. Washington, D.C.: Author.
Wayne, A. J., & Youngs, P., (2003). Teacher characteristics and student achievement gains. Review of
Educational Research, 73(1), 89–122.
Wenglinsky, H. (2002). How schools matter: The link between teacher classroom practices and
student academic performance. Education Policy Analysis Archives, 10(12).
Williams, T., Kirst, M., Haertel, E., Levin, J., Studier, C., et al. (2005). Similar Students, Different Results:
Why Do Some Schools Do Better? A large-scale survey of California elementary schools serving low-income
students. Mountain View, CA: EdSource.
Willig, A. C. (1985). A meta-analysis of selected studies on the effectiveness of bilingual education.
Review of Educational Research, 55(3), 269-317.