dietmar weiss - tendències del mercat i de la producció del sector carni porcí europeu
TRANSCRIPT

AMI -Agrarmarkt
Informationsgesellschaft
The Future of the German and European Pig Meat Sector
Món Sant Benet, 29.09.2011
Dr. Dietmar Weiß
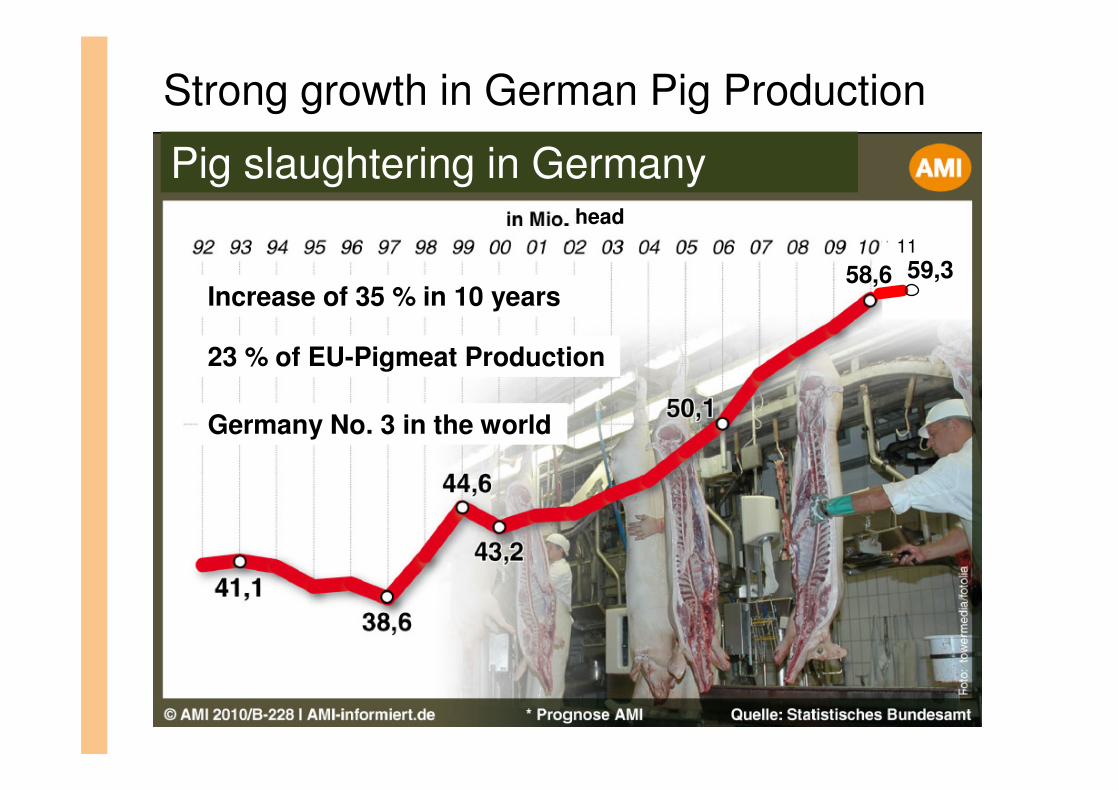
Strong growth in German Pig Production
58,6
Pig slaughtering in Germany
Increase of 35 % in 10 years
head
Germany No. 3 in the world
23 % of EU-Pigmeat Production
1159,3

Main reasons for the growth
Cost advantage of slaughtering and cutting due to low labour costs
Enlargement of the EU 2004
Very competitive and efficient sector with good infrastructure in the main production areas
Strong increase of the live pig import
Import of live pigs

4,52
5,49
6,67
2,15
Consumption
Pigmeat production
Surplus
Production+ Import
Pork production exceeds consumption
Mio. tonnes carcass weight

German Trade with Pigmeat
0
200
400
600
800
1.000
1.200
1.400
1.600
1.800
2.000
2.200
91 92 93 94 95 96 97 98 99 00 01 02 03 04 05 06 07 08 09 10 11
Import
Export
1.000 tonnes cw.

Plans to enlarge slaughter capacity- in the next 2 years -
Tonnies
- Rheda-Wiedenbrück
- Weißenfels
- Sögel
Vion- Emstek
- Lingen
Westfleisch (Group)
Danish Crown Germany
Vogler
Weekly capacity now Weekly capacity future
135.000 180.00090.000 120.00033.000 50.000
38.000 50.00018.000 25.000
122.000 135.000
63.000 80.000
40.000 45.000
Source: Survey of the Chambers of Agriculture April 2011
+ 20 % to 70 Mio. Pigs ??

Too many pigs in some regions
Plan to tighten the building law
Growing resistance of citizens against new / larger stables

Possible exit of piglet producersuntil 2013
0 – 10 %
10 – 20 %
25 – 35 %
20 – 30 % ?
Piglet production will decline less than 4 %!

German pig production depenson live pig imports
3,25,2 4,7
5,0
9,810,4
0,0
2,0
4,0
6,0
8,0
10,0
12,0
14,0
16,0
2005 2006 2007 2008 2009 2010 2011 2013
MillionPiglets
Slaughter Pigs
8,2
15,0 15,1 ??
German import of live pigs

Main challenge in the future:The acceptance of citizens and consumers!
Feel like a pig
No / less meat = Climate protection= healthy diet
Meat production= animal cruelty

Slaughterhouses try to react
! Sustainability !
- Animal welfare labels (from companies, but also label plans of politics)
- Co2 Footprint
- Coming soon: antibiotics, animal transportation, tail docking, ........
- Traceability / regional production

Intensive discussion of animal welfare and sustainability will move southwards

Decrease of the EU sow herd
in 1.000 head
Total 2010 % to Sows 2010 % to gilts %
pigs prev. year prev. Year prev. Year
Germany 26.705 26.509 0,7 2.185 2.243 -2,6 -8,4
Spain 25.479 24.703 3,1 2.336 2.521 -7,3 -5,9
France 13.837 14.142 -2,2 1.144 1.158 -1,2 -4,9
Poland 13.100 13.978 -6,3 1.214 1.393 -12,8 -8,9
Netherlands 12.383 12.250 1,1 1.105 1.090 1,4 10,4
Denmark 11.932 12.208 -2,3 1.264 1.323 -4,5 -7,9
Italy 9.290 9.324 -0,4 673 728 -7,5 -8,8
Romania 4.597 4.701 -2,2 350 360 -2,7 -2,7
UK 4.452 4.460 -0,2 513 501 2,4 4,2
Hungary 3.132 3.208 -2,4 300 319 -6,0 -9,9
Austria 3.049 3.120 -2,3 276 286 -3,6 -7,2
Czech Rep. 1.749 1.909 -8,4 112 133 -15,8 -20,6
Sweden 1.483 1.564 -5,2 151 167 -9,5 -17,3
EU (13 countries) 131.187 132.076 -0,7 11.623 12.221 -4,9 -5,5
EU Pig population, May/June 2011

12.000
13.000
14.000
15.000
16.000
17.000
2001 2003 2005 2007 2009 2011e
Sow population in the EU (Dec.)1.000 head
Less sows in the EU
- 10 %
- 8 %
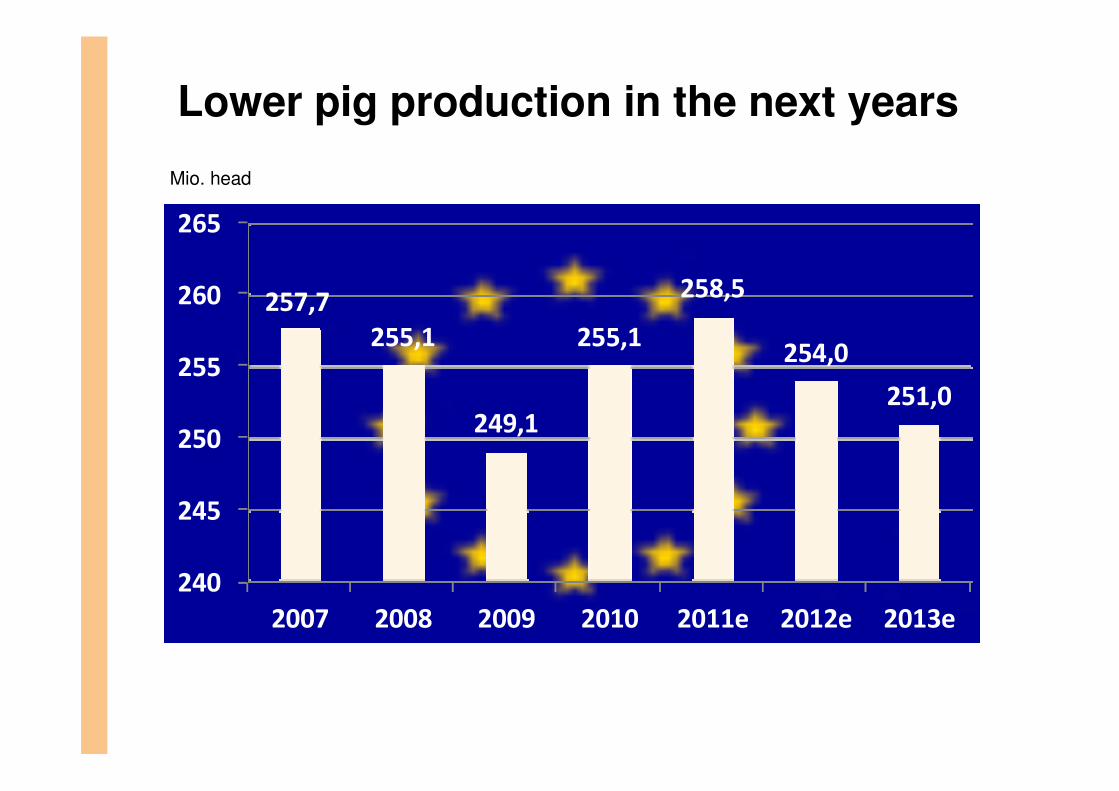
Lower pig production in the next years
240
245
250
255
260
265
2007 2008 2009 2010 2011e 2012e 2013e
257,7
255,1
249,1
255,1
258,5
254,0
251,0
Mio. head

Mid-term outlook for the EU Pig Sector
- Production and self suffiency ratio will decline but not break down
- Export opportunities to Russia could decline
but more exports to Asia
- Trade liberalisation could increase imports
- Cost price of pig production could increase
- Strong structural change in the pig meat sector
- Animal welfare and sustainability of pig production will play a more important role – fight for acceptance

Die Agrarmarkt Informations-Gesellschaft erstellt unabhängig und übergreifend aktuelle Fakten und Analysen für das gesamte Agribusiness.
Thank you for your attention

Competition of the land useFood or Energy
2,04
30
Maize for the biogas production
Share of the biogas usein percent
11
Bio energy offers more profit than pig production
Germany´s drop out of using nuclear energy will enlarge the use of bio energy
11

Rekordpreise für Futtermittel
100
150
200
250
300
350
400
Jan Jan Jan Jan Jan
Preisentwicklung für Schweinemischfuttermittel Euro/t
2007 2008 2009 2010 2011AMI/LK
SauenFerkel
Mastschwein

Fehlende Wirtschaftlichkeit 2011

Unrentable Ferkelproduktion

D: Außenhandel Schweinefleisch
Exporterlöse:
2010: 2,20 Mrd.
2011: 2,23 Mrd.
2010 2011 11 gg. 10 Anteil
Tonnen Tonnen in % in %
EU-27 901.969 840.452 -6,8 71,9
Osteuropa/Baltikum* 148.189 141.196 -4,7 12,1
Italien 156.384 145.347 -7,1 12,4
Niederlande 145.984 138.926 -4,8 11,9
Polen 96.321 83.972 -12,8 7,2
Großbritannien 156.384 145.347 -7,1 12,4
Österreich 72.873 63.419 -13,0 5,4
Drittländer 302.254 328.659 8,7 28,1
Russland 145.316 146.338 0,7 12,5
China/Hong Kong 82.498 104.546 26,7 8,9
Südafrika 6.758 11.215 66,0 1,0
Südkorea 1.925 13.518 602,2 1,2
Ausfuhr insgesamt 1.204.223 1.169.111 -2,9 100,0
* Tschechien, Bulgarien, Ungarn, Rumänien, Slowakei, Estland, Litauen, LettlandQuelle: AMI/Statistisches Bundesamt, Wiesbaden
Deutschland: Ausfuhr von Schweinefleisch und Erzeugnissen
in Produktgewicht Jan. - Juni (vorl.)

EU-Prognose Schweinepreis 2011
Preis 2010 Progn. 2011
Tats. Preis
Euro kg SG Klasse E (kalt)
Quart. 1 1,34 1,43 1,43
Quart. 2 1,41 1,54 1,56
Quart. 3 1,48 1,58
Quart. 4 1,38 1,44
Jahr 1,40 1,50
1,56
Quelle: Prognoseausschuss der EU-Kommission
1,46
1,50
Deutschland 1,45 1,531,56

Riesen Strukturunterschiede
Sauen / Betrieb
2007
2010
Deutschland
87 Sauen
114 Sauen
Niedersachsen
106 Sauen
147 Sauen
(+ 31 %) (+ 39 %)
Quelle: Destatis Agrarstrukturerhebung 2010
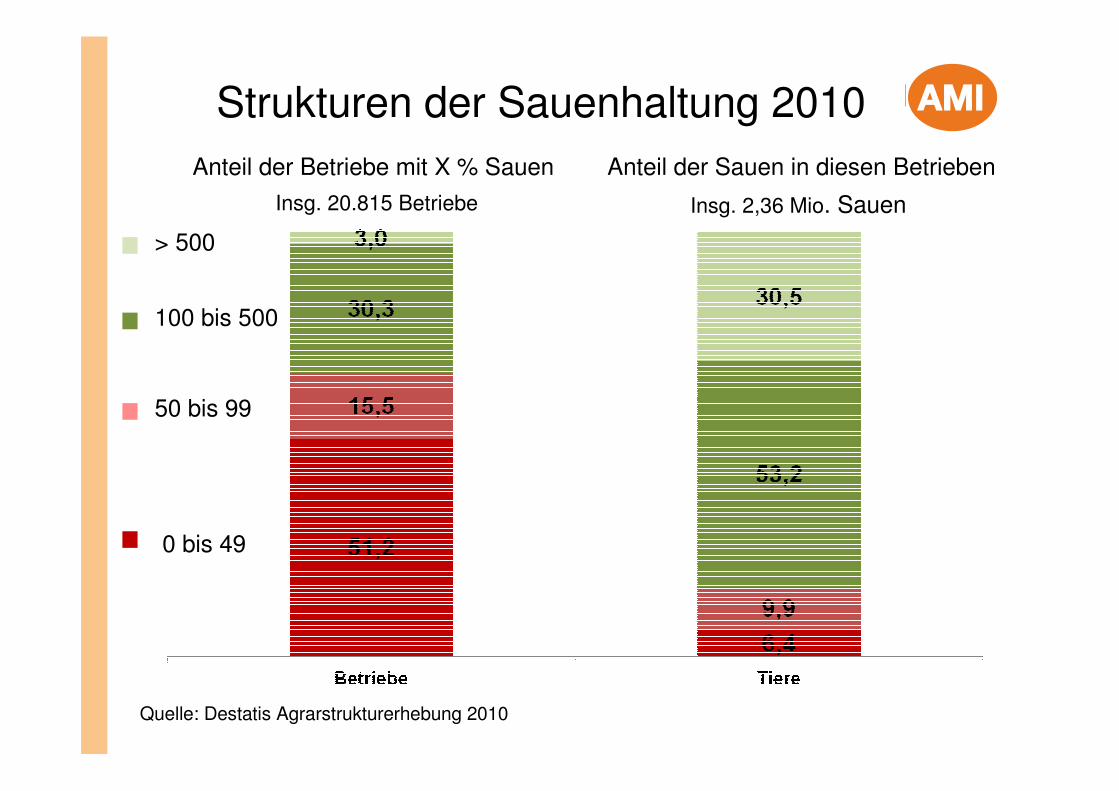
Strukturen der Sauenhaltung 2010Anteil der Betriebe mit X % Sauen
0 bis 49
50 bis 99
100 bis 500
> 500
Quelle: Destatis Agrarstrukturerhebung 2010
Anteil der Sauen in diesen Betrieben
Insg. 2,36 Mio. SauenInsg. 20.815 Betriebe