didsbury, burnage & chorlton neighbourhood health & social
TRANSCRIPT

Didsbury, Burnage & Chorlton - Health & Social Care Cohort Profile December 2019
Page 1
Didsbury, Burnage & Chorlton Neighbourhood Health & Social Care Profile

Didsbury, Burnage & Chorlton - Health & Social Care Cohort Profile December 2019
Page 2
Introduction to MHCC Neighbourhood & Cohort Profile Reports The Locality Plan developed by Health & Social Care commissioners in Manchester sets an ambition that those sections of the population most at risk of needing care will have access to more proactive care, available in their local communities. The key transformation is the establishment of 12 Integrated Neighbourhood Teams across the City based on geographical area as opposed to organisation. The teams focus on the place and people that they serve, centred around the ethos that ‘The best bed is your own bed’ wherever possible and care should be closer to home rather than delivered within a hospital or care home. The ambition of this model is to place primary care (GP) services at the heart of an integrated neighbourhood model of care in which they are co-located with community teams. These teams could include Community Pharmacists, Allied Health Professionals (AHPs), Community Nursing, Social Care Officers, Intermediate Care teams, Leisure and health promotion teams, Ambulance teams and 3rd sector teams, with a link to educational and employment teams. All services are based upon a 12/3/1 model of provision, where most services should be delivered at the neighbourhood* level (12) unless they require economies of scale at a specialist local level (3), or a single City-wide level (1). The 12 neighbourhoods* and 3 localities are: North Locality Ancoats, Clayton and Bradford; Cheetham and Crumpsall; Higher Blackley, Harpurhey and Charlestown; Miles Platting, Newton Heath, Moston and City Centre Central Locality Ardwick and Longsight; Chorlton, Whalley Range and Fallowfield; Gorton and Levenshulme; Moss Side, Hulme and Rusholme South Locality Didsbury, Burnage and Chorlton; Fallowfield (Old Moat) and Withington; Wythenshawe (Baguley, Sharston, Woodhouse Park); Wythenshawe (Brooklands) and Northenden This profile focuses on Didsbury, Burnage & Chorlton, comparing its population with the overall population registered with a Manchester GP at the end of June 2019. This profile report is one of a series that have been produced jointly by The Business Intelligence and Public Health Knowledge & Intelligence Teams within Manchester Health & Care Commissioning and Adults Performance, Research & Intelligence Team within Manchester City Council. These reports describe the nature of the population living and using services in different parts of Manchester. This profile can be viewed alongside the full series of neighbourhood profile and cohort profile reports that are also available on the Manchester Joint Strategic Needs Assessment (JSNA) website. Further information on these reports is given in Appendix A. Please note that data in some of the tables in this report have been suppressed in order to protect the confidentiality of individuals and avoid the risk of disclosure in line with ONS guidance for applying disclosure control to data. In a small number of tables it has also been necessary to apply secondary suppression to avoid disclosure by differencing. Where some form of suppression has been applied, the figures have been replaced with '-'.
* In May 2018 new electoral wards were established. The 12 neighbourhoods were established prior to May 2018 and are based around the previous electoral wards.

Didsbury, Burnage & Chorlton - Health & Social Care Cohort Profile December 2019
Page 3
Demographics Age
At the end of June 2019, nearly 660,000 people were registered with a Manchester GP. Of these, 62,572 lived in Didsbury, Burnage & Chorlton. The neighbourhood has a slightly older age profile than the overall Manchester population, with lower percentages aged under 19 (21% v 23%) and 19 – 34 (27% v 32%) and higher percentages in all age bands above 35.
Gender
The gender split for the neighbourhood is similar to the overall population (50% female v 48%).
Race Compared to the overall adult population, people living in the neighbourhood are more likely to be White / White British (75.2% v 59.8%) and less likely to be Black / African / Caribbean / Black British (4% v 11.7%) or Asian / Asian British (17.5% v 24.5%).
Neighbourhood
Manchester
No. of People
Percentage (where known) No. of People
Percentage (where known)
Female 31301 50% 317221 48%
Male 31269 50% 341747 52%
Unknown 2 - 18 -
Total 62572 100% 658986
Age Band
No. of People
Under
19 19 - 34 35 - 49 50 -64 65 - 79 80+ All Ages
Neighbourhood - No. 13445 16635 15120 10130 5382 1860 62572
Neighbourhood - % 21% 27% 24% 16% 9% 3%
Manchester - No. 150603 209468 143012 94628 45714 15561 658986
Manchester - % 23% 32% 22% 14% 7% 2%
Neighbourhood Manchester
Description No. of People
Percentage
(where known) No. of People
Percentage
(where known)
Asian / Asian British: Bangladeshi 429 1.1% 6211 1.3%
Asian / Asian British: Chinese 488 1.2% 19668 4.2%
Asian / Asian British: Indian 1014 2.5% 13200 2.8%
Asian / Asian British: Pakistani 3737 9.2% 54015 11.6%
Asian / Asian British: Other Asian 1437 3.5% 20321 4.4%
Black / African / Caribbean / Black British 1634 4.0% 54136 11.7%
Gypsy / Traveller / Irish Traveller - - 259 0.1%
White or White British 30601 75.2% 277294 59.8%
Mixed or Multiple 1337 3.3% 18668 4.0%
Unknown 21895 - 195214 -
Total 62572 658986

Didsbury, Burnage & Chorlton - Health & Social Care Cohort Profile December 2019
Page 4
Population cohorts For this series of profiles, the population (people registered with a GP practice in Manchester, living inside and outside Manchester, who have consented for their data to be shared) has been divided into 10 “cohorts” mainly using a range of data based on their history of accessing Primary Care (GP), Acute Hospital and Mental Health services. Each person is allocated to a single cohort (population type) determined in the following order: Children and Young people with Long Term Conditions, Learning Disabilities or Mental Health Needs; Frail Older People; People with Complex Lifestyles Mental Health, Learning Disabilities & Dementia; Maternity; Adults with Multiple Long Term Conditions / End of Life; Adults with Wider Determinants of Need; Good Health Older People, Good Health Children and Good Health Adults (Under 65s). Further details are in Appendix B. Didsbury, Burnage & Chorlton has more adults and older people in the Good Health cohorts and fewer in the Adults with Wider Determinants of Need cohort compared to the Manchester average. There are also fewer older adults in the Adults with Multiple Long Term Conditions / End of Life Cohort.
Neighbourhood
Manchester
Children (under 19) No. % No. %
Good Health Children 12026 89% 135933 90%
Children & Young people with Long Term Conditions, Learning Disabilities or Mental Health Needs 1416 11% 14609 10%
Total 13442 150542
Adults (19 - 64) No. % No. %
Good Health Adults 19189 46% 166608 37%
Complex Lifestyles 430 1% 7017 2%
Mental Health, Learning Disabilities, Dementia 1829 4% 21261 5%
Maternity 742 2% 7920 2%
Adults with Multiple Long Term Conditions / End of Life Care 1654 4% 20298 5%
Adults with Wider Determinants of Need 18041 43% 224004 50%
Total 41885 447108
Older People (65+) No. % No. %
Good Health Older People 1210 17% 5963 10%
Frail older people 481 7% 4131 7%
Complex Lifestyles 87 1% 1064 2%
Mental Health, Learning Disabilities, Dementia 599 8% 5632 9%
Adults with Multiple Long Term Conditions / End of Life Care 2647 37% 24844 41%
Adults with Wider Determinants of Need 2218 31% 19641 32%
Total 7242 61275

Didsbury, Burnage & Chorlton - Health & Social Care Cohort Profile December 2019
Page 5
Mosaic Analysis Mosaic Public Sector classification by Experian TM is a population segmentation tool that uses a range of data and analytical methods to identify 15 summary groups and 66 detailed types of people. It is based on an underlying principle that similar people live in similar places, do similar things, have similar lifestyles and share similar views. Mosaic helps us to understand a person’s demographic characteristics (age, gender and ethnic group etc.), lifestyle, attitudes and behaviours. It gives us an insight into how and why people make decisions about their health and care and how they are likely to respond to services. The use of Mosaic analysis enables us to tailor services in specific locations in line with the needs and preferences of the types of people living in those areas. Comparing the Mosaic Groups in the neighbourhood versus the population registered with a Manchester GP, people in the neighbourhood are more likely to be in the Mosaic Groups “City Prosperity” (12.2% v 1.9%), “Domestic Success” (13.4% v 3.7%) and “Family Basics” (22.9% v 18.2%). The neighbourhood has a lower proportion of those in the “Urban Cohesion” (8% v 14.4%), “Transient Renters” (2.9% v 17.2%) and “Municipal Challenge” groups (1.5% v 6.7%).
Neighbourhood Manchester
Mosaic Group Description No. of
People
Percentage
(where
known)
No. of
People
Percentage
(where
known)
A Country
Living
Well-off owners in rural locations enjoying the benefits of
country life (typical age 66-70)- - 17 0.0%
B Prestige
Positions
Established families in large detached homes living upmarket
lifestyles (typical age 61-65)2009 3.2% 5877 1.0%
C City
Prosperity
High status city dwellers living in central locations, pursuing
careers with high rewards (typical age 31-35)7551 12.2% 11699 1.9%
D Domestic
Success
Thriving families who are busy bringing up children and following
careers (typical age 41-45)8324 13.4% 22770 3.7%
E Suburban
Stability
Mature suburban owners living settled lives in mid-range housing
(typical age 56-60)281 0.5% 7442 1.2%
F Senior
Security
Elderly people with assets who are enjoying a comfortable
retirement (typical age 76-80)1151 1.9% 13342 2.2%
H Aspiring
Homemakers
Younger households settling down in housing priced within their
means (typical age 31-35)1896 3.1% 26284 4.3%
I Urban
Cohesion
Residents of settled urban communities with a strong sense of
identity (typical age 56-60) 4985 8.0% 88703 14.4%
J Rental
Hubs
Educated young people privately renting in urban
neighbourhoods (typical age 26-30)14440 23.3% 124877 20.3%
K Modest
Traditions
Mature homeowners of value homes enjoying stable lifestyles
(typical age 56-60)1366 2.2% 17776 2.9%
L Transient
Renters
Single people privately renting low cost homes for the short term
(typical age 18-25)1827 2.9% 105989 17.2%
M Family
Basics
Families with limited resources who have to budget to make
ends meet (typical age 31-35)14199 22.9% 112369 18.2%
N Vintage
Value
Older people reliant on support to meet financial or practical
needs (typical age 76-80)3061 4.9% 37669 6.1%
O Municipal
Challenge
Urban renters of social housing facing an array of challenges
(typical age 56-60)956 1.5% 41229 6.7%
U Unknown Unknown 526 0.8% 42943 6.5%
Total 62572 658986

Didsbury, Burnage & Chorlton - Health & Social Care Cohort Profile December 2019
Page 6
Social Services provided by MCC Adult Social Care
Manchester City Council (MCC) Adult Social Care offers information and advice, assessments of need, equipment and care to people living in Manchester. People over the age of 18 who live in Manchester can request information and advice or an assessment of need, regardless of whether they pay for services themselves.
Adult Social Care activity begins with making contact – a member of the public may call up to enquire about services for themselves or someone else, or a referral may be made by another service e.g. Primary Care, Prisons, and this is recorded as a contact.
Some (but not all) contacts result in an assessment by a Social Worker or associated professional. Information is gathered on a person’s needs so that appropriate services (called a care package) can be provided if needed. Reviews and reassessments review those needs again when a person’s circumstances change or they have been in receipt of certain types of care e.g. home care for a year.
This analysis is based on the 12 months to 30th June 2019, and relates to adults registered with a Manchester GP* who have been in contact with or received a social care service from Manchester City Council.
Contacts & Assessments
In the 12 months to 30th June 2019, 948 adults living in the neighbourhood had 1 or more contacts with MCC Adult Social Care. This is 2% of the adult population, the same as the overall adult population.
The percentage of people who received 1 or more assessments was also very similar to the overall adult population (48% v 50%). While the neighbourhood accounts for 9.7% of the registered adult population, the percentage receiving all three types of assessment was lower.
* In the 12 months to 30th June 2019, 23,611 adults had a contact with MCC Adult Social Services. Of these, 46% (10,814 adults) were identified as registered with a Manchester GP. * 10,274 adults had an assessment of some form. Of these, 53% (5,451 adults) were identified as registered with a Manchester GP.
N'hood Registered
Adults *
Total No. of Adults 49127 508383
Contacts
No. with 1 or more contacts with MCC ASC 948 10814
% with at least one contact 2% 2%
Average no. of contacts per person 3.0 3.1
Assessments
No. with 1 or more assessments with MCC ASC 451 5451
Ratio - Assessments v Contacts 48% 50%
Average no. of assessments per person 1.9 2.0
N'hood
Registered Adults
* N'hood v All
Population 49127 508383 9.7%
Type of Assessment
General 293 3766 7.8%
Equipment 199 2245 8.9%
Drugs & Alcohol 21 231 9.1%

Didsbury, Burnage & Chorlton - Health & Social Care Cohort Profile December 2019
Page 7
Packages of Social Care
When services are provided via MCC Adult Social Care, these are referred to as Care Packages. One of the most common services is the provision of equipment, which is a one-off service. However, this analysis focuses on care packages that provide on-going care and support, both long term and short term.
A person assessed as having a need can receive multiple care packages, of different types, over any given period of time. Descriptions of the different types of service are given in Appendix C. Analysis of the different types of care shows: In the neighbourhood, the two most widely used services provided via MCC Adult Social Care were community alarms (270 adults) and home care (201). The adult population in the neighbourhood equates to 9.7% of the adult population registered with a Manchester GP. Where adults in the neighbourhood access services, the percentage of service users is generally more than 9.7%.
* In the 12 months to 30th June 2019, 9,546 adults were in receipt of one or more packages of care from MCC Adult Social Care. Of these, 59% (5,642) were identified as registered with a Manchester GP.
N'hood
Registered
Adults * Ratio
Population 49127 508383 9.7%
Type of Care Package No. No. %
Community Alarm 270 2065 13.1%
Home Care 201 1908 10.5%
Reablement 107 926 11.6%
Direct Payments 79 519 15.2%
Supported Accommodation 49 511 9.6%
Residential Care 38 726 5.2%
Day Care 36 351 10.3%
Respite 17 176 9.7%
Sitting/Befriending 14 98 14.3%
Nursing Care 13 274 4.7%
Casework Support 9 70 12.9%
Didsbury, Burnage & Chorlton - Health & Social Care Cohort Profile December 2019
Page 8
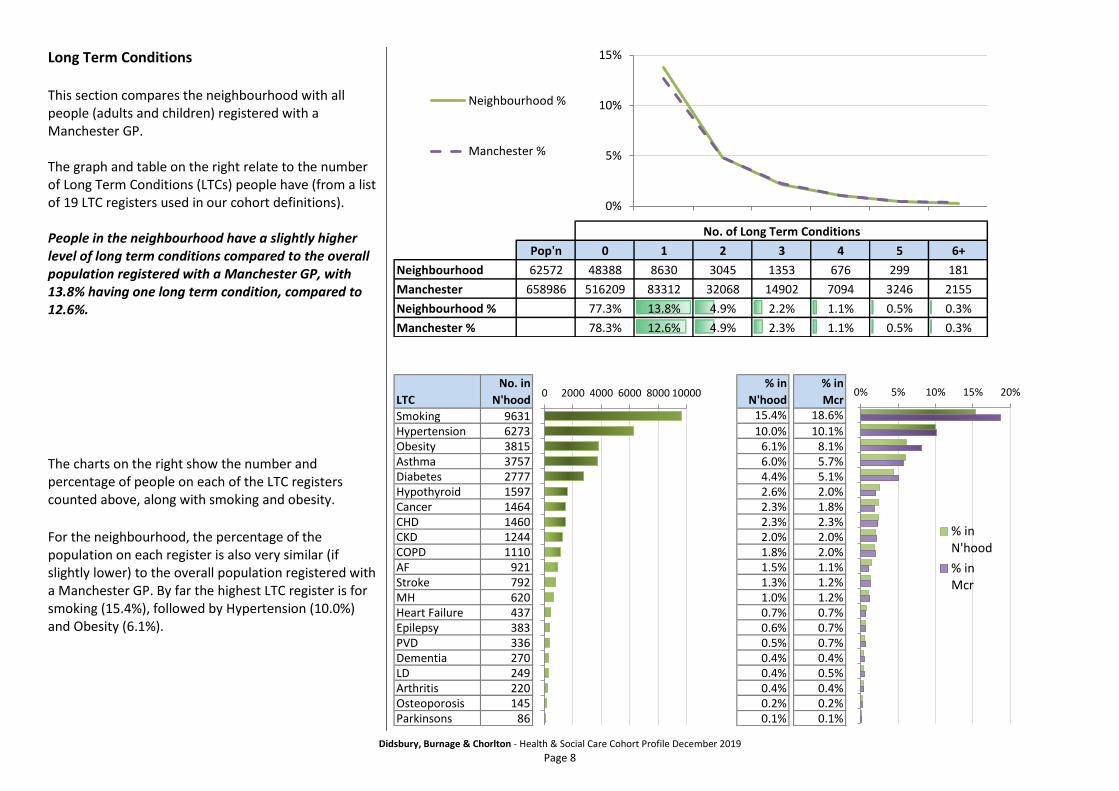
Long Term Conditions This section compares the neighbourhood with all people (adults and children) registered with a Manchester GP. The graph and table on the right relate to the number of Long Term Conditions (LTCs) people have (from a list of 19 LTC registers used in our cohort definitions). People in the neighbourhood have a slightly higher level of long term conditions compared to the overall population registered with a Manchester GP, with 13.8% having one long term condition, compared to 12.6%.
The charts on the right show the number and percentage of people on each of the LTC registers counted above, along with smoking and obesity.
For the neighbourhood, the percentage of the population on each register is also very similar (if slightly lower) to the overall population registered with a Manchester GP. By far the highest LTC register is for smoking (15.4%), followed by Hypertension (10.0%) and Obesity (6.1%).
No. of Long Term Conditions
Pop'n 0 1 2 3 4 5 6+
Neighbourhood 62572 48388 8630 3045 1353 676 299 181
Manchester 658986 516209 83312 32068 14902 7094 3246 2155
Neighbourhood % 77.3% 13.8% 4.9% 2.2% 1.1% 0.5% 0.3%
Manchester % 78.3% 12.6% 4.9% 2.3% 1.1% 0.5% 0.3%
0%
5%
10%
15%
Neighbourhood %
Manchester %
LTC
No. in
N'hood
% in
N'hood
% in
Mcr
Smoking 9631 15.4% 18.6%
Hypertension 6273 10.0% 10.1%Obesity 3815 6.1% 8.1%Asthma 3757 6.0% 5.7%Diabetes 2777 4.4% 5.1%Hypothyroid 1597 2.6% 2.0%Cancer 1464 2.3% 1.8%CHD 1460 2.3% 2.3%CKD 1244 2.0% 2.0%COPD 1110 1.8% 2.0%AF 921 1.5% 1.1%Stroke 792 1.3% 1.2%MH 620 1.0% 1.2%Heart Failure 437 0.7% 0.7%Epilepsy 383 0.6% 0.7%PVD 336 0.5% 0.7%Dementia 270 0.4% 0.4%LD 249 0.4% 0.5%Arthritis 220 0.4% 0.4%Osteoporosis 145 0.2% 0.2%Parkinsons 86 0.1% 0.1%
0 2000 4000 6000 8000 10000 0% 5% 10% 15% 20%
% inN'hood
% inMcr
Didsbury, Burnage & Chorlton - Health & Social Care Cohort Profile December 2019
Page 9
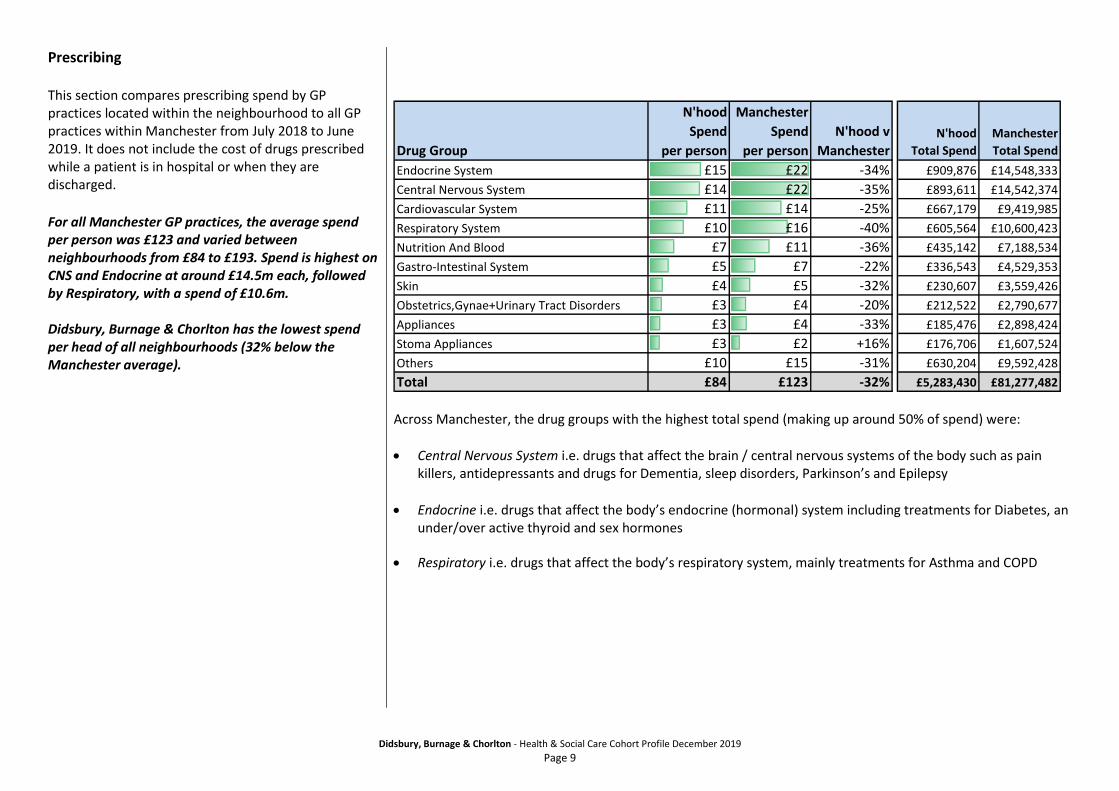
Prescribing This section compares prescribing spend by GP practices located within the neighbourhood to all GP practices within Manchester from July 2018 to June 2019. It does not include the cost of drugs prescribed while a patient is in hospital or when they are discharged.
For all Manchester GP practices, the average spend per person was £123 and varied between neighbourhoods from £84 to £193. Spend is highest on CNS and Endocrine at around £14.5m each, followed by Respiratory, with a spend of £10.6m. Didsbury, Burnage & Chorlton has the lowest spend per head of all neighbourhoods (32% below the Manchester average).
Across Manchester, the drug groups with the highest total spend (making up around 50% of spend) were:
Central Nervous System i.e. drugs that affect the brain / central nervous systems of the body such as pain killers, antidepressants and drugs for Dementia, sleep disorders, Parkinson’s and Epilepsy
Endocrine i.e. drugs that affect the body’s endocrine (hormonal) system including treatments for Diabetes, an under/over active thyroid and sex hormones
Respiratory i.e. drugs that affect the body’s respiratory system, mainly treatments for Asthma and COPD
Drug Group
N'hood
Spend
per person
Manchester
Spend
per person
N'hood v
ManchesterN'hood
Total Spend
Manchester
Total Spend
Endocrine System £15 £22 -34% £909,876 £14,548,333
Central Nervous System £14 £22 -35% £893,611 £14,542,374
Cardiovascular System £11 £14 -25% £667,179 £9,419,985
Respiratory System £10 £16 -40% £605,564 £10,600,423
Nutrition And Blood £7 £11 -36% £435,142 £7,188,534
Gastro-Intestinal System £5 £7 -22% £336,543 £4,529,353
Skin £4 £5 -32% £230,607 £3,559,426
Obstetrics,Gynae+Urinary Tract Disorders £3 £4 -20% £212,522 £2,790,677
Appliances £3 £4 -33% £185,476 £2,898,424
Stoma Appliances £3 £2 +16% £176,706 £1,607,524
Others £10 £15 -31% £630,204 £9,592,428
Total £84 £123 -32% £5,283,430 £81,277,482

Didsbury, Burnage & Chorlton - Health & Social Care Cohort Profile December 2019
Page 10
Acute Hospital Care This section compares the extent to which different types of acute hospital (secondary care) services were used from July 2018 to June 2019 by people registered with a Manchester GP at the time of the attendance or admission AND registered with a Manchester GP on 30th June 2019. The analysis then further compares those living in the neighbourhood, with the overall registered population. Calculation of rates per person: To calculate rates per person in this section, activity is looked at over a 12 month period and then compared against the expected population at any single given point in time – a “snapshot”. The snapshot population figures are based on: Neighbourhood – people living within the neighbourhood AND registered with a Manchester GP on 30th June 2019 (62,572 people). Manchester – people living inside or outside Manchester AND registered with a Manchester GP on 30th June 2019 (658,986 people). Types of acute hospital service Acute hospital services can be split into two categories:
1. Planned care – Services and treatments which are not carried out in an emergency. This includes consultations and procedures carried out in an outpatient setting (where a hospital bed is not needed) and procedures carried out in an inpatient setting (where a bed and possibly an overnight stay are needed).
2. Urgent care – Services and treatments which are carried out as an emergency. This includes A&E attends and Emergency Admissions.

Didsbury, Burnage & Chorlton - Health & Social Care Cohort Profile December 2019
Page 11
Reason for Secondary Care The reason for acute hospital activity can be broken down into key areas (known as Programme Budget Categories). For the neighbourhood and the overall population, Gastro Intestinal is the highest area of spend at 12%. A number of areas then account for spend of around 8 – 9% each, following a similar pattern to the Manchester average, although spend on Respiratory is lower than the average (9% v 11%).
Area of Spend
N'hood
% of Spend
Manchester
% of Spend
N'hood
Total Spend
Manchester
Total Spend
Gastro Intestinal 12% 12% £3,294,183 £34,879,043
Respiratory 9% 11% £2,571,268 £32,814,191
Musculo Skeletal 9% 8% £2,500,085 £24,511,751
Genito Urinary 9% 9% £2,447,196 £25,709,154
Circulation 9% 8% £2,416,413 £24,586,491
Trauma & Injury 8% 8% £2,297,846 £23,686,012
Maternity / Reproductive Health 8% 9% £2,256,376 £26,819,938
Cancers & Tumours 6% 5% £1,533,203 £15,759,064
Neurological problems 5% 5% £1,369,720 £15,683,029
Other Areas of Spend/Conditions 4% 5% £1,224,126 £13,943,057
Others (low value or not specified) 20% 20% £5,512,405 £59,768,991
Total 100% 100% £27,422,821 £298,160,724

Didsbury, Burnage & Chorlton - Health & Social Care Cohort Profile December 2019
Page 12
Planned Care Planned Care is split into four broad categories of activity: Outpatient attends are clinic appointments where no procedure is performed. An outpatient procedure is a minor procedure performed on a single day. A Day case is also a procedure performed on a single day, but may require the person to be in hospital for longer than an outpatient procedure e.g. for supervised recovery. An Elective admission will involve a stay of at least one night. Activity rates for the different types of planned care are slightly higher for people living in the neighbourhood compared to the overall population registered with a Manchester GP.
Outpatient
Attends Outpatient Procedures Day Case
Elective Admission
Planned Care Activity Neighbourhood 77006 11067 6199 989 Manchester 733452 92324 56293 9466 Rate per 1000 People Pop’n
Neighbourhood 1231 177 99 16 62572
Manchester 1113 140 85 14 658986
Ratio - Neighbourhood v Manchester 1.1 1.3 1.2 1.1

Didsbury, Burnage & Chorlton - Health & Social Care Cohort Profile December 2019
Page 13
Urgent Care People in the neighbourhood are less likely to attend A&E than the overall population registered with a Manchester GP. They are as likely to be admitted as a result of the A&E attend, with 32% of A&E attends resulting in admission, compared to 31% for the overall population. In combination, this means that people living in the neighbourhood are less likely to experience an emergency admission than the wider population.
When a person living in the neighbourhood experiences an emergency hospital admission, the average stay is the same as the average for people registered with a Manchester GP – 3.7 nights.
A&E Attends Emergency Admissions
Percentage of A&E attends
resulting in admission
Urgent Care Activity Neighbourhood 21697 6922 32% Manchester 272209 84883 31% Rate per 1000 People Pop’n
Neighbourhood 347 111 - 62572
Manchester 413 129 - 658986
Ratio - Neighbourhood v Manchester 0.8 0.9 1.0
Same Day Short Stay (1 night)
Longer (2+ nights)
Average LOS
Emergency Admissions Activity
Neighbourhood 2702 1468 2752
3.7
Manchester 33350 17556 33977
3.7
Percentage of admissions Neighbourhood 39% 21% 40% Manchester 39% 21% 40% Ratio - Neighbourhood v Manchester 1.0 1.0 1.0

Didsbury, Burnage & Chorlton - Health & Social Care Cohort Profile December 2019
Page 14
Based on the reasons for admission (diagnoses) and the procedures that were performed, it is possible to determine if an admission was preventable or ambulatory care sensitive (ACSC) i.e. conditions for which effective management and treatment should limit emergency admission to hospital. 19.2% of emergency admissions for the neighbourhood could be classed as preventable or Ambulatory Care Sensitive – 11.9% preventable and 7.2% for ACSCs. This compares to 12.2% and 7.5% for the overall population. For Preventable Admissions, the pattern of causes is different to the Manchester average. Across the registered Manchester population, ENT Infections account for the most Preventable Admissions (24.7%), while in the neighbourhood this is 21.2%. The highest level of admissions in the neighbourhood is for Pyelonephritis & Kidney or Urinary Tract Infections (23.2%), which is higher than the Manchester average (19.2%). Percentages for other causes also vary compared to the Manchester average. For Ambulatory Care Sensitive Conditions, Respiratory is the greatest reason for ACSC admissions in the neighbourhood and for Manchester GP registered patients (41.3% v 46.3%). The next highest percentage is for CVD (36.7%), which is higher than the Manchester average (31.9%).
No. of Admissions
Emergency Admissions N'hood ManchesterManchester
Preventable 825 10318
Ambulatory Care Sensitive (ACSC) 501 6327
Neither 5596 68238
Total 6922 84883
% Preventable 11.9% 12.2%% ACSC 7.2% 7.5%
% of Preventable Admissions No. of Admissions
Preventable Admissions N'hood Manchester N'hood ManchesterAngina 0.6% 1.0% 5 106
Cellulitis 13.5% 10.9% 111 1127Convulsions & Epilepsy 3.5% 3.6% 29 374
Dehydration & Gastroenteritis 19.5% 18.6% 161 1915Dental conditions 0.8% 0.8% 7 87
ENT Infections 21.2% 24.7% 175 2549Flu & Pneumonia 12.1% 15.4% 100 1592
Other Vaccine Preventable 0.0% 0.1% 0 13Perforated or bleeding Ulcer 5.6% 5.6% 46 576
Pyelonephritis & Kidney or Urinary Tract Infections 23.2% 19.2% 191 1979
% of ACSC Admissions No. of Admissions
Ambulatory Care Sensitive Conditions N'hood Manchester N'hood ManchesterCVD 36.7% 31.9% 184 2019
Diseases of Blood 4.4% 5.0% 22 316Endocrine 8.0% 8.1% 40 510Infections 0.0% 0.0% 0 3
Mental & Behaviour Disorders 1.6% 1.4% 8 91Neuro 8.0% 7.2% 40 458
Respiratory 41.3% 46.3% 207 2930

Didsbury, Burnage & Chorlton - Health & Social Care Cohort Profile December 2019
Page 15
Risk of Emergency Hospital Admission The tables and graph on the right look at a relative risk of emergency hospital admission based on scores (From 0 – 100) generated by an algorithm known as the Combined Predictive Model (CPM). This algorithm uses data from secondary care (inpatient, outpatient and A&E visits) and GP practices (clinical diagnoses and prescribing). The percentage risk band in which people are placed is based on all patients (including children) registered with a Manchester GP on 30th June 2019. Based on the Combined Predictive Model algorithm, people in the neighbourhood have a slightly lower risk of emergency admission compared to the overall registered population, with 58.9% in the “bottom 60%” risk band and 4.2% in the “top 5%” band.
Unknown Bottom 60% Top 20 - 40% Top 5 - 20% Top 5% All
Percentage
Neighbourhood - 58.9% 21.9% 14.9% 4.2% -
Manchester - 59.9% 20.0% 15.1% 5.0% -
Unknown Bottom 60% Top 20 - 40% Top 5 - 20% Top 5% All
No.
Neighbourhood 1792 35827 13317 9062 2574 62572
Manchester 19611 383235 128085 96357 31698 658986
0%
10%
20%
30%
40%
50%
60%
70%
Neighbourhood
Manchester

Didsbury, Burnage & Chorlton - Health & Social Care Cohort Profile December 2019
Page 16
Appendix A – Additional Sources of Information on the JSNA website The following neighbourhood profile reports and cohort profile reports are available in the Area Profiles section of the Manchester Joint Strategic Needs Assessment (JSNA) website. Manchester Joint Strategic Needs Assessment (JSNA) http://www.manchester.gov.uk/jsna Area Profiles section http://www.manchester.gov.uk/info/500230/joint_strategic_needs_assessment/7011/area_profiles Neighbourhood profile reports http://www.manchester.gov.uk/info/500230/joint_strategic_needs_assessment/7011/area_profiles/2 Place Report This report draws upon the data that is available within Public Health England’s Local Health tool which contains quality assured data that can be used to compare any area (or combination of areas) with the local authority and England averages for a range of indicators. These reports provide information about broader health outcomes as well as the factors that affect them (the so called ‘wider determinants of health’). The start of the report provides a user-friendly summary highlighting the key features of the neighbourhood and the areas in which the neighbourhood has significantly worse and/or better health and care outcomes compared with England as a whole. Mosaic Profile These reports provide more detailed information about the types of household in different parts of each neighbourhood area. Mosaic Public Sector classification by Experian TM uses a range of data and analytical methods to identify 15 summary groups and 66 detailed types of people. It is based on an underlying principle that similar people live in similar places, do similar things, have similar lifestyles and share similar views. Mosaic helps us to understand demographic characteristics (age, gender and ethnic group etc.), lifestyle, attitudes and behaviours. It gives us an insight into how and why people make decisions about their health and care and how they are likely to respond to services. Population Forecasting Model This is a one page summary for each neighbourhood of the findings of the Manchester City Council Population Forecasting Model (MCCFM), looking at the changes to the size and age structure of the population living in the neighbourhood that are forecast to occur over the next 10 years. Ward based information More detailed information for the individual wards that make up each neighbourhood has also been collated within the Compendium of Statistics for Manchester (“A Picture of Progress”). The Compendium consists of a series of tables which contain the latest available data for a wide range of indicators for both Manchester as a whole and, where available, each of the 32 wards within the city. The tables have been ordered in a way that follows a life course approach – from pre-birth through to adults and older people. http://www.manchester.gov.uk/downloads/download/5724/compendium_of_statistics-manchester Cohort Profiles The full set of Cohort Profile Reports, are also available on the JSNA website. http://www.manchester.gov.uk/info/500230/joint_strategic_needs_assessment/7011/area_profiles/3
Didsbury, Burnage & Chorlton - Health & Social Care Cohort Profile December 2019
Page 17
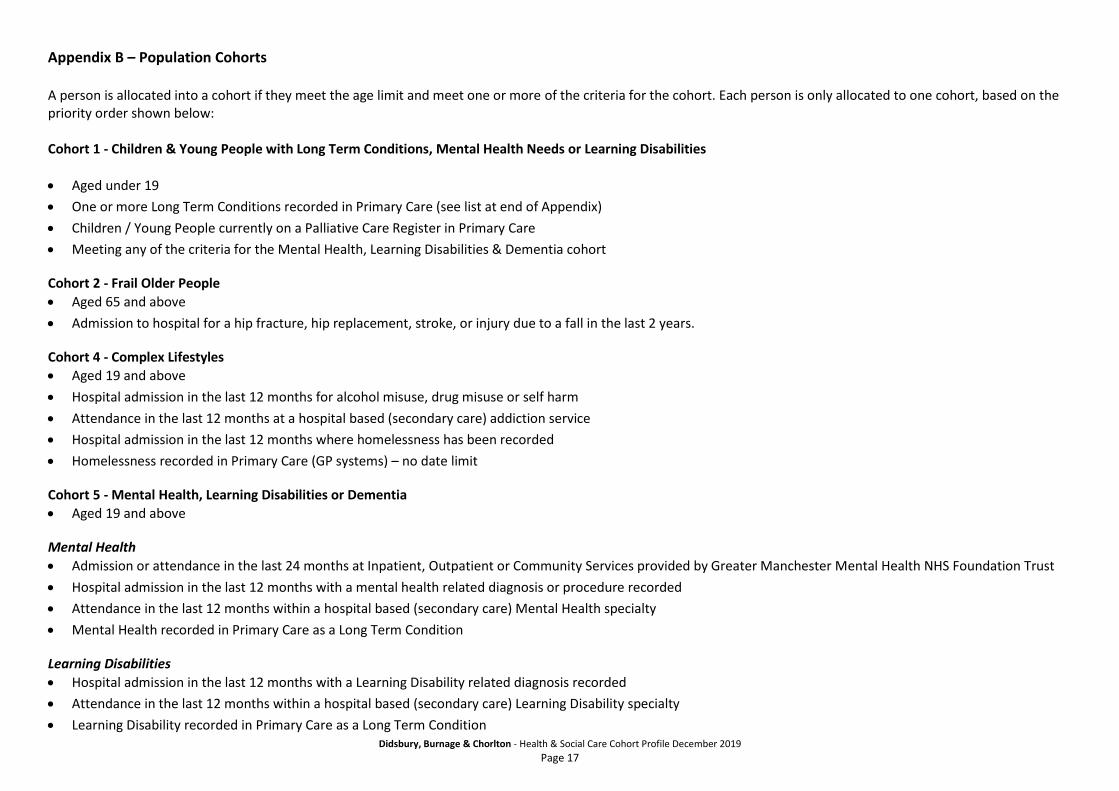
Appendix B – Population Cohorts A person is allocated into a cohort if they meet the age limit and meet one or more of the criteria for the cohort. Each person is only allocated to one cohort, based on the priority order shown below: Cohort 1 - Children & Young People with Long Term Conditions, Mental Health Needs or Learning Disabilities
Aged under 19
One or more Long Term Conditions recorded in Primary Care (see list at end of Appendix)
Children / Young People currently on a Palliative Care Register in Primary Care
Meeting any of the criteria for the Mental Health, Learning Disabilities & Dementia cohort
Cohort 2 - Frail Older People
Aged 65 and above
Admission to hospital for a hip fracture, hip replacement, stroke, or injury due to a fall in the last 2 years.
Cohort 4 - Complex Lifestyles
Aged 19 and above
Hospital admission in the last 12 months for alcohol misuse, drug misuse or self harm
Attendance in the last 12 months at a hospital based (secondary care) addiction service
Hospital admission in the last 12 months where homelessness has been recorded
Homelessness recorded in Primary Care (GP systems) – no date limit
Cohort 5 - Mental Health, Learning Disabilities or Dementia
Aged 19 and above
Mental Health
Admission or attendance in the last 24 months at Inpatient, Outpatient or Community Services provided by Greater Manchester Mental Health NHS Foundation Trust
Hospital admission in the last 12 months with a mental health related diagnosis or procedure recorded
Attendance in the last 12 months within a hospital based (secondary care) Mental Health specialty
Mental Health recorded in Primary Care as a Long Term Condition
Learning Disabilities
Hospital admission in the last 12 months with a Learning Disability related diagnosis recorded
Attendance in the last 12 months within a hospital based (secondary care) Learning Disability specialty
Learning Disability recorded in Primary Care as a Long Term Condition

Didsbury, Burnage & Chorlton - Health & Social Care Cohort Profile December 2019
Page 18
Dementia
Hospital admission (no time limit set) with a Dementia related diagnosis recorded
Dementia recorded in Primary Care as a Long Term Condition
Cohort 6 - Maternity
Age 10 and above (to eliminate new born babies and include young mothers)
Birth in the last 12 months recorded by a secondary care provider
Attendance in the last 12 months at antenatal services (including specialty 560, Midwifery) provided within secondary care
Cohort 3 - Adults with Multiple Long Term Conditions or End of Life
Age 19 and above
Two or more Long Term Conditions from the defined list (see bottom of Appendix)
People currently on a Palliative Care Register in Primary Care
Hospital admission in the last 12 months with a Palliative Care related diagnosis recorded
Attendance in the last 12 months within a hospital based (secondary care) Palliative Care specialty
Cohort 10 - Adults with Wider Determinants of Need
19 and above
One Long Term condition from the defined list (see bottom of Appendix)
Adults living within a geographical area with a Mosaic Intensity code of 4 or 5.
Cohort 7 - Good Health Older People
Age 65 and above
Not included in any other group.
Cohort 8 - Good Health Children
Age under 19
Not included in any other group.
Cohort 9 -Good Health Adults
Age 19 - 64
Not included in any other group.

Didsbury, Burnage & Chorlton - Health & Social Care Cohort Profile December 2019
Page 19
Long Term Conditions used to allocate the population into cohorts
Asthma Atrial Fibrillation Cancer CKD COPD Coronary Heart Disease Diabetes Epilepsy Heart Failure Hypertension Hypothyroidism Osteoporosis Parkinson’s Peripheral Vascular Disease Rheumatoid Arthritis Stroke
Mental Health * Learning Disability * Dementia * Current Smoker ** Obesity **
*Based on current priority order for cohorts, people on the Mental Health, Learning Disability or Dementia registers will be allocated into the Mental Health, Learning Disability & Dementia cohort. ** Smoking and Obesity are only used to allocate people into the Adults with Wider Determinants cohort.

Didsbury, Burnage & Chorlton - Health & Social Care Cohort Profile December 2019
Page 20
Appendix C – Descriptions of services provided via MCC Adult Social Care Adult Placement Scheme (Shared Lives Service) Manchester Shared Lives / Adult placement (AP) offers people an alternative, highly flexible form of accommodation and person-centred support, which is provided by ordinary individuals or families (adult placement carers) in the local community. This enables individuals to share in the life of the adult placement carer. Sometimes this can be long-term, sometimes for a short period, or even on a day support basis.
Casework support For a client to be considered as having casework support, the service must be included as part of their support plan. This does not include the process of care management (i.e. assessing or reviewing care needs), but typically occurs when the care manager goes on working with the client after the care management process has been completed (as part of the support plan/package), or another professional is involved to provide active, ongoing support which may take the form of therapy, support or professional input, e.g. counselling.
Active Casework Support could be for example a support professional telephoning a client on a weekly basis to ask how things are and discuss any issues the client might have. In contrast to the client having a phone number that they could call if they felt there was anything they would like to discuss - this would be more “passive” support.
Community Alarm/Assistive Technology The Community Alarm Service (CAS) provides a range of services to support our most vulnerable Citizens by enabling them to remain independent in their own homes. This includes things such as pendants, alarm or sensor triggers, and staff from Community Alarm calling to offer advice and reassurance, and where necessary, contacting a nominated person, your next of kin or the emergency services.
Day Care Daytime Support provides a range of meaningful activities away from a citizen’s home, to people who are assessed as requiring high levels of support. This service provides essential daytime support to families and enables vulnerable citizens to stay at home with their families
Direct Payments Self-directed support helps a citizen to self-direct their care or support personal budget in a number of different ways, and a direct payment is money that is paid directly to you so you can arrange your own appropriate support in line with your care plan.
Extra Care / Neighbourhood Apartments Extra Care Housing is a form of retirement housing with the addition of personal care and 24-hour support available for those who need it. The care can increase or decrease flexibly to meet changing needs.
It is a realistic alternative to traditional residential and nursing accommodation, and offers a self-contained ‘home of your own’ in a scheme where facilities such as hairdressing and beauty salons, bistros, gardening clubs and social activities give plenty of opportunity to socialise for those who wish to. Schemes can also support people with dementia, to varying degrees.
A small number of units have been turned into Neighbourhood apartments (or also known as step up/step down beds) and take referrals directly from hospital or community. Here, specialist support, including housing advice and access, can help people move to more appropriate accommodation after recovery or return home

Didsbury, Burnage & Chorlton - Health & Social Care Cohort Profile December 2019
Page 21
Home Care Home care services help people stay in their homes for longer, supporting them with the tasks of everyday life. These services are provided by a number of private care companies who are commissioned by the City Council. Home care is provided to ensure our citizens have the appropriate level of support for their needs. This may include help with personal care, making meals, and getting out and about.
Reablement Reablement provides short term support for up to six weeks on discharge from hospital to enable citizens to return home safely and remain at home independently. Referrals are made directly by health and social care practitioners. Also including Intermediate Care, this is a concept in health care which may offer attractive alternatives to hospital care for patients, particularly older people, and promotes independence.
Residential Care / Nursing Care Residential care homes provide round-the-clock care for people who are frail or have complex needs that cannot be met in their community. This can include help with washing, dressing, feeding and help with day to day activities. Nursing homes cater for those who have general care needs and also require input or supervision from qualified nurses. This can include those with specific or complex health needs. People can benefit from a short stay in residential care to provide a carer break or move there on a more permanent basis following a detailed assessment by a qualified social worker.
Respite / Short Breaks Short breaks offer a mixture of 24hr personal care and more general support, which allows carers to have a break from their caring responsibilities. Short Breaks also includes emergency respite in times of crisis and to support hospital discharges.
Supported Accommodation Supported accommodation is short term housing related support for vulnerable people. This may include those suffering domestic violence, recovery from mental illness, and sexual abuse. Support is available in single-gender premises. The support might be needed for a wide range of reasons, and is tailored to address the issues people are facing, whilst developing better life skills to improve their quality of life, and to promote independent living
Disability Supported Accommodation has properties (where appropriate) that are fitted with state-of-the-art assistive technology tailored to an individual’s needs, to ensure dignity in a safe and independent living environment.

Didsbury, Burnage & Chorlton - Health & Social Care Cohort Profile December 2019
Page 22
Sources The following data sources have been used in this Profile: Manchester City Council Social Care Data Extracts (July 2019) SDE Primary Care Data Extracts (July 2019) Secondary Uses Service – Acute Hospital Activity Datasets (July 2019) DSCRO Risk Strat Algorithm – (May 2019)
Authors This profile has been produced on behalf of Manchester Health and Care Commissioning by the Business Intelligence and Public Health Knowledge and Intelligence Teams.