did the 1999 nyse and nasdaq listing standard changes … · did the 1999 nyse and nasdaq listing...
TRANSCRIPT
Did the 1999 NYSE and NASDAQ Listing Standard Changes on
Audit Committee Composition Benefit Investors?
Seil Kim
Baruch College
April Klein
New York University and Warwick Business School
January 2017
In December 1999, the SEC instituted a new listing standard for NYSE and NASDAQ firms.
Listed firms were now required to maintain fully independent audit committees with at least three
members. In July 2002, the U.S. Congress legislated these standards through the Sarbanes-Oxley
Act. Our research question is whether all investors benefited from the 1999 new rule. Using both
an event study and a difference-in-differences methodology, we find no evidence of higher market
value or better financial reporting quality resulting from this rule.
KEYWORDS: Audit Committee Independence, Exchange Listing Standards, Securities
Regulation
We appreciate helpful comments from T. J. Wong (editor), the anonymous reviewers, seminar
participants at London Business School, New York University, University of Missouri, and
Warwick Business School, and Mary Billings, Joe Carcello, John Core, Yiwei Dou, and Ron
Shalev.

1
I. INTRODUCTION
On December 14, 1999, the Securities and Exchange Commission (SEC), in response to a call
from then Chairman Arthur Levitt to “empower audit committees … as the ultimate guardian of investor
interests and corporate accountability” (Levitt 1998), approved new audit committee standards for firms
listed on the New York Stock Exchange (NYSE) and NASDAQ. The new rule requires listed firms to
maintain audit committees with at least three directors “all of whom have no relationship to the company
that may interfere with the exercise of their independence from management and the company.” The rule
became effective from December 31, 1999 onwards.
The 1999 regulation is consistent with an entrenchment theory of corporate governance, which
suggests that management seeks to insulate itself from oversight by maintaining smaller and/or less
independent audit committees. Under this view, market forces alone are unable to shift audit committees
to their value-maximizing composition; hence, the regulation forces non-compliant firms to move to more
optimal audit committee structures. A competing view of corporate governance is that audit committee
composition is determined endogenously by the firm to maximize its firm value. Under this view, firms
trade off independence, knowledge, and time constraints when comprising audit committees. These
tradeoffs result in firms optimally creating committees that may not conform to the new regulation.
Our research question is to examine whether investors actually benefited by requiring all firms to
move to this size/independence standard audit committee structure. Although the rule change is over 15
years old, our research question is relevant today. In 2002, Congress legislated the 1999 audit committee
size/independence requirements into Section 301 of the Sarbanes-Oxley Act of 2002 (SOX). More
recently, the PCAOB’s website tied audit committee’s effectiveness to (among other things) the audit
committee independence requirements imposed under SOX. Thus, today’s regulatory environment
accepts the premise that this audit committee structure produces value-enhancing results for all firms. Yet,

2
to date, it has not been established empirically if the fundamental requirements of audit committee size
and/or director independence produced their intended effects on non-compliant firms.
The 1999 exchange rules provide a good setting for examining this research question. Our primary
analysis is based on an event study encompassing the dates leading to enactment of the regulation. This
methodology should yield relatively clean results. First, unlike subsequent corporate governance laws, for
example SOX or the Dodd-Frank Act of 2010, which encompass many goals and disparate rules, the 1999
regulation is relatively contained; that is, it relates to changes in the board’s standing audit committee
only. Thus, there is little ambiguity as to which sections of the regulation the market is reacting. Second,
unlike the passage of SOX or the Dodd-Frank Act, there was little to no political jockeying or uncertainty
as to how the 1999 audit committee rule would evolve. The SEC and the exchanges were concordant on
the changes to the listing standards, and together they worked on submitting these changes to the SEC for
final approval.1 Third, the 1999 rule changes preceded the passage of SOX and the accounting scandals
of Enron and WorldCom by at least 20 months. Thus, in many ways, the 1999 change to audit committee
standards can be viewed as a “stand-alone” corporate governance event. Fourth, the 1999 rule is a plausible
exogenous event in the sense that although it did not evolve randomly (i.e., there were economic events
that caused the SEC to propose these rules), there was not one particular firm or group of firms that
triggered the rule change.2 Fifth, the rule is fairly straight forward – all listed NYSE or NASDAQ/AMEX
firms falling under the rule must maintain a minimum three-person, fully independent audit committee by
1 The SEC received 25 comment letters on the proposed rule change. Twenty-two letters favored the proposal, but offered some
modifications, for example, the determinants of what constitutes a “significant business relationship” as it pertained to the
independence of audit committee members. Three letters opposed the proposal, primarily on the premise that boards and firms
should have more flexibility in determining their audit committee structures. See SEC Release No. 34-42233
(http://www.sec.gov/rules/sro/ny9939o.htm) for a description of the comment letters.
2 Several studies, for example, Duchin, Matsusaka, and Ozbas (2010), Armstrong, Core, and Guay (2014) and Chen, Cheng,
and Wang (2015) use the 1999 rule change as an instrumental variable for subsequent changes in board independence, thus
treating the rule change as an exogenous event. Our research question differs from theirs in that we assess the net benefits of
this specific listing standard change whereas these studies evaluate associations between changes in board independence and
firm performance, earnings management, or financial transparency.
3
a certain date. Thus, we can easily identify firms in and out of compliance with the rule prior to the first
event date.
Our event study results are inconsistent with investors placing a positive value on firms moving to
full audit committee independence and/or placing at least three members on its audit committee. We find,
on average, no statistically significant cumulative abnormal stock returns over the specific event dates
leading up to and including the approval by the SEC of the new listing requirements. Thus, the market
assigned no overall net benefit or cost to compliance. We find no evidence of a differential market reaction
to whether the firm’s audit committee was in or out of compliance with the 100 percent audit committee
independence compliance and/or the minimum three-person requirement prior to the formation of the Blue
Ribbon Committee. This suggests that the market placed no premium on firms being forced to move to
compliance. We find no evidence that out-of-compliance firms with higher earnings management
(financial reporting quality) or restatements (audit quality) prior to the proposed changes earned higher
returns than out-of-compliance firms with better financial reporting quality. This latter result is salient
because the SEC’s stated objective of instituting the 1999 changes was to reduce both earnings
management and restatements (Levitt 1998).
Overall, our findings are consistent with the view that mandating a fully independent audit
committee with at least three outside directors is not, on average, value enhancing. However, the empirical
results also are consistent with alternative explanations. One possibility is that the market anticipated (to
some extent) the advent of the new rules prior to our first recorded event – SEC Chairman Arthur Levitt’s
speech approximately 15-months prior to its approval – thus muting the surprise required for an event
study to pick up abnormal returns over our time period. Several tests in this paper rule out this explanation.
A second possible explanation is that the required changes in the listing standards, though enacted, were
not binding and therefore could be ignored by firms choosing to remain out of compliance. We examine

4
this possibility and present results inconsistent with this explanation. A third alternative explanation is
that out-of-compliance firms achieved compliance by merely shifting their extant independent board
members around to gain compliance. This explanation is consistent with Romano’s (2005) assertion that
the provisions in SOX are merely window-dressing, thus rendering the purpose of that regulation to be
ineffective. While it is difficult for us to directly test this possibility, we do present some evidence
inconsistent with firms mainly achieving compliance through window-dressing.
Event studies, however, have several empirical drawbacks, including the assumption of a semi-
strong efficient market during our sample time period. Or, the market, although efficient, may
underestimate the net benefits of the new listing standard. To assuage these concerns, we also estimate
difference-in-differences regressions to assess changes in financial reporting quality surrounding the
phase-in period of the 1999 rule change (see Srinivasan and Coates 2014; Leuz and Wysocki 2016).
Consistent with the market return results, we find no evidence that requiring firms to maintain 100 percent
independent and/or three-person audit committees produced tangible benefits to shareholders.
Overall, our findings are inconsistent with an entrenchment theory of corporate governance as it
relates to mandating all firms to maintain minimum size/fully independent audit committee.
Our paper makes contributions to several literatures. First, our findings are consistent with the
view that not all regulations produce their desired effects. Our “no result” result is similar to Battalio,
Hatch, and Loughran (2011) and Lennox (2016), who find no net benefits or costs to the Securities Act
Amendments of 1964 or to the PCAOB’s restrictions on auditor-provided tax services, respectively. This
contribution is important because under Presidential Executive Order 13563 (2011), all U.S. agencies,
including the SEC, are required to perform periodically a “retrospective [cost-benefit] analysis of existing
rules” (Section 6), with an eye towards modifying, expanding, or repealing them to make them “more

5
effective or less burdensome in achieving the regulatory objectives” (Section 6(b)).3 One possible
modification that the SEC could consider would be to recommend to Congress a change in SOX’s current
mandate on audit committee size and independence towards a disclosure requirement about audit
committee composition. This would be analogous with firms being required to disclose whether the audit
committee has a financial expert (SOX Section 407) or which audit committee directors serve on audit
committees of more than three companies (NYSE Manual Section 303A.07(a)).
Second, recent papers examining associations between financial reporting quality and audit
committee characteristics have moved away from examining the independence/size characteristics placed
in the extant regulations towards more nuanced director characteristics such as financial expertise
(DeFond, Hann, and Hu 2005), industry expertise (Cohen, Hoitash, Krishnamoorthy, and Wright 2014),
legal knowledge (Krishnan, Wen, and Zhao 2011), or social ties (Bruynseels and Cardinaels 2014; Cohen,
Gaynor, Krishnamoorthy, and Wright 2014). Because audit committee director independence is a
requirement since the implementation of the 1999 rule, all of these studies’ conclusions and policy
implications relate to independent directors only. However, our paper’s main conclusion is that requiring
all firms to adopt fully independent audit committees is not value enhancing to all non-complying firms.
Thus, our paper contributes to the dialogue surrounding policy implications of audit committee director
characteristics by considering the fundamental issue of how independence itself contributes to financial
reporting quality. It also has implications on how researchers should incorporate these two factors into
theoretical and empirical studies related to corporate governance mechanisms.
The next section describes the 1999 exchange listing standard changes. Section III reviews prior
literature. Section IV describes the data. Sections V and VI contain the event study results. Difference-in-
3 In addition, the U.S. Courts and the SEC have adopted a cost-benefit framework for evaluating new security regulations. See
Business Roundtable and Chamber of Commerce of the United States v. Securities and Exchange Commission (647 F.3d
1148(D.C. Cir. 2011)) and SEC (2012).

6
difference results are presented in Section VII. Section VIII has robustness tests, and Section IX concludes
and presents suggestions for related future research.
II. 1999 CHANGES IN NYSE AND NASDAQ LISTING STANDARDS
REGARDING AUDIT COMMITTEES
Before the 1999 rule change, large U.S. exchange-listed companies were required to have a
standing audit committee with a majority of its members being “independent” of management. However,
no definition of independence was given, and firms frequently had affiliated directors sitting on their audit
committees (Klein 1998).
On December 14, 1999, the SEC approved new audit committee standards for firms listed on the
NYSE and the NASDAQ. The new rule requires listed firms to maintain audit committees with at least
three directors, “all of whom have no relationship to the company that may interfere with the exercise of
their independence from management and the company.”4 The rule also contains definitions of director
independence. Excluded from independence is a director who is a current employee, an immediate family
member of an executive officer, a former employee of the firm within the last three years, or a director
with a board compensation committee cross link. In addition, the NASDAQ deemed any director receiving
non-director compensation from the firm in excess of $60,000 or whose employer receives at least
$200,000 in the past three years as being non-independent. All of these definitions are for the audit
committee only – they do not apply to the entire board or to any other board committee.
Most of the new guidelines reflect the sentiments and recommendations of the Blue Ribbon
Committee Report (see SEC Release 34-42233), which describes the audit committee’s “job” as “clearly
4 See SEC Release numbers 34-42231, 34-42232, and 34-42233, “Adopting Changes to Listing Requirement for the NASD,
AMEX, and NYSE Regarding Audit Committees.” In November 1998, the AMEX was merged into the NASD, creating The
Nasdaq-Amex Market Group. Hence, the regulatory change for the NASD in 1999 incorporated those made to the AMEX and
to the NASDAQ.

7
one of oversight and monitoring” the firm’s financial reporting (BRC Report 1999, page 7). With respect
to the 100 percent independence standard, the SEC ties audit committee director independence to an ability
to “objectively evaluate the propriety of management’s accounting, internal control, and financial
reporting practices” (SEC Release 34-42233). Fama and Jensen (1983) reflect these sentiments by
proposing that outside board members are best placed to carry out tasks involving agency problems
between internal managers and shareholders.
As for the minimum three-director requirement, neither the BRC Report (1999) nor the SEC
Releases offer a rationale for choosing the number three. Historically, in a consent decree between Killearn
Properties Inc. and the SEC, Killearn Properties agreed to form an audit committee of three outside
directors (Birkett 1986). The consent decree, however, is silent on how or why this number was reached.
The phase-in period for compliance to the new listing standard was 18 months from December 14,
1999. However, the SEC allowed the exchanges to carve out certain exceptions, opt-outs and
grandfathering provisions that may affect a firm’s timing or even its overall compliance with the new
listing standards.
The NYSE standard excludes foreign companies if their audit committee structure is consistent
with their country’s listing standards. It also gave listed companies with less than three members on their
audit committees 18 months to “recruit the requisite members,” and “grandfathered” in all currently
qualified audit committee members until they are “re-elected or replaced” (SEC Release No. 34-42233
December 1999).
The NASDAQ standard excludes companies with revenues less than $25 million. (To be listed on
the NYSE, companies must have at least $100 million of revenues). Both the NYSE and NASDAQ allow
an opt-out feature, that is, a firm may appoint to the audit committee “one director who is not independent
… if the board, under exceptional and limited circumstances determines that membership on the

8
committee by the individual is required by the best interests of the corporation and its shareholders” (SEC
Release No. 34-42231 December 1999). We manually check the proxy statements of our sample of firms
in the year beginning on June 2001, the compliance date, to see if any firms used the opt-out. We find that
two percent of the sample firms, including Apple Computer, Costco Wholesale, and Atwood Oceanics,
were intentionally non-compliant with the independence standard. They cite experience and expertise for
this decision. As a robustness test, we re-do all of our analyses without these intentionally non-compliant
firms and find no difference in empirical results.
III. PREVIOUS EMPIRICAL LITERATURE
There is a large literature of cross-sectional empirical papers examining links between audit
committee composition and financial reporting quality. This section discusses those papers most closely
associated with our study. The main criticism of these papers is that audit committee size and director
independence may be endogenously determined, and thus, observed associations or non-associations may
be influenced by the sample selected, the time period studied, omitted correlated variables, or even reverse
causality. The mixed results from these papers support that view.
The purpose of this literature review is not to resolve the dissimilar results found in these papers.
Instead, it is to demonstrate endogeneity concerns arising from cross-sectional empirical tests of
connections between financial reporting quality and audit committee composition. If audit committee
structure is endogenously determined, then (i) it might be better for all firms to be allowed to choose
optimally their audit committee characteristics and (ii) it validates our choice of using the 1999
“exogenous” rule change as an appropriate setting for a relatively clean empirical test.
Audit Committee Independence and Financial Reporting Quality
9
Beasley and Salterio (2001), Klein (2002a), and Larcker, Richardson, and Tuna (2007) posit an
endogenous choice of audit committee composition and identify ties between audit committee
independence and board and firm characteristics. Armstrong et al. (2014) document linkages between
changes in board independence and changes in financial transparency. If firm characteristics also are
related to an output variable, then it is unclear whether the association (or causality) is between audit
committee independence and the output variable, or through these other variables.
Perhaps because of this criticism, inferences drawn from cross-sectional studies are mixed. Some
papers conclude that fully independent audit committees are associated with lower likelihoods of a firm
committing financial fraud (e.g., McMullen and Raghunandan 1996; Abbott, Park, and Parker 2000;
Beasley, Carcello, Hermanson, and Neal 2009), having an accounting restatement (e.g., Abbott, Parker,
and Peters 2004), or engaging in aggressive earnings management (Bédard, Chtourou, and Courteau
2004).5 Other papers, (e.g., Agrawal and Chadra 2005; Beasley et al. 2009; Klein 2002b) find no empirical
associations between 100 percent independent audit committees and these variables.
Similar mixed inferences are found for papers treating audit committee independence as a
continuous variable, that is, measuring independence in percentage terms. For example, Carcello and Neal
(2000, 2003), Klein (2002b), Bédard et al. (2004) and Vafeas (2005) find that greater independence leads
to better financial reporting outcomes. In contrast, Xie, Davidson, and DaDalt (2003), Felo,
Krishnamurthy, and Solieri (2003), Yang and Krishnan (2005), and Larcker et al. (2007) find no
significant associations.
5 Other studies find a positive association between completely independent audit committees and other accounting outcomes,
for example, audit fees (Abbott, Parker, Peters, and Raghunandan 2003), auditor resignations (Lee, Mande, and Ortman 2004),
and the likelihood of an auditor dismissal after the receipt of the going concern report (Bronson, Carcello, Hollingsworth, and
Neal 2009).

10
Audit Committee Size and Financial Reporting Quality
Linck, Netter, and Yang (2008) present evidence that board size varies across board and firm
characteristics, a finding consistent with board size being endogenously determined. If audit committee
size is similarly determined, then cross-sectional tests between audit committee size and financial
reporting quality suffer from endogeneity issues. Consistent with this observation, inferences from the
following papers yield mixed conclusions.
Beasley et al. (2009) find a negative association between financial fraud and having an audit
committee of at least three members. Abbott et al. (2004) and Bédard et al. (2004) find no relation between
an audit committee with three or more directors and restatements or aggressive earnings management,
respectively. Yang and Krishnan (2005), Davidson, Goodwin-Stewart, and Kent (2005), and Lin, Li, and
Yang (2006) report negative relations between audit committee size and financial reporting outcomes,
while, no association between the two is found by Beasley (1996), Xie et al. (2003), and Farber (2005).
IV. BOARD AND AUDIT COMMITTEE DATA
The changes to the listing standards began with a speech by then-SEC Chairman Arthur Levitt on
September 28, 1998. From the RiskMetrics Directors’ database, we have 1,472 distinct firms with required
board and audit committee data immediately prior to Levitt’s speech date. From this initial sample, we
exclude financial firms [Standard Industrial Classification (SIC) codes 6000 through 6999] because their
board and audit committee compositions are subject to their own regulatory environment. After further
eliminating firms without the required CRSP and Compustat data, we have a usable final sample of 1,122
distinct firms.
We align each sample year with Levitt’s speech, i.e., each year runs from September 29 of year t-
1 through September 28 of year t. In the year ending prior to Levitt’s speech (designated 1998), 82.7% of

11
the firms had a standing audit committee with at least three members (composed of independent and non-
independent directors).6 52.1% of audit committees were composed of independent directors only (albeit
various committee sizes). Less than one half of the firms – 40.8% – were in full compliance with the new
listing standard, i.e., they had a fully-independent audit committee with at least three members. Thus,
many firms needed to either shift their board members around or add new independent board members to
eventually comply with the new regulation.
V. EVENT STUDY APPROACH
Event Study Market Return Approach
We use an event study approach to evaluate the market’s assessment of the net costs or benefits to
shareholders of the 1999 regulation. This methodology has been used to assess the market impact of other
major securities regulations, for example, the PSLRA Act of 1995 (Johnson, Kasznik, and Nelson 2000;
Ali and Kallapur 2001), SOX (Jain and Razaee 2006; Zhang 2007; Chhaochharia and Grinstein 2007; Li,
Pincus, and Rego 2008), and regulations affecting executive pay or proxy access (Larcker, Ormazabal,
and Taylor 2011; Akyol, Lim, and Verwijmeren 2012).
6 In 1998, there was no legal or regulatory definition of an independent director. Instead, the stock exchanges gave boards
discretion to determine if a director could be classified as independent or not. From the BRC Report (1999) date through the
enactment date of SOX, the characteristics determining an audit committee independent director were a moving target.
Following Coles, Daniel, and Naveen (2008) and Duchin et al. (2010), we use the classification of independent directors in the
RiskMetrics database. Riskmetrics considers any director as being independent of management if that director (a) never worked
for the company, (b) never personally (or through employer) received professional compensation from the company, (c) is not
on a board interlock with any executive of the firm, and (d) if a family member, does not currently work for the firm. In some
ways, these requirements are more stringent than those eventually adopted by the SEC or SOX. On (a), SOX is silent on past
employment; the 1999 listing standards consider prior employment greater than three years ago to not hinder independence.
On (b), the NASDAQ listing standard allows independent directors to receive $60,000 of professional compensation from the
firm; the NYSE listing standard leaves the amount of compensation up to the discretion of the board. In other ways, RiskMetrics
requirements are less stringent than those eventually instituted by the SEC or SOX. SOX, for example, considers directors
holding at least 10% of the firm’s equity as not being independent, whereas RiskMetrics does not use stock ownership as an
independence characteristic.
12
In order for an event study to be an appropriate methodology to evaluate the net costs or benefits
of a regulation (or any event), four underlying assumptions of the methodology must be satisfied. Our
setting appears to satisfy each of these assumptions.
The first assumption is that the market must be aware of the event dates. As we show in the next
section, all events used in this study are accompanied by a news announcement, an SEC news release, or
were published in the SEC Digest on the date of the event.7 Second, the new regulation must be
unanticipated by the market. To determine this, we examine both the SEC website and Lexis-Nexis for
the full year prior to Levitt’s speech to find evidence of any announcements, discussions, or speeches by
SEC, NYSE, or NASDAQ personnel suggesting that any of these parties would propose changes in audit
committee listing standards. We also look for outside groups, for example, the AICPA, making similar
suggestions or proposals. We come up with only one reference, a speech by SEC Commissioner Levitt on
March 12, 1998 on director responsibilities, in which he spoke of the duty of directors in general, and
audit committees specifically, to ask difficult questions (SEC 1998c). Instead, we find numerous
references and speeches related to international accounting standards and the importance of auditor
independence in the financial reporting system. Third, the events should be relatively “clean,” that is, they
should be self-contained and the direction of the market reaction should be relatively unambiguous. The
scope of the audit committee regulation is fairly narrow and there is little to no uncertainty on whether it
would be enacted. Fourth, since the regulation is new to the market, the market needs a contextual base to
evaluate its effectiveness. On December 20, 1974, the SEC issued Accounting Series Release No. 165,
“Notice of Amendments to Require Increased Disclosure of Relationships Between Registrants and Their
Independent Public Accountants,” which stated in part: “Disclosure is required of the existence and
7 Event #3 is from the BRC Report (1999). The report states that the BRC announced a request for public recommendations.
We are unable to find this announcement in Lexis-Nexis. We present our main results without this event in one of our robustness
tests.

13
composition of the audit committee of the board of directors… This disclosure will make stockholders
aware of the existence and composition of the committee. If no audit or similar committee exists, the
disclosure of that fact is expected to highlight its absence.” Thus, investors had 25 years of flexible audit
committee composition standards to assess their impact on financial reporting quality.8
Overall, we conclude that the regulatory setting we use is well suited for an analysis using an event
study approach.
Event Dates Leading Up to Regulatory Changes: Daily and Overall Abnormal Returns
We compile a list of events leading up to the listing standard changes by searching the SEC website
and Lexis-Nexis for announcements and notices of filings; we supplement this search with the list of press
releases contained in the BRC Report. Unlike previous studies that examine share price reactions around
legislative events (e.g., Zhang 2007; Li et al. 2008; Larcker et al. 2011), there were few negotiations and
no input from Congress or the Executive branch of the U.S. government. There are eight events in all,
spanning from September 28, 1998 to December 14, 1999.9
Using the Schipper and Thompson (1983) abnormal return framework, we estimate a Fama and
French (1992) three factor model with an added dummy variable, Dkt equal to one for days [0, +1], in
which day 0 is one of the eight event dates, and equal to 0 for all non-event days.10 The regression uses
8 In 1978, the NYSE amended its listing standards to require all listed companies to maintain an audit committee composed
solely of directors deemed (by the board) to be independent of management. The NASDAQ and AMEX followed suit in 1989
and 1993, respectively, although neither exchange required the committee to be fully independent of management. None of the
exchanges mandated a minimum number of directors. 9 We exclude news stories and speeches on the merits or demerits of the proposed regulations expressed by individuals,
organizations, or SEC personnel during this time period. A search of Lexis-Nexis using the search string “audit committee and
blue ribbon committee” produces over 30 articles during this time period. The SEC website contains transcripts from 19
speeches by SEC Commissioners, the Chief Accountant, and other SEC officials over the same time period. 10 Other papers using variants of Schipper and Thompson (1983) to examine overall market effects of adopting a new regulation
include Chhaochharia and Grinstein (2007) and Akyol et al. (2012). We also use days -1 through +1 as the event period. The
results and conclusions reported in this paper are robust to including the day prior to the announcement date. However, we are
unable to find any public leakage of any of the eight announcements prior to day zero, and therefore, we believe that using the
two day window [0,+1] is a more accurate depiction of the stock market reaction.

14
panel data encompassing all 1,122 firms in our sample over the 504 trading days spanning from January
1, 1998 through December 31, 1999. Specifically:
Rpt = α + β1 (Rmt – Rft) + β2SMBt + β3HMLt + γkDkt + εt (1)
Rpt is the vector of cross-sectional returns on day t minus the risk-free rate (Rft) weighted by the estimated
covariance matrix of residuals on day t.11 Rmt is the CRSP value-weighted market index for day t, SMBt
and HMLt are the Fama/French factors Small minus Big portfolio returns and High minus Low (value
minus growth) portfolio returns, respectively, as provided on Ken French’s website. γk is the coefficient
on Dkt; it measures overall market reaction for each event k. εt is the error term, which is assumed to be
normally and independently distributed. To extrapolate from the effects that a U.S. regulation has on all
U.S. traded firms, we alternatively use the S&P/TSX Composite Index of the Canadian market (see Zhang
1997) and find similar results (not tabulated).
[insert Table 1 here]
Table 1 presents a description of the eight event dates, along with the sources we use to locate the
date, the two-day abnormal return around the event date and its corresponding t-statistic. The process
began on September 28, 1998 (Event #1) when Chairman Levitt delivered a speech expressing concern
about the quality of financial reporting in the U.S. In his speech, Levitt announced that the “NYSE and
NASD will sponsor an eleven-member ‘blue ribbon’ panel drawn from the various constituencies of the
financial community to make recommendations on strengthening the role of audit committees in
overseeing the corporate financial reporting process.” (SEC 1998a) The mandate of the panel, co-chaired
by John Whitehead and Ira Millstein, was to issue a report within 90 days with a list of recommendations
11 Because equation (1) is estimated over the full time period and because the vector of individual firm returns are weighted by
the covariance matrix of residuals, we are able to account for the cross-sectional correlations among firms over the full time
period (including both event and non-event days). Thus, the reported standard errors of the parameter estimates are more
efficient than using a straight OLS estimation.
15
for improving audit committee effectiveness.12 The names of the remaining nine members of the panel
were announced on October 6, 1998 (Event #2). The announcement emphasized that the panel is
composed of “corporate and industry leaders” (SEC 1998b).13 A call for public comments on possible
recommendations by the Panel was announced on November 4, 1998 (Event #3). This announcement
capped the comment period to December 1, 1998, provided information about the forthcoming December
9, 1998 public hearing (Event #4), and contained a list of topics to be considered, including the question
of “should each member of an audit committee be required to be independent?” (BRC Report 1999).
The BRC Report was released on February 8, 1999 (Event #5). The report contains ten separate
recommendations. The first seven recommendations are proposed changes in NASDAQ and NYSE listing
requirements. Recommendation 1 deals with the definition of an independent audit committee director.
Recommendations 2 and 3 provide for audit committees to have at least three directors, all of whom are
independent, as defined in recommendation 1. Recommendations 4 through 7 deal with the existence,
disclosure and details of an audit committee charter. Recommendation 8 and part of 10 are directed
towards the Audit Standards Board (ASB) of the AICPA. Recommendation 8 requires the company’s
auditor to discuss the auditor’s judgments about the quality of the company’s accounting principles with
the audit committee, and Recommendation 10 extends this to auditor quarterly reviews. Recommendations
9 and part of 10 target the SEC. Recommendation 9 requires 10-K filings to contain a letter from the audit
committee disclosing several mandated details about the audit process. Recommendation 10 recommends
an SAS 71 financial review for all quarterly (10-Q) statements.14
12 John Whitehead is a former Deputy Secretary of State and a retired Co-Chairman and Senior Partner of Goldman Sachs. Ira
Millstein is a senior partner of Weil Gotshal & Manges, a large corporate law firm. 13 The nine additional members were three persons from large corporations, two persons from Big 4 accounting firms, the
CEOs from the NYSE and NASD, respectively, the CEO of TIAA-CREF, and a former controller general of the U.S. 14 An SAS 71 review consists principally of applying analytical procedures to financial data and making inquiries of the
company’s officers responsible for financial and accounting matters. It was superseded in November 2002 by SAS 100, which
ratcheted up the requirements. In December 2003, the PCAOB issued Auditing Standard 1, which further refined the standards
used in an interim financial review.
16
On September 2, 1999 (Event #6), the SEC obtained board approval to file proposed rule changes
to audit committee standards for NYSE and NASDAQ listed companies. Dual Notices of Filing of
proposed changes were made on October 6, 1999 (Event #7). The proposed changes were virtually
identical to those contained in Recommendations 1 through 7, with two key exceptions. The NASDAQ
provided for a limited opt out of the 100 percent independence requirement, and also allowed companies
with sales less than $25 million to establish and maintain an audit committee of at least two members, a
majority of whom are independent. The SEC approved the NYSE and NASDAQ rule changes on
December 14, 1999 (Event #8).
The overall average abnormal return for the 8 events is 0.48% (t-statistic = 0.73). None of the
events, with the exception of event #2, garnered a statistically significant market reaction. When we use
the Canadian market index (untabulated), we find a cumulative abnormal return of -0.16% (t-statistic = -
0.93). In summary, the overall market reaction to the regulatory process is not significantly different than
zero.
VI. EVENT STUDY HYPOTHESES, TESTS, AND RESULTS
Hypotheses
The maintained assumption behind an event-study methodology surrounding the adoption of a new
regulation is that each firm’s cumulative abnormal return is a reflection of the market’s assessment of that
firm’s net benefit (positive CAR) or net cost (negative CAR) of adoption. Since the ruling directly affects
only firms out of compliance, we expect differential market reactions between firms in and out of
compliance. Under an entrenchment hypothesis, firms create audit committees to benefit management at
the expense of their shareholders. Thus, forcing firms out of a suboptimal committee composition via the
new regulation will be, on average, beneficial, resulting in a prediction of higher abnormal stock returns
17
for non-complying firms. In contrast, an optimization hypothesis predicts that firms set up audit
committees to maximize firm value. Under this hypothesis, forcing firms into compliance will be, on
average, non-beneficial, resulting in a prediction of lower abnormal stock returns for firms initially out of
compliance.
However, there may be cross-sectional variations of benefits or costs to compliance, which should
be reflected in the data. According to the SEC and the BRC Report, the major expected benefit from
having firms adopt the 1999 listing standards is an improvement in their financial reporting quality.15 This
benefit strongly implies that non-compliers with weaker financial reporting quality should, on average,
earn higher abnormal returns than non-compliers with stronger financial reporting quality. There may also
be direct and indirect costs of compliance. For example, non-compliant firms may have to increase their
board size to accommodate a larger and/or more independent audit committee, thus incurring search costs
(e.g., see Nguyen and Nielsen 2010). Thus, non-compliers with needs to expand their board size should,
on average, earn lower abnormal returns than firms already in compliance. In section 6.3, we consider
several direct and indirect compliance costs.
Research Design
We first test for significant differences in stock returns between firms in and out of compliance in
1998. Specifically, we estimate the following two regressions:
CARi = α + β1 OOCi + Σ Controls + εi (2a)
CARi = α + β1 AudIndi + β2 AudSizei + Σ Controls + εi (2b)
15 The same benefit was espoused for the passage of SOX. Li et al. (2008) and Zhang (2007) examine market reactions around
the adoption of SOX. Li et al. (2008) find evidence of a positive association between the stock market reaction and the amount
of discretionary accruals (earnings management) for their sample of firms, thus concluding that SOX was perceived as being
beneficial in curbing earnings management. Zhang (2007) finds the opposite result. Neither study, however, considers whether
a firm was in or out of compliance with SOX standards.
18
The dependent variable, CARi, is firm i’s eight-event cumulated abnormal return over days [0, +1],
accumulated over the events in Table 1. In equation (2a), OOCi is an indicator for firms out of compliance
with the dual requirements of full independence and the minimum number of directors. In equation (2b),
we separate out the individual compliance parameters – AudIndi is an indicator for firms out of compliance
with the 100 percent independent audit committee requirement, and AudSizei is an indicator for firms out
of compliance with the minimum three director audit committee requirement.
To allow for variations in benefits and costs associated with eventual compliance, we add benefit
and cost variables, along with their interactions with initial compliance into our specifications.
Specifically:
CARi = α + β1OOCi + Σ β2Benefiti + Σ β3OOCi × Benefiti
+ β4Costi + Σ β5OOCi × Costi + Σ Controls + εi (3a)
CARi = α + β1AudIndi + β2AudSizei
+ Σ β3Benefiti + Σ β4AudIndi × Benefit + Σ β5AudSizei × Benefiti
+ Σ β6Costi + Σβ7AudIndi × Costi + Σ β8AudSizei × Costi + Σ Controls + εi (3b)
The interactive terms measure the extent to which the market values the perceived benefit or cost of
compliance. Significantly positive coefficients on β3 in equation (3a) and β4 and β5 in equation (3b) are
consistent with the 1999 regulation producing anticipated benefits; significantly negative coefficients on
β5 in equation (3a) and β7 and β8 in equation (3b) are consistent with the expectation that non-compliers
bear substantive compliance costs.
All independent variables are taken prior to Levitt’s speech. By using publicly available data prior
to the initial event date, we avoid a look-ahead bias in our tests. Thus all variables used in our analyses
are available to the market throughout the event period.
19
To estimate equations (2a) through (3b), we use the Sefcik and Thompson (1986) portfolio
weighting procedure. This procedure produces the same parameters as estimating an OLS cross-sectional
regression of abnormal returns on firm characteristics. The difference between the two methods is that
under the Sefcik and Thompson (1986) methodology, the standard errors of the estimates fully incorporate
the cross-correlations among the firm characteristics, thus improving the efficiency of the estimates. See
Appendix A for details of this procedure.
Benefit and Cost Variables
Benefit Variables
There are many possible benefits associated with moving a firm towards a three-person fully
independent audit committee. The primary benefit articulated by Levitt (1998), the BRC Report (1999)
and the SEC (1999) is an improvement in financial reporting quality after compliance, with Levitt (1998)
citing earnings restatements and earnings management as two examples of poor financial reporting
quality. Financial restatements typically involve violations of GAAP. Some studies regard restatements
as indicators of poor financial reporting quality (Cohen, Hoitash, Krishnamoorthy, and Wright 2014).
Other studies treat restatements as measures of poor audit quality, leading to lower financial reporting
quality (DeFond and Zhang 2014; Lennox 2016). Earnings management captures management’s ability
to manipulate income generally within GAAP.
If non-compliant firms with relatively poor financial reporting quality benefit most from the 1999
rules, then the coefficients β3 in equation (3a) and β4 and β5 in equation (3b) will be significantly positive
for firms with restatements or with higher earnings management in the time period before event #1.
20
We use the database compiled by Andrew Leone from the United States Government
Accountability Office (GAO 2002) to separate fraud-based restatements from error-based restatements.16
Restatement is an earnings restatement announced by the firm from 1996 through 1998. Fraud is an
announced fraud-based restatement. Earnings management, EM, is the absolute value of adjusted
discretionary accruals, based on an expected accruals quality specification from McNichols (2002) and
Francis, LaFond, Olsson, and Schipper (2005). This measure adds sales and PP&E to the Dechow and
Dichev (2002) cash flow model. To account for the volatility of the earnings process, we subtract the
median abnormal accrual from a portfolio of firms with similar levels of past five-year accrual volatility
(see Kasznik 1999; Klein 2002b). See Appendix B for details on how EM is calculated.17
Cost Variables
We consider several direct and indirect costs of compliance. First, we locate a group of firms that
must change its board composition to gain compliance with the 1999 regulation. In 1998, NYSE and
NASDAQ listing standards allowed firms to maintain boards with two independent directors only. For
our sample, 11.5% of firms had a board with just two independent directors in 1998. For these firms,
compliance with the new 1999 rule would entail, at a minimum, the addition of one new independent
director. Consistent with this observation, the percentage of firms with only two independent directors on
its board drops to 2.7% in 2002 (p < 0.001), with an average increase in total board size of 0.83 directors
between 1998 and 2002. In contrast, boards with three or more independent directors in 1998 reduced
16 See sbaleone.bus.miami.edu. Hennes, Leone, and Miller (2008) use a subset of this sample in their paper. According to the
website, the database has been updated by Andrew Leone. 17 Finding an appropriate measure of earnings management, as represented by abnormal accruals, is difficult and imprecise.
There are many abnormal accrual measures, each with their positive and negative statistical and economic characteristics. See
Dechow, Ge, and Schrand (2010) for an excellent discussion of these issues. As robustness tests, we use other abnormal accrual
specifications, for example, the adjusted Jones model and the Dechow and Dichev (2002) model. We also match-adjust by past
and by current earnings, by the 10-year total accrual volatility; we also use non-matched adjusted accruals. The results reported
in this paper are consistent with each of these individual specifications (untabulated).
21
their board size, on average, by -0.24 directors by 2002. The difference, 1.065, is significantly different
from zero at the 0.001 level.
Two direct costs associated with increasing the number of independent directors from two to a
minimum of three members are search costs (Nguyen and Nielsen 2010) and higher independent director
compensation costs (Linn and Park 2010). However, there also may be substantive indirect costs that
would be reflected in the firm’s stock price. Fama and Jensen (1983) posit that a board’s function is both
to monitor and to provide advice to upper management, with different firms requiring different levels of
monitoring and advice. If a two-independent-director board endogenously maximizes these board
functions for a particular firm, then forcing that firm away from this board structure may result in indirect
costs from compliance via a loss of firm value. Ind2 is an indicator for whether the firm’s board has only
two independent directors in 1998.
Second, we consider firm size. Prior research finds a negative association between firm size and
SOX compliance costs (e.g., Chhaochharia and Grinstein 2007; Gao, Wu, and Zimmerman 2009; Iliev
2010). Size is the natural log of the market value of the firm’s equity in 1998.18
Third, if firms select audit committee independence to maximize firm value, then forcing a non-
compliant firm with an optimal committee structure into a sub-optimal committee composition would
result in that firm incurring indirect compliance costs. We follow Bryan, Liu, Tiras, and Zhuang (2013)
and use the inverse Mill’s ratio from Klein’s (2002a) probit selection model to determine whether it is
optimal or sub-optimal for boards to have 100 percent audit committee independence.19 We use the inverse
18Alternatively, we substitute Size_200, an indicator for firms with market capitalizations of at least $200 million in 1998 in
our regression analyses. We choose $200 million as a cut-off in response to the BRC report, which proposed an exemption
from audit committee independence/minimum size rules for all firms with market capitalizations less than $200 million (see
Recommendations 1-3). The final exchange rules did not include this recommendation. Instead, the NASDAQ excluded firms
with market capitalization less than $25 million; the NYSE has no size cutoffs. Using Size_200 instead of Size in the regressions
yields the same inferences on the compliance variables, the interactive variables, and on Size. 19 We are unaware of an analytical or empirical study that models equilibrium audit committee size and therefore do not examine
firms being in or out of optimality with respect to audit committee size.

22
Mill’s ratios to classify firms as being in or out of equilibrium with respect to 100 percent independence
(see Appendix C for a fuller description of the methodology). The dummy variable, OptimalAudIndi, is
equal to one if firm i optimally chose its audit committee independence. We include these three variables
as our cost variables in equations (3a) and (3b), and predict negative coefficients on β5 in equation (3a)
and β7 and β8 in equation (3b).
Control Variables
To control for the Fama and French (1992) risk factors associated with market returns, we include
the firm’s book-to-market ratio (Book-to-Market is book value of equity divided by market value of
equity).
Although we cannot account for all other corporate governance mechanisms, we include several
important variables as alternative corporate governance controls in our equations. Financial Expert is an
indicator for whether the audit committee has at least one accounting expert on its audit committee. We
follow Cohen, Hoitash, Krishnamoorthy, and Wright (2014) in creating this variable. Busy AC is a binary
variable indicating whether a majority of independent directors serve on more than three boards. AC
Ownership is the percent of firm stock owned by all audit committee members. AC Tenure is the average
tenure each member has served on the board. CEO Duality is a binary variable for whether the CEO also
chairs the board.
We control for the trading exchange of the firm’s equity by include NYSE, a binary variable
indicating if the firm’s equity is traded on the NYSE or on the AMEX/NASD. Controlling for stock
exchange is important for three reasons: (i) NYSE and AMEX/NASD had certain differences in the final
1999 rule change (e.g., definition of independent director), (ii) there may be differences in firm
characteristics according to listed exchanges (e.g., differences in initial and continuing numerical listing
standards), and (iii) there may be differences in enforcement among exchanges. We also control for auditor

23
type with BigFive, a binary variable indicating whether the firm’s external auditor is today’s Big Four
plus Arthur Anderson or a smaller audit firm.
Empirical Results
Descriptive Statistics
Table 2, Panel A presents temporal data on audit committee (board) independence and size. The
percentage of firms with an audit committee of at least three members increased from 82.7% in 1998 to
95.9% in 2002 (p-value < 0.001). The percentage of firms with a fully independent audit committee rose
from 52.1% in 1998 to 70.8% in 2002 (p-value < 0.001). Full compliance changed from 40.8% in 1998 to
67.3% in 2002 (p-value < 0.001). The fact that not all firms became fully compliant in 2002 is consistent
with other papers examining trends in audit committee independence around or including this time period
(e.g., Chhaochharia and Grinstein 2007; Duchin et al. 2010).
[insert Table 2 here]
Table 2, Panel B presents mean changes in independence and audit committee size between 1998
and 2002 for firms in and out of compliance in 1998. The panel is consistent with the regulation having a
tangible effect on audit committee structure over the transition period. Firms out of compliance with full
independence have, on average, a 21.4% increase in audit committee independence, compared to a mean
reduction of -4.5% for firms already in compliance (difference is significant at 0.001 level).20 Firms out
of compliance with the minimum size rule increased audit committee size, on average, by 1.178 members
20 The mean reduction of 4.5% in audit committee independence is driven by a few firms that fell out of compliance between
1998 and 2002. Of the 585 firms with 100 percent audit committee independence in 1998, eight firms explicitly used the opt-
out clause of intentional non-compliance in 2002. Of these eight firms, five retained a former executive officer as an audit
committee member citing their expertise as reason to override the rule. Because opt-out firms may not benefit or bear indirect
costs from the rule changes relative to firms that did comply, we re-run all the analyses excluding these firms to mitigate
concerns of these firms biasing our results,. Our main results are unchanged when excluding opt-out firms. We also note that
several changes in compliance are artifacts of slightly different definitions of director independence between the stock
exchanges and RiskMetrics (See footnote 6).

24
from 1.930 in 1998 to 3.109 in 2002. In contrast, compliant firms reduced audit committee size by -0.106
directors, from 4.080 in 1998 to 3.974 in 2002. The difference between 1.178 and -0.106 is significantly
different from zero at the 0.001 level.
Table 2, Panel C presents mean changes in independent directors at the board level between 1998
and 2002 by the number of independent directors already sitting on the board in 1998. The purpose of this
table is to examine if non-compliant firms were more likely to shift existing independent directors onto
the audit committee or to go outside and recruit new independent directors. Because there were other
board composition changes occurring over the same time period, we compare non-compliant firms with
firms already in compliance in 1998. Consistent with the shift towards more independent boards (Panel
A), we observe an increase in the number of independent board directors over time. However, this increase
is greatest for non-compliant firms with five or fewer independent directors in 1998, suggesting that the
increase in board independence was felt most sharply by boards with fewer independent directors.21 We
also find no difference in the change in the number of independent directors between compliers and non-
compliers after controlling for the initial number of independent directors. In tandem, these findings are
inconsistent with boards primarily shifting independent directors around to achieve compliance with the
1999 listing standard change.
In Table 2, Panel D, we present changes in the number of financial experts on the audit committee
between 1998 and 2002. If firms moved existing independent directors around to gain compliance with
the 1999 rule, then we expect to see little to no increase in the number of qualified directors sitting on the
audit committee. This assertion is based on the assumption that boards are most likely to place directors
with financial expertise on the audit committee. Consistent with Panel C, we see little to no evidence that
21In a similar vein, Armstrong et al. (2014) use a sample of 453 firms that are non-compliant with the 2003 listing standard
change requiring all firms to have a majority-independent board of directors. Of these non-compliant firms, 68% increased
their board size to gain compliance by the end of the transition period.

25
non-compliant firms gained compliance by moving existing independent directors around. Specifically,
we note that both compliant and non-compliant firms showed similar increases in placing financial experts
on their audit committees, a phenomenon consistent with all firms seeking improvements in audit
committee quality.
[insert Table 3 here]
Table 3 contains summary statistics on the control variables. The average market value of equity
is $6.4 billion, which is larger than the median firm size of $1.2 billion, suggesting our sample is positively
skewed by the addition of some large firms. The mean and median values are substantially greater than
the $1.7 billion ($132 million) mean (median) we calculate (untabulated) for the full Compustat/CRSP
universe (financial firms excluded). The mean and median book-to-market ratios are 0.51 and 0.44,
comparable to 0.51 and 0.43 for the Compustat/CRSP sample (untabulated). Consistent with our sample
being skewed towards larger firms, over 98% of firms have a Big Five external auditor. The majority of
firms (70%) have stock traded on the NYSE, followed by firms with stock traded on the NASDAQ (27%)
and the AMEX (3%). Of the board governance variables, we note that only 38.1% of firms had at least
one accounting financial expert on its audit committee in 1998.
Regression Results for Equations (2a) to (3b)
Table 4 presents regression results. Columns (1) and (2) examine differences by whether the firm
was in compliance in 1998. In column (1), the coefficient on OOC is insignificantly negative at the 0.10
level. The coefficients on AudInd and AudSize in column (2) are insignificantly different from zero. These
findings suggest that ceteris paribus, the market placed little to no net benefit (or cost) on the 100 percent
independence or on the minimum three-person requirement.
[insert Table 4 here]
26
Columns (3) to (6) test whether the market reaction surrounding non-compliant firms depends on
the perceived benefits of ultimate compliance. The key variables are the interactive terms between the
benefits (Fraud, Restatement, EM) and the initial compliance variables (OOC in columns 3 and 4; AudSize
and AudInd in columns 5 and 6). All coefficients on the interactive terms are statistically insignificant at
conventional levels. Thus, the market did not react more positively (or negatively) to whether out-of-
compliance firms had better or poorer financial reporting.
In columns (7) to (10), we add the cost variables and their interactive terms to our estimations. For
all specifications, the coefficient on Ind2 is significantly negative, consistent with investors placing a net
cost on firms with only two independent directors. To further examine the source of this cost, we interact
Ind2 with Fraud, Restatement and EM. The coefficients on these interactive terms are insignificantly
different from zero, suggesting that the perceived net costs from moving away from two independent
directors are not related to financial reporting concerns, but to other factors, for example, search costs
(Nguyen and Nielsen 2010), higher director compensation costs (Linn and Park 2010) or indirect costs of
moving away from an optimal board structure (Fama and Jensen 1983).
For all specifications, the coefficient on Size is insignificantly different from zero. Similarly,
interacting Size with the compliance variables yields insignificant coefficients. These results are
inconsistent with firm size being associated with compliance costs.
If the market perceives the firm’s audit committee independence as being endogenously
determined in an optimal way, then the coefficient on the interactive term, AudInd × OptimalAudInd will
be negative, as this represents the group of firms the regulation will be forcing out of equilibrium. This
does not appear to be the case. The coefficients on OptimalAudInd and AudInd × OptimalAudInd are
insignificantly different from zero. These findings support the view that the market is indifferent to
whether the firm’s audit committee was in or out of compliance with the 100 percent independence rule.
27
All inferences from the regression results hold after controlling for other corporate governance,
exchange, and auditor effects. Most control variables are insignificantly different from zero. The
exceptions are Busy AC in columns (9) and (10) and NYSE, the latter being significantly positive in all
specifications.
In summary, we find no evidence that the market placed any net benefit on firms moving to having
audit committees with 100 percent independent directors and/or with at least three members. In contrast,
there is some evidence of a direct cost to compliance. Specifically, the market reaction to firms with only
two independent directors in 1998 is significantly lower than their counterparts. Overall, our event study
findings are inconsistent with an entrenchment theory of corporate governance with respect to moving
non-compliant firms to maintaining an audit committee with at least three independent directors. Instead,
they are consistent with a market theory of corporate governance, suggesting that, on average, firms
endogenously choose audit committee structures to maximize firm value.
Possible Alternative Explanation: Rigor of Enforcement
Our findings are consistent with the market viewing the new audit committee regulations as
providing little to no value to shareholders. However, an alternative explanation is that the enforcement
of the new standards will be lax, resulting in the market being unsure of whether out-of-compliance firms
will change their audit committees to adhere to the new regulations. That is, moving out-of-compliance
firms into compliance, in fact, may be value enhancing, but if the exchanges are lax in enforcing the new
rules, the market will treat the passage of the regulation as a non-event.
We have several reasons to believe this may be a plausible explanation. As Table 2, Panel A
illustrates, in 2002 (prior to SOX), only 67.3% of firms in our sample were compliant with the dual
regulation of independence and size; 70.8% had a fully independent audit committee, and 95.9% had at

28
least three directors on its audit committee. Thus, many firms did not achieve compliance within the 18-
month transition period. Further, the enforcement of listing standards falls to the exchanges themselves.
If a firm is in violation of a listing standard, the exchange has the option to delist that firm. The delisting
process, however, can encompass many steps and could last for several years.22
To examine this alternative explanation, we re-do our event study analysis, but instead of using
the events leading up to the passage of the 1999 regulation, we use the dates leading up to the passage of
SOX as our event dates. As previously stated, the audit committee independence/size rules in the 1999
listing standard became part of federal law under SOX in 2002.23 We propose that firms have less
flexibility in violating SOX requirements since violators would now be subject to both SEC enforcement
actions and shareholder class action suits. Thus, if enforcement is behind our insignificant results on
compliance, we should observe significantly positive coefficients on firms out of compliance prior to
SOX.
One econometric problem with doing an event study around the passage of SOX is identifying
which dates to use. Zhang (2007) and Li et al. (2008), for example, have few overlapping dates in their
event studies. To account for this difficulty without entering the fray as to which dates are appropriate, we
use their event dates separately in two separate sets of regression analyses. Table 5, Panel A contains the
event dates for both papers. We define OOC, AudInd, and AudSize relative to E1 for each estimation.
[insert Table 5 here]
22 Using the NASDAQ as an example, if a firm is in violation of a listing standard, the NASDAQ will send a letter to the firm
concerning the violation. The firm can either remedy the violation, or it can request a hearing with the exchange. The hearing
usually results in a recommendation to the firm about a time frame to amend the violation, which could result in the firm
remaining in violation for a significant amount of time. 23 The SEC finalized Section 301 on April 25, 2003, giving firms until the earlier of their first annual shareholders meeting
after January 15, 2004 or October 31, 2004 to fully comply. (see SEC Release Nos. 33-8220 and 34-47654 on
www.sec.gov/rules/final/33-8220.htm)
29
Table 5, Panel B has the regression results. CAR is the two-day abnormal return accumulated
around the 8 (17) dates from Li et al. (2008) (Zhang 2007). Using the Li et al. (2008) dates, we find, at
the 0.10 levels, significantly negative coefficients on OOC in column (1) and on AudInd in column (2), as
well as an insignificant coefficient on AudSize in column (2). Using the Zhang (2007) dates, all coefficients
are insignificantly different from zero. These findings, among other interpretations, support the view that
our regression results for the dates leading up to the 1999 regulation is not due to enforcement issues. That
is, under both enforcement regimes, we find no evidence of positive shareholder reaction for firms that
are out of compliance prior to the passage of the new audit committee composition regulations.
VII. DIFFERENCE-IN-DIFFERENCES REGRESSIONS
In this section, we take a different approach to assessing the benefits of firms changing their audit
committee structures to adhere to the new 1999 regulation. Instead of using market returns as our metric
of net benefits or costs, we estimate difference-in-differences (DiD) regressions for several output
variables over pre- and post-transition time periods. An advantage of using this approach is that we need
not assume the market fully understood the ex post implications of the regulatory changes over the time
period leading up to the listing standard’s adoption. Instead, we measure whether desired changes, for
example, less earnings management or fewer restatements, are seen after the implementation of the 1999
rules. A disadvantage of this approach is that it relies on the assumption that the change in outcome
variable is attributable to the regulation itself. We discuss this more fully below.
Difference-in-Differences Methodology
We estimate the following models of accounting restatements, fraudulent restatements, and
earnings management:
Pr(Restatementi = 1) = γ0 + γ1OOCi + γ2Post + γ3 OOCi × Post + Controls + μi (4)
30
Pr(Fraudi = 1) = γ0 + γ1OOCi + γ2Post + γ3 OCCi × Post + Controls + μi (5)
EMi = γ0 + γ1OOCi + γ2Post + γ3 OOCi × Post + Controls +μi (6)
The dependent variables are whether the firm had a restatement, a fraudulent restatement, and our measure
of discretionary accruals. For equations (4) to (6), out-of-compliance firms (OOC=1) comprise the
treatment group, and firms already in compliance (OOC=0) are the control sample. We also break OOC
into AudInd and AudSize and report results with these two variables replacing OOC.
Similar to Lennox (2016), who does DiD regressions surrounding the enactment of a PCAOB
ruling, we divide our timeline into a transition period, a pre-transition period, and a post-transition period.
The three key dates surrounding the 1999 listing standard rule change are September 28, 1998, the Levitt
speech date, December 31, 1999, the enactment date, and June 30, 2001, the final date to gain compliance.
Based on these dates, we designate the transition period to be from September 28, 1998 to June 30, 2001
and exclude data from this period. The year ending prior to September 28, 1998 is in the pre-transition
period, and the year beginning on June 30, 2001 is in the post-transition window. Post is a binary variable
equal to one for post-transition dates and zero for pre-transition dates.
All dependent variables are measured over the pre- and post-transition periods. OOC is the
compliance/non-compliance indicator in the pre-transition period. We include the alternative corporate
governance measures from the event study as control variables. We also add an array of firm
characteristics related to EM, restatements, and fraud-related restatements as additional control variables
(see Cohen, Hoitash, Krishnamoorthty, and Wright 2014 for these variables). Summary statistics on these
control variables are shown in the bottom of Table 3.
Assumptions Underlying Difference-in-Differences Regressions

31
In order for a DiD regression to be an appropriate methodology, several underlying assumptions
must be satisfied. The first assumption is that the treatment group is subject to the listing standard, but the
control group is not. Defining our treatment/control groups by compliance/non-compliance in 1998
ensures this assumption is valid. Second, the pre- and post-transition periods should be balanced in terms
of having the same firms in both periods (Atanasov and Black 2016). We limit our analyses to the 920
firms with required data in both time periods. Of these firms, 536 are out of compliance and 384 are in
compliance on September 28, 1998. Third, the treatment, e.g., the 1999 regulation, should have a
significant effect on the treatment group. As we showed in Table 2, Panel B, firms not complying with
full independence in 1998 significantly increased their audit committee independence by 2002, and firms
not in compliance with size significantly increased their audit committee size over the same time period.
Fourth, the outcome variables for the treatment and control groups should exhibit parallel trends over the
pre-transition period (Atanasov and Black 2016; Lennox, 2016). To verify if this assumption is met in the
data, we estimate the following regressions for each of the outcome variables:
Outcome variablei = α + β T + γ (T x OOCi) + εi (7)
Outcome variablei = α + β T + γ (T x AudIndi) + εi (8)
Outcome variablei = α + β T + γ (T x AudSizei) + εi (9)
T is a time trend variable from 1996 through 1998. The test variable is the interactive term, for example,
T x OOC in equation (7); if there are parallel trends between treatment and control groups, then the
coefficient, γ, will be insignificantly different from zero. Table 6 contains the coefficients and standard
errors for Restatement, Fraud, and EM. In Panel A, γ is insignificantly different from zero for each
outcome variable, supporting parallel trends in the pre-event period. In Panel B, γ is insignificantly
different from zero for the regressions on Fraud and EM, but weakly significant for the regression on
Restatement. In Panel C, γ is insignificantly from zero for the regressions on Restatement and Fraud. We

32
cannot, however, rule out parallel trends for EM, and therefore caution the reader in interpreting the DiD
relating audit committee size to earnings management. Fifth, the event should be a stand-alone event both
in the transition period and the post-transition period. That is, other regulations or economic events should
not be related to the outcome variables. This assumption most likely is not met by the time period we are
studying (which is why our main analysis uses an event study approach). Over the transition period, the
SEC initiated Reg FD increasing the flow of private information to the public, and most likely affecting
financial reporting quality. After June 30, 2001, the beginning of our post-transition period, the
Enron/Worldcom scandals were revealed, resulting in Congress passing SOX on July 31, 2002. To
minimize the effects of the post-transition period scandals, we limit our post-event period to a one-year
period from June 30, 2001 to June 29, 2002.
[insert Table 6 here]
Empirical Results
Table 7 presents the DiD results. Columns (1) and (2) present the logistic results on restatements.
Consistent with the GAO (2002), we observe an increase in restatements in the post-transition period.
However, the insignificant coefficients on Post × OOC in column (1), and the insignificant coefficients
on Post × AudInd and Post × AudSize in column (2) are consistent with the overall rise in restatements
being unrelated to whether the firm was in or out of compliance with the audit committee composition
rules in 1998. In columns (3) and (4), we replace all restatements with only those that are fraud-related.
The inferences are the same – we find no evidence of a difference in the number of fraud-related
restatements between the pre- and post-transition period by whether the firm was in or out of compliance
in 1998. In addition, none of the corporate governance control variables, most notably Financial Experts,
are significantly different from zero. Consistent with prior research, restatements and fraud-related
33
restatements are significantly related to firm size and firm age. Fraud-related restatements are also
significantly related to sales growth and whether the firm had a restructuring charge in the violation year.
One possible explanation for the insignificant coefficients on our logistic models is that the
empirical models do not adequately differentiate firms with restatements from firms without restatements,
i.e., the logit regressions have little explanatory power. To assess the explanatory power of our logistic
regressions, we present the area under the ROC curves for columns (1) through (4). Area under the ROC
curves range from 0.691 to 0.793 for our restatement and fraud models. A value over 0.70 is considered
acceptable model discrimination (Hosner and Lemeshow 2000) and other studies predicting restatements
report similar ROC values as ours (Price, Sharp, and Wood 2011; Cao, Myers, and Omer 2012).
In columns (5) and (6), our output variable is EM. Similar to our findings on restatements, there is
no evidence of a difference in earnings management for out-of-compliance firms between the pre- and
post-transition period. Consistent with prior studies, EM is positively associated with leverage, accounting
losses, CFO, and whether the firm is in a litigious industry. EM is negatively associated with firm size and
capital intensity.
In summary, the DiD results are consistent with our event study findings.
[insert Table 7 here]
VIII. UNTABULATED EVENT STUDY ROBUSTNESS AND ADDITIONAL TESTS
We examine the robustness of our event study results to (1) contemporaneous earnings
announcements on any of the eight event dates, (2) the inclusion of event #3, and (3) the inclusion of past
stock returns or earnings management.
We drop the 148 firms (13.2% of the sample) that had an earnings announcement on any event
date window because our cross-sectional regression methodology over the cumulative dates does not allow
34
for the inclusion of a separate earnings announcement indicator. Without these firms, the signs and
magnitudes of the coefficients remain consistent with those reported in Table 4.
We redo the event study analysis excluding Event #3. We remove this event for two reasons. First,
the announcement is taken from the BRC, and may not have been known to many investors. Second,
November 4, 1998 was the Wednesday following a mid-term election, thereby containing news about the
newly elected U.S. Congress that could impact individual share prices. The inferences between the seven-
event-date and eight-event-date regressions are very similar. We therefore conclude that our main
statistical results and inferences are fairly robust to the inclusion (exclusion) of earnings announcements,
news dissemination, and the news emanating from the 1998 U.S. Congressional election results.
We address possible associations between past firm performance or past earnings management and
current corporate governance structures (Hermalin and Weisbach 1998) by adding prior year (1997) return
on assets (ROA) and EM to equations (2a) through (3b). We also interact each variable with OOC, AudInd,
and AudSize. None of the coefficients are significantly different from zero. Although not a perfect test,
these results alleviate concerns about our findings picking up correlations (for example, current reversals)
of past performance or earnings management.
Lastly, we re-do the analyses in Table 4 separately for each of the eight events in Table 1. We find
weak evidence that out-of-compliance firms earn lower CARs around Event #2, and some evidence that
the CAR for non-compliant firms is more positive around Event #8. However, when we segment the dates
by periods, for example early vs. later dates (Events 1-3 vs. Events 4-8), or pre- and post BRC Report date
(Events 1-5 vs. Events 6-8), our implications remain the same.
IX. SUMMARY, CONCLUSIONS, AND SUGGESTIONS FOR FUTURE RESEARCH
35
In December 1999, the SEC instituted a new listing standard for NYSE and NASDAQ firms.
Listed firms were now required to maintain fully independent audit committees with at least three
members. In July 2002, the U.S. Congress legislated these standards through the Sarbanes-Oxley Act. Our
research question is whether investors benefited from the 1999 new rule. Using both an event study and a
difference-in-differences methodology, we find no evidence of higher market value or better financial
reporting quality resulting from this rule. These findings are inconsistent with an entrenchment view of
corporate governance with respect to independence/size, but are consistent with a market view of firms
endogenously choosing optimal audit committee size and/or director independence.
One suggestion for future research would be to determine the efficacy of other extant securities
rules and regulations. Lennox (2016), for example, examines a PCAOB 2005 rule restricting auditors’ tax
services in order to strengthen auditor independence and improve audit quality and finds a similar “no
result” result as we do. The 2003 NYSE and NASDAQ listing standard changes requiring fully
independent compensation and nominating committees might be an area of future inquiry.
Finally, in 2011, a U.S. Executive Order was issued mandating all federal agencies to conduct
cost-benefit analyses of existing rules and regulations. Our findings suggest that the SEC (and the U.S.
Congress through SOX) may wish to re-evaluate its economic rationale behind mandating all firms to
adopt fully-independent/three-person audit committees.
36
Appendix A
Sefcik and Thompson (1986) Cross-section Regression Approach
The procedure involves three steps. First, form a J by P matrix, F, having a column of 1’s and P-1 firm
characteristics. These characteristics could be compliance to the regulation or firm size or earnings
management, for example. This matrix is:
F = [1, f2j, …fPj] (A1),
where fpj is the pth firm characteristic for firm j.
Second, create a J by P matrix of weights equal to (F’F)-1F’ and create P portfolios of returns
Rpt = WpRjt (A2),
where Wp is the pth row of the (F’F)-1F’ matrix and Rit is the J vector of an individual firm’s security
returns on day t.
Third, estimate P portfolio time-series regressions of the form
Rpt = αp + βp1 (Rmt – Rft) + βp2SMDt + βp3HMLt + gpkDkt + εpt (A3),
where Rpt is portfolio p of weighted firms on day t and the other variables are defined in equation (1).
The estimate gpk in each of the p regressions reflects the effect of the pth firm characteristic on the market
reaction to the event Dkt. Sefcik and Thompson (1986) refer to the p regressions as a “stacked system” and
liken the approach to Zellner’s Seemingly Unrelated Regression framework.
37
Appendix B
Measuring Earnings Management (EM)
We assume the following accruals expectation model is:
TCAit/TAit-1 = 0 + 1[1/TAit-1] + 2[CFOit-1/TAit-1] + 3[CFOit/TAit-1] + 4[CFOit+1/TAit-1]
+ 5[REVit/TAit-1] + 6[PPEit/TAit-1] + εit (B1),
where TCA is total current accruals, calculated as current assets minus current liabilities minus cash
plus short-term debt; TA is total assets; CFO is cash flows from operations, REV is annual change in
revenues; and PPE is gross property, plant, and equipment. Equation (B1) is estimated for each two-digit
SIC industry and year with a minimum of five observations. AAC is the absolute value of the firm’s actual
total current accrual minus the fitted accrual from equation (B1). Following Kasznik (1999) and Klein
(2002b), we adjust each firm’s AAC by the median absolute value of AAC for a portfolio of Compustat
firms that are in the same percentile of the standard deviation of total accruals. That is:
EMi = AAACit = AACit – Median AACitp (B2),
where p is the portfolio of matched firms.
38
Appendix C
Optimal vs. Sub-Optimal Audit Committee Independence
We follow Bryan et al. (2013) and use the inverse Mill’s ratio from a probit selection model to
determine whether it is optimal or sub-optimal for boards to have 100 percent audit committee
independence. First, we estimate the determinants of fully independent audit committees by estimating a
variation of Klein’s (2002a) model. Specifically:
Pr(100%AudIndi = 1) = β0 + β1ln(BdSize)i + β2%%IndDiri + β3M/Bi + β4Lossesi
+ β5Leveragei + β6CEOonCCi + β75%BlockonACi
+ β8IndDirOwni + β9ln(Assets)i + β10ln(1+#Analysts)i + εi (C1),
where i indicates firm i; ln is the natural log transformation; 100%AudInd is a dummy indicating if a firm
has a fully independent audit committee; BdSize is the number of board directors; %IndDir is the
percentage of independent directors on the board; M/B is the market value of equity divided by the book
value of equity; Losses is a dummy indicating if the firm incurred accounting losses in the last two
consecutive years; Leverage is total liabilities divided by total assets; CEOonCC is an indicator if the CEO
is the Chair of the compensation committee; 5%BlockonAC is an indicator if at least one 5% outside
blockholder sits on the audit committee; IndDirOwn is the percentage of total beneficial ownership by
independent directors; Assets is the firm’s total assets; and #Analysts is the number of analysts covering
the firm (from I/B/E/S database). The first nine independent variables are from Klein’s (2002) model
#Analysts is a proxy for the firm’s information processing costs to independent directors, which has been
shown to be inversely associated with the optimal proportion of independent directors (Duchin et al. 2010;
Armstrong et al. 2014). Equation (C1) is estimated over the full year prior to the Levitt speech.
The coefficients and standard errors for our estimation of equation C1 are:

39
Constant ln(BdSize) %IndDir M/B Losses Leverage
Coefficient -0.560* -0.568*** 4.136*** -0.005 -0.016 -0.075
Std. Error (0.329) (0.176) (0.265) (0.005) (0.211) (0.236)
CEOonCC
5% BlockonAC
IndDirOwn
ln(FirmSize)
ln(1+#Analyst)
Pseudo R2
Coefficient 0.014 -1.026*** 0.590 -0.071 -0.017 0.263
Std. Error (0.282) (0.264) (1.367) (0.043) (0.049)
All coefficients have signs consistent with predictions in Klein (2002a) except ln(BdSize) and
IndDirOwn. The coefficient on IndDirOwn is not significant, in contrast to Klein (2002a).
The inverse Mill’s ratio for firms with fully-independent audit committees (100%AudIndi = 1) is
defined as φ(β’X)/Φ(β’X); the ratio for firms with less-than-fully-independent audit committees
(100%AudIndi = 0) is defined as – φ(β’X)/{1 – Φ(β’X)}, where β’X is the fitted value from equation (C1)
and φ(∙) and Φ(∙) denote standard normal cdf and pdf, respectively. The inverse Mill’s ratio is equivalent
to the residuals from a probit regression and can be interpreted as the deviation from the optimal selection
model (see Bryan et al. 2013). By construction, greater deviation from the optimal produces higher (more
positive) values for firms with fully independent audit committees (100%AudIndi = 1) and lower (more
negative) values for firms without (100%AudIndi = 0). Among the firms with fully independent audit
committees (100%AudIndi = 1), those with an inverse Mill’s ratio below the group median are defined as
having an optimal fully independent audit committee and those with an inverse Mill’s ratio above the
group median are defined as sub-optimal (i.e., better off having a fully-independent audit committee). For
firms with less than fully independent audit committees (100%AudIndi = 0) those above the group median
are defined as optimal and those below the group median are defined as sub-optimal (i.e., better off not
having a fully-independent audit committee).
40
REFERENCES
Abbott, L. J., Y. Park, and S. Parker. 2000. The effects of audit committee activity and independence on
corporate fraud. Managerial Finance 26: 55-68.
Abbott, L. J., S. Parker, and G. F. Peters. 2004. Audit committee characteristics and restatements.
Auditing: A Journal of Practice & Theory 23: 69-87.
Abbott, L. J., S. Parker, G. F. Peters, and K. Raghunandan. 2003. The association between audit committee
characteristics and audit fees. Auditing: A Journal of Practice & Theory 22: 17-32.
Agrawal, A., and S. Chadha. 2005. Corporate governance and accounting scandals. Journal of Law and
Economics 48: 371-406.
Akyol, A. C., W. F. Lim, and P. Verwijmeren. 2012. Shareholders in the boardroom: Wealth effects of
the SEC’s proposal to facilitate director nominations. Journal of Financial and Quantitative Analysis 47:
1029-1057.
Ali, A., and S. Kallapur. 2001. Security price consequences of the Private Securities Litigation Reform
Act of 1995 and related events. The Accounting Review 76: 431-460.
Armstrong, C. S., J. E. Core, and W. R. Guay. 2014. Do independent directors cause improvements in
firm transparency? Journal of Financial Economics 113: 383-403.
Atanasov, V., and B. Black. 2016. The Trouble with Instruments: Re-examining Shock-based IV Designs.
Working Paper, The College of William & Mary and Northwestern University.
Battalio, R., B. Hatch, and T. Loughran. 2011. Who benefited from the disclosure mandates of the 1964
Securities Act Amendments? Journal of Corporate Finance 17: 1047-1063.
Beasley, M. S. 1996. An empirical analysis of the relation between the board of director composition and
financial statement fraud. The Accounting Review 71: 443-465.
Beasley, M. S., J. V. Carcello, D. R. Hermanson, and T. S. Neal. 2009. Fraudulent Financial Reporting
1998-2007: An Analysis of U.S. Public Companies. Committee of Sponsoring Organizations of the
Treadway Commission.
Beasley, M. S., and S. Salterio. 2001. The relationship between board characteristics and voluntary
improvements in audit committee composition and experience. Contemporary Accounting Research 18
(4): 539-570.
Bédard, J., S. M. Chtourou, and L. Courteau. 2004. The effect of audit committee expertise, independence,
and activity on aggressive earnings management. Auditing: A Journal of Practice & Theory 23: 13-35.
Birkett, B. S. 1986. The recent history of corporate audit committees. The Accounting Historians Journal
13: 109-124.
41
BRC Report. 1999. Report and Recommendations of the Blue Ribbon Committee on Improving the
Effectiveness of Corporate Audit Committees.
Bronson, S. N., J. V. Carcello, C. W. Hollingsworth, and T. L. Neal. 2009. Are fully independent audit
committees really necessary? Journal of Accounting and Public Policy 28: 265-280.
Bruynseels, L., and E. Cardinaels. 2014. The audit committee: Management watchdog or personal friend
of the CEO? The Accounting Review 89 (1): 113-145.
Bryan, D., M. Liu, S. Tiras, and Z. Zhuang. 2013. Optimal versus suboptimal choices of accounting
expertise on audit committees and earnings quality. Review of Accounting Studies 18: 1123-1158.
Cao, Y., L. A. Myers, and T. C. Omer. 2012. Does company reputation matter for financial reporting
quality? Evidence from restatements. Contemporary Accounting Research 29 (3): 956-990.
Carcello, J. V., and T. L. Neal. 2000. Audit committee composition and auditor reporting. The Accounting
Review 75: 453-467.
Carcello, J. V., and T. L. Neal. 2003. Audit committee characteristics and auditor dismissals following
“new” going-concern reports. The Accounting Review 78: 95-117.
Chhaochharia, B., and Y. Grinstein. 2007. Corporate governance and firm value: The impact of the 2002
governance rules. Journal of Finance 62: 1789-1825.
Chen, X., Q. Cheng, and X. Wang. 2015. Does increased board independence reduce earnings
management? Evidence from recent regulatory reforms. Review of Accounting Studies 20(2): 899-933.
Cohen, J. R., L. M. Gaynor, G. Krishnamoorthy, and A. M. Wright. 2014. The Effects of Professional
Social Ties Between the CEO and the Audit Committee on Investor Decision Making. Working Paper,
Boston College, University of South Florida and Northeastern University.
Cohen, J. R., U. Hoitash, G. Krishnamoorthy, and A. M. Wright. 2014. The effect of audit committee
industry expertise on monitoring the financial reporting process. The Accounting Review 89: 244-273.
Coles, J. L., N. D. Daniel, and L. Naveen. 2008. Boards: Does one size fit all? Journal of Financial
Economics 87: 329-356.
Davidson, R., J. Goodwin-Stewart, and P. Kent. 2005. Internal governance structures and earnings
management. Accounting and Finance 45: 241-267.
Dechow, P. M., and I. D. Dichev. 2002. The quality of accruals and earnings: The role of accrual
estimation errors. The Accounting Review 77 (Supplement): 35-59.
Dechow, P., W. Ge, and C. Schrand. 2010. Understanding earnings quality: A review of the proxies, their
determinants and their consequences. Journal of Accounting and Economics 50: 344-401.
42
DeFond, M. L., R. N. Hann, and X. Hu. 2005. Does the market value financial expertise on audit
committees of board of directors? Journal of Accounting Research 43: 153-193.
DeFond, M. L., and J. Zhang. 2014. A review of archival auditing research. Journal of Accounting and
Economics 58: 275-326.
Duchin, R., J. G. Matsusaka, and O. Ozbas. 2010. When are outside directors effective? Journal of
Financial Economics 96: 195-214.
Fama, E. F., and K. R. French. 1992. The cross-section of expected stock returns. Journal of Finance 47:
427-465.
Fama, E. F., and M. C. Jensen. 1983. Separation of ownership and control. Journal of Law and Economics
26: 301-325.
Farber, D. B. 2005. Restoring trust after fraud: Does corporate governance matter? The Accounting Review
80: 539-561.
Felo, A. J., S. Krishnamurthy, and S. A. Solieri. 2003. Audit Committee Characteristics and the Perceived
Quality of Financial Reporting: An Empirical Analysis. Working paper.
Francis, J., R. LaFond, P. Olsson, and K. Schipper. 2005. The market pricing of accounting accruals,
Journal of Accounting and Economics 39: 295-327.
Gao, F., J. S. Wu, and J. Zimmerman. 2009. Unintended consequences of granting small firms exemptions
from securities regulation: Evidence from the Sarbanes-Oxley Act. Journal of Accounting Research 47:
459-506.
General Accounting Office (GAO). 2002. Financial Statement Restatements: Trends, Market Impacts,
Regulatory Responses, and Remaining Challenges. GAO-03-138. Washington, D.C.: General Accounting
Office.
Hennes, K. M., A. J. Leone, and B. P. Miller. 2008. The importance of distinguishing errors from
irregularities in restatement research: The case of restatements and CEO/CFO turnover. The Accounting
Review 83: 1487-1519.
Hermalin, B. E., and M. S. Weisbach. 1998. Endogenously chosen board of directors and their monitoring
of the CEO. American Economic Review 88: 96-118.
Hosmer, D., and S. Lemeshow. 2000. Applied Logistic Regression. 2nd Ed. Hoboken, NJ: John Wiley and
Sons, Inc.
Iliev, P. 2010. The effect of SOX Section 404: Costs, earnings quality, and stock prices. Journal of
Finance 65: 1163-1196.
43
Jain, P., and Z. Razaee. 2006. The Sarbanes-Oxley Act of 2002 and capital-market behavior: Early
evidence. Contemporary Accounting Research 23: 629-654.
Johnson, M., R. Kasznik, and K. Nelson. 2000. Shareholder wealth effects of the Private Securities
Litigation Reform Act of 1995. Review of Accounting Studies 5: 217-233.
Kasznik, R. 1999. On the association between voluntary disclosure and earnings management. Journal of
Accounting Research 37: 46-81.
Klein, A. 1998. Firm performance and board committee structure. Journal of Law & Economics 61: 275-
303.
Klein, A. 2002a. Economic determinants of audit committee independence. The Accounting Review 77:
435-452.
Klein, A. 2002b. Audit committee, board of director characteristics, and earnings management. Journal
of Accounting and Economics 33: 375-400.
Krishnan, G. V., Y. Wen, and W. Zhao. 2011. Legal expertise on corporate audit committees and financial
reporting quality. The Accounting Review 86: 2099-2130.
Larcker, D. F., G. Ormazabal, and D. J. Taylor. 2011. The market reaction to corporate governance
regulation. Journal of Financial Economics 101: 431-448.
Larcker, D. F., S. A. Richardson, and I. Tuna. 2007. Corporate governance, accounting outcomes, and
organizational performance. The Accounting Review 82: 963-1008.
Lee, H. Y., V. Mande, and R. Ortman. 2004. The effect of audit committee and board of director
independence on auditor resignation. Auditing: A Journal of Practice & Theory 23: 131-146.
Lennox, C. 2016. Did the PCAOB’s restrictions on auditors’ tax services improve audit quality? The
Accounting Review 91(5): 1493-1512.
Leuz, C., and P. Wysocki. 2016. The economics of disclosure and financial reporting regulation: U.S. and
international evidence and suggestions for future research. Journal of Accounting Research 54: 525-622.
Levitt, A. 1998. The Numbers Game. Speech delivered at New York University, Center for Law and
Business. (September 28).
Li, H., M. Pincus, and S. O. Rego. 2008. Market reaction to events surrounding the Sarbanes-Oxley Act
of 2002 and earnings management. Journal of Law and Economics 51: 111-134.
Lin, J. W., J. F. Li, and J. S. Yang. 2006. The effect of audit committee performance on earnings quality.
Managerial Auditing Journal 21: 921-933.
44
Linck, J. S., J. M. Netter, and T. Yang. 2008. The determinants of board structure. Journal of Financial
Economics 87: 308-328.
Linn, S. C., and D. Park. 2010. Outside director compensation policy and the investment opportunity set.
Journal of Corporate Finance 11: 680-715.
McMullen, D., and K. Raghunandan. 1996. Enhancing audit committee effectiveness. Journal of
Accountancy 182: 79-81.
McNichols, M. F. 2002. Discussion of the quality of accruals and earnings: The role of accrual estimation
errors. The Accounting Review 77: 61-69.
Nguyen, B. D., and K. M. Nielsen. 2010. The value of independent directors: Evidence from sudden
deaths. Journal of Financial Economics 98: 550-567.
Presidential Executive Order 13563. 2011. Improving Regulation and Regulatory Review. The White
House, Office of the Press Secretary. Washington D. C: The White House.
Price III, R. A., N. Y. Sharp, and D. A. Wood. 2011. Detecting and predicting accounting irregularities:
A comparison of commercial and academic risk measures. Accounting Horizons 25 (4): 755-780.
Romano, R. 2005. The Sarbanes-Oxley Act and the making of quack corporate governance. The Yale Law
Review 114 (7): 1521-1543.
Schipper, K., and R. Thompson. 1983. An approach to statistical inference in cross-sectional models with
security abnormal returns as dependent variables. Journal of Accounting Research 21: 184-221.
Securities and Exchange Commission (SEC). 1998a. SEC, NYSE and NASD Announce Blue Ribbon Panel
to Improve Corporate Audit Committees. Release No. 98-96. Washington, D.C.: SEC.
Securities and Exchange Commission (SEC). 1998b. SEC, NYSE, and NASD Announce Members of Blue
Ribbon Committee to Improve Corporate Audit Committees. Release No. 98-98. Washington, D.C.: SEC.
Securities and Exchange Commission (SEC). 1998c. Corporate Governance: Integrity in the Information
Age. www.sec.gov/news/speech/speecharchive/1998/spch206.txt.
Securities and Exchange Commission (SEC). 1999. NYSE Rulemaking: Order Approving Proposed Rule
Change Amending the Audit Committee Requirements and Notice of Filing and Order Granting
Accelerated Approval of Amendments No. 1 and No. 2 Thereto. (December 14). Washington, D.C.: SEC.
Securities and Exchange Commission (SEC). 2012. Current Guidance on Economic Analysis in SEC
Rulemakings. Memorandum. (March 16). Washington, D.C.: SEC.
Sefcik, S. E., and R. Thompson. 1986. An approach to statistical inference in cross-sectional models with
security abnormal returns as dependent variables. Journal of Accounting Research 24: 316-334.
45
Srinivasan, S., and J. C. Coates IV. 2014. SOX after ten years: A multidisciplinary review. Accounting
Horizons 28 (3): 627-671.
Vafeas, N. 2005. Audit committees, boards, and the quality of reported earnings. Contemporary
Accounting Research 22: 1093-1122.
Xie, B., W. N. Davidson, and P. J. DaDalt. 2003. Earnings management and corporate governance: the
role of the board and the audit committee. Journal of Corporate Finance 9: 295-316.
Yang, J. S., and J. Krishnan. 2005. Audit committees and quarterly earnings management. International
Journal of Auditing 9: 201-219.
Zhang, I. X. 2007. Economic consequences of the Sarbanes-Oxley Act of 2002. Journal of Accounting
and Economics 44: 74-115.
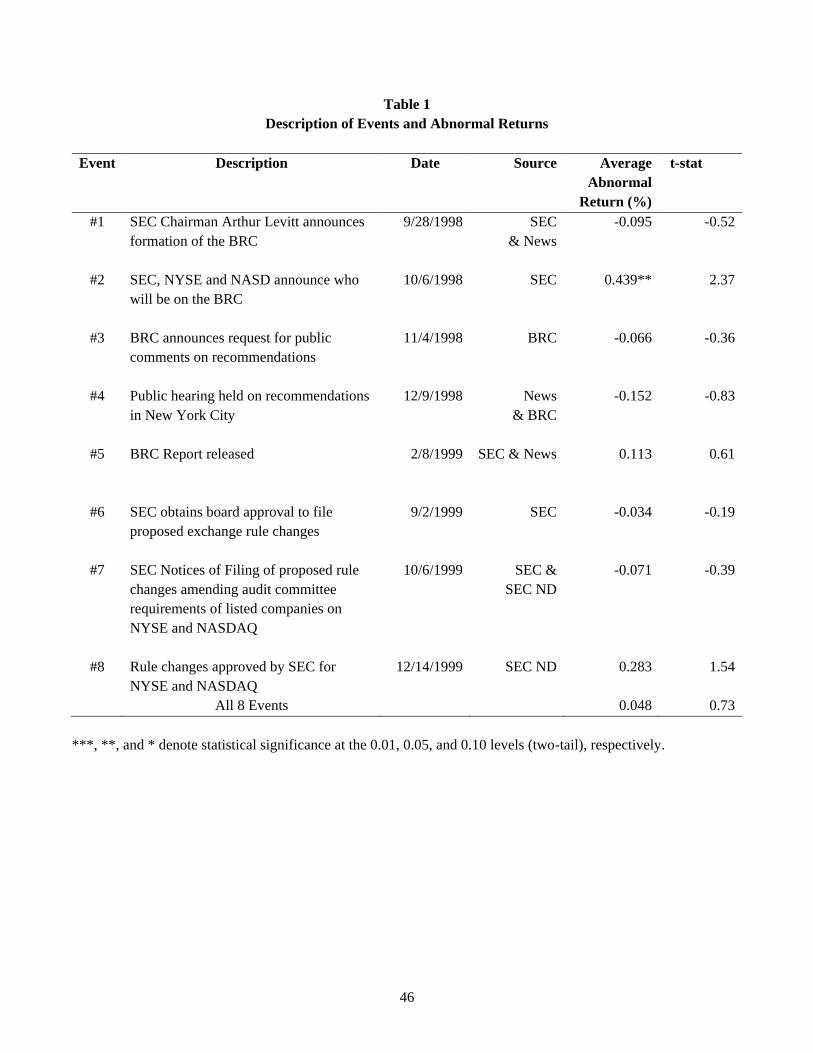
46
Table 1
Description of Events and Abnormal Returns
Event Description Date Source Average
Abnormal
Return (%)
t-stat
#1 SEC Chairman Arthur Levitt announces
formation of the BRC
9/28/1998 SEC
& News
-0.095 -0.52
#2 SEC, NYSE and NASD announce who
will be on the BRC
10/6/1998 SEC 0.439** 2.37
#3 BRC announces request for public
comments on recommendations
11/4/1998 BRC
-0.066 -0.36
#4 Public hearing held on recommendations
in New York City
12/9/1998 News
& BRC
-0.152 -0.83
#5 BRC Report released
2/8/1999 SEC & News
0.113 0.61
#6 SEC obtains board approval to file
proposed exchange rule changes
9/2/1999 SEC -0.034 -0.19
#7 SEC Notices of Filing of proposed rule
changes amending audit committee
requirements of listed companies on
NYSE and NASDAQ
10/6/1999 SEC &
SEC ND
-0.071 -0.39
#8 Rule changes approved by SEC for
NYSE and NASDAQ
12/14/1999 SEC ND 0.283 1.54
All 8 Events 0.048 0.73
***, **, and * denote statistical significance at the 0.01, 0.05, and 0.10 levels (two-tail), respectively.

47
Table 2
Audit Committee and Board Composition Changes Over Time
Panel A: Yearly Characteristics
1998 1999 2000 2001 2002 ‘02-‘98
p-value
Audit Committee Characteristics
Audit Committee Size
Mean 3.597 3.580 3.626 3.667 3.813 0.004
Median 3.000 3.000 3.000 3.000 4.000 0.001
Audit Committee Size ≥ 3 (% of firms)
Mean 0.827 0.828 0.857 0.912 0.959 0.000
Median 1.000 1.000 1.000 1.000 1.000 0.000
Audit Committee Independence (%)
Mean 0.808 0.829 0.865 0.883 0.903 0.000
Median 1.000 1.000 1.000 1.000 1.000 0.000
100% Independent Audit Committee (% of firms)
Mean 0.521 0.559 0.639 0.673 0.708 0.000
Median 1.000 1.000 1.000 1.000 1.000 0.000
Full Compliance to Regulation (% of firms)
Mean 0.408 0.437 0.535 0.600 0.673 0.000
Median 0.000 0.000 1.000 1.000 1.000 0.000
Board Characteristics
Board Size
Mean 9.268 9.293 9.278 9.281 9.460 0.126
Median 9.000 9.000 9.000 9.000 9.000 0.231
Board Independence (%)
Mean 0.597 0.612 0.632 0.643 0.675 0.000
Median 0.625 0.636 0.667 0.667 0.700 0.000
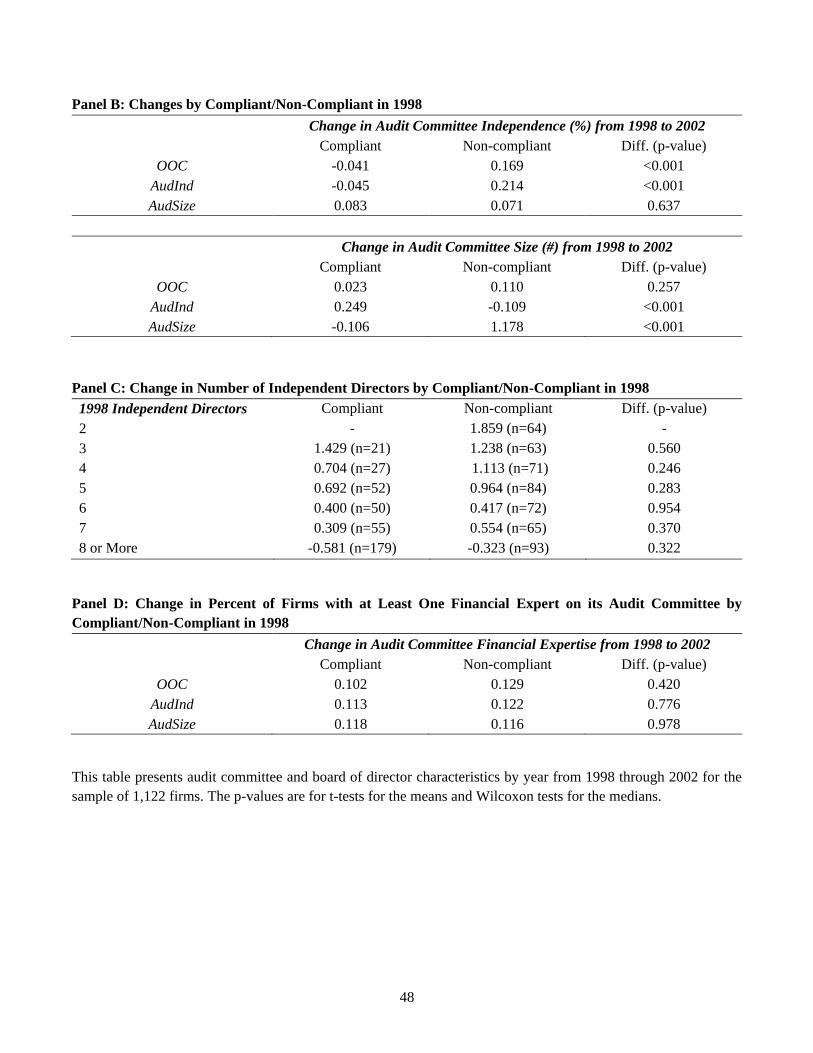
48
Panel B: Changes by Compliant/Non-Compliant in 1998
Change in Audit Committee Independence (%) from 1998 to 2002 Compliant Non-compliant Diff. (p-value)
OOC -0.041 0.169 <0.001
AudInd -0.045 0.214 <0.001
AudSize 0.083 0.071 0.637
Change in Audit Committee Size (#) from 1998 to 2002 Compliant Non-compliant Diff. (p-value)
OOC 0.023 0.110 0.257
AudInd 0.249 -0.109 <0.001
AudSize -0.106 1.178 <0.001
Panel C: Change in Number of Independent Directors by Compliant/Non-Compliant in 1998
1998 Independent Directors Compliant Non-compliant Diff. (p-value)
2 - 1.859 (n=64) -
3 1.429 (n=21) 1.238 (n=63) 0.560
4 0.704 (n=27) 1.113 (n=71) 0.246
5 0.692 (n=52) 0.964 (n=84) 0.283
6 0.400 (n=50) 0.417 (n=72) 0.954
7 0.309 (n=55) 0.554 (n=65) 0.370
8 or More -0.581 (n=179) -0.323 (n=93) 0.322
Panel D: Change in Percent of Firms with at Least One Financial Expert on its Audit Committee by
Compliant/Non-Compliant in 1998
Change in Audit Committee Financial Expertise from 1998 to 2002 Compliant Non-compliant Diff. (p-value)
OOC 0.102 0.129 0.420
AudInd 0.113 0.122 0.776
AudSize 0.118 0.116 0.978
This table presents audit committee and board of director characteristics by year from 1998 through 2002 for the
sample of 1,122 firms. The p-values are for t-tests for the means and Wilcoxon tests for the medians.

49
Variable definitions
Audit Committee Size = number of directors on audit committee
Board Size = number of directors on board
Audit Committee Independence = the percentage (expressed in decimal form) of independent directors sitting on the audit
committee
Board Independence = the percentage (expressed in decimal form) of independent directors sitting on the firm’s board of
directors
Audit Committee Size ≥ 3, = percentage (expressed in decimal form) of audit committees with at least three directors
100% Independent Audit Committee = percentage (expressed in decimal form) of audit committees that are fully independent
Full Compliance to Regulation = percentage (expressed in decimal form) of audit committees that are both fully independent
and have at least three directors
OOC = binary variable representing if the firm’s audit committee is out of compliance to the 1999 rule prior to Event
#1(September 28, 1998)
AudInd = binary variable representing if the firm’s audit committee is out of compliance with full independence prior to Event
#1(September 28, 1998)
AudSize = binary variables representing if the firm’s audit committee is out of compliance with having at least three directors
prior to Event #1 (September 28, 1998)
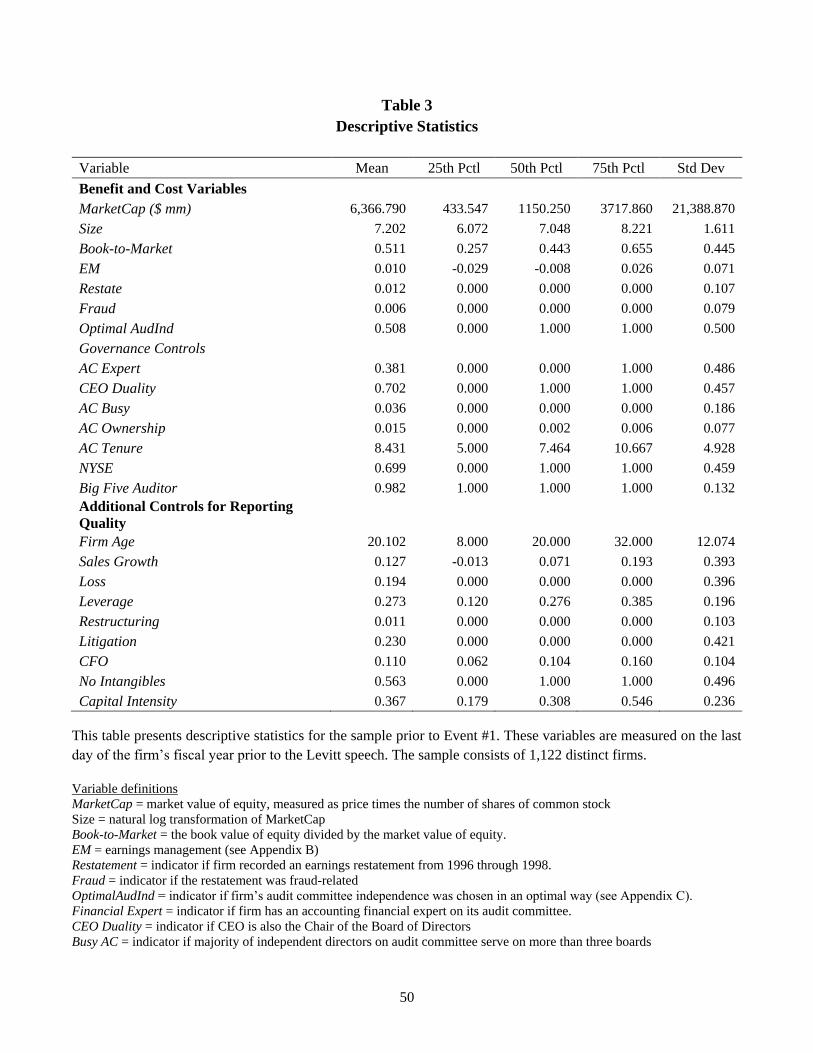
50
Table 3
Descriptive Statistics
Variable Mean 25th Pctl 50th Pctl 75th Pctl Std Dev
Benefit and Cost Variables
MarketCap ($ mm) 6,366.790 433.547 1150.250 3717.860 21,388.870
Size 7.202 6.072 7.048 8.221 1.611
Book-to-Market 0.511 0.257 0.443 0.655 0.445
EM 0.010 -0.029 -0.008 0.026 0.071
Restate 0.012 0.000 0.000 0.000 0.107
Fraud 0.006 0.000 0.000 0.000 0.079
Optimal AudInd 0.508 0.000 1.000 1.000 0.500
Governance Controls
AC Expert 0.381 0.000 0.000 1.000 0.486
CEO Duality 0.702 0.000 1.000 1.000 0.457
AC Busy 0.036 0.000 0.000 0.000 0.186
AC Ownership 0.015 0.000 0.002 0.006 0.077
AC Tenure 8.431 5.000 7.464 10.667 4.928
NYSE 0.699 0.000 1.000 1.000 0.459
Big Five Auditor 0.982 1.000 1.000 1.000 0.132
Additional Controls for Reporting
Quality
Firm Age 20.102 8.000 20.000 32.000 12.074
Sales Growth 0.127 -0.013 0.071 0.193 0.393
Loss 0.194 0.000 0.000 0.000 0.396
Leverage 0.273 0.120 0.276 0.385 0.196
Restructuring 0.011 0.000 0.000 0.000 0.103
Litigation 0.230 0.000 0.000 0.000 0.421
CFO 0.110 0.062 0.104 0.160 0.104
No Intangibles 0.563 0.000 1.000 1.000 0.496
Capital Intensity 0.367 0.179 0.308 0.546 0.236
This table presents descriptive statistics for the sample prior to Event #1. These variables are measured on the last
day of the firm’s fiscal year prior to the Levitt speech. The sample consists of 1,122 distinct firms.
Variable definitions
MarketCap = market value of equity, measured as price times the number of shares of common stock
Size = natural log transformation of MarketCap
Book-to-Market = the book value of equity divided by the market value of equity.
EM = earnings management (see Appendix B)
Restatement = indicator if firm recorded an earnings restatement from 1996 through 1998.
Fraud = indicator if the restatement was fraud-related
OptimalAudInd = indicator if firm’s audit committee independence was chosen in an optimal way (see Appendix C).
Financial Expert = indicator if firm has an accounting financial expert on its audit committee.
CEO Duality = indicator if CEO is also the Chair of the Board of Directors
Busy AC = indicator if majority of independent directors on audit committee serve on more than three boards

51
AC Ownership = percent of firm’s stock owned by all audit committee members
AC Tenure = average tenure each member has served on the board
NYSE = indicator if firm is listed on the New York Stock Exchange
Big Five = indicator if firm is audited by a Big Five auditor (Arthur Andersen, E & Y, Deloitte, KPMG, and PWC).
Firm Age = natural log of the number of years the firm has Compustat data
Sales Growth = change in revenues from year t-1 to year t divided by revenues in year 7
Loss = indicator whether the firm had net losses in either of the last two years
Leverage = total liabilities divided by total assets
Restructuring = indicator if firm was involved in a restructuring (coded as 1 if following Compustat data are non-zero: 376,
377, 378, or 379)
Litigation = indicator if firm is in a litigious industry (coded as 1 if firm’s SIC codes are 2833 to 2836, 3570 to 3577, 3600 to
3674, 5200 to 5961, and 7370)
CFO = cash flows from operations divided by total assets
No Intangibles = indicator if the company has no intangible assets (coded as 1 if Compustat XAD + XRD = 0)
Capital Intensity = PP&E divided by total assets
See Table 2 for other variable definitions.

52
Table 4
Cross-sectional Regressions of Cumulative Abnormal Returns on Non-Compliance, Financial Reporting Quality,
and Costs of Compliance
By Compliance By Compliance and Benefits By Compliance, Benefits, and Costs (1) (2) (3) (4) (5) (6) (7) (8) (9) (10)
Restateme
nt
Fraud
Only
Restatem
ent
Fraud
Only
Restatem
ent
Fraud
Only
Restatem
ent
Fraud
Only
Intercept 0.038 0.015 0.011 0.012 -0.007 -0.010 0.144 0.137 0.021 0.016
[0.271] [0.281] [0.268] [0.267] [0.279] [0.278] [0.306] [0.306] [0.319] [0.319]
OOC -0.044 -0.034 -0.035 -0.106 -0.100
[0.051] [0.050] [0.050] [0.247] [0.248]
AudInd 0.010 0.018 0.017 0.112 0.111
[0.049] [0.049] [0.049] [0.246] [0.246]
AudSize -0.015 -0.012 -0.010 0.291 0.293
[0.086] [0.085] [0.085] [0.418] [0.419]
EM 0.237 0.216 0.204 0.189 0.184 0.166 0.215 0.197
[0.826] [0.828] [0.778] [0.780] [0.826] [0.827] [0.780] [0.781]
OOC × EM 0.112 0.169 -0.239 -0.210
[1.007] [1.013] [1.095] [1.105]
AudInd × EM 0.320 0.405 -0.134 -0.086
[0.955] [0.959] [1.053] [1.062]
AudSize × EM -0.062 -0.080 -0.470 -0.457
[1.315] [1.312] [1.338] [1.334]
Restatement (Fraud) 0.289 0.691 0.318 0.722 0.293 0.678 0.284 0.707
[0.444] [0.820] [0.443] [0.820] [0.444] [0.820] [0.444] [0.820]
OOC*Restatement (Fraud) -0.753 -1.304 -0.599 -1.076
[0.592] [0.946] [0.689] [1.134]
AudInd × Restatement (Fraud) -0.885 -1.442 -0.699 -1.180
[0.668] [0.988] [0.748] [1.136]
AudSize × Restatement (Fraud) -0.592 -1.159 -0.229 -0.621
[0.820] [1.345] [0.874] [1.625]
Ind2 -0.148* -0.145* -0.196** -0.194**
[0.087] [0.087] [0.097] [0.097]
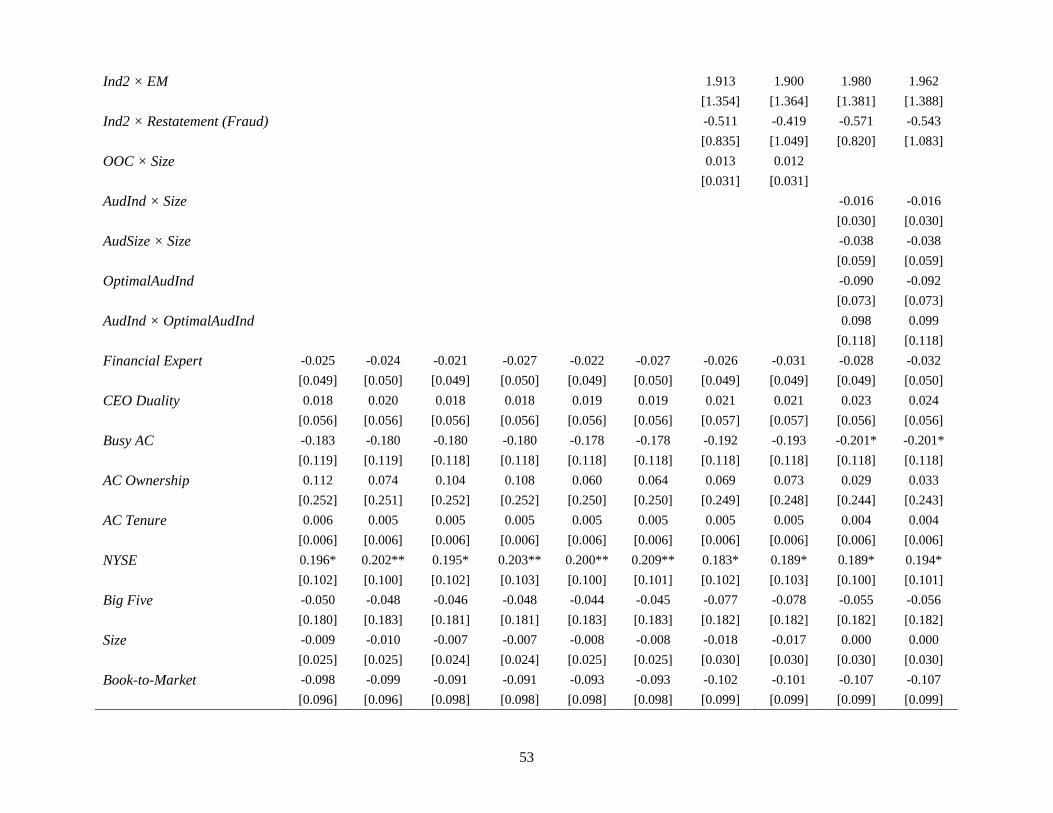
53
Ind2 × EM 1.913 1.900 1.980 1.962
[1.354] [1.364] [1.381] [1.388]
Ind2 × Restatement (Fraud) -0.511 -0.419 -0.571 -0.543
[0.835] [1.049] [0.820] [1.083]
OOC × Size 0.013 0.012
[0.031] [0.031]
AudInd × Size -0.016 -0.016
[0.030] [0.030]
AudSize × Size -0.038 -0.038
[0.059] [0.059]
OptimalAudInd -0.090 -0.092
[0.073] [0.073]
AudInd × OptimalAudInd 0.098 0.099
[0.118] [0.118]
Financial Expert -0.025 -0.024 -0.021 -0.027 -0.022 -0.027 -0.026 -0.031 -0.028 -0.032
[0.049] [0.050] [0.049] [0.050] [0.049] [0.050] [0.049] [0.049] [0.049] [0.050]
CEO Duality 0.018 0.020 0.018 0.018 0.019 0.019 0.021 0.021 0.023 0.024
[0.056] [0.056] [0.056] [0.056] [0.056] [0.056] [0.057] [0.057] [0.056] [0.056]
Busy AC -0.183 -0.180 -0.180 -0.180 -0.178 -0.178 -0.192 -0.193 -0.201* -0.201*
[0.119] [0.119] [0.118] [0.118] [0.118] [0.118] [0.118] [0.118] [0.118] [0.118]
AC Ownership 0.112 0.074 0.104 0.108 0.060 0.064 0.069 0.073 0.029 0.033
[0.252] [0.251] [0.252] [0.252] [0.250] [0.250] [0.249] [0.248] [0.244] [0.243]
AC Tenure 0.006 0.005 0.005 0.005 0.005 0.005 0.005 0.005 0.004 0.004
[0.006] [0.006] [0.006] [0.006] [0.006] [0.006] [0.006] [0.006] [0.006] [0.006]
NYSE 0.196* 0.202** 0.195* 0.203** 0.200** 0.209** 0.183* 0.189* 0.189* 0.194*
[0.102] [0.100] [0.102] [0.103] [0.100] [0.101] [0.102] [0.103] [0.100] [0.101]
Big Five -0.050 -0.048 -0.046 -0.048 -0.044 -0.045 -0.077 -0.078 -0.055 -0.056
[0.180] [0.183] [0.181] [0.181] [0.183] [0.183] [0.182] [0.182] [0.182] [0.182]
Size -0.009 -0.010 -0.007 -0.007 -0.008 -0.008 -0.018 -0.017 0.000 0.000
[0.025] [0.025] [0.024] [0.024] [0.025] [0.025] [0.030] [0.030] [0.030] [0.030]
Book-to-Market -0.098 -0.099 -0.091 -0.091 -0.093 -0.093 -0.102 -0.101 -0.107 -0.107
[0.096] [0.096] [0.098] [0.098] [0.098] [0.098] [0.099] [0.099] [0.099] [0.099]

54
This table presents regression coefficients and standard errors [in brackets] for regressions of abnormal stock returns on non-compliance, financial
reporting quality of costs of compliance. The sample consists of 1,122 distinct firms, covering 504 days from January 1, 1998 through December
31, 1999. ***, **, and * denote statistical significance at the 0.01, 0.05, and 0.10 levels (two-tailed), respectively. See Tables 2 and 3 for variable
definitions.
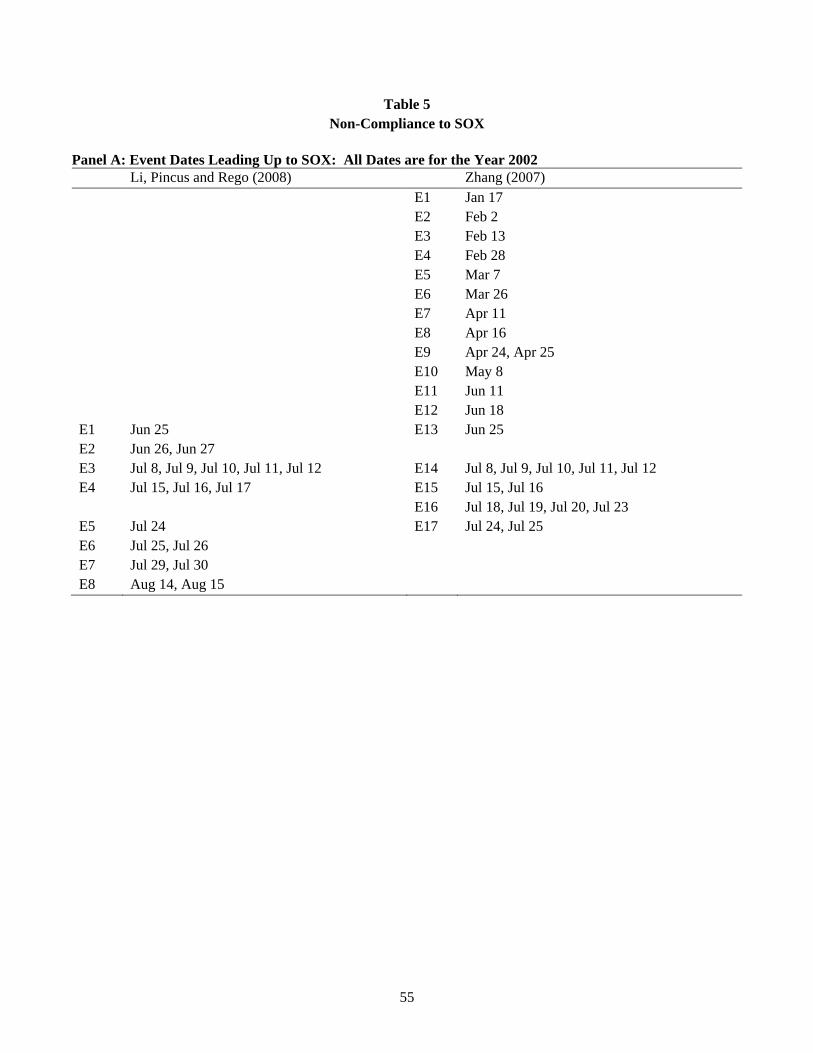
55
Table 5
Non-Compliance to SOX
Panel A: Event Dates Leading Up to SOX: All Dates are for the Year 2002
Li, Pincus and Rego (2008) Zhang (2007)
E1 Jan 17
E2 Feb 2
E3 Feb 13
E4 Feb 28
E5 Mar 7
E6 Mar 26
E7 Apr 11
E8 Apr 16
E9 Apr 24, Apr 25
E10 May 8
E11 Jun 11
E12 Jun 18
E1 Jun 25 E13 Jun 25
E2 Jun 26, Jun 27
E3 Jul 8, Jul 9, Jul 10, Jul 11, Jul 12 E14 Jul 8, Jul 9, Jul 10, Jul 11, Jul 12
E4 Jul 15, Jul 16, Jul 17 E15 Jul 15, Jul 16
E16 Jul 18, Jul 19, Jul 20, Jul 23
E5 Jul 24 E17 Jul 24, Jul 25
E6 Jul 25, Jul 26
E7 Jul 29, Jul 30
E8 Aug 14, Aug 15

56
Table 5 - continued
Panel B: Regression Results on Non-Compliance to Audit Committee Requirements in SOX
Using Li et al. (2008) Dates Using Zhang (2007) Dates
Portfolios (1) (2) (3) (4)
Constant -0.024 -0.025 -0.013 -0.015
[0.056] [0.056] [0.051] [0.050]
OOC -0.075* 0.023
[0.042] [0.035]
AudInd -0.080* 0.012
[0.042] [0.039]
AudSize -0.030 0.076
[0.091] [0.056]
***, **, and * denote statistical significance at the 0.01, 0.05, and 0.10 levels (two-tailed), respectively. Standard
errors are in brackets.
Variable definitions
OOC = indicator representing if the audit committee is out of compliance with both the 100% independent and three-person
minimum requirement prior to E1
AudInd = indicator representing if the audit committee is out of compliance with the 100% independence rule prior to E1
AudSize = indicator representing if the audit committee is out of compliance with the minimum three-person requirement prior
to E1

57
Table 6
Parallel Trend Tests
Panel A. OOC
Restatement Fraud EM
Constant -4.052*** -4.516*** 0.002
[0.426] [0.579] [0.005]
Time (T) 0.326** 0.168 0.002
[0.155] [0.214] [0.002]
T × OOC -0.137 0.024 0.001
[0.120] [0.168] [0.001]
Observations 2,327 2,327 2,327
(Pseudo) R-squared 0.006 0.001 0.001
Panel B. AudInd
Restatement Fraud EM
Constant -4.038*** -4.514*** 0.002
[0.430] [0.580] [0.005]
Time (T) 0.332** 0.191 0.003
[0.147] [0.213] [0.002]
T × AudInd -0.208* -0.019 -0.000
[0.125] [0.165] [0.001]
Observations 2,327 2,327 2,327
(Pseudo) R-squared 0.010 0.001 0.001
Panel C. AudSize
Restatement Fraud EM
Constant -4.068*** -4.515*** 0.002
[0.424] [0.578] [0.005]
Time (T) 0.248 0.171 0.002
[0.154] [0.204] [0.002]
T × AudSize 0.047 0.069 0.005***
[0.163] [0.216] [0.002]
Observations 2,327 2,327 2,327
(Pseudo) R-squared 0.003 0.002 0.001

58
***, **, and * denote statistical significance at the 0.01, 0.05, and 0.10 levels (two-tailed), respectively. Standard
errors are in brackets.
Variable definition: Time (T) is a time trend variable for 1995 through 1998. The other variables are in Tables 2 and 3.

59
Table 7
Difference-in-Difference Tests
Restatement Fraud EM
(1) (2) (3) (4) (5) (6)
Constant -4.247*** -4.548*** -6.419*** -7.272*** 0.006 0.004
[0.704] [0.745] [1.380] [1.497] [0.022] [0.023]
OOC -0.071 -0.199 -0.004
[0.329] [0.506] [0.004]
AudInd -0.270 -0.261 -0.006
[0.341] [0.532] [0.004]
AudSize 0.716* 1.025 -0.005
[0.406] [0.660] [0.007]
Post 1.280*** 1.314*** 0.533 0.665* -0.004 -0.004
[0.276] [0.270] [0.382] [0.403] [0.005] [0.005]
Post × OOC -0.342 -0.188 0.000
[0.354] [0.523] [0.007]
Post × AudInd -0.263 -0.606 -0.003
[0.363] [0.569] [0.006]
Post × AudSize -0.619 -0.162 0.010
[0.410] [0.591] [0.012]
AC Expert -0.069 -0.054 -0.296 -0.257 -0.002 -0.002 [0.185] [0.187] [0.297] [0.304] [0.003] [0.003]
CEO Duality 0.010 0.014 0.285 0.310 -0.000 -0.000 [0.204] [0.205] [0.358] [0.368] [0.004] [0.004]
AC Busy -1.192 -1.257* -0.991 -1.134 0.004 0.003 [0.730] [0.714] [0.991] [0.913] [0.008] [0.008]
AC Ownership -1.487 -1.015 -10.044 -8.277 -0.027 -0.024 [3.011] [2.693] [12.882] [11.421] [0.027] [0.027]
AC Tenure -0.024 -0.022 -0.029 -0.027 0.000 0.001
[0.024] [0.024] [0.042] [0.042] [0.000] [0.000]
NYSE -0.057 -0.042 -0.121 -0.041 -0.017*** -0.017***
[0.233] [0.239] [0.423] [0.450] [0.005] [0.005]
Big Five -0.238 -0.234 -0.500 -0.487 0.009 0.009
[0.331] [0.333] [0.593] [0.600] [0.009] [0.009]
Size 0.187*** 0.205*** 0.309*** 0.351*** -0.003* -0.003*
[0.060] [0.061] [0.099] [0.100] [0.002] [0.002]
Leverage 0.631 0.722 2.431*** 2.694*** 0.054*** 0.054***
[0.514] [0.503] [0.676] [0.631] [0.016] [0.016]
Loss 0.598*** 0.582*** 0.889*** 0.818*** 0.048*** 0.047***
[0.212] [0.215] [0.305] [0.312] [0.006] [0.006]
Firm Age -0.001 0.002 0.001 0.008
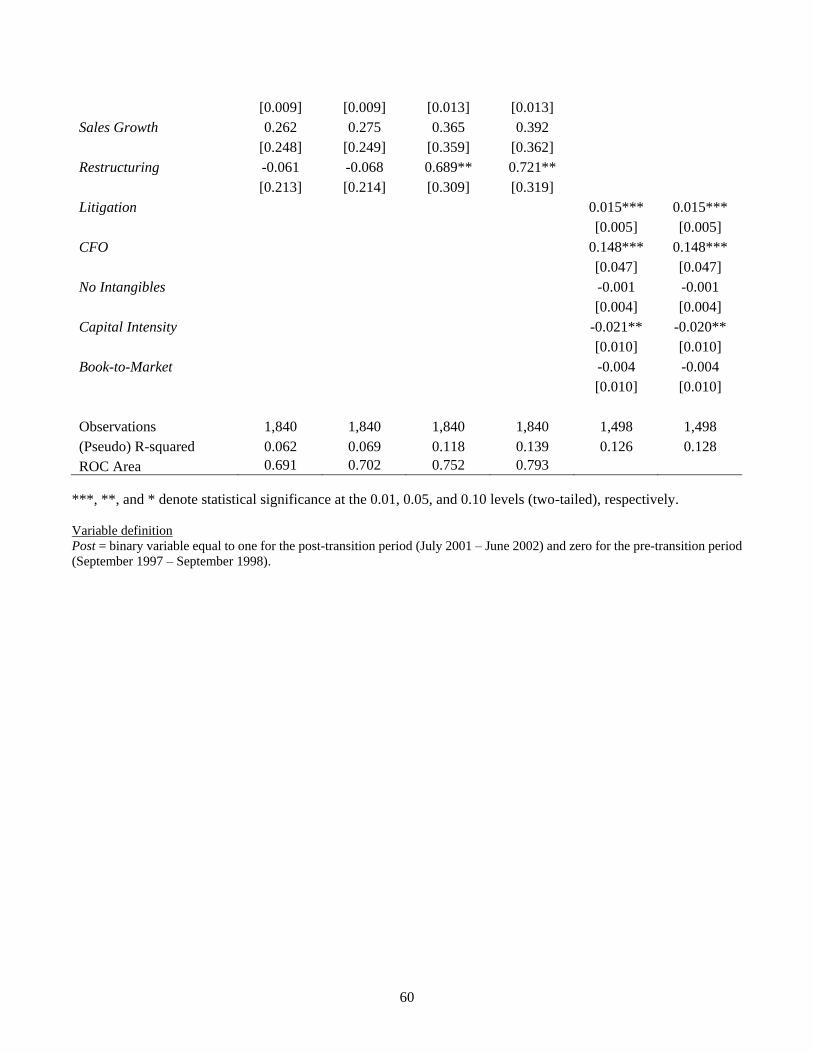
60
[0.009] [0.009] [0.013] [0.013]
Sales Growth 0.262 0.275 0.365 0.392
[0.248] [0.249] [0.359] [0.362]
Restructuring -0.061 -0.068 0.689** 0.721**
[0.213] [0.214] [0.309] [0.319]
Litigation 0.015*** 0.015***
[0.005] [0.005]
CFO 0.148*** 0.148***
[0.047] [0.047]
No Intangibles -0.001 -0.001
[0.004] [0.004]
Capital Intensity -0.021** -0.020**
[0.010] [0.010]
Book-to-Market -0.004 -0.004
[0.010] [0.010]
Observations 1,840 1,840 1,840 1,840 1,498 1,498
(Pseudo) R-squared 0.062 0.069 0.118 0.139 0.126 0.128
ROC Area 0.691 0.702 0.752 0.793
***, **, and * denote statistical significance at the 0.01, 0.05, and 0.10 levels (two-tailed), respectively.
Variable definition
Post = binary variable equal to one for the post-transition period (July 2001 – June 2002) and zero for the pre-transition period
(September 1997 – September 1998).