did structured credit fuel the lbo...
TRANSCRIPT

THE JOURNAL OF FINANCE • VOL. LXVI, NO. 4 • AUGUST 2011
Did Structured Credit Fuel the LBO Boom?
ANIL SHIVDASANI and YIHUI WANG∗
ABSTRACT
The leveraged buyout (LBO) boom of 2004 to 2007 was fueled by growth in collat-eralized debt obligations (CDOs) and other forms of securitization. Banks active instructured credit underwriting lent more for LBOs, indicating that bank lending poli-cies linked LBO and CDO markets. LBO loans originated by large CDO underwriterswere associated with lower spreads, weaker covenants, and greater use of bank debtin deal financing. Loans financed through structured credit markets did not lead toworse LBOs, overpayment, or riskier deal structures. Securitization markets alteredbanks’ access to capital, affected their lending policies, and fueled the recent LBOboom.
FROM 2004 TO 2007, $535 billion of leveraged buyouts (LBOs) were completed,more than 10 times the $50 billion of volume over the previous 8 years from1996 to 2003 (see Figure 1), vastly eclipsing the $227 billion (in 2007 dollars)of volume during the prior 1986 to 1989 LBO boom. The LBO boom of 2004 to2007 collapsed as dramatically as it rose, with LBO volume dropping by 94%in the fourth quarter of 2007 from the prior-year level.
Most explanations for LBOs are based on trade-off theories of capital struc-ture whereby LBOs create value from interest tax shields, lower agency costs,and operational improvements. While variation in these benefits may havecontributed to the large changes in LBO volumes, the 2004 to 2007 LBO boomalso coincided with important developments in structured credit markets thatpotentially altered the supply of credit. In a Modigliani and Miller (1958) worldin which the supply of capital is perfectly elastic, leverage ratios and the inci-dence of highly leveraged transactions are determined only by the demand for
∗Shivdasani is at Kenan-Flagler Business School, University of North Carolina at Chapel Hill.Wang is at the Department of Finance, Chinese University of Hong Kong. We thank two anonymousreferees, an associate editor, Greg Brown, Sudipto Dasgupta, John Graham (Editor), Cam Harvey,Matthias Kahl, Wayne Landsman, Micah Officer, Paige Ouimet, Chris Parsons, Adam Reed, JayRitter, Steffen Sascha, Ed Van Wesep, and seminar participants at the 2010 American FinanceAssociation meeting in Atlanta, the 2010 China International Conference in Finance meetingin Beijing, the 2010 European Finance Association meeting in Frankfurt, American University,Australia National University Summer Finance Camp 2009, Chinese University of Hong Kong,City University of Hong Kong, Hong Kong Baptist University, Nanyang Technological University,Southern Methodist University, Texas Christian University, Tsinghua University, University ofFlorida, University of North Carolina, University of Oregon, and University of Wisconsin at Madi-son for helpful comments. We thank Chris Flanagan and Kedran Panageas of JP Morgan andMarc Auerbach and William Chew of S&P for helpful discussions. We thank Asset-Backed Alertfor sharing their data and updating the sample to include recent deals. An earlier version of thispaper was titled “Does Credit Supply Drive the LBO Market?.”
1291

1292 The Journal of Finance R©
0
30
60
90
120
150
180
0
20
40
60
80
100
120T
otal
CD
O I
ssua
nce
Vol
ume
($bn
)
Tot
al L
BO
Vol
ume
($bn
)
Total LBO Volume (Right) Total CDO Issuance (Left)
Figure 1. LBO volume and CDO issuance volume (1996–2009). Total LBO volume is theaggregate transaction value of deals announced in each quarter between 1996 and 2009 for a totalof 369 LBO deals from SDC satisfying the following criteria: The deal is completed by January 2010;the target is a U.S. company and publicly traded; transaction value is greater than $10 million; atleast 50% of common shares are acquired in the deal; and the acquirers own 100% of the sharesafter. Transaction value of LBO is the total value of consideration paid by the acquirer, excludingfees and expenses. The CDO issuance volume aggregates the total CDOs issued worldwide. TheCDO sample, from ABS Database, includes CDO issues rated by at least one major rating agencyand under the control of a trustee. LBO is leveraged buyout; CDO is collateralized debt obligation.
corporate debt. Under this framework, structural changes affecting the sup-ply of credit should not affect the volume and financing of LBO transactions.Evidence that such structural changes do in fact matter would thus indicatethat capital market frictions affecting the availability of credit are an impor-tant element missing from the Modigliani and Miller framework. Faulkenderand Petersen (2006), Sufi (2009), Lemmon and Roberts (2010), Leary (2009),and Becker and Ivashina (2010) explore the importance of such supply-sideeffects in capital structure decisions. We extend this work by studying whethersupply-side effects contributed to the large boom in the LBO market and howthey affected the quality of LBO deals.
A hallmark of the 2004 to 2007 period was the expansion of the marketfor collateralized debt obligations (CDOs). The growth was particularly sharpfor CDOs backed by corporate loans, also referred to as collateralized loanobligations (CLOs). Bank loans used to finance LBOs were often placed inthese CLO vehicles. Hence, the CDO channel potentially increased the supplyof credit by allowing a wide range of institutional investors such as hedge

Did Structured Credit Fuel the LBO Boom? 1293
funds, insurance companies, pension funds, and other institutional investorsthat invest in CDOs to indirectly invest in LBO loans. In addition, placing LBOloans into CLOs may have allowed banks to lend more because they becameless constrained by their balance sheets since they no longer needed to meetcapital requirements when the loans were sold to CLOs. To satisfy investordemand for CDOs, CDO issuers also needed collateral assets, providing banksthat underwrote CDOs an incentive to originate loans so as to fund LBOs thatcould be placed in CDOs. We argue that the growth in the CDO market providedan important source of funding to finance LBOs.
We document a high correlation between the growth of the LBO and CDOmarkets and show that CDO issuance exploded concurrently with the LBOboom of 2004 to 2007. Aggregate CDO issuance rose to $1.3 trillion over 2004to 2007, twice the total issuance volume over the previous 8 years (see Figure 1).CDO issuance then dropped sharply in the second half of 2007 when the LBOboom came to an end. This is consistent with the view that increased supplyof credit from the CDO market fueled LBO transactions. Alternatively, anincrease in the demand for LBO transactions could generate increased demandfor bank loans, leading banks to create CLO vehicles to distribute these loansto investors. In addition, it is possible that both the LBO and CDO marketsgrew simultaneously because of some omitted factors during the boom period.
To disentangle supply- and demand-side factors, we study securitizationssuch as structured product CDOs that are not directly affected by the demandfor LBOs. Structured product CDOs hold securitized assets1 but do not investin corporate loans or bonds generated by LBOs. We also study asset-backedsecurities (ABS), the collateral assets of which include home equity loans,credit card loans, auto loans, and student loans, none of which are driven by thedemand for LBOs. Though neither structured product CDOs nor ABS includeLBO loans as collateral, their issuance volumes are also highly correlated withLBO volume. Thus, the link between the LBO and CDO markets cannot beexplained by increased demand for LBO financing.
One of our primary results is that in a bank fixed effects model, we find apositive within-bank correlation between a bank’s LBO lending and its accessto CDO capital through underwriting capabilities. In the years when a bankunderwrote more structured CDOs (which exclude LBO loans or bonds), it alsooriginated a larger volume of loans to finance LBOs. Since this result holds ina bank fixed effects framework, it cannot be attributed to a bank-level time-invariant omitted factor. In addition, we do not find that a similar relation holdsfor investment-grade lending, indicating that the increased credit supply is ob-served only in the leveraged loan market, where structured credit vehicles wereactive. We also show that a bank’s experience in CDO underwriting prior to theLBO boom is strongly associated with its LBO lending during the boom years.This helps establish that a bank’s LBO lending during the boom is related to itsexpertise in securitization rather than some factor correlated with the boom.
1 Such assets include residential mortgage-backed securities, commercial mortgage-backed se-curities, collateralized mortgage obligations, asset-backed securities, and other securitized assets.

1294 The Journal of Finance R©
It is harder to rule out a link between the LBO and CDO markets thatarises from an omitted factor that varies over time. For example, it is possiblethat both markets grew due to a decrease in the perception of risk. While wecannot eliminate this possibility, we provide several pieces of evidence thatindicate a direct link between the two markets. We show that the institutionaltranches, which represent the allocation of LBO loans to institutional investorssuch as CLOs, were considerably higher during the LBO boom years than inthe preboom years. In addition, we find a positive association between theCDO underwriting activity of the lead banks and the allocation of the LBOloan to institutional investors. This suggests that CDOs were more importantinvestors in LBO loans during the boom years and that better access to CDOinvestors allowed banks to raise more capital from these investors to financetheir LBO loan commitments.
A bank’s underwriting in CDO markets was also strongly associated withthe cost of LBO loans for its borrowers. We show that banks with large CDOunderwriting businesses offered cheaper credit and looser covenant protectionand LBO transactions funded by these banks employed bank loans more ag-gressively. Thus, a bank’s CDO underwriting activity was linked to easier creditterms for LBO financing.
We examine the implications of the lower cost of credit for LBO financingassociated with the CDO channel. Lower financing costs should make morefirms desirable LBO candidates by making previously marginal LBO targetsmore attractive. It is also possible that the ability of banks to sell LBO loansto CDOs instead of holding the loans on their balance sheets reduced theirscreening incentives and led banks to finance lower quality transactions. Inthe context of the subprime mortgage market, Keys et al. (2010) argue thatsecuritization adversely affected the screening incentives of mortgage lenders.
To explore these issues, we examine whether banks’ access to structuredcredit markets was associated with changes in the quality of LBO transactions.Based on the characteristics of the LBOs, we do not find that bank fundingfrom structured credit was associated with weaker screening incentives in LBOlending. Target firms in CDO-driven deals generated more free cash flows, paidmore taxes, and were less risky. This finding is surprising if lower financingcosts allowed previously marginal LBO deals to become worthwhile duringthe boom period. One possible explanation is that CDO-driven LBOs weremuch larger firms—on average four times the size of non-CDO-led LBOs. Thus,a primary impact of the CDO channel was to facilitate much larger LBOsthan historically possible, potentially because it helped relax balance sheetconstraints that banks faced in financing large LBOs. This is consistent withdevelopments in structured credit markets allowing banks to finance largeLBOs rather than facilitating worse deals.
When we consider LBO pricing, we do not find evidence indicating over-payment in CDO-driven deals. In fact, the trajectory of credit ratings fol-lowing LBOs indicates better ex post performance of CDO-driven deals thannon-CDO-driven deals. We also do not find that CDO-driven deals during theboom period were financed with lower equity contributions compared to other

Did Structured Credit Fuel the LBO Boom? 1295
LBOs. Overall, these results suggest that banks retained their incentives toscreen borrowers when originating LBO loans even when they sold the loansto CLOs, possibly because of incentives to preserve their reputation as diligentunderwriters.
Our paper contributes to the emerging literature on how securitization af-fects the behavior of credit borrowers and lenders. Mian and Sufi (2009) findthat securitization contributed to the growth of the subprime mortgage market.Loutskina and Strahan (2009) show that mortgage securitization increased thewillingness of banks to increase their mortgage lending. Nini (2008) shows thatthe growth of institutional investors increased the supply of credit to firms withspeculative-grade ratings. We find a similar pattern in the context of LBO lend-ing by demonstrating an association between the growth of the securitizationmarket and LBOs. Though some have argued that deteriorating loan qualityassociated with securitization of subprime mortgages contributed to the recentfinancial crisis (Brunnermeier (2009)), we do not find evidence of lower qualityfor corporate lending in the setting of LBO transactions.
Our results suggest that financing from structured credit markets is notnecessarily associated with lower quality transactions. Kaplan and Stein (1993)show that junk bond investors contributed to overheating of the LBO marketin the late 1980s. Unlike high-yield bonds, loans sold to CDOs were originatedby banks, which may have resulted in stronger incentives for banks to screenborrower quality. Our evidence complements other studies of the recent LBOboom. Demiroglu and James (2010) and Ivashina and Kovner (2011) examinethe reputation of private equity groups and their relationship with lenders.Other studies exploring related issues include Acharya and Johnson (2010),Axelson et al. (2010), Boone and Mulherin (2009), Guo, Hotchkiss, and Song(2011), Kaplan and Stromberg (2009), Metrick and Yasuda (2010), and Officer,Ozbas, and Sensoy (2010).
The paper proceeds as follows. Section I describes the markets for CDOsand leveraged loans in more detail. Section II describes the sample and thedata. Section III presents our main results. Section IV examines the effects ofCDO lending on the structure, pricing, and quality of recent LBO transactions.Section V concludes.
I. Background: CDOs and Leveraged Loans
A. Collateralized Debt Obligations
CDOs are notes issued by a special purpose vehicle (also referred to as aCDO vehicle) that are collateralized by a portfolio of assets. Depending on theunderlying assets, CDOs are classified as CLOs, collateralized bond obliga-tions (CBOs), or structured product CDOs that invest in structured productsand notes. Unlike traditional pass-through securitization involving most ABSand mortgage-backed securities (MBS), CDO notes are usually divided intotranches with different seniority. The senior tranches have investment-graderatings, with the majority at AAA even though the collateral assets might be

1296 The Journal of Finance R©
rated much lower.2 Before the financial crisis of 2007 and 2008, almost 60% ofthe structured finance notes received an AAA rating (Fitch Ratings (2007)).
The higher rating of senior tranches allowed CDOs to be sold to a broaduniverse of investors such as banks, insurance companies, pension funds, andcertain asset managers that might not have otherwise invested in high-yield in-struments. Hence, the tranching process allowed speculative-grade assets un-derlying the CDOs to be financed using the much larger capacity of investment-grade markets. CLOs, which primarily held leveraged loans that could be usedto finance LBOs, were a very important part of the CDO market and attractedmany of the same investors that invested in CDOs.3 For example, about halfof the CDOs that insurance companies purchased were CLOs, according toCiti Credit Research (2007). Thus, CLOs helped bring new investors to theleveraged loan market, investors who had historically participated in securiti-zation markets primarily through traditional channels such as ABS and MBS.4
Figure 2 depicts how CDO markets were used in the financing of LBO trans-actions.
A potentially important driver behind the growth of CDOs was the changein banks’ incentives regarding tranching in securitization resulting from theBasel II Accord, published in June 2004.5 The CDO market allowed banks tosell risky assets with high capital requirements (such as leveraged loans) toCDO investors, while at the same time investing in the senior CDO tranches,which required less capital.6 The incentive of banks to hold senior trancheswas a critical element in the expansion of the CDO market because most ofthe other major CDO investors (e.g., hedge funds) were more interested inthe higher risk junior tranches. In addition, Coval, Jurek, and Stafford (2009a)and Brennan, Hein, and Poon (2009) document pricing errors for CDO tranches,
2 Coval, Jureck, and Stafford (2009b) discuss how high ratings were achieved given the muchriskier collateral assets in CDOs. Benmelech and Dlugosz (2009) and Griffin and Tang (2010) arguethat CDO notes were overrated before the crisis.
3 According to the Securities Industry and Financial Markets Association (SIFMA), all of theCLOs issued between 2005 and 2007 were backed by leveraged loans.
4 Though systematic data on investor participation in various securitization markets are un-available, discussions with industry professionals suggest a high overlap between investors inCDO, CLO, and ABS markets. Such overlap also exists between the CLO and MBS markets,though some credit and corporate funds tend to invest in CLOs but not in mortgage and realestate assets. On the other hand, some dedicated mortgage funds tend to invest in MBS and realestate–related equities but do not invest in CLOs. In subsequent tests, we focus more on the ABSmarkets than the MBS markets due to their higher potential overlap in investor base with CLOs.However, our results are qualitatively similar if we use variables based on MBS markets.
5 Though Basel II had not been uniformly implemented in the United States during our sampleperiod, JP Morgan (2007) argues that the effects of its implementation were clearly anticipatedin market prices. During this period, most large “internationally active” banks moved toward arisk-based capital approach both for their internal capital management and for communicatingtheir capital positions to analysts and investors.
6 Under Basel II, the weight on some AAA investments in securitized assets is only 7%. With an8% capital requirement, an investment in an AAA security requires banks to put up only 0.56%(7% x 8%) capital for the invested asset, an implicit leverage of 178 (1/0.56%). JP Morgan (2007,p. 118) notes that “the Basel II capital framework for securitization was a key driver of the excessiveleverage applied to ABS securities via structured finance CDOs.”

Did Structured Credit Fuel the LBO Boom? 1297
Figure 2. Illustration of LBO financing and the structure of securitization markets.LBO is leveraged buyout; CLO is collateralized loan obligation; CDO is collateralized debt obliga-tion; ABS is asset-backed securities; MBS is mortgaged-backed securities; CBO is collateralizedbond obligation; SIV is structured investment vehicle.
offering another potential explanation for the rapid growth in the CDO marketduring this period.
B. Leveraged Loans
Leveraged loans are bank loans issued to borrowers with speculative-graderatings, most of which are syndicated. In the syndicated loan market, investorscan be classified into pro rata investors and institutional investors. Accordingto S&P (2006), commercial banks and finance companies typically invest inrevolvers and term loan A (or amortizing term loan) tranches, also referredto as pro rata tranches. CLO vehicles, prime funds, hedge funds, and insur-ance companies typically comprise the bulk of institutional investors. Theseinvestors invest in the term loan B, C, and D tranches, also referred to as insti-tutional tranches. Term loan A tranches have an amortization structure whileinstitutional term loan tranches repay toward the end of the term. Hence, in-stitutional tranches tend to be riskier and are priced at higher spreads thanpro rata tranches.7 Since CLO vehicles invest in institutional tranches, our
7 After 2001, spreads on an increasing number of institutional tranches were priced closer topro rata tranches, and in some cases were even lower according to S&P (2006), which attributesthis pattern to the higher demand for leveraged loans from institutional investors.

1298 The Journal of Finance R©
0
10
20
30
40
50
60
70
0
20
40
60
80
100
120
140
160
$Bil
lion
$Bil
lion
Pro Rata Volume (Left) Institutional Volume (Left) CLO Issuance (Right)
Figure 3. Leveraged loan allocation and CLO issuance volume. The figure shows quar-terly volume of newly issued leveraged loans broken down by pro rata and institutional marketallocation, and the issuance volume of collateralized loan obligations (CLOs). The leveraged loanvolume is from S&P’s LCD and CLO volume is calculated using the ABS Database.
tests focus on the pricing of these tranches, which is referred to as the insti-tutional spread and measured as the spread on the term loan B tranche, themost common institutional tranche.
CLO vehicles were one of the most important investors in the institutionalmarket, representing 60% of the institutional investor volume in primary mar-kets of leveraged loans by 2006 (S&P (2006)). Thus, during the LBO boom, asubstantial part of the financing of leveraged loans came from CLO vehicles.Consistent with the active participation of CLOs in institutional tranches,Figure 3 displays a close linkage between CLO issuance volumes and the allo-cation of leveraged loans to institutional tranches during the LBO boom. Thefraction of institutional tranches in leveraged loans was 70% to 80% duringthe peak of the LBO boom but dropped to 40% by the end of 2008 as CLO is-suance declined sharply at the onset of the financial crisis. Figure 3 also showsthat CLO issuance volumes were not closely linked to the pro rata allocations,consistent with the observation that CLOs rarely invest in pro rata tranches.
II. Data and Sample Description
A. The LBO Sample
Our sample consists of 345 LBOs from SDC Platinum satisfying the followingcriteria: The transaction was announced between 1996 and the second quarterof 2008 and completed by July 2008; the target is a publicly traded U.S. com-pany; the transaction value is at least $10 million; at least 50% of the common

Did Structured Credit Fuel the LBO Boom? 1299
shares were acquired; and the buyers owned 100% of the shares upon comple-tion. Our minimum deal value of $10 million is lower than that in some otherstudies, such as Kaplan (1989b) and Guo, Hotchkiss, and Song (2011) and ischosen to avoid biasing against earlier time periods when smaller deals weremore common.
Figure 1 shows that LBO volume rose in the second quarter of 2004, when$5.6 billion of LBOs were announced. The pace of LBOs picked up dramatically,reaching $20 billion in the last quarter of 2005. At $255 billion of announceddeal volume, 2006 was a record year for LBOs. With the onset of the creditturmoil, LBO volume dropped to $32 billion in the third quarter of 2007 and tounder $5 billion in the first quarter of 2008. The number of deals also increasedduring 2004 and 2007 but less dramatically because much larger LBO deal sizeswere a hallmark of the boom period.
We match the LBO targets with LBO loans from Loan Pricing Corporation’s(LPC) DealScan and collect data on tranche types and amounts, lead arrangers,spreads, maturity, and other terms. We also manually collect data from proxyfilings as well as from schedules 14A, TO-T, S-4, and 13E3 when these filingsare available in Edgar. We check these filings for two reasons. First, someLBO loans, particularly for smaller deals, are not in DealScan. For these loans,we collect information on the loan contract whenever available. Second, sinceDealScan does not identify which loans are asset-backed, we use information inproxy filings to remove tranches that can be identified as asset-backed financ-ing.8 Asset-backed loans are excluded to avoid potential bias resulting fromsecuritized financing other than CDOs.9
We are able to collect data on lead arrangers and borrowing amounts for275 loans financing 241 deals (70% of the sample). We lose some observationsbecause several small deals were funded by cash, mezzanine finance, or equityand did not arrange bank loans to finance the deals. Other deals were notconditioned on the availability of financing and thus lack disclosure on loans.In addition, we exclude a few asset-backed loans, and, for some firms, filingsare unavailable on Edgar.
The volume of bank loans in each quarter is shown in the Internet Ap-pendix.10 The pattern mirrors the volume of LBO transactions, with heavyvolume between the second quarter of 2004 and the first half of 2007. To-tal bank borrowing peaked in the second quarter of 2007, while LBO volumepeaked at the end of 2006.11 On average, bank loans comprise 53% of LBO
8 For example, commercial mortgage-backed financings were used in the buyouts of UICI, LaQuinta, and Station Casinos, but these are included in DealScan and flagged as “other loan”tranches, which are not distinguishable from other loans.
9 When DealScan and proxy filings differ, we retain the DealScan information since termsspecified in proxy filings are sometimes adjusted after the filing and hence may not be the finalterms.
10 The Internet Appendix is available on The Journal of Finance website at http://www.afajof.org/supplements.asp.
11 The reason for LBO volume and LBO loan volume to peak at different times is because theloan sample excludes commercial mortgage financing for a few large deals announced in the fourth

1300 The Journal of Finance R©
volume, indicating that they represented the most important form of financingfor LBOs during our sample period.
We also identify the financing structure for 235 (68.1%) of the sample deals.We collect information on nonbank financing from proxy filings, supplementedwith SDC’s data on high-yield bond issuance. We record the total fundingneeded to complete the deal and the amounts of total equity financing frompost- and pre-LBO investors, asset-backed financing, high-yield bonds/notes,and mezzanine finance when available.12
B. Data on CDO and Other Securitized Issues
Data on CDOs and other securitized issues are from Asset-Backed Alert’sABS Database, which provides the initial terms of all rated issues of ABS,MBS, and CDOs worldwide.13 The first full year of CDO coverage begins in1996 and hence we use this as the starting point for our sample.
From 1996 through the second quarter of 2008, 4,542 CDOs with a total valueof $1.9 trillion were issued. Figure 1 shows the virtually identical trajectoriesin the LBO and CDO markets, with both markets rising and falling at the sametime. The correlation between the natural log of quarterly LBO volumes andof CDO issuance volumes is quite strong at 0.68.
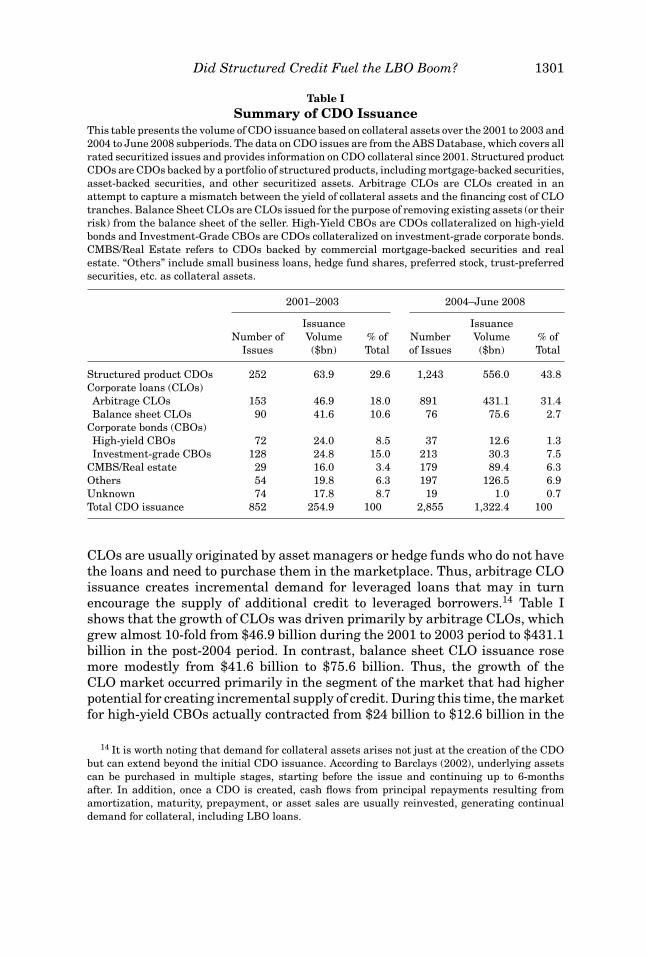
Table I summarizes the CDO market. We have detailed data on the under-lying collateral for CDOs after 2001. Hence, we compare CDO issuance during2001 and 2003 to the post-2004 period. The CDO market witnessed explosivegrowth during this period, rising from aggregate issuance volume of $255 bil-lion to over $1.3 trillion. The growth was particularly pronounced for structuredproduct CDOs, whose issuance volume rose from $63.9 billion over the 2001 to2003 period to $556 billion in the post-2004 period. CLOs also experienced verystrong growth, with issuance volume rising from $88.5 billion to $506.7 billion.
CLOs are either balance sheet or arbitrage CLOs, depending on the purposeof issuance. A balance sheet CLO is typically originated by a bank that seeks toremove its existing loans (or their risk) from its balance sheet. Since the loansin a balance sheet CLO already exist on a bank’s loan book, these CLOs do notgenerate much additional demand for leveraged loans. In contrast, arbitrage
quarter of 2006, including the $41 billion LBO of Equity Office Properties and the $28 billionbuyout of Harrah’s Entertainment.
12 Total funding needs include cash needed to pay off equity, option, and warrant holders; retireexisting debt; and pay for fees and expenses related to the deal. The amount of bank financing isfrom the bank loan data set. When a deal cannot be matched with a bank loan in the loan sample,and the proxy filings indicate no bank financing, bank financing is assumed to be zero. Bridge loansor other bridge financing are recorded as high-yield bond/note and mezzanine finance. The amountof high-yield bond issues is supplemented by bond issuance data in SDC for 40 deals for whichthe hand-collected amounts are different from proceeds recorded in SDC. Equity contributions andasset-backed financing are from proxy filings.
13 To be included in the ABS Database, an issue must be rated by at least one major rating agency,under control of a trustee, and collateralized on some assets. The data set excludes commercialmortgage-backed issues, agency-sponsored MBS, issues by municipalities, tax-exempt issues, andasset-backed commercial paper issues.
Did Structured Credit Fuel the LBO Boom? 1301
Table ISummary of CDO Issuance
This table presents the volume of CDO issuance based on collateral assets over the 2001 to 2003 and2004 to June 2008 subperiods. The data on CDO issues are from the ABS Database, which covers allrated securitized issues and provides information on CDO collateral since 2001. Structured productCDOs are CDOs backed by a portfolio of structured products, including mortgage-backed securities,asset-backed securities, and other securitized assets. Arbitrage CLOs are CLOs created in anattempt to capture a mismatch between the yield of collateral assets and the financing cost of CLOtranches. Balance Sheet CLOs are CLOs issued for the purpose of removing existing assets (or theirrisk) from the balance sheet of the seller. High-Yield CBOs are CDOs collateralized on high-yieldbonds and Investment-Grade CBOs are CDOs collateralized on investment-grade corporate bonds.CMBS/Real Estate refers to CDOs backed by commercial mortgage-backed securities and realestate. “Others” include small business loans, hedge fund shares, preferred stock, trust-preferredsecurities, etc. as collateral assets.
2001–2003 2004–June 2008
Issuance IssuanceNumber of Volume % of Number Volume % of
Issues ($bn) Total of Issues ($bn) Total
Structured product CDOs 252 63.9 29.6 1,243 556.0 43.8Corporate loans (CLOs)Arbitrage CLOs 153 46.9 18.0 891 431.1 31.4Balance sheet CLOs 90 41.6 10.6 76 75.6 2.7
Corporate bonds (CBOs)High-yield CBOs 72 24.0 8.5 37 12.6 1.3Investment-grade CBOs 128 24.8 15.0 213 30.3 7.5
CMBS/Real estate 29 16.0 3.4 179 89.4 6.3Others 54 19.8 6.3 197 126.5 6.9Unknown 74 17.8 8.7 19 1.0 0.7Total CDO issuance 852 254.9 100 2,855 1,322.4 100
CLOs are usually originated by asset managers or hedge funds who do not havethe loans and need to purchase them in the marketplace. Thus, arbitrage CLOissuance creates incremental demand for leveraged loans that may in turnencourage the supply of additional credit to leveraged borrowers.14 Table Ishows that the growth of CLOs was driven primarily by arbitrage CLOs, whichgrew almost 10-fold from $46.9 billion during the 2001 to 2003 period to $431.1billion in the post-2004 period. In contrast, balance sheet CLO issuance rosemore modestly from $41.6 billion to $75.6 billion. Thus, the growth of theCLO market occurred primarily in the segment of the market that had higherpotential for creating incremental supply of credit. During this time, the marketfor high-yield CBOs actually contracted from $24 billion to $12.6 billion in the
14 It is worth noting that demand for collateral assets arises not just at the creation of the CDObut can extend beyond the initial CDO issuance. According to Barclays (2002), underlying assetscan be purchased in multiple stages, starting before the issue and continuing up to 6-monthsafter. In addition, once a CDO is created, cash flows from principal repayments resulting fromamortization, maturity, prepayment, or asset sales are usually reinvested, generating continualdemand for collateral, including LBO loans.

1302 The Journal of Finance R©
post-2004 period, indicating that CBOs were not an important channel throughwhich structured credit helped finance LBOs.
In the Internet Appendix, we summarize the size of the entire structuredcredit market. The total volume of securitized issues rose from $4.76 trillionover 1996 to 2003 to $8.07 trillion over the next four and half years. The bulk ofthe growth arises from expansion of the CDO market and of structured creditlinked to U.S. and non-U.S. residential real estate. Total CDO issuance morethan doubled during this period, and issuance of U.S. MBS and home equityloan ABS along with non-U.S. residential MBS/ABS also doubled.
III. Results
A. Correlation between LBO and CDO Markets
LBO and CDO volumes can be positively correlated due to factors affect-ing either the demand or the supply of LBO loans. Increased supply of capitalthrough structured credit may drive LBO activities. However, a higher demandto complete LBOs also results in new bank loans and high-yield bonds that maybe sold to CLOs and CBOs. As a first step in understanding the link betweenthese two markets, we examine the correlation of institutional spreads on lever-aged loans with LBO volumes and LBO loan volumes. While an outward shiftin LBO loan demand is expected to increase loan spreads, an outward shift inthe supply of credit should lower spreads. Hence, evidence of a negative corre-lation between changes in institutional spreads and changes in LBO volumeand LBO loan volume would be consistent with a shift in credit supply fromthe institutional market. For comparison, we also consider spreads on pro ratatranches. Since CDOs do not participate in pro rata tranches, examining prorata spreads serves as a useful control to isolate the effect of CDOs on thepricing of bank credit.
We find that quarterly changes in spreads on institutional tranches ratedBB and B display correlation of −0.32 and −0.39 with changes in loan volumesand of −0.28 and −0.30 with changes in LBO volumes. However, we do not finda meaningful correlation between changes in LBO volumes or loan volumeswith changes in pro rata spreads. While this does not mean that LBO demanddid not change during this period, it does indicate an outward shift in creditsupply in the institutional market, where CDOs were active investors duringthe boom.15
If credit expansion from the CDO market allowed banks to make more LBOloans, LBO lending should be correlated with all types of CDOs, not just theCLOs that hold leveraged loans or the CBOs that hold high-yield bonds. Ac-cordingly, we consider the volume of all CDOs excluding CLOs and CBOs. Wehenceforth refer to this group as structured CDOs since structured product
15 Arguably, LBO demand increased substantially before the third quarter of 2007. We also findevidence of a negative correlation between LBO loan volumes and institutional spreads in theperiod before the third quarter of 2007, suggesting that shifts in the supply of credit were notoffset by shifts in LBO demand during this period.

Did Structured Credit Fuel the LBO Boom? 1303
CDOs comprise the vast majority of these instruments. Structured CDO vol-ume is also highly correlated with LBO volume with a correlation of the naturallog amounts of 0.64. Thus, the link between LBO and CDO markets is not amechanical result of LBO loans and high-yield bonds being placed in CLO andCBO vehicles.
We also consider the more traditional securitization market of ABS. Thecollateral assets in ABS include home equity, auto, credit card, and studentloans. Since LBOs do not create these types of consumer loans, ABS issuanceis not affected by the demand for LBOs. Yet as an ancestor of CDOs, the ABSmarket shares a similar investor base to that of the CDO market. We find thatABS issuance volumes are also highly correlated with LBO volume, with acorrelation of the log amounts of 0.52.
B. Multivariate Evidence on LBO and CDO Markets
We next examine the link between the CDO and LBO markets in a multi-variate framework where we control for factors affecting the demand for LBOloans, macroeconomic conditions, and other potential sources of credit supply.The control variables include GDP growth, the high-yield spread calculated asthe Bank of America–Merrill Lynch High-Yield Index over 6-month LIBOR,the difference between prime and fed funds rates, and the equity market riskpremium calculated as the equity market return over the 90-day Treasury billreturn.
Table II shows three specifications linking overall LBO volume to the size ofthe CDO market, structured CDO market, and ABS market. Model (1) confirmsthe positive correlation between LBO volumes and CDO issuance volumes. Thecoefficient of 1.73 implies a partial correlation of 0.62 between the log of LBOand CDO volumes. Regression (2) shows that LBO and structured CDO volumesare also positively related, indicating that the relation between LBO and CDOvolumes is not driven by LBO loans being placed into CDO vehicles. The partialcorrelation between the log of LBO volumes and the log of Structured CDO is0.51. Regression (3) shows that LBO volumes are also positively linked to ABSissuance volumes. As in Axelson et al. (2010), this specification shows thatLBO volumes are negatively related to the high-yield spread, suggesting thatfinancing costs in high-yield bond markets affect LBO activity.
We estimate corresponding regressions for aggregate quarterly LBO loanvolumes and obtain similar results. Models (4) to (6) show that LBO loanvolumes are also positively related to issuance volumes in CDO, structuredCDO, and ABS markets. Among the control variables, GDP Growth tends tohave a positive effect on LBO volumes and loan volumes. The high-yield spreadhas a negative effect on LBO loan volumes, consistent with Axelson et al. (2010).
The last four columns link spreads on institutional tranches of leveragedloans to issuance volumes in the CDO market. A negative correlation betweeninstitutional spreads and CDO issuance volumes would be consistent with anexpansion in credit supply from the CDO market. Model (7) displays such anegative correlation. Point estimates indicate that a one-standard-deviation

1304 The Journal of Finance R©T
able
IIR
egre
ssio
ns
ofL
BO
Vol
um
eon
Siz
eof
CD
Oan
dS
ecu
riti
zati
onM
ark
ets
Th
ista
ble
pres
ents
the
regr
essi
ons
ofL
BO
volu
mes
,lo
anvo
lum
es,
and
spre
ads
onth
esi
zeof
CD
Oan
dse
curi
tiza
tion
mar
kets
.T
he
LB
Ovo
lum
ein
mod
els
(1)
to(3
)is
the
aggr
egat
equ
arte
rly
volu
me
ofal
lL
BO
deal
sfr
omS
DC
sati
sfyi
ng
the
foll
owin
gcr
iter
ia:
the
deal
isan
nou
nce
dbe
twee
n19
96an
dth
ese
con
dqu
arte
rof
2008
and
com
plet
edby
July
2008
;th
eta
rget
isa
U.S
.co
mpa
ny
and
ispu
blic
lytr
aded
;tr
ansa
ctio
nva
lue
isgr
eate
rth
an$1
0m
illi
on;a
tle
ast
50%
ofco
mm
onsh
ares
are
acqu
ired
inth
ede
al;a
nd
the
acqu
irer
sow
n10
0%of
the
shar
esaf
ter.
LB
OL
oan
Vol
um
eis
the
aggr
egat
eof
lon
g-te
rmba
nk
loan
borr
owin
gam
oun
tfo
rth
e24
1sa
mpl
ede
als
wh
ere
info
rmat
ion
onth
eam
oun
tsof
ban
klo
ans
can
beid
enti
fied
.S
prea
dsof
Lev
erag
edL
oan
sis
the
quar
terl
ysp
read
ofth
ein
stit
uti
onal
tran
ches
inle
vera
ged
loan
sra
ted
BB
orB
,pr
ovid
edby
LP
Cba
sed
onn
ewis
sues
ofle
vera
ged
loan
s.L
og(C
DO
)is
log
ofth
equ
arte
rly
issu
ance
volu
me
ofal
lty
pes
ofC
DO
s;L
og(S
tru
ctu
red
CD
O)
excl
ude
sC
DO
sba
cked
onco
rpor
ate
loan
s(C
LO
s)or
bon
ds(C
BO
s);
Log
(AB
S)
incl
ude
sis
suan
cevo
lum
esof
AB
S.
Pri
me
Ove
rF
edF
un
dR
ate
isca
lcu
late
das
the
prim
era
tem
inu
sth
efe
dera
lfu
nds
rate
.Hig
h-Y
ield
Spr
ead
isth
esp
read
ofth
eB
ank
ofA
mer
ica–
Mer
rill
Lyn
chH
igh
-Yie
ldIn
dex
over
the
6-m
onth
LIB
OR
rate
.G
DP
Gro
wth
isth
ese
ason
ally
adju
sted
perc
enta
gech
ange
inG
DP
over
aye
area
rlie
r.R
isk
Pre
miu
mis
calc
ula
ted
asth
ean
nu
aliz
edva
lue-
wei
ghte
dm
arke
tre
turn
min
us
retu
rnon
90-d
aybi
lls.
Th
efi
rst
row
for
each
inde
pen
den
tva
riab
lere
port
sth
ees
tim
ated
coef
fici
ent.
Th
ese
con
dro
wre
port
sab
solu
teva
lues
ofth
et-
stat
isti
cu
sin
gN
ewey
–Wes
tst
anda
rder
rors
adju
stin
gfo
rse
rial
corr
elat
ion
.∗∗∗
,∗∗ ,
and
∗in
dica
tes
stat
isti
cal
sign
ifica
nce
atth
e1%
,5%
,an
d10
%le
vel,
resp
ecti
vely
.
Log
(In
stit
uti
onal
Spr
eads
ofL
ever
aged
Loa
ns)
Log
(LB
OV
olu
me)
Log
(LB
OL
oan
Vol
um
e)B
BR
ated
BR
ated
(1)
(2)
(3)
(4)
(5)
(6)
(7)
(8)
(9)
(10)
Log
(CD
O)
1.73
1.58
−0.2
0−0
.14
5.16
∗∗∗
4.79
∗∗∗
4.82
∗∗∗
3.35
∗∗∗
Log
(Str
uct
ure
dC
DO
)1.
501.
41−0
.20
−0.1
35.
64∗∗
∗5.
02∗∗
∗3.
26∗∗
∗2.
74∗∗
∗
Log
(AB
S)
2.59
2.40
4.67
∗∗∗
4.24
∗∗∗
Pri
me
Ove
rF
edF
un
ds
Rat
e4.
593.
6613
.86.
255.
2914
.72.
402.
471.
681.
740.
870.
672.
28∗∗
0.83
0.77
2.34
∗∗2.
85∗∗
∗3.
22∗∗
∗2.
22∗∗
2.47
∗∗
Hig
h-Y
ield
Spr
ead
−0.2
1−0
.23
−0.4
9−0
.25
−0.2
6−0
.51
0.01
0.01
0.02
0.02
1.60
1.60
3.90
∗∗∗
1.79
∗1.
76∗
3.71
∗∗∗
0.67
0.34
1.42
1.17
GD
PG
row
th0.
320.
10−0
.08
0.57
0.38
0.21
−0.0
4−0
.02
−0.0
4−0
.02
1.73
∗0.
500.
391.
91∗
1.32
0.62
1.48
0.75
1.26
0.80
Ris
kP
rem
ium
−0.7
2−1
.04
−0.3
4−1
.52
−1.8
3−1
.17
0.01
0.00
−0.0
10.
001.
041.
470.
511.
271.
501.
090.
110.
670.
150.
32C
onst
ant
−24.
4−1
7.1
−60.
0−2
9.7
−23.
2−6
2.9
0.59
0.14
2.21
1.86
1.29
0.96
2.95
∗∗∗
1.19
1.05
2.89
∗∗∗
0.23
0.06
0.91
0.85
Obs
erva
tion
s49
4949
4949
4941
4141
41A
dj.R
20.
520.
420.
430.
480.
420.
430.
590.
600.
610.
61

Did Structured Credit Fuel the LBO Boom? 1305
increase in the log of CDO issuance volume is associated with a 33 basis pointdecrease in the institutional spread of the BB-rated tranches. Model (8) showsthat this result holds if we use the volume of structured CDO underwriting.We also find a similar relation using ABS volume. Models (9) and (10) confirmthat the relation between CDO volume and leveraged loan spreads holds usingspreads of B-rated institutional loans.16 Interestingly, in all models, institu-tional spreads on leveraged loans are not significantly related to the high-yieldspread. This suggests that financing costs in the leveraged loan and high-yieldbond markets are determined by different factors and that the effect of CDO is-suance volume on institutional spreads on leveraged loans cannot be explainedby contemporaneous changes in high-yield spreads.
Overall, the aggregate-level evidence indicates a clear link between the CDOand LBO markets that cannot be explained by LBO loan demand fueling CDOissuance. However, it is possible that the link between the two markets is theoutcome of an omitted factor. We next turn to bank-level and loan-level analysesto address the possibility that omitted factors may be responsible for the linkbetween the LBO and CDO markets.
C. Results from Bank-Level Analysis
We test whether a bank’s activities in the CDO markets affected its lendingbehavior. If an increased supply of credit through the CDO market made abank a more aggressive LBO lender, we expect that a bank with substantialCDO underwriting activities would originate more LBO loans. The presence ofan established distribution channel to structured credit investors should allowa bank with CDO underwriting capabilities to distribute its LBO loans to CLOvehicles. To test the effect of a bank’s CDO underwriting on its LBO lending, weconstruct a panel data set to estimate the following bank fixed effects model:
LBOLendingit =K∑
i=1
αi + β × CDOit + γ ′ × Xit + δ′ × Zt + εit, (1)
where LBOLendingit is the total volume of LBO loans that bank i arranges inyear t, αi is the bank fixed effect, Xit and Zt are proxies for bank characteristicsand macroeconomic conditions, respectively. The term CDOit is the volume ofCDOs underwritten by bank i in year t. We also use our two non-LBO-relatedmeasures of the structured credit market to proxy for CDOit. If the supply ofcapital through structured credit led a bank to be a more aggressive lender, weexpect β > 0.
16 As an additional test of the credit supply view, we examine the difference between institutionaland pro rata spreads. The supply of credit from CLOs is expected to lower institutional spreads butshould have little impact on pro rata spreads. Hence, the difference in institutional and pro rataspreads should also be negatively correlated with CDO volumes. Results presented in the InternetAppendix display such a pattern. For both BB- and B-rated loans, we find that the differencebetween institutional and pro rata spreads is negatively related to CDO and structured CDOunderwriting volumes.

1306 The Journal of Finance R©
Using a fixed effects approach allows us to control for bank-level fixed omit-ted variables. This helps address the possibility that an unobserved factorsimultaneously drove both a bank’s decision to originate LBO loans as well asthe growth in its CDO underwriting. Bank-level time-invariant omitted fac-tors cannot explain a correlation between a bank’s LBO lending and it’s CDOunderwriting in this setting.
To construct the bank-level panel data set on banks’ annual LBO lendingvolumes and their CDO underwriting activity, we start with all the lead banksin the LBO loan sample. For each bank, we calculate the total volume of LBOloans it originates and the total volume of CDOs it underwrites in each year.For sole-led loans, we assign full lending credit to the lead bank.17 For co-led loans, we divide the loan amount equally among all the lead banks. Asin Sufi (2007), the banks are consolidated with the parent holding companyin the loan allocation algorithm. When banks merge, loan allocations of theacquired bank are aggregated with those of the acquirer as of the effective dateof the merger. Allocation of CDO underwriting volumes across lead banks isperformed similarly. Only 8.3% of the CDO issues in our sample had multipleunderwriters.
In the Internet Appendix, we show the structured credit underwriting activ-ities for the top LBO lenders. In the post-2004 period, the top 10 LBO lendersoriginated $225 billion in LBO loans, with a 94% market share in LBO lending.During this time, these top LBO lenders were all major CDO underwriters, andeach ranked among the top 13 CDO underwriters with a collective 55% marketshare in CDO underwriting. However, this tight correspondence between LBOlending and CDO underwriting activity did not exist pre-2004. Before 2004,the top 10 LBO lenders had a 79% market share in LBO loan origination butonly a 25.5% market share in CDO underwriting. Four of the top LBO lendershad no CDO underwriting activity. Similar patterns hold using the ranking ofthe top LBO lenders in structured CDO and ABS markets. The contrast in theoverlap between LBO lending and structured credit underwriting before andafter 2004 suggests these two activities were much more closely linked duringthe LBO boom than was historically the case.
For each bank-year, we calculate the bank’s underwriting activity in struc-tured credit markets using variables that correspond to our aggregate mea-sures of market size: Bank CDO is the aggregate volume of CDOs under-written by a bank in a given year, Bank Structured CDO measures a bank’snon-CLO and non-CBO underwriting, and Bank ABS represents the volume ofABS underwritten by the bank in a given year. The models include Bank Size(measured as log of total bank assets), Capital Ratio (the ratio of total equityto total assets), Deposits (total customer deposits over total assets), and FedFunds Rate as controls.
17 As described by Sufi (2007), lead banks are primary negotiators of the loans. They are re-sponsible for collecting information and negotiating loan terms, they typically hold a larger shareof the loan, and they charge up-front fees. Other syndicate participants maintain an arm’s-lengthrelationship with the borrower by interacting with lead banks. Our allocation of loan amounts isalso consistent with how league tables for banking transactions are computed.

Did Structured Credit Fuel the LBO Boom? 1307
One concern is that a number of banks merged during our sample periodand in some cases might have gained CDO underwriting capabilities throughacquisitions. To account for bank mergers in the panel data regressions, wemerge the lending and underwriting activity as well as balance sheet data forthe acquired bank with that of the acquirer throughout the sample period. Withthis process, we treat an acquired and acquiring bank as a single bank in theregressions. Our LBO loan panel data contain 36 banks and 368 bank-yearobservations.
Results from the bank fixed effects models shown in Table III indicate that abank’s activities in CDO underwriting and its LBO lending are related. Model(1) shows that the volume of LBO lending in a given year is positively re-lated to the bank’s CDO underwriting volume in that year at the 10% level ofsignificance. Model (2) shows that this relation also holds if we only considerunderwriting volumes of structured CDOs. In model (3), we use the volume ofa bank’s underwriting in the broader ABS market and find that it is also posi-tively related to its LBO lending in a given year. The coefficient on underwritingactivity is significant at the 5% level or better in both specifications.
We also consider bank lending for investment-grade loans and collect thesedata from Dealscan. If supply from the structured credit market drove LBOlending, we expect that investment-grade lending should be relatively unaf-fected by a bank’s underwriting in structured credit markets because CLOsprimarily purchase leveraged loans. This is exactly what we observe. Columns(4) to (6) present bank fixed effects models and show that a bank’s originationof investment-grade loans is not systematically related to its CDO, structuredCDO, or ABS underwriting.
We also estimate cross-sectional regressions of LBO lending during the 2004to 2008 period using CDO underwriting volumes in the preboom period of1996 to 2003. Model (7) shows that a bank’s LBO lending during the boom ispositively related to its CDO underwriting in the preboom years. Models (8)and (9) display a similar pattern using the volume of a bank’s structured CDOunderwriting and ABS underwriting volumes.
Finally, we estimate similar cross-sectional regressions for investment-gradelending as a control group that should be relatively unaffected by structuredcredit markets. Columns (10) and (11) show that investment-grade lending inthe LBO boom years was unrelated to a bank’s activities in CDO and structuredCDO markets prior to the LBO boom. We find some evidence in model (12) thatinvestment-grade lending is linked to pre-boom ABS underwriting at the 10%level of significance, but the coefficient estimate is about one-third the size forLBO lending.
These results point to a direct connection between the LBO lending policyof a bank and its underwriting activities in the CDO and structured creditmarkets. Since this result holds in a bank fixed effects framework, it cannotbe explained by the possibility of bank-level omitted variables driving both abank’s lending policies and its CDO underwriting. A potential explanation forthis result is that the supply of capital from structured credit investors allowedbanks to finance their leveraged lending. The result cannot be explained by a

1308 The Journal of Finance R©
Tab
leII
IB
ank
-Lev
elR
egre
ssio
ns
ofL
BO
Len
din
gon
CD
OU
nd
erw
riti
ng
Act
ivit
yT
his
tabl
epr
esen
tsre
gres
sion
sof
ban
ks’l
endi
ng
tofu
nd
LB
Os
and
thei
rin
vest
men
t-gr
ade
len
din
gon
thei
rC
DO
un
derw
riti
ng
volu
mes
for
ban
ksth
atse
rved
asle
adar
ran
gers
inL
BO
loan
s.T
he
ban
kpa
nel
cove
rs19
96to
2007
.We
mer
geta
rget
ban
ksin
toac
quir
ing
ban
ksth
rou
ghou
tth
esa
mpl
epe
riod
.Th
ispa
nel
ofba
nks
isu
sed
toru
nth
efo
llow
ing
fixe
def
fect
mod
elfo
rba
nks
’LB
Ole
ndi
ng
and
inve
stm
ent-
grad
ele
ndi
ng,
resp
ecti
vely
:
Ban
kL
end
ing i
t=
K ∑ i=1
αi+
β×
CD
Oit
+γ
′ ×X
it+
δ′ ×
Z t+
ε it.
Th
ede
pen
den
tva
riab
leis
the
log
ofba
nks
’LB
Ole
ndi
ng
inco
lum
ns
(1)t
o(3
).B
ank
i’sL
BO
loan
amou
nt
inye
arti
sca
lcu
late
das
the
sum
ofth
ecr
edit
the
ban
kre
ceiv
edas
ale
adar
ran
ger
inan
yof
the
sam
ple
LB
Olo
ans
arra
nge
din
year
t.L
BO
loan
sar
ecr
edit
sole
lyto
lead
arra
nge
rsan
deq
ual
lydi
s-tr
ibu
ted
toal
llea
dsw
hen
mu
ltip
lele
ads
pres
ent.
Inco
lum
ns
(4)t
o(6
),th
ede
pen
den
tva
riab
leis
the
log
ofin
vest
men
t-gr
ade
loan
sth
eba
nk
arra
nge
din
year
t,w
hic
his
obta
ined
from
Dea
lSca
nle
agu
eta
ble
repo
rts
and
adju
sted
for
mer
gers
.αi
isth
efi
xed
effe
ctfo
rba
nk
i.C
DO
itde
not
esu
nde
rwri
tin
gac
tivi
tyin
the
CD
Oor
broa
der
secu
riti
zed
mar
kets
for
ban
kii
nye
art.
Spe
cifi
call
y,L
og(B
ank
CD
O)i
sth
elo
gari
thm
ofth
eto
tala
mou
nt
ofC
DO
sba
nk
iun
derw
rite
sin
year
t;L
og(B
ank
Str
uct
ure
dC
DO
)exc
lude
sC
DO
sba
cked
byco
rpor
ate
loan
sor
bon
ds;L
og(B
ank
AB
S)i
sth
elo
gari
thm
ofth
eto
talv
ol-
um
eof
AB
Sth
eba
nk
un
derw
rite
sin
year
t.O
ne
isad
ded
toal
lth
ese
mea
sure
sbe
fore
taki
ng
the
log
toav
oid
zero
valu
es.X
itre
fers
toti
me-
vary
ing
ban
kch
arac
teri
stic
s.F
inan
cial
data
for
ban
ksar
eta
ken
from
Com
pust
at’s
Glo
balF
inan
cial
Ser
vice
.Bal
ance
shee
tsof
targ
etba
nks
are
mer
ged
into
acqu
ir-
ing
ban
ksth
rou
ghou
tth
esa
mpl
e.B
ank
Siz
eis
the
loga
rith
mof
the
tota
lass
ets
ofth
eba
nk.
Cap
ital
Rat
iois
tota
lequ
ity
divi
ded
byto
tala
sset
s.D
epos
itis
tota
lcu
stom
erde
posi
tsdi
vide
dby
tota
lass
ets.
Zt
refe
rsto
tim
e-va
ryin
gm
acro
vari
able
s;F
edF
un
ds
Rat
eis
the
ann
ual
aver
age
fede
ralf
un
dsra
te.
Col
um
ns
(7)
to(1
2)re
port
cros
s-se
ctio
nal
regr
essi
ons
ofba
nks
’tot
alL
BO
len
din
gan
din
vest
men
t-gr
ade
len
din
gdu
rin
g20
04to
Jun
e20
08on
thei
rC
DO
un
derw
riti
ng
volu
mes
duri
ng
1996
to20
03u
sin
gth
efo
llow
ing
mod
el:
Ban
kL
endi
ngbo
om,i
=α
+β
×C
DO
pre−
boom
,i+
γ′ ×
Xbo
om,i
+ε i
.
Th
ede
pen
den
tva
riab
leis
the
log
ofth
eto
tal
volu
me
ofL
BO
loan
sa
ban
kar
ran
ged
duri
ng
2004
toJu
ne
2008
inco
lum
ns
(7)
to(9
)an
dis
the
log
ofin
vest
men
t-gr
ade
len
din
gdu
rin
gth
esa
me
peri
odin
colu
mn
s(1
0)to
(12)
.L
og(B
ank
CD
O),
Log
(Ban
kS
tru
ctu
red
CD
O),
and
Log
(Ban
kA
BS
)ar
elo
gof
the
ban
k’s
tota
lu
nde
rwri
tin
gvo
lum
eof
all
CD
Os,
stru
ctu
red
CD
Os
(i.e
.,C
DO
sex
clu
din
gC
LO
san
dC
BO
s),
and
AB
Sdu
rin
g19
96to
2003
.O
bser
vati
ons
wit
hze
role
ndi
ng
duri
ng
the
boom
and
zero
preb
oom
CD
Ou
nde
rwri
tin
gar
eex
clu
ded.
Th
efi
nan
cial
rati
osof
the
ban
ksar
eca
lcu
late
das
the
aver
age
ofth
ean
nu
alra
tios
over
the
boom
peri
odfo
rea
chba
nk.
Abs
olu
teva
lues
oft-
stat
isti
csar
ere
port
edbe
low
coef
fici
ent
esti
mat
es.∗
∗∗,∗
∗ ,an
d∗
indi
cate
sst
atis
tica
lsig
nifi
can
ceat
the
1%,5
%,a
nd
10%
leve
l,re
spec
tive
ly.
(con
tin
ued
)

Did Structured Credit Fuel the LBO Boom? 1309
Tab
leII
I—C
onti
nu
ed
Ban
kF
ixed
-Eff
ect
Reg
ress
ion
sB
ank
Cro
ss-s
ecti
onal
Reg
ress
ion
s
Log
(LB
OL
oan
s)L
og(I
nv.
-Gra
deL
oan
s)L
og(L
BO
Loa
ns)
Log
(In
v.-G
rade
Loa
ns)
(1)
(2)
(3)
(4)
(5)
(6)
(7)
(8)
(9)
(10)
(11)
(12)
Log
(Ban
kC
DO
)0.
140.
100.
390.
121.
88∗
1.47
2.19
∗∗1.
34L
og(B
ank
Str
uct
ure
d0.
220.
080.
430.
13C
DO
)3.
08∗∗
∗1.
292.
35∗∗
1.28
Log
(Ban
kA
BS
)0.
140.
030.
450.
162.
00∗∗
0.46
3.22
∗∗∗
1.90
∗
Ban
kS
ize
1.11
1.06
1.20
1.04
1.07
1.13
1.73
1.51
0.84
1.53
1.51
1.31
4.89
∗∗∗
4.79
∗∗∗
5.62
∗∗∗
5.23
∗∗∗
5.49
∗∗∗
6.05
∗∗∗
1.99
∗1.
690.
952.
58∗∗
2.46
∗∗2.
22∗∗
Cap
ital
Rat
io−1
.26
−1.2
3−1
.32
−0.3
9−0
.39
−0.4
267
.564
.050
.451
.049
.645
.20.
830.
830.
880.
290.
300.
323.
44∗∗
∗3.
39∗∗
∗2.
98∗∗
∗4.
27∗∗
∗4.
16∗∗
∗3.
86∗∗
∗
Dep
osit
2.54
6.09
2.82
23.1
23.2
21.3
−8.0
4−8
.41
−4.5
512
.812
.313
.10.
330.
780.
363.
40∗∗
∗3.
37∗∗
∗3.
13∗∗
∗1.
031.
110.
632.
31∗∗
2.27
∗∗2.
58∗∗
Dep
osit
Squ
ared
−5.0
0−7
.53
−4.9
3−2
1.9
−21.
9−2
0.5
2.54
4.27
0.33
−16.
7−1
5.9
−16.
40.
681.
030.
683.
42∗∗
∗3.
39∗∗
∗3.
19∗∗
∗0.
240.
420.
034
2.22
∗∗2.
16∗∗
2.40
∗∗
Fed
Fu
nd
sR
ate
0.25
0.24
0.26
−0.0
6−0
.07
−0.0
63.
61∗∗
∗3.
51∗∗
∗3.
72∗∗
∗1.
031.
151.
07C
onst
ant
−13.
1−1
3.6
−14.
4−1
1.3
−11.
6−1
1.8
−20.
4−1
7.5
−8.9
0−1
5.8
−15.
4−1
3.0
4.13
∗∗∗
4.31
∗∗∗
4.51
∗∗∗
4.06
∗∗∗
4.18
∗∗∗
4.19
∗∗∗
1.92
∗1.
600.
822.
13∗∗
2.01
∗1.
75∗
Ban
kfi
xed-
effe
cts
Yes
Yes
Yes
Yes
Yes
Yes
Obs
erva
tion
s36
836
836
836
836
836
824
2424
3131
31N
um
ber
ofba
nks
3636
3636
3636
R2
0.14
0.15
0.14
0.15
0.15
0.15
0.76
0.77
0.81
0.78
0.78
0.79
1310 The Journal of Finance R©
reverse causality effect where the demand for LBOs led to greater volumes ofCDO underwriting since it also holds for structured CDOs and ABS, which donot invest in leveraged loans or high-yield bonds. In addition, the finding thata bank’s LBO lending in the boom years is related to its preboom underwritingin structured credit is reassuring in light of the high correlations of manyfinancing and underwriting activities during the boom years. Finally, consistentwith CDOs increasing the supply of capital for higher risk assets, we find thatstructured credit markets have a unique effect on lending in leveraged loanmarkets that is not observed in investment-grade loan markets.
D. Loan-Level Results on Allocation to Institutional Investors
The bank fixed effects results do not rule out the possibility of a time-varyingomitted factor. For example, it is possible that banks pursued riskier strategiesduring the LBO boom, lending more to LBOs and underwriting more CDOs,but that these activities were not directly linked to each other. While we cannotdirectly test for such time-varying omitted factors, we examine how LBO loanswere financed in the syndicated loan market. If the ability to obtain capitalfrom structured credit investors led a bank to extend LBO loans, these loansshould be heavily financed by CLO vehicles when the bank had access to theseinvestors through its underwriting capabilities.
To examine if LBO loans were financed from CLOs, ideally we would trackthe allocation of each loan to CLO vehicles but data do not permit this level ofprecision. However, we are able to identify a closely related measure, namely,the percentage of a loan that is placed with institutional investors, by calcu-lating the size of the institutional tranches of the loan. We expect this variableto reflect the allocation to CLO vehicles because they had become the mostimportant institutional investors during the LBO boom, accounting for 60% ofprimary activity in leveraged loans by 2006 (S&P (2006)).
We calculate the institutional loan allocation of each loan as the sum of theterm loan B, C, and D tranches that were sold to institutional investors andscale it by the amount of the loan. LBO loans in the post-2004 period werefinanced heavily by institutional investors (average of 60% vs. 44% in pre-2004). The term loan B, the most common institutional term loan, accountedfor 47% of LBO loans post-2004, compared to only 24% before.18 In the InternetAppendix, we provide summary statistics on LBO loans and their institutionalallocations.
Results from a Tobit model estimating the fraction of an LBO loan placedin institutional tranches are presented in Table IV. We use the total volumeof CDO underwriting (Total Lender CDO) of the lead banks in the year of theloan origination as an independent variable. To control for loan attributes,
18 The CLO market suffered after the third quarter of 2007 with issuance volume dropping to$34 billion from $48 billion in the prior quarter. As the CLO market declined, the bulk of newleveraged loans were sold to pro rata investors. In the second quarter of 2007, the institutionalallocation averaged 77%, which dropped to 45% in 2008 and to 29% in the first quarter of 2009.

Did Structured Credit Fuel the LBO Boom? 1311
Table IVTobit Regressions of Fraction of Institutional Tranches on Lenders’
CDO Underwriting ActivityThe dependent variable is the percentage of institutional tranches, calculated as all institutionalterm loans over total long-term borrowing amount of the LBO loan. Log(Total Lender CDO) is thelogarithm of the total volume of CDOs underwritten by all lead banks of the loan in the year theLBO deal is announced. Log(Total Lender Structured CDO) excludes alls CLOs and CBOs. LoanAmount is total long-term borrowing amount of the loan. LBO Deal Value is the transaction valueof the LBO deal net of fees and expenses. Loan Maturity is the value-weighted average maturityof all institutional tranches. Target EBITDA is the firm’s operating income over total assets inthe year before the deal. Std. Dev. of Target EBITDA is the standard deviation of Target EBITDAin the 5 years before the deal, and Industry Std. Dev. of EBITDA is the median of the standarddeviation of EBITDA for firms in the same Fama–French 48 industry over 5 years before the deal.Number of Banks is the number of lead banks and Bank Size is the logarithm of the average totalassets of the lead banks. The R2 from a corresponding OLS regression is reported for each model.Absolute values of t-statistics are reported in the second row for each independent variable. ∗∗∗, ∗∗,and ∗ indicates statistical significance at the 1%, 5%, and 10% level, respectively.
Percentage of Institutional Tranches
(1) (2) (3) (4) (5) (6)
Log(Total Lender CDO) 1.79 1.72 1.762.74∗∗∗ 2.73∗∗∗ 2.12∗∗
Log(Total Lender Structured CDO) 1.59 1.62 1.882.33∗∗ 2.46∗∗ 2.23∗∗
Loan Amount/LBO Deal Value −5.45 −2.28 −5.85 −5.32 −2.38 −5.923.02∗∗∗ 1.30 3.32∗∗∗ 2.92∗∗∗ 1.34 3.36∗∗∗
Loan Maturity −0.19 −0.04 −0.24 −0.18 −0.03 −0.241.76∗ 0.42 2.27∗∗ 1.70∗ 0.34 2.24∗∗
Loan Amount/EBITDA 0.55 0.24 0.57 0.52 0.21 0.582.41∗∗ 1.12 2.56∗∗ 2.28∗∗ 1.00 2.57∗∗
Log(LBO Deal Value) 3.94 2.61 3.02 4.07 2.57 3.002.59∗∗ 1.90∗ 1.86∗ 2.64∗∗∗ 1.84∗ 1.86∗
Target EBITDA −0.35 −0.25 −0.17 −0.38 −0.26 −0.191.39 1.08 0.71 1.48 1.12 0.78
Std. Dev. of Target EBITDA 0.66 0.87 0.77 0.66 0.89 0.801.10 1.62 1.31 1.09 1.65 1.37
Industry Std. Dev. of EBITDA 0.87 0.84 1.02 0.83 0.80 1.001.91∗ 2.06∗∗ 2.20∗∗ 1.81∗ 1.97∗ 2.17∗∗
Number of Banks 0.25 −3.05 12.5 0.62 −2.75 12.40.08 1.08 1.90∗ 0.20 0.98 1.88∗
Bank Size −0.14 −1.17 1.59 0.19 −1.03 1.680.08 0.71 0.85 0.11 0.62 0.91
Year dummies No Yes No No Yes NoBank dummies No No Yes No No YesConstant 40.58 26.94 24.5 37.57 30.50 23.6
1.90∗ 1.10 0.97 1.75∗ 1.21 0.94Observations 170 170 170 170 170 170OLS R2 0.32 0.47 0.31 0.32 0.47 0.31

1312 The Journal of Finance R©
we include the amount of the bank loan (relative to deal size and the tar-get’s operating cash flow) and its maturity, measured as the weighted averagematurity of all institutional tranches. The models control for several deal- andbank-specific variables. Deal-specific control variables include the size of theLBO deal measured by transaction value, the target’s operating cash flow, thevolatility of the target’s cash flow over the past 5 years, and the industry’scash flow volatility. Bank-specific controls include the number of lead arrang-ing banks and the size of the banks as measured by their total assets. Wealso estimate specifications with year dummies to alleviate concerns that theresults may be affected by the contemporaneous growth in other institutionalinvestors such as hedge funds during the LBO boom years. We also includebank dummies to control for bank-specific effects.
The results show a strong relation between the lead bank’s CDO underwrit-ing and the fraction of the loan funded through institutional tranches. Models(1) and (2) display a positive correlation between the institutional allocationand the total CDO underwriting volume of the lead banks. The point estimatesimply that a one-standard-deviation increase in the log of the bank’s CDO un-derwriting volume is associated with a 7% higher allocation to institutionaltranches. Model (3) shows that the relation between lead bank CDO under-writing and the fraction of institutional tranches holds with bank fixed effects.In models (4) to (6), we use the total structured CDO underwriting volumeof the lead banks (Total Lender Structured CDO) as an independent variableto alleviate concerns about reverse causality. We obtain similar results. Thus,the lead bank’s activities in structured CDO underwriting are also positivelyrelated to the fraction of the LBO loan allocated to institutional tranches andthe effect is of similar economic magnitude as Total Lender CDO.
Among the control variables, larger LBOs involve a higher proportion of loansfunded through institutional tranches, suggesting that structured credit mar-kets played a more important role for larger LBO transactions. Institutionalallocations are also larger when the LBO target is in an industry with morevariable cash flows, possibly reflecting greater risk appetite of institutional in-vestors such as CLOs than pro rata investors. Overall, the results suggest thata bank’s access to CDO capital through its underwriting activities is associatedwith a larger portion of its loan commitments being financed from CLOs.
E. CDO Access and Contractual Loan Terms
For further evidence linking a bank’s CDO underwriting activities to its LBOlending, we study the contractual terms of LBO loans. If CLOs increased thesupply of credit, we expect that banks with access to this supply through theirunderwriting activities should be able to offer lower spreads, all else equal.Financing LBO loans through CLOs might affect the covenant structure of LBOloans as well. Since banks are less likely to fund the loans from their balancesheet in such transactions, their incentive to monitor is potentially reduced.This may lead to less restrictive loan covenants if banks do not intend to monitorthe firm on an on-going basis. On the other hand, if loans financed through the

Did Structured Credit Fuel the LBO Boom? 1313
CLO channel are riskier, we may observe tighter covenants attached to theseloans to alleviate adverse selection concerns on the part of CLO investors.
E.1. Evidence on Loan Spreads
We use the spread on term loan B tranche to represent the spread on in-stitutional tranches.19 The average institutional spread dropped by almost 70basis points (or 20%), from 340 basis points to 271 basis points, from pre-2004to post-2004. In the Internet Appendix, we report the LBO loan spreads for thetwo subperiods.
We examine the effect of access to CDO capital on institutional spreads byusing the volume of CDO underwriting by the lead bank in the loan origina-tion year as a fraction of the bank’s total assets (Lender CDO Funding). Thisprovides a measure of the relative importance of the lead bank’s funding fromCDO investors versus other sources such as deposits and wholesale funding.We average this ratio across all lead banks when multiple lead arrangers werepresent. Lender CDO Funding averaged 1.1% before 2004 but rose to 1.9% inlater years (see the Internet Appendix), indicating that CDOs as a source offunding grew in importance for banks.
Table V shows that Lender CDO Funding is negatively related to institutionalspreads, implying that the cost of institutional tranches of LBO loans is lowerwhen the lead bank is active in CDO underwriting. Models (1) to (3) find thatthe coefficient on Lender CDO Funding is negative and significant at the 5%level. This effect is robust to the inclusion of GDP Growth, Fed Funds Rate, andPrime Rate as controls that might affect a bank’s lending costs. Differences inthe credit ratings of the loans cannot explain this effect, as shown in model (3).The economic magnitude of Lender CDO Funding is sizable. A one-standard-deviation increase in this measure is estimated to lower institutional spreadsby 17 to 20 basis points. We obtain similar results in model (4), which uses bankfixed effects. Thus, a bank’s access to CDO capital appears to reduce financingcosts for borrowers. A similar pattern is found by Ivashina and Sun (2011), whoshow that demand pressure from institutional investors in the syndicated loanmarket lowered spreads on institutional tranches.
The lower borrowing costs associated with structured lending are consistentwith those observed in loan sales. Parlour and Plantin (2008) develop a modelof loan sales and predict that in an active secondary loan market, firms borrowlarger quantities at lower prices. Guner (2006) shows that loans originated bybanks that engage in more loan sales are priced with lower spreads. In additionto possible supply-side effects, our result that structured credit is associatedwith lower institutional spreads might be attributable to the pricing errorsfor CDO tranches shown by Coval, Jureck, and Stafford (2009a) and Brennan,
19 We use term loan B tranches because other institutional term loans may be junior or havedifferent covenants, and the term loan B is the most common institutional term loan, accountingfor 78% of all institutional tranches after 2004. This measure of institutional spreads is also widelyused in practice.

1314 The Journal of Finance R©
Table VEffect of Lenders’ CDO Funding on Pricing and Covenants of
Institutional Tranches in LBO LoansThis table reports OLS regressions of institutional spreads in the first four models and marginaleffects from probit regressions of the likelihood of having a covenant-lite term loan B tranche in thelast three models. Lender CDO Funding is a bank’s CDO underwriting volume as a percentage of itsassets averaged across lead banks. Loan Maturity is value-weighted average maturity of all termloan B tranches. Log(Loan Amount) is log of the long-term loan amount. Loan Amount/EBITDAis loan amount divided by preannouncement operating income of the target. Target EBITDA ispercentage of operating income to target assets. Std. Dev. of Target EBITDA is standard deviationof Target EBITDA over the 5 years before the deal. Industry Std. Dev. of EBITDA is medianof standard deviation of EBITDA for firms in the same Fama–French 48 industry. Number ofBanks is the number of lead arrangers. Bank Size is log of average total assets of lead banks.GDP Growth is annual seasonally adjusted percentage change in GDP. Fed Funds Rate and PrimeRate are annual rates computed from the average monthly federal funds rate and the bank primerate. Rating dummies indicate if the loan is rated BB, B, or CCC. t-statistics are reported belowcoefficient estimates. ∗∗∗, ∗∗, and ∗ indicates statistical significance at the 1%, 5%, and 10% level,respectively.
Regression on Institutional Spread Probit on Covenant-Lite
(1) (2) (3) (4) (5) (6) (7)
Lender CDO Funding −15.31 −13.99 −16.51 −24.7 0.03 0.02 0.062.45∗∗ 2.28∗∗ 2.08∗∗ 2.17∗∗ 3.46∗∗∗ 3.42∗∗∗ 2.46∗∗
Log(Loan Amount) −14.03 −7.93 18.44 11.4 0.01 0.01 0.030.80 0.45 0.47 0.33 0.93 0.93 0.55
Loan Maturity −0.28 −0.13 −1.02 −0.28 0.00 0.00 0.010.65 0.30 1.45 0.44 2.52∗∗ 2.57∗∗ 1.69∗
Loan Amount/EBITDA −0.91 −0.93 −7.17 −6.61 0.00 0.00 0.010.64 0.66 1.06 1.14 0.51 0.85 0.57
Log(Target Assets) −3.29 −9.88 −28.05 −6.23 −0.01 −0.01 −0.030.20 0.60 0.75 0.19 1.07 0.96 0.47
Target EBITDA −0.49 −0.62 −1.91 −2.48 0.00 0.00 0.000.35 0.46 0.74 1.12 0.14 0.00 0.24
Std. Dev. of Target EBITDA −2.48 −1.83 −0.12 1.43 0.00 0.00 0.000.94 0.70 0.04 0.56 0.95 1.24 0.45
Industry Std. Dev. of EBITDA 2.36 2.01 2.61 4.07 0.00 0.00 0.011.28 1.11 1.14 1.90∗ 2.37∗∗ 2.43∗∗ 2.39∗∗
Number of Banks 8.47 5.52 3.52 17.5 −0.01 −0.01 −0.040.70 0.46 0.26 0.67 0.78 1.20 1.52
Bank Size −16.98 −21.28 −43.96 −33.7 0.05 0.04 0.111.52 1.91∗ 2.57∗∗ 1.54 2.71∗∗∗ 2.79∗∗∗ 2.11∗∗
GDP Growth −17.63 −4.92 6.94 −0.01 −0.021.94∗ 0.42 0.56 0.96 0.65
Fed Funds Rate −775.76 −553.46 −1,110 −0.22 −0.212.38∗∗ 1.39 2.86∗∗∗ 1.22 0.38
Prime Rate 765.16 554.68 1,120 0.22 0.192.36∗∗ 1.39 2.89∗∗∗ 1.20 0.35
Rating dummy No No Yes Yes No No YesBank dummy No No No Yes No No NoConstant 676.07 −1,427.55 −542.03 −2,623
4.63∗∗∗ 1.46 0.45 2.23∗∗
Observations 131 131 99 99 136 136 101R2 0.22 0.27 0.30 0.49
Did Structured Credit Fuel the LBO Boom? 1315
Hein, and Poon (2009). The lower spreads may also reflect a smaller monitor-ing premium charged by banks because banks may invest fewer resources inmonitoring borrowers when they sell the loans to CLOs.
E.2. Evidence on Covenant Structure
To examine the covenant structure of LBO loans, we consider the useof covenant-lite loans, a recent phenomenon in the leveraged loan market.Covenant-lite loans have only incurrence covenants (which are met at the ini-tiation of the loan), but none of the traditional maintenance covenants thatrequire borrowers to maintain financial ratios at prespecified levels on an on-going basis. Hence, covenant-lite loans impose much weaker financial require-ments on borrowers than traditional syndicated bank loans.20 According toS&P’s Leveraged Commentary & Data (LCD) (2007), outstanding covenant-liteloans accounted for less than 1% of leveraged loans before 2005 and increasedto 18% by the first half of 2007.
We identify covenant-lite tranches for each LBO loan using data from S&P’sLCD. In the post-2004 period, 21% of the LBO loans in our sample havecovenant-lite tranches but covenant-lite loans were absent prior to 2004 (seethe Internet Appendix). The last three columns in Table V report the marginaleffects from probit regressions for the probability that a term loan B has acovenant-lite tranche. In all specifications, Lender CDO Funding is associatedwith a higher likelihood that a loan has covenant-lite tranches. A one-standard-deviation increase in Lender CDO Funding is associated with a 5% to 9% in-crease in the probability of the loan being covenant-lite, a substantial effectconsidering that the unconditional probability of a covenant-lite loan is only11%. Among control variables, Bank Size has a significant effect, indicatingthat larger banks were more likely to extend covenant-lite loans.
The weaker covenant protection in CDO-driven loans suggests that loan fi-nancing from structured credit markets was associated with less ongoing mon-itoring. This is in sharp contrast to the more restrictive covenants Drucker andPuri (2008) document for loans sold in the secondary market. This differencein covenant protection highlights a key distinction between structured lendingand loan sales markets. In loan sales, loans are traded among banks and in-stitutions. Since the buyer bears the risk, it has the incentive to monitor theborrower and enforce covenants. Hence, the seller (and originator) of loans hasincentives to design tight covenants at origination to reduce information asym-metry in future sales. However, in the structured lending approach, loans areoriginated to be sold to a diverse set of investors in the CDO market instead ofan individual buyer. These investors, well diversified by holding only a slice of
20 While revolvers may still have a covenant package when the institutional tranche is covenant-lite, the existence of revolver covenants does not imply that the covenants on the institutionaltranche are immaterial. A firm may never draw upon the revolver and sometimes the revolver mayneed to be repaid in the event of a covenant breach. In such cases, the revolver covenants do notprotect the institutional investors.

1316 The Journal of Finance R©
a loan in a bigger collateral pool, lack the incentive and expertise to monitorand enforce contracts. This reduces the originating banks’ incentives to includerestrictive covenants.
Overall, our results highlight changes in the nature of bank lending thatoccurred in the wake of the growth in structured credit markets. As banksswitched from the traditional originate-and-hold to the originate-to-distributemodel, bank lending appears to have been driven more by expertise in under-writing than in their role as information producers. Our results suggest thatthis disintermediation of banks was accompanied by weaker covenants andlower spreads for borrowers.
E.3. Use of Bank Debt in LBO Deals
We now address how lead banks’ access to CDO capital is related to theamount of bank borrowing used to finance individual LBO deals. To do this,we aggregate multiple loans supporting the same deal and measure the totaluse of bank loans for each deal. Two ratios are calculated: bank loan amountover target EBITDA and target EBITDA over estimated interest payments onbank loans. Following Kaplan and Stein (1993), we estimate interest paymentsusing the sum of the 6-month LIBOR as of the effective date of the LBO dealplus the relevant credit spreads. The bank loan ratios are winsorized at the5% level to reduce noise from extreme values, primarily from the much smallerdeals in the sample.
Table VI examines the relation between lead banks’ CDO funding and theuse of bank loans, controlling for characteristics of the LBO targets. Model(1) shows that the loan to EBITDA ratio is positively related to Lender CDOFunding, suggesting that banks that used CDO funding heavily tolerated moreaggressive use of bank loans in LBO financing structure. Model (2) reportssimilar results controlling for year effects, suggesting that this effect is notdriven by time trends. To address reverse causality concerns, we also calculateLender Structured CDO Funding based on banks’ underwriting of structuredCDOs. Model (3) shows that the loan to EBITDA ratio is also positively relatedto this variable. This effect of Lender Structured CDO Funding is robust toinclusion of year dummies, as shown in model (4). Models (5) to (8) reportcomparable regressions using the EBITDA to interest ratio and show that it isnegatively related to our measures of CDO funding by lead banks. The economicmagnitude of the relation is meaningful. For example, model (1) implies that aone-standard-deviation increase in Lender CDO Funding leads to an increasein total bank borrowing equal to 58% of the target’s EBITDA.
Overall, the deal-level analysis suggests that when banks were more con-nected to the CDO investor base through their underwriting efforts, they lentmore aggressively to LBOs. The better access to credit for borrowers is con-sistent with the findings in the loan sales literature. Drucker and Puri (2008)show that loan sales, an alternative channel for banks to reduce their loanexposure, increase credit access for borrowers.

Did Structured Credit Fuel the LBO Boom? 1317
Table VIRegressions of Use of Bank Loans
This table reports the regressions of use of total bank loan financing in LBOs on lead banks’ CDOfunding. Lender CDO Funding is the lead bank’s CDO underwriting volume as a percentage of bankassets, averaged across all lead banks. Lender Structured CDO Funding excludes underwriting ofCLOs and CBOs. Target EBITDA is the target’s operating income scaled by total assets. Market-to-Book is the sum of market equity and total debt divided by total assets. Tangible Asset is calculatedas property, plant, and equipment divided by total assets. Book Leverage is the sum of long-termand short-term debt over total assets. Std. Dev. of Target EBITDA is the standard deviationof Target EBITDA in the 5 years before the deal. Industry EBITDA is the median operatingincome over assets for firms within the same Fama–French 48 industry in the year before theannouncement, and Industry Std. Dev. of EBITDA is the median of the standard deviation ofoperating income relative to assets for firms in the same industry over the 5 years before the deal.Target characteristics are measured in the year before the announcement of the LBO. Absolutevalues of t-statistics are reported in the second row for each independent variable. ∗∗∗, ∗∗, and ∗indicates statistical significance at the 1%, 5%, and 10% level, respectively.
Loan/EBITDA EBITDA/Interest
(1) (2) (3) (4) (5) (6) (7) (8)
Lender CDO Funding 0.49 0.35 −0.35 −0.252.59∗∗ 1.86∗ 2.47∗∗ 1.74∗
Lender Structured CDO 0.56 0.46 −0.47 −0.29Funding 2.02∗∗ 1.70∗ 2.18∗∗ 1.35
Log(Target Asset) −0.26 −0.52 −0.20 −0.50 0.28 0.29 0.25 0.281.67∗ 3.25∗∗∗ 1.29 3.17∗∗∗ 2.44∗∗ 2.47∗∗ 2.21∗∗ 2.40∗∗
Target EBITDA −10.4 −8.00 −10.2 −7.83 8.35 8.59 8.33 8.423.30∗∗∗ 2.60∗∗ 3.22∗∗∗ 2.54∗∗ 3.41∗∗∗ 3.67∗∗∗ 3.39∗∗∗ 3.59∗∗∗
Market-to-Book 1.55 1.04 1.63 1.07 −0.88 −0.50 −0.94 −0.523.88∗∗∗ 2.56∗∗ 4.07∗∗∗ 2.63∗∗∗ 3.00∗∗∗ 1.72∗ 3.20∗∗∗ 1.80∗
Book Leverage 0.18 0.30 0.12 0.30 −0.83 −0.50 −0.79 −0.530.24 0.40 0.16 0.40 1.50 0.91 1.43 0.97
Std. Dev. of Target −10.4 −5.04 −10.2 −4.83 −2.17 −7.03 −2.53 −6.97EBITDA 1.64 0.83 1.59 0.79 0.45 1.52 0.53 1.50
Growth of Sales 0.00 0.00 0.00 0.00 −0.00 −0.00 −0.00 −0.000.25 0.83 0.19 0.78 0.94 0.76 0.86 0.71
Tangible Asset −0.10 −0.09 −0.15 −0.12 −0.23 −0.55 −0.19 −0.530.19 0.18 0.30 0.25 0.61 1.56 0.52 1.50
Industry EBITDA 2.32 4.33 1.76 3.99 −0.81 −0.93 −0.32 −0.550.42 0.84 0.32 0.77 0.21 0.26 0.08 0.15
Industry Std. Dev. of 4.48 10.7 3.36 9.82 −4.36 −5.28 −3.29 −4.65EBITDA 0.54 1.37 0.40 1.26 0.74 0.97 0.56 0.85
Year dummy No Yes No Yes No Yes No YesConstant 6.37 6.67 6.19 6.69 2.32 2.07 2.40 1.95
4.58∗∗∗ 3.31∗∗∗ 4.44∗∗∗ 3.32∗∗∗ 2.27∗∗ 1.28 2.34∗∗ 1.20
Observations 222 222 222 222 184 184 184 184R2 0.12 0.29 0.11 0.29 0.13 0.35 0.13 0.34
IV. Implications for the Nature of LBO Transactions
The evidence suggests that banks’ access to structured credit markets wasassociated with larger bank loans, lower spreads, and weaker covenants. Wenow explore whether structured credit markets were associated with a changein the nature of LBO transactions. To do so, we study the characteristics of LBOtargets, the pricing and financing structure of LBO deals, and measures of expost performance. In the LBO boom of the late 1980s, Kaplan and Stein (1993)document an “overheated” market in which deals were overpriced, riskier, and

1318 The Journal of Finance R©
performed worse postbuyout. Guo, Hotchkiss, and Song (2011) find, however,that more recent deals during 1990 to 2006 were financed conservatively andhad lower premiums than deals in the late 1980s.
A. Target Characteristics
Table VII compares pre-LBO firm characteristics and the pricing of CDO-driven LBO deals (i.e., where the bank is heavily reliant on CDO funding,based on the median of Lender CDO Funding) to non-CDO-driven deals. Forthis comparison, we restrict our sample to deals announced after 2004. Guo,Hotchkiss, and Song (2011) show that LBOs after 2004 had riskier capitalstructures and were priced higher. Hence, restricting the sample to post-2004deals helps control for this temporal variation in deal attributes. In the InternetAppendix, we show that we obtain similar results using our entire sampleperiod.
Panel A shows that CDO-driven LBOs are much larger. The average (me-dian) transaction value for these deals is $4.45 billion ($1.7 billion), comparedto $1.64 billion ($264 million) for non-CDO-driven deals. CDO-driven dealsinvolve much better performing targets, with an average operating cash flowmargin of 15% (median of 13%), compared to 6% (median of 9%) for non-CDO-driven deals. CDO-driven deals are also less likely to be unprofitable companiesand have better growth opportunities, as measured by the market-to-book ra-tio. Prior to the LBO, they have similar leverage to non-CDO-driven deals.
Measures for potential value enhancement in LBOs such as free cash flowand tax payments are higher in CDO-driven deals. The targets in CDO-drivendeals generate, on average, two times (median of one time) more free cash flowthan non-CDO-driven deals. The higher free cash flows in CDO-driven dealssuggest that agency problems between management and shareholders mightbe more severe in these firms (Jensen (1986), Kaplan (1989b)). Therefore, byforcing management to use free cash flow more effectively, LBOs of the CDO-driven deals have the potential for creating more value. Moreover, the CDO-driven targets paid an average of 3.5% (median of 2.7%) of their assets intaxes, compared to an average of 0.6% (median of 0.1%) for non-CDO-drivendeals. The higher tax payments by targets of CDO-driven deals suggest thatthese firms have greater potential for creating value from additional interesttax shields by levering up (Kaplan (1989a), Guo, Hotchkiss, and Song (2011)).CDO-driven deals involve targets that are less risky. All measures of operatingrisk that we examine, including volatility of cash flows, volatility of growth incash flows, and volatility of growth in operating margin are at least 50% higherfor non-CDO-driven deals than for CDO-driven deals. The lower operating riskcharacteristics of CDO-driven deals suggest that they are better candidates forhighly levered transactions.
A concern with the univariate comparisons is that the LBO characteristicsmay simply reflect the much larger size of CDO-funded deals and the largebanks involved in these deals. Accordingly, in the Internet Appendix we reportregressions in which the LBO characteristics are estimated in a multivariate

Did Structured Credit Fuel the LBO Boom? 1319
Table VIIComparison of CDO-Driven Deals to Non-CDO-Driven Deals Post-2004The table compares LBO firm characteristics and pricing for CDO-driven deals and non-CDO-driven deals announced during 2004 to June 2008. CDO-driven (non-CDO-driven) deals are dealsfinanced by lenders with high (low) Lender CDO Funding, that is, above (below) the median of allLBO deals. Transaction value is the total consideration paid by the acquirer, including paymentto holders of common stock, preferred stock, options, warrants, and debts retired, but excludingfees and expenses. All financial ratios are measured in the last year before the deal is announced,and over the 5 years before, for standard deviation or growth measures. Market Equity is thestock price multiplied by the number of shares. Market-to-Book is the sum of Market Equity andtotal debt divided by total assets. EBITDA, CAPEX, and Tax Payment are calculated as operatingincome, capital expenditures, and income taxes over total assets, respectively. Tangible Asset isproperty, plant, and equipment divided by total assets. Cash is cash and short-term investmentsdivided by total assets. Book Leverage is total debt over total assets. Free Cash Flow is (sales −cost of goods − expenses − change in working capital − income taxes − dividend)/total assets. Std.Dev. of EBITDA is the standard deviation of EBITDA in the 5 years before the deal. Std. Dev. ofGrowth in EBITDA is the standard deviation of changes in EBITDA in the 5 years before the deal.Std. Dev. of Growth in Operating Margin is the standard deviation of changes in operating margin,defined as operating income over sales, in the 5 years before the deal. Premium is the premiumof the offered price over the stock price 1 month before the deal. FV/EBITDA is calculated as thetransaction value divided by operating income of the target in the year before the announcementand is missing if EBITDA is negative. EBITDA/FV is operating income divided by transactionvalue. The significance of the difference between the two subsamples is denoted with asterisks.∗∗∗, ∗∗, and ∗ indicates statistical significance at the 1%, 5%, and 10% level, respectively.
Non-CDO-Driven Deals CDO-Driven Deals
N Mean Median N Mean Median
Panel A: Target Firm Characteristics
Transaction Value ($ml) 58 1,642.1 264.0 99 4,454.6∗∗∗ 1,697.0∗∗∗Total Asset ($ml) 52 1,525.3 291.9 96 3,614.3∗∗ 3,197.5∗∗∗Market Equity ($ml) 49 906.5 204.0 94 1,337.0∗∗∗ 1,153.1∗∗∗Negative EBITDA 58 0.14 0 99 0∗∗∗ 0EBITDA 45 0.06 0.09 93 0.15∗∗∗ 0.13∗∗∗Market-to-Book 52 1.05 0.92 96 1.34∗∗∗ 1.20∗∗∗Growth of Asset 57 0.15 0.00 99 0.17 0.10∗∗∗CAPEX 51 0.04 0.03 95 0.05∗∗ 0.04∗Book Leverage 51 0.38 0.43 96 0.36 0.37Free Cash Flow 52 4.3% 4.8% 96 12.7%∗∗ 10.8%∗∗∗Tax Payment 52 0.6% 0.1% 96 3.5%∗∗∗ 2.7%∗∗∗Std. Dev. of EBITDA 52 0.05 0.04 96 0.03∗∗∗ 0.02∗∗Std. Dev. of Growth in EBITDA 49 1.29 0.49 94 0.53∗∗∗ 0.21∗∗∗Std. Dev. of Growth in 49 1.27 0.52 94 0.37∗∗∗ 0.15∗∗∗
Operating Margin
Panel B: LBO Pricing
Premium (%) 52 23.78 20.76 97 24.29 23.41FV/EBITDA 37 10.51 9.24 93 10.99 10.01EBITDA/FV 45 0.10 0.09 93 0.11 0.10

1320 The Journal of Finance R©
framework controlling for deal size and an indicator for large lead banks. Wefind that the differences in target characteristics across CDO and non-CDO-funded deals persist in the multivariate framework.
Thus, inspection of the firm characteristics does not suggest that structuredcredit promoted lower quality LBO transactions. Instead, it appears that thecapital from structured credit markets allowed much larger firms to be takenprivate. It is possible that these firms were suitable or desirable candidatesfor LBOs prior to the LBO boom and that the growth in structured credit cre-ated a mechanism for financing these transactions that overcame the lendingconstraints of banks.
B. LBO Pricing
We measure LBO pricing using Premium, the final offer price over the target’sstock price a month before the announcement, and the transaction multipleFV/EBITDA, the ratio of the transaction value to target EBITDA if EBITDAis positive. If target EBITDA is negative, FV/EBITDA is treated as missing.To include firms with negative EBITDA, we also calculate the inverse of thetransaction multiple, EBITDA/FV, which is monotonic in EBITDA. All threemeasures are winsorized at the 5% level to avoid extreme values, particularlyfrom small deals. Panel B of Table VII shows that LBO pricing is similar forCDO-driven and non-CDO-driven deals. The average premium in CDO-drivendeals is 24.3% (median of 23.4%), compared to 23.8% (median of 20.8%) fornon-CDO-driven deals. In comparison, Guo, Hotchkiss, and Song (2011) doc-ument a higher median premium of 29.2% for LBOs during 1990 and 2006.Using EBITDA/FV, we also find no significant difference in transaction mul-tiples across CDO- and non-CDO-driven LBOs. We also estimate multivariateregressions of LBO pricing that control for a number of target firm characteris-tics along with equity and credit market conditions but do not find meaningfuldifferences in pricing between CDO- and non-CDO-driven deals. In the Inter-net Appendix, we report the multivariate regression results on LBO pricingmetrics. Consistent with Axelson et al. (2010), these regressions show that thehigh-yield spread has a negative effect on LBO pricing.
C. Financing Structure
Even if the targets of CDO-driven deals were suitable LBO candidates, thedeals could be structured with greater financial risk. Table VIII provides thefinancing structure for deals in the post-2004 period,21 where we scale thesources of financing by the total funding need for the LBO. Not surprisingly,total funding needs are much higher for CDO-driven deals given the larger sizeof these deals.22 Consistent with earlier results, CDO-driven deals use moreterm loans as well as more total bank loans.
21 In the Internet Appendix, we report the financing structure for LBOs over our entire sampleperiod.
22 Note that total funding needs are greater than the transaction values reported in TableVII. This occurs because funding needs include deal fees and expenses and because this analy-sis is based on hand-collected data, which are unavailable for some smaller deals. In addition,

Did Structured Credit Fuel the LBO Boom? 1321
Table VIIIFinancing Structure of Post-2004 Deals
This table reports financing structure of the LBO deals after 2004 for which the complete financingstructure can be identified. The information is collected from proxy filings and supplemented withDealScan for bank loans and SDC for junk bonds. CDO-driven (non-CDO-driven) deals are dealsfinanced by lenders with high (low) Lender CDO Funding, that is, above (below) the median ofall LBO deals. Funding need, equity contribution, and asset-backed finance are collected solelyfrom proxy filings. Funding need is the total consideration including fees and expenses. Equitycontribution includes investment from private equity sponsors and pre-LBO equity investors. Thesignificance of the difference between the two subsamples is denoted with asterisks. ∗∗∗ and ∗∗indicates statistical significance at the 1% and 5% level, respectively.
Non-CDO-DrivenDeals CDO-Driven Deals
Mean Median Mean Median
Number of deals 35 89Funding need ($1m) 1,966.36 400 5,183.43∗∗∗ 1,900∗∗∗Bank loan financingRevolver 9.5% 5.0% 13.3% 7.7%∗∗∗Term loan 22.6% 0 38.1%∗∗∗ 36.8%∗∗∗Other bank loan 3.0% 0 3.2% 0
Total bank loan 35.1% 31.4% 54.7%∗∗∗ 50.9%∗∗∗Asset-backed finance 19.1% 0 4.3%∗∗ 0Junk bond/note & mezzanine 9.3% 0 19.3%∗∗∗ 22.2%∗∗∗Equity contribution 41.4% 37.4% 36.1% 31.8%Total financing arranged 104.9% 104.3% 114.4% 107.8%Total noncontingent financing arranged 95.4% 96.9% 101.1% 97.5%
CDO-driven deals also use more junk bonds/notes and mezzanine financ-ing, suggesting that bank loans are not used to substitute for other forms ofdebt.23 The equity contribution is similar across the two types of deals. Eq-uity investors, including pre-LBO shareholders, contribute, on average, 36%of the total funding need for CDO-driven deals and 41% for non-CDO-drivendeals. These equity contributions are higher than that documented by Kaplanand Stein (1993) in the late 1980s, but comparable to the 30.4% equity con-tribution in more recent LBOs studied by Guo, Hotchkiss, and Song (2011).24
When all financing sources are summed up, we find that CDO-driven dealsarranged more financing than needed to complete the deal. On average, CDO-driven deals arranged 14.4% more funding (including bank revolvers) thanneeded to complete the deal while non-CDO-driven deals raised 4.9% additional
Table VIII includes deals with no bank loans but excludes deals for which the equity contributioncannot be identified.
23 The greater use of junk bonds may appear surprising since CBO issuance activity droppedin the post-2004 period. However, banks’ incentives in CBO underwriting were relatively unaf-fected as securitization markets grew since underwriting activities were not subject to capitalrequirements. In contrast, capital considerations were potentially much more important for lend-ing decisions by banks.
24 These results hold in a multivariate framework controlling for LBO deal size and large leadbanks, as shown in the Internet Appendix.

1322 The Journal of Finance R©
funding. Excluding revolvers, CDO-driven deals, on average, arranged justenough funding to complete the deal without requiring a draw on their bankrevolvers, while the non-CDO-driven deals had an average shortfall of 5%,which would require a draw on bank revolvers or use of cash holdings to com-plete the deal.
Overall, we do not find that a bank’s access to structured credit led to riskierfinancing structures in the LBOs it financed as the equity contribution in CDO-and non-CDO-driven deals is similar. Instead, it appears that in CDO-fundeddeals, management teams and financial sponsors arranged more financing thanneeded to complete the deal, possibly to provide more financial flexibility andlower the probability of financial distress following the LBO.
D. Post-LBO Bond Rating Changes
For ex post evidence on the quality of CDO-driven LBOs, we consider thetrajectory of credit ratings following the buyout. To account for overall economictrends, we create a control sample of public firms that did not conduct an LBO.For each LBO firm with an issuer credit rating available from S&P, we startwith all public firms in the same one-digit SIC code and with a credit rating fromS&P in the year of the LBO’s effective date, and include the firms where thepercentage difference in total assets and leverage from the LBO firm is belowthe median difference. From this group, we select the firm that has the closestleverage ratio to the LBO firm at the effective date of LBO. This procedureresults in a time, industry, size, and leverage matched control sample. Boththe LBO and control firm samples have an average post-LBO leverage ratio of0.68 and credit rating of B+.
Table IX reports the changes in credit ratings for LBO firms and matchingfirms up to 3 years following the effective date of the LBO. Panel A shows thatthe average rating change for LBO firms was similar to matching firms forthe first 2 years after the deal, but by the third year credit ratings declinedfor LBO firms more than that for matching firms. By the third year, LBOfirms were downgraded by an average of 1.27 notches while ratings droppedby 0.55 notches for matching firms, with the difference significant at the 10%level. However, this decline in ratings for LBO firms was driven largely bynon-CDO-driven LBO deals. Panel B shows that the post-LBO rating changesfor the CDO-driven deals were similar to their matching firms, suggesting thatthese deals did not perform worse than comparable firms. In contrast, Panel Cshows that credit ratings for non-CDO-driven deals were downgraded by 1.58notches for LBO firms on average, and only by 0.17 for matching firms. Thus,the post-LBO changes in credit ratings do not suggest that the CDO-drivendeals experienced weaker ex post performance than non-CDO-driven deals.
In summary, inspection of target characteristics, deal pricing, financingstructure, and post-LBO bond rating changes does not suggest that the growthin structured credit was associated with an overheated LBO market. This ev-idence is in contrast to Kaplan and Stein’s (1993) findings on the earlier LBOboom of the late 1980s. One explanation is that structured credit allowed muchlarger companies to be taken private than was previously possible and that

Did Structured Credit Fuel the LBO Boom? 1323T
able
IXP
ost-
LB
OC
red
itR
atin
gC
han
ges
Th
ista
ble
repo
rts
the
chan
ges
incr
edit
rati
ngs
afte
rth
eL
BO
for
LB
Ofi
rms
and
mat
chin
gfi
rms
wit
hsi
mil
arch
arac
teri
stic
sas
the
post
-LB
Ofi
rms.
Rat
ing
chan
ges
are
calc
ula
ted
asth
edi
ffer
ence
inn
um
eric
alra
tin
gn
um
bers
assi
gned
tora
tin
gca
tego
ries
(e.g
.,1
isas
sign
edfo
rA
+,2
for
A,3
for
A−,
etc.
).T
he
perc
enta
geof
firm
sex
peri
enci
ng
ado
wn
grad
ein
each
peri
odis
also
repo
rted
.Th
em
atch
ing
firm
sar
ese
lect
edas
foll
ows.
For
each
LB
Ofi
rmw
ith
anis
suer
cred
itra
tin
gav
aila
ble
from
S&
P,w
est
art
wit
hal
lfi
rms
wit
hth
esa
me
one-
digi
tS
ICco
dean
dw
ith
cred
itra
tin
gsin
the
year
ofth
eef
fect
ive
date
.We
then
excl
ude
firm
sw
ith
ape
rcen
tage
diff
eren
cein
tota
las
sets
orle
vera
gefr
omth
epo
st-L
BO
firm
abov
eth
em
edia
nle
vel.
Am
ong
the
rem
ain
ing
firm
s,w
ese
lect
the
firm
wit
hth
ele
vera
gecl
oses
tto
the
post
-LB
Ole
vera
ge.t
-sta
tist
ics
test
ing
wh
eth
erth
eav
erag
era
tin
gch
ange
isdi
ffer
ent
for
the
LB
Osa
mpl
ean
dth
em
atch
ing
sam
ple
are
repo
rted
inth
ela
stco
lum
n.
Rat
ing
chan
ges
for
all
LB
Ofi
rms
and
mat
chin
gfi
rms
are
pres
ente
din
Pan
elA
.Pan
els
Ban
dC
repo
rtth
eco
mpa
riso
nfo
rC
DO
-dri
ven
deal
san
dn
on-C
DO
deal
sal
ong
wit
hth
eir
mat
chin
gfi
rms,
resp
ecti
vely
.C
DO
-dri
ven
(non
-CD
O-d
rive
n)L
BO
firm
sar
efi
nan
ced
byle
nde
rsw
ith
hig
h(l
ow)
Len
der
CD
OF
un
din
g,th
atis
,abo
ve(b
elow
)th
em
edia
nof
allL
BO
deal
s.T
he
sign
ifica
nce
ofth
edi
ffer
ence
betw
een
the
two
subs
ampl
esis
den
oted
wit
has
teri
sks.
∗∗an
d∗
indi
cate
sst
atis
tica
lsi
gnifi
can
ceat
the
5%an
d10
%le
vel,
resp
ecti
vely
.
LB
OF
irm
sM
atch
ing
Fir
ms
t-S
tat
for
Rat
ing
%of
Rat
ing
Rat
ing
NC
han
ges
Dow
ngr
ade
NC
han
ges
Dow
ngr
ade
Ch
ange
s
Pan
elA
:All
LB
OF
irm
san
dT
hei
rM
atch
ing
Fir
ms
Med
ian
rati
ng
wh
enth
eL
BO
deal
isef
fect
ive
141
B+
110
B+
0.54
Rat
ing
chan
gefr
omef
fect
ive
date
to1
year
afte
r13
00.
2012
.3%
101
0.29
20.8
%−0
.55
Rat
ing
chan
gefr
omef
fect
ive
date
to2
year
saf
ter
116
0.67
34.5
%89
0.60
31.5
%0.
33R
atin
gch
ange
from
effe
ctiv
eda
teto
3ye
ars
afte
r75
1.27
45.3
%49
0.55
34.7
%1.
85∗
Pan
elB
:CD
O-D
rive
nL
BO
Fir
ms
and
Th
eir
Mat
chin
gF
irm
s
Med
ian
rati
ng
wh
enth
eL
BO
deal
isef
fect
ive
85B
+71
B+
0.28
Rat
ing
chan
gefr
omef
fect
ive
date
to1
year
afte
r81
0.35
14.8
%68
0.35
22.1
%−0
.04
Rat
ing
chan
gefr
omef
fect
ive
date
to2
year
saf
ter
730.
6834
.2%
600.
6233
.3%
0.26
Rat
ing
chan
gefr
omef
fect
ive
date
to3
year
saf
ter
370.
9540
.5%
250.
9248
.0%
0.05
Pan
elC
:Non
-CD
O-D
rive
nL
BO
Fir
ms
and
Th
eir
Mat
chin
gF
irm
s
Med
ian
rati
ng
wh
enth
eL
BO
deal
isef
fect
ive
56B
+39
B+
1.09
Rat
ing
chan
gefr
omef
fect
ive
date
to1
year
afte
r49
−0.0
48.
2%33
0.15
18.2
%−0
.77
Rat
ing
chan
gefr
omef
fect
ive
date
to2
year
saf
ter
430.
6534
.9%
290.
5527
.6%
0.22
Rat
ing
chan
gefr
omef
fect
ive
date
to3
year
saf
ter
381.
5850
.0%
240.
1720
.8%
2.35
∗∗

1324 The Journal of Finance R©
these firms were desirable LBO candidates that might have previously beendifficult to take private but stood to benefit from LBOs that reduced agencycosts. It is also worth noting that the LBO boom studied by Kaplan and Stein(1993) involved much higher leverage than the recent boom we study, a trendalso shown by Guo, Hotchkiss, and Song (2011) for deals after the 1980s. In con-trast to the evidence from subprime mortgage lending (Mian and Sufi (2009),Keys et al. (2010)), our evidence does not suggest that loan securitization ledto weaker lending standards in corporate lending. Our results are consistent,however, with other recent work showing that securitized corporate loans didnot perform worse (Benmelech, Dlugosz, and Ivashina (2010)).
V. Conclusion
We study how the growth in structured credit markets affected the corporateuse of leverage by examining LBO transactions that rely heavily on debt financ-ing. We argue that developments that led to the growth of structured creditwere associated with increased credit supply that at least partially fueled therecent LBO boom. Our evidence highlights important linkages between struc-tured credit, the dual role of banks in the structured credit markets as loanoriginators and underwriters, and the use of leverage.
Our results demonstrate an important connection between the lending andunderwriting activities of banks in credit markets. We find that banks’ un-derwriting activities in structured credit markets were associated with greateraccess to credit, cheaper credit prices, and looser covenants. We do not find thatstructured credit was associated with worse LBO deals, in contrast to the evi-dence from the junk bond–fueled LBO wave of the late 1980s and more recentevidence from mortgage securitizations. However, our evidence does raise thequestion of whether structured credit investors were adequately compensatedfor their risks given lower spreads, higher leverage, and weaker covenant pro-tection. Thus, it is possible that structured credit was mispriced as suggestedby Coval, Jurek, and Stafford (2009a), perhaps due to biases in the credit rat-ing agency process for structured credit instruments (Brennan, Hein, and Poon(2009), Griffin and Tang (2010)).
We are not suggesting that structured credit markets were the only devel-opment fueling the LBO boom of 2004 to 2009. Firms during this period hadlarge cash balances and many generated sizeable cash flows, factors prone tocreate agency conflicts. Recent work such as Brav et al. (2008) documents theemergence of activist hedge funds that sought to correct some of these agencyconflicts. Financial sponsors raised record levels of capital and employed trans-action structures such as club deals (Boone and Mulherin (2009), Officer, Ozbas,and Sensoy (2010)), allowing them to pursue very large LBO deals. However,our results point to an important role of structured credit markets that wasassociated with easing the availability and pricing of bank credit, thereby af-fecting the LBO market and potentially other forms of leveraged activities.
Our results also offer a potential explanation for a puzzling aspect of therecent financial crisis—why did large commercial banks invest heavily inCDO tranches that later proved to be a source of massive asset write-downs?

Did Structured Credit Fuel the LBO Boom? 1325
Our findings suggest that the underwriting activities of commercial banks instructured credit markets might be part of the answer. Banks appear to haveoriginated large LBO loans with the intent of selling them to structured creditvehicles. Regulatory initiatives toward risk-based capital management mighthave allowed them to pursue these activities in a manner that was friendlyto their capital requirements. Further analysis of this possible explanationappears to be a useful area for future research.
Appendix: Glossary
Collateralized debt obligations (CDOs): The notes issued by a specialpurpose vehicle (SPV), which are collateralized by a portfolio of assetsacquired by the SPV. Notes issued are structured into different tranches,reflecting different seniority in claiming the cash flows from the collat-eral pool of the SPV.
CDO vehicle: The SPV set up to issue CDOs is often referred to as the CDOvehicle. The issued notes represent the liabilities of the CDO vehiclewhile the securities or assets it acquires to back the notes are its assets.
Collateralized loan obligations (CLOs): CDOs backed by a portfolio ofcorporate loans. These loans typically have speculative-grade credit rat-ings.
Collateralized bond obligations (CBOs): CDOs backed by a portfolio ofbonds.
Structured product CDOs: CDOs backed by a portfolio of structuredproducts, including mortgage-backed securities, asset-backed securities,other CDOs, etc.
Balance sheet CDOs: CDOs issued for the purpose of removing existingassets (or the risk of assets) from the balance sheet of the seller.
Arbitrage CDOs: CDOs created in an attempt to capture a mismatch be-tween the yield of CDO collateral and the financing cost of CDO tranches.In arbitrage CDOs, issuers typically do not have the underlying assetsand need to purchase them in the marketplace.
CDO tranches: The liabilities of CDO vehicles are divided into trancheswith differing levels of seniority and hence risk. Equity tranches ab-sorb the first loss, followed by mezzanine tranches, and then, senior(and in some cases, super senior) tranches.
Leveraged loan: A bank loan issued to a borrower with speculative-graderatings, also referred to as a high-yield loan.
Syndicated loan: A loan funded by a group of lenders. A syndicated loan istypically structured, arranged, and administrated by one or several com-mercial or investment banks, known as the lead arranger. The lead ar-rangers are responsible for negotiating terms with the borrowers, raisingthe fund from syndicate members, and administrating the loan contract.Large syndicated loans are commonly structured in multiple tranches,which may include revolvers, term loan A, term loan B, and other termloans.

1326 The Journal of Finance R©
Term loan A: A type of installment loan that allows a borrower to draw onthe loan during a short commitment period and then pay it back witha progressive repayment schedule. It is also referred to as an amortiz-ing term loan and typically allocated to commercial banks along withrevolvers as part of a larger syndication.
Institutional tranche (Term loan B, C, D, etc.): Term loan tranchescarved out for nonbank institutional investors in a larger syndication.Term loan B is the most commonly used institutional term loan. A largesyndicate loan may have term loans C, D, E, F, or H. Compared to a termloan A, which is commonly allocated to pro rata investors, institutionalterm loans have longer maturity and a back end–loaded repaymentschedule. The institutional investors are typically CLO vehicles, primefunds, hedge funds, and insurance companies.
Pro rata tranche: Includes revolvers and term loan A. These tranches arecommonly funded by banks and finance companies, which are referredto as pro rata investors in the syndicated loan market.
Pro rata spread: The drawn spread for pro rata tranches in a syndicatedloan.
Institutional spread: The credit spread on institutional term loans. Sinceterm loan B is the most common institutional tranche, the spread onterm loan B is widely used as the institutional spread. Because of theback end-loaded repayment schedule in institutional tranches, insti-tutional spreads are usually higher than the spread on the pro ratatranches in the same loan.
Covenant-lite loans: Loans with only incurrence covenants (which are metat the initiation of the loan) but none of the traditional maintenancecovenants that require borrowers to maintain financial ratios at pre-specified levels at the end of every quarter.
REFERENCESAcharya, Viral, and Tim Johnson, 2010, More insiders, more insider trading: Evidence from private
equity buyouts, Journal of Financial Economics 98, 500–523.Axelson, Ulf, Tim Jenkinson, Per Stromberg, and Michael S. Weisbach, 2010, Borrow cheap, buy
high? The determinants of leverage and pricing in buyouts, Working paper, Ohio State Uni-versity.
Barclays, 2002, The Barclays Capital Guide to Cash Flow Collateralized Debt Obligations (Bar-clays, London).
Becker, Bo, and Victoria Ivashina, 2010, Cyclicality of credit supply: Firm-level evidence, Workingpaper, Harvard University.
Benmelech, Efraim, and Jennifer Dlugosz, 2009, The alchemy of CDO credit ratings, Journal ofMonetary Economics 56, 617–634.
Benmelech, Efraim, Jennifer Dlugosz, and Victoria Ivashina, 2010, Securitization without adverseselection: The case of CLOs, Working paper, Harvard University.
Boone, Audra L., and J. Harold Mulherin, 2009, Do private equity consortiums impede takeovercompetition? Working paper, University of Georgia.
Brav, Alon, Wei Jiang, Frank Partnoy, and Randall Thomas, 2008, Hedge fund ac-tivism, corporate governance, and firm performance, Journal of Finance 63, 1729–1775.

Did Structured Credit Fuel the LBO Boom? 1327
Brennan, Michael J., Julia Hein, and Ser-Huang Poon, 2009, Tranching and rating, EuropeanFinancial Management 15, 891–922.
Brunnermeier, Markus, 2009, Deciphering the liquidity and credit crunch of 2007–2008, Journalof Economic Perspectives 23, 77–100.
Citi Credit Research, 2007, Global structured credit strategy (Citigroup, New York, NY).Coval, Joshua D., Jakub W. Jurek, and Erik Stafford, 2009a, Economic catastrophe bonds, Ameri-
can Economic Review 99, 628–666.Coval, Joshua D., Jakub W. Jurek, and Erik Stafford, 2009b, The economics of structured finance,
Journal of Economic Perspectives 23, 3–25.Demiroglu, Cem, and Christopher James, 2010, The role of private equity group reputation in LBO
financing, Journal of Financial Economics 96, 306–330.Drucker, Steven, and Manju Puri, 2008, On loan sales, loan contracting, and lending relationships,
Review of Financial Studies 14, 263–294.Faulkender, Michael, and Mitchell A. Petersen, 2006, Does the source of capital affect capital
structure? Review of Financial Studies 19, 45–79.Fitch Ratings, 2007, Inside the ratings: What credit ratings mean (Fitch Group, New York, NY).Griffin, John, and Dragon Tang, 2010, Did subjectivity play a role in CDO credit ratings? Working
paper, University of Texas at Austin.Guner, Burak A., 2006, Loan sales and the cost of corporate borrowing, Review of Financial Studies
19, 687–715.Guo, Shourun, Edith S. Hotchkiss, and Weihong Song, 2011, Do buyouts (still) create value?
Journal of Finance 66, 479–517.Ivashina, Victoria, and Anna Kovner, 2011, The private equity advantage: Leveraged buyout firms
and relationship banking, Review of Financial Studies, doi:10.1093/rfs/hhr024.Ivashina, Victoria, and Zheng Sun, 2011, Institutional demand pressure and the cost of corporate
loans, Journal of Financial Economics 99, 500–522.JP Morgan, 2007, 2008 US fixed income outlook (JP Morgan, New York, NY).Jensen, Michael C., 1986, Agency costs of free cash flows, corporate finance and takeovers, Ameri-
can Economic Review 76, 323–329.Kaplan, Steven N., 1989a, Management buyouts: Evidence on taxes as a source of value, Journal
of Finance 44, 611–632.Kaplan, Steven N., 1989b, The effects of management buyouts on operating performance and value,
Journal of Financial Economics 24, 217–254.Kaplan, Steven N., and Jeremy C. Stein, 1993, The evolution of buyout pricing and financial
structure in the 1980s, Quarterly Journal of Economics 108, 313–357.Kaplan, Steven N., and Per Stromberg, 2009, Leveraged buyouts and private equity, Journal of
Economic Perspectives 23, 121–146.Keys, Benjamin, Tanmoy Mukherjee, Amit Seru, and Vikrant Vig, 2010, Did securitization lead to
lax screening? Evidence from subprime loans, Quarterly Journal of Economics 125, 307–362.Leary, Mark T., 2009, Bank loan supply, lender choice, and corporate capital structure, Journal of
Finance 64, 1143–1185.Lemmon, Michael, and Michael Roberts, 2010, The response of corporate financing and investment
to changes in the supply of credit, Journal of Financial and Quantitative Analysis 45, 555–587.Leveraged Commentary & Data (LCD), 2007, LCD LoanStats Weekly, September 27.Loutskina, Elena, and Philip E. Strahan, 2009, Securitization and the declining impact of bank
finance on loan supply: Evidence from mortgage originations, Journal of Finance 64, 861–889.
Metrick, Andrew, and Ayoko Yasuda, 2010, The economics of private equity funds, Review ofFinancial Studies 23, 2303–2341.
Mian, Atif, and Amir Sufi, 2009, The consequences of mortgage credit expansion: Evidence fromthe U.S. mortgage default crisis, Quarterly Journal of Economics 124, 1449–1496.
Modigliani, Franco, and Merton Miller, 1958, The cost of capital, corporate finance, and the theoryof investment, American Economic Review 48, 261–297.
Nini, Greg, 2008, How non-banks increased the supply of bank loans: Evidence from institutionalterm loans, Working paper, University of Pennsylvania.

1328 The Journal of Finance R©
Officer, Micah S., Oguzhan Ozbas, and Berk A. Sensoy, 2010, Club deals in leveraged buyouts,Journal of Financial Economics 98, 214–240.
Parlour, Christine A., and Guillaume Plantin, 2008, Loan sales and relationship banking, Journalof Finance 63, 1291–1314.
Standard & Poor’s (S&P), 2006, A guide to the loan market (New York, NY).Sufi, Amir, 2007, Information asymmetry and financing arrangements: Evidence from syndicated
loans, Journal of Finance 62, 629–668.Sufi, Amir, 2009, The real effects of debt certification: Evidence from the introduction of bank loan
ratings, Review of Financial Studies 22, 1659–1691.