diatom composition and fluxes over the northwind ridge
TRANSCRIPT

HAL Id: insu-02862758https://hal-insu.archives-ouvertes.fr/insu-02862758
Submitted on 9 Jun 2020
HAL is a multi-disciplinary open accessarchive for the deposit and dissemination of sci-entific research documents, whether they are pub-lished or not. The documents may come fromteaching and research institutions in France orabroad, or from public or private research centers.
L’archive ouverte pluridisciplinaire HAL, estdestinée au dépôt et à la diffusion de documentsscientifiques de niveau recherche, publiés ou non,émanant des établissements d’enseignement et derecherche français ou étrangers, des laboratoirespublics ou privés.
Diatom composition and fluxes over the NorthwindRidge, western Arctic Ocean: impact of marine surface
circulation and sea ice distributionJian Ren, Jianfang Chen, Youcheng Bai, Marie-Alexandrine Sicre, Zhixiong
Yao, Long Lin, Jingjing Zhang, Hongliang Li, Bin Wu, Haiyan Jin, et al.
To cite this version:Jian Ren, Jianfang Chen, Youcheng Bai, Marie-Alexandrine Sicre, Zhixiong Yao, et al.. Diatomcomposition and fluxes over the Northwind Ridge, western Arctic Ocean: impact of marine sur-face circulation and sea ice distribution. Progress in Oceanography, Elsevier, 2020, pp.102377.�10.1016/j.pocean.2020.102377�. �insu-02862758�
1
Diatom composition and fluxes over the Northwind Ridge, western 1 Arctic Ocean: impact of marine surface circulation and sea ice 2 distribution 3 4 5 Jian Rena, b, Jianfang Chena, b, c*, Youcheng Baia, b, Marie-Alexandrine Sicred, 6 Zhixiong Yaob, c, Long Linb, c, Jingjing Zhanga, b, Hongliang Lia, b, Bin Wua, b, 7 Haiyan Jina, b, c, Zhongqiang Jia, b, Yanpei Zhuanga, b, Yangjie Lia, b 8 9 10 a Key Laboratory of Marine Ecosystem Dynamics, Ministry of Natural Resources, Hangzhou 11 310012, China 12 13 b Second Institute of Oceanography, Ministry of Natural Resources, Hangzhou 310012, China 14 15 c State Key Laboratory of Satellite Ocean Environment Dynamics, Second Institute of 16 Oceanography, Ministry of Natural Resources, Hangzhou 310012, China 17 18 d Sorbonne Université, Pierre et Marie Curie -CNRS-, LOCEAN Laboratory, 4 place Jussieu, 19 F-75005 Paris, France 20 21 22 23 24 25 * Corresponding author. E-mail: [email protected] (Jianfang Chen) 26 27 28 29 30 31 32 33 34 35 36 37 38 39 40 41 42 43 44 45 46
2
Abstract 47 48
Over the last decades the western Arctic Ocean has undergone unprecedented 49
environmental changes. However, long-term marine phytoplankton in situ observations are still 50
rare and therefore insufficient to fully characterize evolutionary trends. This study investigate 51
diatom flux and composition in sediment trap material collected in the Northwind Ridge, 52
western Arctic Ocean from August 2008 to September 2009. Our data show that Chaetoceros 53
resting spores are the predominant species accounting for >40% of the diatom composition. 54
The sea ice diatom group, which includes Fossula arctica, Fragilariopsis cylindrus and F. 55
oceanica, dominates the rest of the assemblage throughout the observation period. While the 56
diatom fluxes in winter are extremely low, higher values are found in summer, with summer 57
2009 flux values being twice as high as in 2008. High total mass and diatom fluxes in summer 58
2009 are attributed to the intertwined effect of a weakened Beaufort Gyre, strengthened Pacific 59
Water Inflow (PWI) and distribution pattern of the sea ice. Enhanced values of coastal diatoms 60
and terrigenous proxies in summer 2009 are in agreement with intensified PWI. Sea ice diatoms 61
and sea ice biomarker IP25 fluxes are both high during the sea ice melting season and 62
significantly correlated (r2 = 0.64, p < 0.01). Our data also suggest that sea ice diatoms are 63
prone to selective dissolution in the water column and sediments, implying biases on diatom 64
assemblages and subsequently on paleoceanographic reconstructions. 65
66 67 68 69 70 71 72 73 74 75 76 77 78 Key words: Diatoms, Sediment trap, Chukchi Sea, Northwind Ridge, Sea ice, Pacific water 79 inflow, Beaufort Gyre 80
3
1. Introduction 81
Over the past decades, the Arctic Ocean has undergone unprecedented environmental 82
changes with drastic impacts on the terrestrial (Post et al., 2013) and marine ecosystems (Carroll 83
and Carroll, 2003; Grebmeier et al., 2006, 2012; Arrigo et al., 2008; Wassmann, 2011; 84
Wassmann et al., 2011). Among other factors, the decline of sea ice has been shown to affect 85
marine phytoplankton production and distribution patterns (e.g. Arrigo et al., 2008; McLaughlin 86
et al., 2011; Coupel et al., 2012; Arrigo and van Dijken, 2015; Renaut et al., 2018). Blooms in 87
autumn are now reported during the prolonged ice-free period in the Arctic (Ardyna et al., 2014) 88
as well as significant changes in phytoplankton community due to enhanced freshening caused 89
by global warming (Li et al., 2009; He et al., 2012; Coupel et al., 2015; Zhuang et al., 2018; 90
Lee et al., 2019). 91
The highly productive Chukchi Sea in the western Arctic has experienced rapid sea ice 92
retreat (Comiso, 2012; Serreze et al., 2016) leading to increased primary production and 93
enhanced biological carbon uptake (Harada, 2016). The strengthening of the Pacific Water 94
Inflow (PWI) bringing nutrients into the Chukchi Sea during the last decade (Woodgate et al., 95
2012; Woodgate, 2018) is another factor that may have altered the phytoplankton structure 96
(Zhuang et al., 2016). The Chukchi Sea is thus a critical region for understanding oceanographic 97
on-going and future changes in the Arctic Ocean and their consequences on polar ecosystems. 98
Apart from flagellates, diatoms appear to dominate the phytoplankton and bottom sea ice 99
community in the Chukchi Sea (Booth and Horner, 1997; Sukhanova et al., 2009; Poulin et al., 100
2011; Joo et al., 2012). Because of diatom sensitivity to environment changes, their composition, 101
abundance, distribution as well as size have been used as indicators of marine environmental 102
conditions (Zernova et al., 2000; Smol and Stoermer, 2010; Romero and Armand, 2010). For 103
instance, recent studies speculated that the occurrence of the endemic North Pacific diatom 104
Neodenticula seminae in the North Atlantic might reflect stronger PWI driven by sea ice loss 105
(Reid et al., 2007; Poulin et al., 2010; Bluhm et al., 2011). Better understanding of the 106
relationship between diatoms and environmental variables today is also essential to produce 107
robust paleoceanographic reconstructions based on fossil diatoms in Arctic sediments (e.g. Ren 108
et al., 2009; Sha et al., 2016, 2017; Miettinen, 2018). Paleo-records are still very sparse in the 109
western Arctic in part because of our poor knowledge of modern diatom ecology and the 110
complex deposition pathways in this environment. 111
Sediment traps have been extensively deployed throughout the world ocean to study 112
biological processes and carbon export (Romero and Armand, 2010). In the Arctic, sediment 113
trap deployments have focused on the continental shelves and slopes (e.g. Wassmann et al., 114
2004 and references therein; O’Brien et al, 2006, 2011; Fahl and Nöthig, 2007; Forest et al., 115

4
2007, 2008, 2011; Lalande et al., 2009; Fahl and Stein, 2012) as well as the deep basins (Honjo 116
et al., 2010; Hwang et al., 2015; Lalande et al., 2019). Few studies have been undertaken in the 117
Chukchi Sea. Analyses of the ice-tethered sediment traps over the Chukchi Rise revealed the 118
heterogeneous patterns of biological processes and variety of particulate organic carbon sources 119
(Honjo et al., 2010). Recent studies of the first multi-years mooring observations in the 120
Northwind Abyssal Plain have documented seasonal variations of phyto- and zooplankton 121
(Matsuno et al., 2014; Ikenoue et al., 2015; Onodera et al., 2015, 2016; Tokuhiro et al., 2019) 122
and also evidenced early winter high flux induced by cold eddies from the shelf-break 123
(Watanabe et al., 2014, 2015). 124
In this study, we report on seasonal variations of diatom vertical flux obtained from the 125
sediment trap mooring deployed over the Northwind Ridge, Chukchi Borderland from August 126
2008 to September 2009 as part of the Chinese National Arctic Research Expedition 127
(CHINARE) program. These data are compared to the biomarker data of Bai et al. (2019) 128
measured in the same samples and discussed in light of the overlying water mass characteristics, 129
sea ice concentrations and atmospheric circulation in the western Arctic Ocean. 130
2. Oceanographic settings 131
Station DM is located at the southern Northwind Ridge, a steep ledge extending from the 132
shallow Chukchi Shelf into the Arctic deep basin as a part of the Chukchi Borderland (Fig. 1). 133
The surface hydrology of the region is influenced by the dynamic Beaufort Gyre (BG) 134
circulation, the PWI entering the Arctic Ocean through the Bering Strait and the seasonal sea 135
ice coverage. 136
The anticyclonic BG circulation is driven by the Beaufort High (Proshutinksy and Johnson, 137
1997). Over the last two decades, the stronger BG circulation has resulted in enhanced 138
freshening in the Canadian Basin (Giles et al., 2012) with significant impact on the 139
phytoplankton productivity and polar ecosystem (He et al., 2012; Coupel et al., 2015). 140
The PWI is primarily driven by a sea level difference between the Bering and Chukchi Seas 141
(Coachman and Aagaard, 1966), leading to an average northward water transport of ~0.8 Sv 142
(Roach et al., 1995). The PWI splits into three water masses in the Chukchi Sea, i.e. the saline 143
and nutrient-rich Anadyr Water (AW) as the western branch, the fresher and nutrient-depleted 144
Alaska Coastal Water (ACW) to the East, and in between the Bering Shelf Water (BSW) of 145
intermediate salinity (Fig. 1; Woodgate et al., 2005a; Grebmeier et al., 2006). In the past two 146
decades, long-term mooring observations in the Bering Strait have shown a gradual increase of 147
the PWI volume transport (~70% from 2001 to 2014; Woodgate et al., 2012; Woodgate, 2018), 148
entraining more heat and nutrients into the Arctic Ocean. In the western Chukchi Sea, the 149
fresher Siberian Coastal Current (SCC) periodically interacts with the AW. 150
5
Sea ice occurs in the study area from November to July while it reaches a minimum over 151
the northern Chukchi Sea in September (Fig. 1). Several studies have shown that sea ice 152
reduction induced by PWI impacts on marine ecosystem (e.g. Shimada et al., 2006; Harada, 153
2016; Serreze et al., 2016). It has also been hypothesized that sea ice motion is also correlated, 154
at least partially, with the Arctic Oscillation (AO) (Rigor et al, 2002; Shimada et al., 2006). 155
3. Material and methods 156
3.1 Sediment trap samples 157
A one year-round mooring was deployed at Station DM (DM hereafter) on the southern 158
Northwind Ridge, in the vicinity of the Canada Basin, from August 2008 to September 2009 159
(Fig. 1; 74°24.0’ N, 158°14.0’ W, 1650 m water depth). This conical sediment trap (McLane 160
PARFLUX Mark 78H-21) was equipped with 21 sampling cups and installed at ~870 m water 161
depth. Samples were generally collected every two weeks (15 or 16 days, depending on the 162
month) during the diatom production season (July to November) while during the low flux 163
period in winter (December to June) sampling intervals were longer (28 to 31 days, depending 164
on the month; Bai et al., 2019). The 21 sampling cups were filled with artificial seawater 165
(salinity≈35) and antiseptic HgCl2 to preserve trap material from degradation. 166
After recovery, the wet samples were sieved using a 1-mm mesh nylon sieve to remove 167
swimmers. The fine fractions (<1 mm) were split into aliquots with a McLane wet sample 168
divider (WSD-10). An aliquot (1/4 or 1/8) was filtered on a polycarbonate filter (0.45 μm pore 169
size, 47 mm diameter) for diatom and biochemical analyses. Samples were then dried in an 170
oven at 45 °C for 72 h (Bai et al., 2019). 171
3.2 Diatom preparation and analysis 172
Quantitative diatom slides were prepared according to the standard method developed at 173
the Alfred Wegener Institute, Germany (Gersonde and Zielinski, 2000). For each cup, 30 mg or 174
15 mg sub-sample was used. Although only 1 mg was available for cup 14# (May 2009), the 175
sample was analyzed to keep the entire record intact. The subsamples were then treated with 176
HCl (~36% w/w concentration) and H2O2 (~30% w/w concentration) to remove calcareous and 177
organic material. After rinsing, a known aliquot of the residue was evenly dropped on a cover 178
glass (24 mm × 24 mm). Permanent slides were mounted with Naphrax for diatom identification 179
( ~1.7; Fleming, 1954). 180
Around 400 diatom valves (max. 604.5, min. 372) were counted for each sample with a 181
Motic BA400E microscope at ×1000 magnification. For cup 14# only 215 diatom valves could 182
be counted. Diatom valves were counted according to the method of Schrader and Gersonde 183
(1978). Diatoms were identified to species level following Medlin and Priddle (1990), Hasle 184

6
and Syvertsen (1997), Suto et al. (2004), Katsuki et al. (2009), Obrezkova et al. (2014) and 185
Tsoy and Obrezkova (2017). Because resting spores of genus Chaetoceros can hardly be 186
identified at a species level by light microscopy, they were combined and labeled as 187
Chaetoceros resting spores (RS). 188
The diatom counts were converted into relative abundances with respect to the total diatom 189
assemblage. The diatom concentration (valves per gram dry sample) was estimated using the 190
following formula (Esper et al., 2010): 191
1⁄ ⁄ ⁄ ⁄ (1) 192
in which, dw is the dried sample weight in milligrams, csa is the area of the cover slide (576 193
mm2), ta is the area of one counted traverse (6 mm2), sv is the volume of processed diatom 194
suspension (6-15 ml), split is the volume of aliquot dropped onto the cover slide (from 27 to 81 195
×10-2 ml), vn is the total counted diatom valves and the tn is the number of fully counted 196
traverses. 197
The diatom fluxes were calculated by the following equation: 198
199
(2) 200
where the diatom concentration is derived from equation (1). 201
Diatom taxonomic diversity was evaluated by the H-index based on the Shannon-Weaver 202
formula (Shannon and Weaver, 1949): 203
Σ log (3) 204
where H is the diversity index and Pi is the relative abundance of species i. 205
3.3 Biomarker analysis 206
The concentrations of IP25 and brassicasterol (24-methylcholesta-5,22E-dien-3β-ol) 207
published by Bai et al. (2019) are used for comparison with our diatoms fluxes to discuss sea 208
ice conditions. Campesterol (24-methylcholest-5-en-β-ol) and 24-ethylcholest-5-en-3β-ol are 209
also used to assess higher plant inputs. All sterols were silylated with 100 μL BSTFA (bis-210
trimethylsilyl-trifluoroacet-amide) (80 °C, 1 h) prior to the gas chromatography (GC) analysis. 211
The GC analyses were carried out on a Varian 3300 with a septum programmable injector and 212
a flame ionization detector (Bai et al., 2019). 213
3.4 Carbonate and lithogenic matter 214
The CaCO3 content of sinking material was calculated from particulate inorganic carbon 215
(PIC) values determined by the difference between total carbon (TC) and particulate organic 216
7
carbon (POC; Bai et al., 2019). The lithogenic matter (LM) was estimated as the difference 217
between the total mass (TM; from Bai et al., 2019) and the biogenic material composed of 218
CaCO3, opal (Wu et al., unpublished data) and organic matter (OM) that conventionally convert 219
from POC by a factor of 1.8 (Müller et al., 1986): 220
) (4) 221
The lithogenic matter percentage was then calculated by the following equation: 222
% / (5) 223
3.5 Environmental data 224
Daily environmental data over the study period at DM, including shortwave radiation, snow 225
thickness, sea ice cover and sea ice thickness, were from the National Centers for 226
Environmental Prediction (NCEP)/Climate Forecast System Reanalysis (CFSR) 6-hourly 227
dataset (Saha et al., 2010, 2014). 228
Monthly Pacific inflow data, e.g. volume transport, temperature and salinity, were acquired 229
from the “Bering Strait: Pacific Gateway to the Arctic” project (Woodgate et al., 2015; 230
Woodgate, 2018). 231
Regional sea ice concentrations were from Nimbus-7 SMMR and DMSP SSM/I-SSMIS 232
Passive Microwave Data with a grid resolution of 25 × 25 km (Cavalieri et al., 1996). 233
Summer (July, August, September) monthly averaged sea surface chlorophyll-a 234
concentrations for a 2° × 2° area around DM were retrieved from the Moderate Resolution 235
Imaging Spectroradiometer (MODIS) with a 4 × 4 km resolution and calculated by algorithm 236
of Gohin et al (2002) collected by GlobColour data (http://globcolour.info). 237
4. Results 238
4.1 Environmental conditions 239
Station DM experiences polar night from November to mid-February and receives 240
maximum solar irradiance of ~369 W m-2 in summer, from mi-April to mid-July (Fig. 2a). 241
Seasonal sea ice was present from late October 2008 to mid-August 2009. The ice-free season 242
(sea ice concentration <15%) is approximately one month longer in 2008 than in 2009 (mid-243
July to late October vs. mid-August to early October, respectively; Fig. 2b). Winter sea ice 244
thickness over the station is 2.19 m on average with a maximum thickness of 2.79 m recorded 245
in March 2009 (Fig. 2c). Similarly, snow on ice appears in mid-October 2008 and nearly has 246
thawed out early June 2009 (Fig. 2d). The snow accumulation is over 25 cm in winter. 247
4.2 Total mass flux 248

8
The seasonal pattern of the total mass fluxes (TMF) earlier described by Bai et al. (2019), 249
show higher values in August and September, both in 2008 and 2009 (Fig. 2e). However, the 250
TMF in September 2009 is ca. eightfold larger than in 2008. Particulate organic carbon (POC) 251
fluxes exhibit similar fluctuations as TMF, with extremely low values in winter and early spring, 252
from November 2008 to June 2009 (Fig. 2f). One exception to this is the POC flux value of 253
3.51 mg m-2 d-1 in April 2009, representing approximately 12% of the TMF as compared to an 254
annual mean value of 4% (Bai et al., 2019). 255
4.3 Lithogenic matter flux 256
In few samples, the PIC content is negative as a result of POC values exceeding the TC 257
values (PIC = TC - POC). These numbers reflect the very low PIC content of these samples 258
(<1%), and uncertainties on TC and POC measurements. Thus the CaCO3 contents based on 259
these PIC values became negative. In general, CaCO3 is less than 10% of the total mass and has 260
thus no significant impact on the lithogenic matter content. Accordingly, we revised the 261
negative carbonate values to zero. The derived lithogenic matter fluxes reach 225 mg m-2 d-1 262
and ~600 mg m-2 d-1 in summer of 2008 and 2009, respectively, while low values (<50 mg m-2 263
d-1) are recorded in winter (Fig. 2e). On average, the lithogenic matter accounts for >70% of 264
the total mass with no clear seasonal pattern (Fig. 2e). 265
4.4 Terrigenous sterol flux 266
Fluxes of 24-ethylcholest-5-en-3β-ol show similar variations as terrigenous campesterol 267
suggesting a primary terrestrial source of this sterol, thus most likely mainly represented by β-268
sitosterol (Fig. 2g). Campesterol and β-sitosterol fluxes reach ~1 and 2.8 μg m-2 d-1 in August 269
2008, respectively. Both decrease to less than 0.5 μg m-2 d-1 in the following winter (Fig. 2g) 270
and increase to highest fluxes in summer 2009 peaking at 9.6 μg m-2 d-1 in July for β-sitosterol, 271
and to 8.4 μg m-2 d-1 in September for campesterol. 272
4.5 Diatom flux and species composition 273
Total diatom fluxes are strongly seasonal (Fig. 2h). Two peak values occur early August 274
2008 (~10×106 valves m-2 d-1) and late July to September 2009 (>14×106 valves m-2 d-1), 275
respectively. The diatom fluxes in winter are two orders of magnitude lower (<0.5×10⁶ valves 276
m-2 d-1). They rise abruptly late July 2019 when solar irradiance is nearly at maximum and sea 277
ice starts retreating (Fig. 2a, b, h). 278
In total 93 diatom species or species groups were identified in the sediment trap samples. 279
Apart from Chaetoceros RS, diatoms were categorized into 4 groups based on their ecological 280
preferences (Medlin and Priddle, 1990; Hasle and Syvertsen, 1997; von Quillfeldt, 1997, 2000; 281
Kohly, 1998; von Quillfeldt et al., 2003; Onodera et al., 2015). The sea ice group mainly 282

9
consists of Fossula arctica, Fragilariopsis cylindrus, F. oceanica, Nitzschia frigida, Pauliella 283
taeniata and certain species of genera Diploneis, Navicula, Nitzschia, Pinnularia. The cold-284
water diatom group is mostly composed of Thalassiosira antarctica var. borealis RS, T. 285
nordenskioeldii and, in minor amounts, Bacterosira bathyomphala RS and T. bulbosa. The 286
cosmopolitan diatom group includes Chaetoceros atlanticus, Thalassionema nitzschioides and 287
Thalassiosira eccentrica, while Paralia sulcata and species of genera Cocconeis, Cyclotella, 288
Cymbella, Delphineis and Eunotia form the coastal diatom group. The remaining diatom 289
species make up the other group. 290
Chaetoceros RS is the predominant group over the entire observation period (Fig. 3a). It 291
increases from 40% in August 2008 to ~80% in late September 2009. In contrast, the sea ice 292
diatom group shows a broad decline since the deployment of the trap (Fig. 3b-e). Within this 293
group, the relative abundances of F. arctica, F. cylindrus and F. oceanica are two- to three-fold 294
higher in summer 2008 than in 2009, whereas P. taeniata peaks in November 2008. The cold-295
water diatom group, however, remains low throughout the study period (Fig. 3f-g). Unlike the 296
sea ice diatom species, the cold-water T. antarctica var. borealis RS, T. bulbosa and T. 297
nordenskioeldii are more abundant in summer 2009 than in summer 2008. Interestingly, T. 298
nitzschioides, the major representative of the cosmopolitan diatom group, is more frequently 299
observed in winter than in summer (Fig. 3h). Similarly, the coastal diatom group, dominated by 300
P. sulcata, is also found in low relative abundances with slightly higher values from October 301
2008 to April 2009 when sea ice prevails (Fig. 3i). 302
Among the sea ice diatoms, Haslea crucigeroides and Pleurosigma stuxbergii var. 303
rhomboides, that are known producers of sea ice biomarker C25 monounsaturated hydrocarbon 304
IP25 (Brown et al., 2014), are detected though in low relative abundance (<1%), in both August 305
2008 after sea ice just retreated, and in July - early August 2009 at the onset of sea ice thaw 306
(not shown). Although widely observed in the Arctic Ocean, the sea ice bottom tethered diatom 307
Melosira arctica is only found sporadically over this one-year experiment (Abelmann, 1992; 308
Zernova et al., 2000; von Quillfeldt et al., 2003; Boetius et al., 2013; Lalande et al., 2014, 2019). 309
The North Pacific predominant and endemic taxa Neodenticula seminae (Jousé et al., 1971; 310
Sancetta, 1982; Onodera and Takahashi, 2009; Ren et al., 2014), which has been recently 311
reported in the North Atlantic water column and surface sediment (Starr et al., 2002; Reid et al., 312
2007; Miettinen et al., 2013), is also found once in sinking particles at DM, in line with the data 313
obtained at the nearby sediment trap NAP site (Onodera et al., 2015). 314
4.6 Diatom taxonomic diversity 315
The diatom diversity index, H-index, decreases from a mean of ~2.6 in 2008 to ~2.3 in 2009 316
with an outlier value of ~3.9 in early July 2009 (Fig. 3j). The summer 2009 diversity minimum 317

10
is reached at maximum TMF and diatom fluxes (Fig. 2e, h, 3j). The H-index of summer 2009 318
is lower than found in summer 2008 (H-index: 1.8 vs 2.7) most probably due to the high 319
abundance of Chaetoceros RS and decrease of other species. 320
5. Discussion 321
5.1 Interannual variability of diatom fluxes: link to surface circulation and sea ice 322
Our sediment trap time-series shows high TMF and diatom flux values during the summer 323
season. However, in summer 2009 and particularly late September, fluxes are two- to three-fold 324
higher than measured in 2008 (Fig. 2e, h; Bai et al., 2019). Diatom fluxes in summer 2008 325
(~10×106 valves m-2 d-1) are comparable to those found during the same season in the nearby 326
station NAP at 180/260 m depth in 2011 (~11×106 valves m-2 d-1), regardless of the mooring 327
depths and collection years of each site (Onodera et al., 2015). Interestingly, the high diatom 328
flux values in summer 2009 at DM (14 to 27×106 valves m-2 d-1) are of similar magnitude as 329
winter high flux events at NAP attributed to shelf-break eddies (Watanabe et al., 2014; Onodera 330
et al., 2015). 331
Lower diatom fluxes in 2008 than 2009 may suggest that the summer bloom was not 332
captured (Fig. 2-3) and that these low values reflect post-bloom production. Indeed, an early 333
bloom was reported in May 2008 in the Amundsen Gulf, East of the Beaufort Sea (Brown et 334
al., 2011; Belt et al., 2013) although this does not imply that the Northwind Ridge experienced 335
similar production growth. By contrast, a deep sediment trap in the southwestern Canadian 336
Basin indicates high POC values in August and September 2008, which based on a sinking 337
velocity of 85 m d-1, corresponds to high surface production and export in July - August (Station 338
A in Fig. 1; Hwang et al., 2015; Onodera et al., 2015). Furthermore, ice-ocean-ecosystem 339
coupled model simulations point out peaking chlorophyll-a values in the Chukchi Sea in August 340
2008 (Wang et al., 2013). Therefore, we can reasonably infer that the diatom flux measured in 341
August 2008 represents the blooming season locally and that it was thus lower than in 2009. 342
This assumption is further supported by MODIS summer sea surface chlorophyll-a 343
concentrations of the area indicating ~36% higher values in 2009 (0.382 μg l-1) than 2008 (0.282 344
μg l-1). 345
Biogenic production at DM is influenced by the PWI, the oligotrophic waters of the BG and 346
the sea ice distribution during the blooming season (Fig. 1). The Arctic Oscillation (AO) plays 347
an important role on sea ice distribution and surface ocean circulation (Rigor et al., 2002; 348
Serreze et al., 2003; Steele et al., 2004). 349
Since 1997, the BG circulation is driven by an anticyclonic wind circulation resulting in 350
enhanced freshening of the BG waters (Giles et al., 2012; Rabe et al., 2014; Proshutinsky et al., 351
2015; Wang et al., 2018). The subsequent stratification prevents nutrient to replenish the upper 352
11
ocean and thus stalls phytoplankton growth (McLaughlin and Carmack, 2010). The strength of 353
the BG is linked to the Arctic Ocean Oscillation (AOO) index, which varied annually and 354
notably shifted from a strong BG (AOO index = 2.9) in 2008 to a weaker BG in 2009 (AOO 355
index = 1.9; Fig. 4a) (Proshutinsky et al., 1999, 2015). We can thus hypothesize that 356
phytoplankton productivity at DM in 2008 was limited by stratified conditions maintaining 357
oligotrophic conditions in the upper ocean due to freshening under intensified BG. Likewise, 358
weakened and reduced BG in 2009 provided more favorable conditions for refueling surface 359
waters in nutrients to sustain higher production. This is consistent with fresher surface waters 360
reported near DM in summer 2008 than summer 2009 (Zhang, 2009; Kikuchi, 2009). Model 361
results also show prevailing west-northwestward surface flow in the Chukchi Borderland in 362
summer 2008 carrying nutrient-depleted waters from the Beaufort Sea to DM, whereas in 363
summer 2009 the surface ocean circulation was nearly northward bringing nutrient-rich PWI 364
waters to our site (Onodera et al., 2015). These findings highlight the key role of atmospheric 365
conditions in driving the surface current and nutrients transport at the BG boundary and their 366
impact on diatom flux. 367
The PWI is regarded as a pivotal nutrient source for the Arctic Ocean ecosystem (Walsh et 368
al., 1997). The mean annual transport of the PWI through the Bering Strait (~0.8 Sv) fluctuates 369
seasonally as well as annually (Roach et al., 1995; Woodgate et al., 2015) around values that 370
regularly increased since 1990 (Woodgate et al., 2012; Woodgate, 2018). The PWI in summer 371
2009 (~1.7 Sv) was stronger than in 2008 (~1.35 Sv) (Fig. 4b). Furthermore, during its 372
maximum transport period (April to July) this flow was ~0.2 Sv higher in 2009 than 2008. 373
Based on the distance between the Bering Strait and DM and current velocities in the Chukchi 374
Sea (Weingartner et al., 2005; Woodgate et al., 2005b), we can estimate that ~4 months is 375
needed for the PWI to reach our mooring site, which is in agreement with the time lag between 376
the PWI peak and high biogenic production in summer 2009 (Fig. 4). It is thus very reasonable 377
to conclude that stronger PWI by entraining more nutrients into the Arctic Ocean likely 378
triggered enhanced phytoplankton production in 2009. 379
The sea ice distribution during summer also shows different patterns in 2008 and 2009 (Fig. 380
5). As expected from AO and subsequent ocean circulation, in 2008 sea ice started retreating 381
westwards from the East, favoring the inflow of freshened and oligotrophic BG waters. 382
Meanwhile, the presence of sea ice in the South likely prevented nutrient-rich PWI waters from 383
advecting to our site. In contrast, sea ice melting in 2009 began from the South allowing the 384
PWI to flow to DM and influence primary production. This is further supported by surface wind 385
fields shown in Fig. S1. Easterly winds in July 2008 favored transport of freshened and 386
oligotrophic waters from the BG towards to the northwest or North of DM thereby limiting 387
biogenic production. In August 2008, southward winds further contributed to counteract the 388
12
northward advection of PWI, whereas in summer 2009 (July and August) Northerly winds 389
enhanced transport of nutrient-rich PWI to our mooring site, favoring diatom blooming (Fig. 390
S1) 391
In summary, our results provide consistent evidences on the impact of contrasting 392
atmospheric and oceanic circulation, notably the BG circulation, PWI nutrient transport as well 393
as sea ice retreat pattern on diatoms fluxes in the Chukchi Sea, between 2008 and 2009 (Fig. 394
5). They also underline that the southern Northwind Ridge is an area of strong interactions 395
between water masses from the Canadian Basin, the Pacific and even coastal Siberia, where 396
seasonal sea ice drift and motion makes it a sensitive region to ongoing climate change. 397
5.2 Lateral transport of diatoms 398
Coastal diatoms, mostly dwelling in the continental shelf area, are indicative of lateral 399
advection from the nearby Chukchi Sea shelf waters. Previous studies have shown that while 400
Paralia sulcata prevails in the sediments of the Chukchi Sea Shelf, this species is rarely found 401
in the Chukchi Borderland (Ran et al., 2013). At DM, the coastal diatom fluxes are also 402
dominated by P. sulcata peaking in September 2009, pointing out a significant influence of 403
water masses from the shelf area under stronger PWI conditions (Fig. 6b; See 5.1; Woodgate, 404
2018). Apart from this episode, values were low and stable (Fig. 6b). 405
Chaetoceros RS is also considered as an indicator of allochthonous material (Onodera et al., 406
2015). In our dataset Chaetoceros RS displays similar seasonal pattern as terrigenous biomarker 407
campesterol and β-sitosterol (Fig. 6c-d). The flux of these biomarkers produced by higher plants 408
(Huang and Meinschein, 1976) were found to also parallel lithogenic matter fluxes in both 409
shallow and deep sediment traps of the central Arctic Ocean (Fahl and Nöthig, 2007). The co-410
eval temporal evolution of terrigenous sterols and lithogenic material at DM is consistent with 411
lateral advection from the shelf in summer of 2009 (Fig. 6d-e). In contrast, the lithogenic matter 412
content (in %) drops to its lowest values in summer 2009 witnessing a reduced contribution of 413
allochthonous material (Fig. 6b-d, f). This discrepancy cannot be explained by sea ice transport 414
of coastal diatoms and biomarkers in winter and later settling under ice-free conditions in 415
September 2009 (Fig. 6a). Besides, this mechanism cannot account either for the concomitant 416
decrease of lithogenic matter content in summer 2009. Another explanation is that coastal 417
diatoms and terrigenous material might be entrained by PWI. Enhanced PWI would thus be 418
responsible for higher phytoplankton production in summer 2009 and the advection of 419
terrigenous matter (See 5.1). This is further supported by the decrease of the C/N ratio (bulk 420
organic carbon over bulk organic nitrogen mole ratio; modified from Bai et al, 2019) to 6.4 in 421
summer 2009. This value, close to the Redfield ratio of 6.6, points out a major marine origin of 422
settling material (Fig. 6g). Boosted blooming production and export of organic matter likely 423

13
explain enhanced contribution of marine constituents to the overall flux and the subsequent 424
decline of lithogenic content (Fig. 6f). 425
The abundance and flux of lithogenic matter, mostly composed of silt and clay, are higher 426
at our site than at nearby mooring station NAP and LOMO2 (Fig. 1) in the central Arctic, despite 427
a difference in water depths. Lithogenic particles might be derived from a proximate branch of 428
the Northwind Ridge, lying at ~900 m water depth (Poore et al., 1994), close to the depth of 429
our sediment trap (~870 m). Benthic nepheloid layer developing hundreds meters above the 430
seafloor is another possible mechanism able to remobilize sediments from the Northwind Ridge 431
and transport them to the sediment trap location (Rutgers van der Loeff et al., 2002). 432
5.3 Sea ice diatoms and IP25 433
Fluxes of sea ice diatoms and IP25 at DM display quite similar seasonal patterns (Fig. 7a). 434
Since IP25 is produced by specific sea ice diatoms (Brown et al., 2014), some correlation is 435
expected between the two fluxes (n = 21; r2 = 0.64; p < 0.01; Fig. 7b; Table 2). This correlation 436
is statistically unchanged after discarding low flux values (IP25 < 0.5 ng m-2d-1; sea ice diatom 437
< 1 × 10⁵ valves m-2 d-1) (n = 13; r2 = 0.61; p < 0.01). Both fluxes are high during the sea ice 438
melting season for both years. Although sea ice reconstructions based on micropaleontological 439
fossils or biomarkers preserved in the sediment cores have been successfully carried out in the 440
Atlantic and Arctic Ocean (e.g. diatoms: Sha et al., 2016, 2017; IP25: Massé et al., 2008; Müller 441
et al., 2009; Vare et al., 2009; Müller and Stein, 2014; Belt et al., 2015; Xiao et al., 2015; 442
Cabedo-Sanz et al., 2016; Hörner et al., 2016, 2017; Stein et al., 2016, 2017; Kolling et al., 443
2017; Clotten et al., 2018; Kremer et al., 2018), they have rarely been produced and compared 444
in the same core. Few available studies show poor agreement between sea ice diatoms and IP25, 445
a result that might be attributed to the specificity of IP25 producers as opposed to the broader 446
habitat of sea ice diatoms (Weckström et al., 2013; Sha et al., 2015). Our sediment trap record, 447
however, indicates consistent and synchronous fluctuations of the sea ice diatom group and IP25 448
fluxes with respect to sea ice distribution (Fig. 7a). Departures of diatom versus biomarker 449
signals in sediments can, to some extent, be attributed to dissolution and degradation (Belt and 450
Müller, 2013). Previous studies in the Arctic have shown that IP25 is biosynthesized by sea ice 451
diatoms Haslea crucigeroides and Pleurosigma stuxbergii var. rhomboides (Belt et al., 2013; 452
Brown et al., 2014). These species are present in our sediment trap in summer mainly during 453
high IP25 fluxes (Fig. 7a). Although these species have been frequently reported at the bottom 454
sea ice and, to a lesser extent, in the water column in the Arctic (e.g. von Quillfeldt, 1997; von 455
Quillfeldt et al., 2003; Katsuki et al., 2009), they were identified in only a few summer samples 456
at ~870 m, possibly because of dissolution during settling. These species have seldomly been 457
found in Arctic sediments (e.g. Ran et al., 2013; Obrezkova et al., 2014; Astakhov et al., 2015; 458

14
Limoges et al., 2018). The non-IP25 producing sea ice diatoms, e.g. Fossula arctica, 459
Fragilariopsis cylindrus, F. oceanica, also suffer from dissolution. Sediment trap data from the 460
Nordic Seas have shown that weakly silicified diatoms strongly dissolve in the sediments while 461
the robust ones are preserved (Kohly, 1998). Selective degradation of diatom frustules was also 462
demonstrated by comparing diatoms from shallow and deep traps at the nearby mooring site 463
NAP (Onodera et al., 2015). The relative abundance of Rhizosolenia spp., for instance, 464
decreased remarkably in the deep trap, whereas some diatom taxa increased in the abyssal 465
material (Onodera et al., 2015). In another study in the Chukchi Sea, the diatom assemblages 466
in sea ice and underlying sediments showed significant differences (von Quillfeldt et al., 2003). 467
Despite the fact that the diatom composition and species diversity of sediment trap at DM are 468
comparable to those of the sediments in the northern Chukchi Sea, weakly silicified diatoms, 469
Chaetoceros RS and sea ice diatoms among others, became less abundant in the sediments 470
while diatoms with stronger frustules such as Thalassiosira antarctica var. borealis RS 471
increased (Table 1; Ran et al., 2013). This finding supports the idea of selective diatom 472
dissolution during export to deep sediments, which pleas for cautious interpretation of paleo-473
reconstructions. In contrast, given its low photo-reactivity and wide distribution in the Arctic 474
sediments, IP25 should introduce less bias due to diagenesis (Brown and Belt, 2012; Belt and 475
Müller, 2013). Although a possible biogeochemical degradation of IP25 was suggested in the 476
central Arctic based on shallow and deep sediment traps, the IP25 seasonal patterns remained 477
similar from 150 to 1550 m water depth (Fahl and Stein, 2012). Nevertheless, investigations 478
are needed to explore IP25 degradation and its possible impact on past sea ice reconstruction. 479
Major phytosterols, namely brassicasterol and dinosterol, show a high correlation with cold-480
water diatoms (r2 = 0.83 and 0.77, respectively; p < 0.01; Table 2). From this result we can infer 481
that both phytosterol producers and cold-water diatoms thrive in ice-free conditions (Bai et al., 482
2019). Cold-water diatoms, however, have been also reported underneath consolidated sea ice 483
(Arrigo et al, 2012, 2014). In this case, it is expected that both cold-water and sea ice diatoms 484
sink synchronously and result in a significant correlation between their respective fluxes (r2 = 485
0.64; p < 0.01; Table 2). Interestingly, the tri-unsaturated highly branched isoprenoid alkene 486
(HBI-III), presumably associated with marginal ice zone (Belt et al., 2015; Smik et al., 2016; 487
Smik and Belt, 2017; Bai et al., 2019), shows a weak correlation with the sea ice diatom flux 488
(r2 = 0.48; p < 0.01; Table 2). Although HBI-III producers have not yet been fully recognized, 489
the hypothesized producers are within diatom genera Pleurosigma and Rhizosolenia (Belt, 2018; 490
Belt et al., 2000, 2015; Rowland et al., 2001). In this area diatom species belonging to 491
Pleurosigma are mainly related to sea ice while Rhizosolenia is found in the ice-free waters 492
(von Quillfeldt et al., 2003; Onodera et al., 2015). The weak correlation between HBI-III and 493
sea ice diatoms rather hints a sea ice source or sea ice edge conditions, but more investigation 494
15
is needed to be more conclusive. 495
Diatom sinking velocity of >85 m d-1 in summer has been recently estimated based on the 496
time lag between the shallow and deep trap diatom fluxes at NAP (Onodera et al., 2015). Using 497
this value, the summer diatom flux at ~870 m water depth at our site should represent the export 498
of material from surface waters or the sea ice produced about 10 days earlier. Hence, the diatom 499
bloom of summer 2009 might have started early July when the sea ice was about to retreat but 500
still compact (Fig. 2, 5). Incidentally, massive under sea ice phytoplankton blooms have been 501
observed in the Beaufort Sea in summer 2008 (Mundy et al., 2009) and in the Chukchi Sea in 502
summer 2011, maximizing at >100 km into the sea ice cover boundary (Arrigo et al., 2012, 503
2014). This phenomenon was attributable to intensified light penetration through sea ice into 504
the water column due to more melt ponds (Arrigo et al., 2014; Mundy et al., 2014). Thawing 505
snow over sea ice as well as leads in the ice pack might also have played a role in promoting 506
under ice bloom (Ambrose et al., 2005; Różańska et al., 2009; Arrigo, 2017; Assmy et al., 2017; 507
Lalande et al., 2019). Although no melt ponds data exist at DM for summer 2009, on-site model 508
estimates indicate that the snow cover had almost vanished and the sea ice thickness decreased 509
from ~2.8 m to ~1.5 m, at that time of maximum solar irradiance (Fig. 2a-d), leading to similar 510
sea surface state in summer 2009 as in 2011, allowing light penetration to trigger under sea ice 511
bloom. 512
6. Conclusions 513
The one-year long sediment trap time-series (August 2008 - September 2009, ~870 m water 514
depths) from the southern Northwind Ridge in the western Arctic Ocean highlights the strong 515
seasonality of diatom abundances and fluxes. Chaetoceros RS and, to a lesser extent, the sea 516
ice diatoms, e.g. Fossula arctica, Fragilariopsis cylindrus, F. oceanica, dominate the diatom 517
composition. 518
Diatom fluxes are two- to three-fold higher in summer 2009 than in summer 2008, a result 519
that is explained by a weaker BG circulation, an intensified PWI bringing nutrients into the 520
Arctic Ocean and the earlier retreat of sea ice from the South in 2009. Our findings underline 521
the sensitivity of the southern Northwind Ridge export fluxes to the spatio-temporal pattern of 522
sea ice melting and upper ocean circulation regime. 523
High fluxes of coastal diatoms, terrigenous biomarkers and lithogenic matter show indicate 524
lateral advection in summer 2009 likely triggered by enhanced PWI rather than by drifting sea 525
ice. 526
Sea ice diatom fluxes are coherent with IP25 fluxes, both showing high values during the 527
sea ice melting period reflecting marginal ice zone conditions. However, sea ice diatoms might 528
be prone to selective dissolution in the water column that is likely to alter diatom assemblage 529

16
in sediments and introduce bias in sea ice reconstructions. This result reinforces the need for 530
multi-proxy approaches to assess proxy biases and improve past sea ice estimates. 531
17
Acknowledgements 532
We are grateful to the captain, crew members and scientific party of the R/V Xuelong for 533
deployment and recovery of the sediment trap. We are deeply indebted to Dr. M.S. Obrezkova 534
of V.I. Ilyichev Pacific Oceanological Institute, Russian Academy of Sciences, for her kind help 535
on diatom taxonomy. Dr. Leonid Polyak of Ohio State University is acknowledged for his 536
helpful advices. We also thank Dr. Zhengbing Han and Dr. Qingsheng Guan of Second Institute 537
of Oceanography for technical assistance. This study was funded by the Scientific Research 538
Funds of the Second Institute of Oceanography, State Oceanic Administration, China (Nos. 539
JG1611, JG1911), the National Natural Science Foundation of China (Nos. 41606052, 540
41976229, 41806228, 41306200), the Chinese Polar Environmental Comprehensive 541
Investigation and Assessment Programs (No. CHINARE 0304), National Postdoctoral 542
Foundation of China (No. 17090093) and the Cai Yuanpei Program/ICAR (Sea Ice melt, Carbon, 543
Acidification and Phytoplankton in the present and past Arctic Ocean) funded by China 544
Scholarship Council. We thank the Centre National de la Recherche Scientifique (CNRS) for 545
M.-A.S. salary. We also thank three anonymous reviewers for valuable comments to improve 546
the manuscript. 547
18
Author contributions 548
J. R. designed the study and wrote the manuscript with contribution of M.-A. S., J. C., H. 549
L., J. Z., Y. B., Y. Z and B. W. J. R. carried out the diatom identification. Y. B. and Y. L. 550
contributed the biomarker analyses (campesterol and β-sitosterol), J. Z. performed the 551
determination of particulate inorganic carbon (PIC) and calculated the CaCO3 content. Z. J. 552
and H. J. contributed the particulate organic carbon (POC) and B. W. the opal flux. Z. Y. and L. 553
L. retrieved the environmental data from different database. All authors contributed to the final 554
version of the manuscript.555

19
Declarations of interest: None556
20
References 557
558
Abelmann, A., 1992. Diatom assemblages in Arctic sea ice: indicator for ice drift pathways. 559
Deep-Sea Research, 39, 525-538. 560
561
Ambrose, W.G. Jr, von Quillfeldt, C., Clough, L.M., Tilney, P.V.R., Tucker, T., 2005. The sub-562
ice algal community in the Chukchi Sea: large- and small-scale patterns of abundance based on 563
images from a remotely operated vehicle. Polar Biology, 28, 784–795. 564
565
Arrigo, K.R., 2017. Sea ice as a habitat for primary producers. In: Thomas, D.N. (Ed.), Sea Ice, 566
3rd ed. John Wiley & Sons, Chichester, pp. 352–369. 567
568
Arrigo, K.R., van Dijken, G.L., 2015. Continued increases in Arctic Ocean primary production. 569
Progress in Oceanography, 136, 60-70. 570
571
Arrigo, K.R., Dijken, G.V., Pabi, S., 2008. Impact of a shrinking Arctic ice cover on marine 572
primary production. Geophysical Research Letters 35, L19603. 573
https://doi.org/10.1029/2008GL035028. 574
575
Arrigo, K.R., Perovich, D.K., Pickart, R.S., Brown, Z.W., van Dijken, G.L., Lowry, K.E., Mills, 576
M.M., Palmer, M.A., Balch, W.M., Bahr, F., Bates, N.R., Benitez-Nelson, C., Bowler, B., 577
Brownlee, E., Ehn, J.K., Frey, K.E., Garley, R., Laney, S.R., Lubelczyk, L., Mathis, J., 578
Matsuoka, A., Mitchell, B.G., Moore, G.W.K., Ortega-Retuerta, E., Pal, S., Polashenski, C.M., 579
Reynolds, R.A., Schieber, B., Sosik, H.M., Stephens, M., Swift, J.H., 2012. Massive 580
phytoplankton blooms under Arctic sea ice. Science, 336, 1408–1408. 581
582
Arrigo, K.R., Perovich, D.K., Pickart, R.S., Brown, Z.W., van Dijken, G.L., Lowry, K.E., Mills, 583
M.M., Palmer, M.A., Balch, W.M., Bates, N.R., Benitez-Nelson, C.R., Brownlee, E., Frey, K.E., 584
Laney, S.R., Mathis, J., Matsuoka, A., Greg Mitchell, B., Moore, G.W.K., Reynolds, R.A., 585
Sosik, H.M., Swift, J.H., 2014. Phytoplankton blooms beneath the sea ice in the Chukchi Sea. 586
Deep-Sea Research Part II, 105, 1–16. 587
588
Ardyna, M., Babin, M., Gosselin, M., Devred, E., Rainville, L., Tremblay, J.-É., 2014. Recent 589
Arctic Ocean sea ice loss triggers novel fall phytoplankton blooms. Geophysical Research 590
Letters, 41, doi:10.1002/2014GL061047. 591
592
21
Assmy, P., Fernandezmendez, M., Duarte, P., Meyer, A., Randelhoff, A., Mundy, C. J., et al., 593
2017. Leads in Arctic pack ice enable early phytoplankton blooms below snow-covered sea ice. 594
Scientific Reports, 7, 40850. 595
596
Astakhov, A.S., Bosin, A.A., Kolesnik, A.N., Obrezkova, M.S., 2015. Sediment geochemistry 597
and diatom distribution in the Chukchi Sea: Application for bioproductivity and 598
paleoceanography. Oceanography, 28, 190–201. 599
600
Bai, Y., Sicre, M.-A., Chen, J., Klein, V., Jin, H., Ren, J., Li, H., Xue, B., Ji, Z., Zhuang, Y., 601
Zhao, M., 2019. Seasonal and spatial variability of sea ice and phytoplankton biomarker flux 602
in the Chukchi Sea (western Arctic Ocean). Progress in Oceanography, 171, 22–37. 603
604
Belt, S.T., 2018. Source-specific biomarkers as proxies for Arctic and Antarctic sea ice. Organic 605
Geochemistry, 125, 277-298. 606
607
Belt, S.T., 2019. What do IP25 and related biomarkers really reveal about sea ice change? 608
Quaternary Science Reviews, 204, 216-219. 609
610
Belt, S.T., Allard, W.G., Massé, G., Robert, J.-M., Rowland, S.J., 2000. Highly branched 611
isoprenoids (HBIs): identification of the most common and abundant sedimentary isomers. 612
Geochimica et Cosmochimica Acta, 64, 3839–3851. 613
614
Belt, S.T., Müller, J., 2013. The Arctic sea ice biomarker IP25: a review of current understanding, 615
recommendations for future research and applications in palaeo sea ice reconstructions. 616
Quaternary Science Review, 79, 9–25. 617
618
Belt, S.T., Brown, T.A., Ringrose, A.E., Cabedo-Sanz, P., Mundy, C.J., Gosselin, M., Poulin, 619
M., 2013. Quantitative measurement of the sea ice diatom biomarker IP25 and sterols in Arctic 620
sea ice and underlying sediments: Further considerations for palaeo sea ice reconstruction. 621
Organic Geochemistry, 62, 33–45. 622
623
Belt, S.T., Cabedo-Sanz, P., Smik, L., Navarro-Rodriguez, A., Berben, S.M.P., Knies, J., Husum, 624
K., 2015. Identification of paleo Arctic winter sea ice limits and the marginal ice zone: 625
Optimised biomarker-based reconstructions of late Quaternary Arctic sea ice. Earth and 626
Planetary Science Letter, 431, 127–139. 627
628
Bluhm, B.A., Gebruk, A.V., Gradinger, R., Hopcroft, R.R., Huettmann, F., Kosobokova, K.N., 629
22
Sirenko, B.I., Weslawski, J.M., 2011. Arctic marine biodiversity: An update of species richness 630
and examples of biodiversity change. Oceanography, 24, 232–248. 631
632
Boetius, A., Albrecht, S., Bakker, K., Bienhold, C., Felden, J., Fernandez-Mendez, M., 633
Hendricks, S., Katlein, C., Lalande, C., Krumpen, T., Nicolaus, M., Peeken, I., Rabe, B., 634
Rogacheva, A., Rybakova, E., Somavilla, R., Wenzhofer, F., 2013. Export of algal biomass from 635
the melting Arctic sea ice. Science, 339, 1430–1432. 636
637
Booth, B.C. and Horner, R.A., 1997. Microalgae on the Arctic Ocean section, 1994: species 638
abundance and biomass. Deep-Sea Research, 2, 44, 1607–1622. 639
640
Brown, T.A., Belt, S.T., 2012. Identification of the sea ice diatom biomarker IP25 in Arctic 641
benthic macrofauna: direct evidence for a sea ice diatom diet in Arctic heterotrophs. Polar 642
Biology, 35, 131-137. 643
644
Brown, T.A., Belt, S.T., Mundy, C., Philippe, B., Massé, G., Poulin, M., Gosselin, M., 2011. 645
Temporal and vertical variations of lipid biomarkers during a bottom ice diatom bloom in the 646
Canadian Beaufort Sea: further evidence for the use of the IP25 biomarker as a proxy for spring 647
Arctic sea ice. Polar Biology, 34, 1857–1868. 648
649
Brown, T.A., Belt, S.T., Tatarek, A., Mundy, C.J., 2014. Source identification of the Arctic sea 650
ice proxy IP25. Nature Communications, 5, 4197. 651
652
Cabedosanz, P., Belt, S. T., Jennings, A. E., Andrews, J. T., & Geirsdottir, A., 2016). Variability 653
in drift ice export from the Arctic Ocean to the North Icelandic Shelf over the last 8000 years: 654
A multi-proxy evaluation. Quaternary Science Reviews, 146, 99-115. 655
656
Carroll, M.L., Carroll, J., 2003. The Arctic Seas. In: Black, K., Shimmield, G. (Eds.), 657
Biogeochemistry of Marine Systems. Blackwell Publishing, Oxford, pp. 127–156. 658
659
Cavalieri, D.J., Parkinson, C.L., Gloersen, P., Zwally, H.J., 1996, updated yearly. Sea Ice 660
Concentrations from Nimbus-7 SMMR and DMSP SSM/I-SSMIS Passive Microwave Data, 661
Version 1. [Indicate subset used]. Boulder, Colorado USA. NASA National Snow and Ice Data 662
Center Distributed Active Archive Center. doi: https://doi.org/10.5067/8GQ8LZQVL0VL. 663
664
Clotten, C., Stein, R., Fahl, K., De Schepper, S., 2018. Seasonal sea ice cover during the warm 665
Pliocene: Evidence from the Iceland Sea (ODP Site 907). Earth and Planetary Science Letters, 666

23
481, 61-72. 667
668
Coachman, L.K., Aagaard, K., 1966. On the water exchange through Bering Strait. Limnology 669
and Oceanography, 11, 44-59. 670
671
Comiso, J.C., 2012. Large decadal decline of the Arctic multiyear ice cover. Journal of Climate, 672
25, 1176–1193. 673
674
Coupel, P., Jin, H., Joo, M., Horner, R., Bouvet, H.A., Sicre, M.-A., Gascard, J.-C., Chen, J.F., 675
Garçon, V., Ruiz-Pino, D., 2012. Phytoplankton distribution in unusually low sea ice cover over 676
the Pacific Arctic. Biogeosciences 9, 4835–4850. 677
678
Coupel, P., Ruiz-Pino, D., Sicre, M.A., Chen, J., Lee, S., Schiffrine, N., Li, H., Gascard, J.C., 679
2015. The impact of freshening on phytoplankton production in the Pacific Arctic Ocean. 680
Progress in Oceanography, 131, 113–125. 681
682
Esper, O., Gersonde, R., Kadagies, N., 2010. Diatom distribution in southeastern Pacific surface 683
sediments and their relationship to modern environmental variables. Palaeogeography, 684
Palaeoclimatology, Palaeoecology, 287, 1-27. 685
686
Fahl, K., Stein, R., 2012. Modern seasonal variability and deglacial/Holocene change of central 687
Arctic Ocean sea-ice cover: New insights from biomarker proxy records. Earth and Planetary 688
Science Letters, 351–352, 123–133. 689
690
Fahl, K., Nöthig, E.M., 2007. Lithogenic and biogenic particle fluxes on the Lomonosov Ridge 691
(central Arctic Ocean) and their relevance for sediment accumulation: Vertical vs. lateral 692
transport. Deep-Sea Research Part I, 54, 1256–1272. 693
694
Fleming, W.D., 1954. Naphrax: a synthetic mounting medium of high refractive index new and 695
improved methods of preparation. Journal of Microscopy, https://doi.org/10.1111/j.1365-696
2818.1954.tb02001.x. 697
698
Forest, A., Sampei, M., Hattori, H., Makabe, R., Sasaki, H., Fukuchi, M., Wassmann, P., and 699
Fortier, L., 2007. Particulate organic carbon fluxes on the slope of the Mackenzie Shelf 700
(Beaufort Sea): Physical and biological forcing of shelf-basin exchanges. Journal of Marine 701
Systems, 68, 39–54. 702
703
24
Forest, A., Sampei, M., Makabe, R., Sasaki, H., Barber, D., Gratton, Y., Wassmann, P., Fortier, 704
L., 2008. The annual cycle of particulate organic carbon export in Franklin Bay (Canadian 705
Arctic): environmental control and food web implications. Journal of Geophysical Research: 706
Oceans 113, C03S05. doi:10.1029/2007JC004262. 707
708
Forest, A., Tremblay, J.-E., Gratton, Y., Martin, J., Gagnon, J., Darnis, G., Sampei, M., Fortier, 709
L., Ardyna, M., Gosselin, M., Hattori, H., Nguyen, D., Maranger, R., Vaqué, D., Pedrós-Alió, 710
C., Sallon, A., Michel, C., Kellogg, C., Deming, J., Shadwick, E., Thomas, H., Link, H., 711
Archambault, P., Piepenburg, D., 2011. Biogenic carbon flows through the planktonic food web 712
of the Amundsen Gulf (Arctic Ocean): a synthesis of field measurements and inverse modeling 713
analyses. Progress in Oceanography, 91, 410–436. 714
715
716
Gersonde, R., Zielinski, U., 2000. The reconstruction of late Quaternary Antarctic sea ice 717
distribution — the use of diatoms as a proxy for sea ice. Palaeogeography, Palaeoclimatology, 718
Palaeoecology, 162, 263–286. 719
720
Giles, K.A., Laxon, S.W., Ridout, A.L., Wingham, D.J., Bacon, S., 2012. Western Arctic Ocean 721
freshwater storage increased by wind-drivenspin-up of the Beaufort Gyre. Nature Geoscience, 722
5, 194–197. 723
724
Grebmeier, G.M., 2012. Shifting patterns of life in the Pacifi c Arctic and sub-Arctic Seas. 725
Annual Review of Marine Science, 4, 16.1–16.16. 726
727
Grebmeier, J.M., Cooper, L.W., Feder, H.M., Sirenko, B.I., 2006. Ecosystem dynamics of the 728
Pacific-influenced northern Bering and Chukchi seas in the Amerasian Arctic. Progress in 729
Oceanography, 71, 331–361. 730
731
Harada, N., 2016. Review: Potential catastrophic reduction of sea ice in the western Arctic 732
Ocean: Its impact on biogeochemical cycles and marine ecosystems. Global and Planetary 733
Change, 136, 1–17. 734
735
Hasle, G.R., Syvertsen, E.E., 1997. Marine diatoms. In: Tomas, C.R. (Ed.), Identifying Marine 736
Phytoplankton. Academic Press, New York, pp. 5–385. 737
738
He, J., Zhang, F., Lin, L., Ma, Y., Chen, J., 2012. Bacterioplankton and picophytoplankton 739
abundance, biomass, and distribution in the Western Canada Basin during summer 2008. Deep-740

25
Sea Research Part II, 81–84, 36–45. 741
742
Honjo, S., Krishfield, R. A., Eglinton, T. I., Manganini, S. J., Kemp, J. N., Doherty, K., Hwang, 743
J., McKee, T. K., and Takizawa, T., 2010. Biological pump processes in the cryopelagic and 744
hemipelagic Arctic Ocean: Canada Basin and Chukchi Rise. Progress in Oceanography, 85, 745
137–170. 746
747
Hörner ,T., Stein, R., Fahl, K., Birgel, D., 2016. Post-glacial variability of sea ice cover, river 748
run-off and biological production in the western Laptev Sea (Arctic Ocean) – a high-resolution 749
biomarker study. Quaternary Science Review, 143, 133–149. 750
751
Hörner, T., Stein, R., Fahl, K., 2017. Evidence for Holocene centennial variability in sea ice 752
cover based on IP25 biomarker reconstruction in the southern Kara Sea (Arctic Ocean). Geo-753
marine Letters, 37, 515-526. 754
755
Huang, W.Y., Meinschein, W.G., 1976. Sterols as source indicators of organic material in 756
sediments. Geochimica et Cosmochimica Acta, 40, 323–330. 757
758
Hwang, J., Kim, M., Manganini, S. J., Mcintyre, C., Haghipour, N., Park, J., Krishfield, R.A., 759
Macdonald, R.W., Eglinton, T. I., 2015. Temporal and spatial variability of particle transport in 760
the deep Arctic Canada Basin. Journal of Geophysical Research: Oceans, 120, 2784-2799. 761
762
Ikenoue, T., Bjørklund, K.R., Krugulikova, S.B., Onodera, J., Kimoto, K., Harada, N., 2015. 763
Flux variations and vertical distributions of siliceous Rhizaria (Radiolaria and Phaeodaria) in 764
the western Arctic Ocean: indices of environmental changes. Biogeosciences, 12, 2019–2046. 765
766
Joo, H.M., Lee, S.H., Jung, S.W., Dahms, H.-U., Lee, J.H., 2012. Latitudinal variation of 767
phytoplankton communities in the western Arctic Ocean. Deep-Sea Research Part II, 81–84, 3–768
17, 2012. 769
770
Jousé, A.P., Kozlova, O.G., Muhina, V.V., 1971. Distribution of diatoms in the surface layer of 771
sediment from the Pacific Ocean. In: Funnell, B.M., Riedel, W.R. (Eds.), The 772
Micropalaeontology of Oceans. Cambridge University Press, London, pp. 263–269. 773
774
Katsuki, K., Takahashi, K., Onodera, J., Jordan, R.W., Suto, I., 2009. Living diatoms in the 775
vicinity of the North Pole, summer 2004. Micropaleontology, 55, 137-170. 776
777

26
Kikuchi, T., 2009. R/V Mirai Cruise Report MR09–03. JAMSTEC, Yokosuka, 190p. 778
779
Kohly, A., 1998. Diatom flux and species composition in the Greenland Sea and the Norwegian 780
Sea in 1991–1992. Marine Geology, 145, 293-312. 781
782
Kolling, H.M., Stein, R., Fahl, K., Perner, K., Moros, M., 2017. Shortterm variability in late 783
Holocene sea ice cover on the East Greenland Shelf and its driving mechanisms. 784
Palaeogeography, Palaeoclimatology, Palaeoecology, 485, 336–350. 785
786
Kremer, A., Stein, R., Fahl, K., Ji, Z., Yang, Z., Wiers, S., Matthiessen, J., Forwick, M., 787
Löwemark, L., O’Regan, M., Chen, J., Snowball, I., 2018. Changes in sea ice cover and ice 788
sheet extent at the Yermak Plateau during the last 160 ka—reconstructions from biomarker 789
records. Quaternary Science Reviews, 182, 93-108. 790
791
Lalande, C., Bélanger, S., Fortier, L., 2009. Impact of a decreasing sea ice cover on the vertical 792
export of particulate organic carbon in the northern Laptev Sea, Siberian Arctic Ocean. 793
Geophysical Research Letters, 36, L21604, doi:10.1029/2009GL040570. 794
795
Lalande, C., Nöthig, E.-M., Somavilla, R., Bauerfeind, E., Shevchenko, V., Kolodkov, Y., 2014. 796
Variability in under-ice export fluxes of biogenic matter in the Arctic Ocean. Global 797
Biogeochemical Cycle, 28, 571–583, doi:10.1002/2013GB004735. 798
799
Lalande, C., Nöthig, E.-M., Fortier, L., 2019. Algal export in the Arctic Ocean in times of global 800
warming. Geophysical Research Letters, 46, https://doi.org/10.1029/2019GL083167. 801
802
Lee, Y., Min, J.-O., Yang, E.J., Cho, K.-H., Jung, J., Park, J., Moon, J.K., Kang, S.-H., 2019. 803
Influence of sea ice concentration on phytoplankton community structure in the Chukchi and 804
East Siberian Seas, Pacific Arctic Ocean. Deep-Sea Research Part I, doi: 805
https://doi.org/10.1016/j.dsr.2019.04.001. 806
807
Li, W.K., Mclaughlin, F.A., Lovejoy, C., Carmack, E.C., 2009. Smallest algae thrive as the 808
Arctic Ocean freshens. Science, 326, 539. 809
810
Limoges, A., Massé, G., Weckström, K., Poulin, M., Ellegaard, M., Heikkila, M., Geilfus, N.-811
X., Sejr, M.K., Rysgaard, S., Ribeiro, S., 2018. Spring succession and vertical export of diatoms 812
and IP25 in a seasonally ice-covered high arctic fjord. Frontiers of Earth Science, 6, 226, doi: 813
10.3389/feart.2018.00226. 814
27
815
816
Mantua, N.J., Hare, S.R., Zhang, Y., Wallace, J.M., Francis, R.C., 1997. A Pacific interdecadal 817
climate oscillation with impacts on salmon production. Bulletin of the American 818
Meteorological Society, 78, pp. 1069-1079. 819
820
Matsuno, K., Yamaguchi, A., Fujiwara, A., Onodera, J., Watanabe, E., Imai, I., Chiba, S., 821
Harada, N., Kikuchi, T., 2014. Seasonal changes in mesozooplankton swimmers collected by 822
sediment trap moored at a single station on the Northwind Abyssal Plain in the western Arctic 823
Ocean. Journal of Plankton Research, 36, 490–502. 824
825
McLaughlin, F.A., Carmack, E., 2010. Deepening of the nutricline and chlorophyll maximum 826
in the Canada Basin interior, 2003–2009. Geophysical Research Letters, 37, L24602. 827
http://dx.doi.org/10.1029/2010GL045459. 828
829
McLaughlin, F., Carmack, E., Proshutinsky, A., Krishfield, R.A., Guay, C., Yamamoto-Kawai, 830
M., Jackson, J.M., Williams, B., 2011. The rapid response of the Canada Basin to climate 831
forcing: From bellwether to alarm bells. Oceanography, 24, 146–159. 832
833
Medlin, L.K., Priddle, J., 1990. Polar Marine Diatoms. British Antarctic Survey, Cambridge, 834
214 pp. 835
836
Miettinen, A., 2018. Diatoms in Arctic regions: Potential tools to decipher environmental 837
changes. Polar Science, 18, 220-226. 838
839
Miettinen, A., Koc, N., Husum, K., 2013. Appearance of the Pacific diatom Neodenticula 840
seminae in the northern Nordic Seas — an indication of changes in Arctic sea ice and ocean 841
circulation. Marine Micropaleontology, 99, 2-7. 842
843
Mundy, C.J., Gosselin, M., Ehn, J., Gratton, Y., Rossnagel, A., Barber, D.G., Martin, J., 844
Tremblay, J.-E., Palmer, M., Arrigo, K.R., Darnis, G., Fortier, L., Else, B., Papakyriakou, T., 845
2009. Contribution of under-ice primary production to an ice-edge upwelling phytoplankton 846
bloom in the Canadian Beaufort Sea. Geophysical Research Letters, 36, L17601. 847
848
Mundy, C.J., Gosselin, M., Gratton, Y., Brown, K.A., Galindo, V., Campbell, K., Levasseur, M., 849
Barber, D., Papakyriakou, T., Belanger, S., 2014. Role of environmental factors on 850
phytoplankton bloom initiation under landfast sea ice in Resolute Passage, Canada. Marine 851

28
Ecology Progress Series, 497, 39-49. 852
853
Müller, P. J., Suess, E. Andréungerer, C., 1986. Amino acids and amino sugars of surface 854
particulate and sediment trap material from waters of the Scotia Sea. Deep-Sea Research Part 855
I, 33, 819–838. 856
857
Müller, J., Stein, R., 2014. High-resolution record of late glacial and deglacial sea ice changes 858
in Fram Strait corroborates ice–ocean interactions during abrupt climate shifts. Earth and 859
Planetary Science Letter, 403, 446–455. 860
861
Müller, J., Massé, G., Stein, R., Belt, S.T., 2009. Variability of sea-ice conditions in the Fram 862
Strait over the past 30,000 years. Nature Geoscience, 2, 772–776. 863
864
Obrezkova, M.S., Kolesnik, A.N., Semiletov, I.P., 2014. The diatom distribution in the surface 865
sediments of the Eastern Arctic Seas of Russia. Russian Journal of Marine Biology, 40, 465–866
472. 867
868
O’Brien, M.C., Macdonald, R.W. Melling, H., Iseki, K., 2006. Particle fluxes and geochemistry 869
on the Canadian Beaufort Shelf: Implications for sediment transport and deposition. 870
Continental Shelf Research, 26, 41–81. 871
872
O’Brien, M.C., Melling, H., Pedersen, T.F., Macdonald, R.W., 2011. The role of eddies and 873
energetic ocean phenomena in the transport of sediment from shelf to basin in the Arctic. 874
Journal of Geophysical Research, 116, C08001, doi:10.1029/2010JC006890. 875
876
Onodera, J., Takahashi, K., 2009. Long-term diatom fluxes in response to oceanographic 877
conditions at Stations AB and SA in the central subarctic Pacific and the Bering Sea, 1990–878
1998. Deep-Sea Research I, 56, 189–211. 879
880
Onodera, J., Watanabe, E., Harada, N., Honda, M.C., 2015. Diatom flux reflects water-mass 881
conditions on the southern Northwind Abyssal Plain, Arctic Ocean. Biogeosciences, 12, 1373–882
1385, doi:10.5194/bg-12-1373-2015. 883
884
Onodera, J.,Watanabe, E., Nishino, S., Harada, N., 2016. Distribution and vertical fluxes of 885
silicoflagellates, ebridians, and the endoskeletal dinoflagellate Actiniscus in the western Arctic 886
Ocean. Polar Biology, 39, 327–341, doi:10/1007/s00300-015-1784-y. 887
888
29
Poore, R.Z., Ishman, S.E., Phillips, L., McNeil, D., 1994. Quaternary stratigraphy and 889
paleoceanography of the Canada Basin, western Arctic Ocean. US Geological Survey Bulletin, 890
2080, 1–32. 891
892
Post, E., Bhatt, U.S., Bitz, C.M., Brodie, J.F., Fulton, T.L., Hebblewhite, M., Kerby, J., Kutz, 893
S., Stirling, I., Walker, D.A., 2013. Ecological consequences of sea‐ice decline. Science, 341, 894
519–524. 895
896
Poulin, M., Lundholm, N., Bérard-Therriault, L., Starr, M., Gagnon, R., 2010. Morphological 897
and phylogenetic comparisons of Neodenticula seminae (Bacillariophyta) populations between 898
the subarctic Pacific and the Gulf of St. Lawrence. European Journal of Phycology, 45, 127-899
142. 900
901
Poulin, M., Daugbjerg, N., Gradinger, R., Ilyash, L., Ratkova, T., von Quillfeldt, C., 2011. The 902
pan-Arctic biodiversity of marine pelagic and sea-ice unicellular eukaryotes: a first-attempt 903
assessment. Marine Biodiversity, 41, 13–28. 904
905
Proshutinsky, A., Johnson, M., 1997. Two circulation regimes of the wind-driven Arctic Ocean. 906
Journal of Geophysical Research, 102, 12 493–12 514. 907
908
Proshutinsky, A, Polyakov, I, Johnson, M., 1999. Climate states and variability of Arctic ice 909
and water dynamics during 1946–1997. Polar Ressearch, 18, 135–142. 910
911
Proshutinsky, A., Dukhovskoy, D., Timmermans, M.-L., Krishfield, R., Bamber, J. L., 2015. 912
Arctic circulation regimes. Philosophical Transactions of the Royal Society A, 373, 20140160. 913
914
Rabe, B., Karcher, M., Kauker, F., Schauer, U., Toole, J. M., Krishfield, R. A., Pisarev, S., 915
Kikuchi, T., Su, J., 2014. Arctic Ocean basin liquid freshwater storage trend 1992–2012. 916
Geophysical Research Letters, 41, 961–968. https://doi.org/10.1002/2013GL058121. 917
918
Ran, L.H., Chen, J.F., Jin, H.Y., Li, H.L., Lu, Y., Wang, K., 2013. Diatom distribution of surface 919
sediment in the Bering Sea and Chukchi Sea. Advance in Polar Science, 24, 106–112. 920
921
Reid, P.C., Johns, D.G., Edwards, M., Starr, M., Poulin, M., Snoeijs, P., 2007. A biological 922
consequence of reducing Arctic ice cover: arrival of the Pacific diatom Neodenticula seminae 923
in the North Atlantic for the first time in 800 000 years. Global Change Biology, 13, 1910–1921. 924
30
925
Ren, J., Jiang, H., Seidenkrantz, M.-S., Kuijpers, A., 2009. A diatom-based reconstruction of 926
Early Holocene hydrographic and climatic change in a southwest Greenland fjord. Marine 927
Micropaleontology, 70, 166–176. 928
929
Ren, J., Gersonde, R., Esper, O., Sancetta, C., 2014. Diatom distributions in northern North 930
Pacific surface sediments and their relationship to modern environmental variables, 931
Palaeogeography, Palaeoclimatology, Palaeoecology, 402, 81–103. 932
933
Renaut, S., Devred, E., Babin, M., 2018. Northward expansion and intensification of 934
phytoplankton growth during the early ice-free season in Arctic. Geophysical Research Letters, 935
45, 10590–10598. 936
937
Rigor, I.G., Wallace, J.M., Colony, R.L., 2002. Response of sea ice to the Arctic oscillation. 938
Journal of Climate, 15, 2648–2663. 939
940
Roach, A.T., Aagaard, K., Pease, C.H., Salo, S.A., Weingartner, T., Pavlov, V., Kulakov, M., 941
1995. Direct measurements of transport and water properties through the Bering Strait. Journal 942
of Geophysical Research, 100(C9), 18443-18457. 943
944
Romero, O.E., Armand, L.K., 2010. Marine diatoms as indicators of modern changes in 945
oceanographic conditions. In: Smol, J.P., Stoermer, E.F. (eds), The Diatoms: Applications for 946
the Environmental and Earth Sciences. Cambridge University Press, Cambridge, pp. 373-400. 947
948
Rowland, S.J., Belt, S.T., Wraige, E.J., Massé, G., Roussakis, C., Robert, J.M., 2001. Effects of 949
temperature on polyunsaturation in cytostatic lipids of Haslea ostrearia. Phytochemistry, 56, 950
597–602. 951
952
Różańska, M., Gosselin, M., Poulin, M., Wiktor, J., Michel, C., 2009. Influence of 953
environmental factors on the development of bottom ice protist communities during the winter–954
spring transition. Marine Ecology Progress Series, 386, 43-59. 955
956
Rutgers van der Loeff, M.M., Meyer, R., Rudels, B., Rachor, E., 2002. Resuspension and 957
particle transport in the Benthic Nepheloid layer in and near Fram Strait in relation to faunal 958
abundances and 234Th depletion. Deep-Sea Research Part I, 49, 1941–1958. 959
960
Sancetta, C., 1982. Distribution of diatom species in surface sediments of the Bering and 961

31
Okhotsk seas. Micropaleontology, 28, 221–257. 962
963
Saha, S., Moorthi, S., Pan, H.-L., Wu, X., Wang, J., Nadiga, S., Tripp, P., Kistler, R., Woollen, 964
J., Behringer, D., Liu, H., Stokes, D., Grumbine, R., Gayno, G., Wang, J., Hou, Y.-T., Chuang, 965
H., Juang, H.-M. H., Sela, J., Iredell, M., Treadon, R., Kleist, D., Delst, P. V., Keyser, D., Derber, 966
J., Ek, M., Meng, J., Wei, H., Yang, R., Lord, S., van den Dool, H., Kumar, A., Wang, W., Long, 967
C., Chelliah, M, Xue, Y., Huang, B., Schemm, J-K., Ebisuzaki, W., Lin, R., Xie, P., Chen, M., 968
Zhou, S., Higgins, W., Zou, C-Z., Liu, Q., Chen, Y., Han, Y., Cucurull, L., Reynolds, R. W., 969
Rutledge, G., Goldberg, M., 2010. The NCEP Climate Forecast System Reanalysis. Bulletin of 970
American Meteorological Society, 91, 1015–1057. 971
972
Saha, S., Moorthi, S., Wu, X., Wang, J., Nadiga, S., Tripp, P., Behringer, D., Hou, Y.-T., Chuang, 973
H.-Y., Iredell, M., Ek, M., Meng, J., Yang, R., Mendez, M.P., van den Dool, H., Zhang, Q., 974
Wang, W, Chen, M., Becker, E., 2014. The NCEP Climate Forecast System Version 2. Journal 975
of Climate, 27, 2185-2208. 976
977
Serreze, M.C., Maslanik, J.A., Scambos, T.A., Fetterer, F., Stroeve, J., Knowles, K., Fowler, C., 978
Drobot, S., Barry, R.G., Haran, T.M., 2003. A record minimum arctic sea ice extent and area in 979
2002. Geophysical Research Letters, 30, 1110. https://doi.org/10.1029/2002GL016406. 980
981
Serreze, M.C., Crawford, A.D., Stroeve, J.C., Barrett, A.P., Woodgate, R.A., 2016. Variability, 982
trends, and predictability of seasonal sea ice retreat and advance in the Chukchi Sea. Journal of 983
Geophysical Research: Oceans, 121, doi:10.1002/2016JC011977. 984
985
Schrader, H.J., Gersonde, R., 1978. Diatoms and silicoflagellates. In: Zachariasse,W.J., Riedel, 986
W.R., Sanfilippo, A., Schmidt, R.R., Brolsma, M.J., Schrader, H.J., Gersonde, R., Drooger, 987
M.M., Broekman, J.A. (Eds.), Micropaleontological Methods and Techniques — An Exercise 988
on an Eight Metres Section of the lower Pliocene of Capo Rossello, Sicily. Utrecht 989
micropaleontological bulletins, 17, pp. 129–176. 990
991
Sha, L., Jiang, H., Liu, Y., Zhao, M., Li, D., Chen, Z., Zhao, Y., 2015. Palaeo-sea-ice changes 992
on the North Icelandic shelf during the last millennium: Evidence from diatom records. Science 993
China-earth Sciences, 58, 962-970. 994
995
Sha, L., Jiang, H., Seidenkrantz, M.-S., Muscheler, R., Zhang, X., Knudsen, M.F., Olsen, J., 996
Knudsen, K.L., Zhang, W., 2016. Solar forcing as an important trigger for West Greenland sea-997
ice variability over the last millennium. Quaternary Science Review, 131, 148–156. 998

32
999
Sha, L., Jiang, H., Seidenkrantz, M.-S., Li, D., Andresen, C.S., Knudsen, K.L., Liu, Y., Zhao, 1000
M., 2017. A record of Holocene sea-ice variability off West Greenland and its potential forcing 1001
factors. Palaeogeography, Palaeoclimatology, Palaeoecology, 475, 115–124. 1002
1003
Shannon, C.E., Weaver,W., 1949. The Mathematical Theory of Communication, University of 1004
Illinois Press, Urbana, 125 pp. 1005
1006
Shimada, K., Kamoshida, T., Itoh, M., Nishino, S., Carmack, E., McLaughlin, F., Zimmermann, 1007
S., Proshutinsky, A., 2006. Pacific Ocean inflow: influence on catastrophic reduction of sea ice 1008
cover in the Arctic Ocean. Geophysical Research Letters, 33, L08605. 1009
http://dx.doi.org/10.1029/2005GL025624. 1010
1011
Smik, L., Belt, S.T., 2017. Distributions of the Arctic sea ice biomarker proxy IP25 and two 1012
phytoplanktonic biomarkers in surface sediments from West Svalbard. Organic Geochemistry, 1013
105, 39–41. 1014
1015
Smik, L., Cabedo-Sanz, P., Belt, S.T., 2016. Semi-quantitative estimates of paleo Arctic sea ice 1016
concentration based on source-specific highly branched isoprenoid alkenes: Afurther 1017
development of the PIP25 index. Organic Geochemistry, 92, 63–69. 1018
1019
Smol, J.P., Stoermer, E.F., 2010. Applications and uses of diatoms: prologue. In: Smol, J.P., 1020
Stoermer, E.F. (eds), The Diatoms: Applications for the Environmental and Earth Sciences. 1021
Cambridge University Press, Cambridge, pp. 3-7. 1022
1023
Starr, M., St-Amand., L, Bérard-Therriault, L., 2002. State of phytoplankton in the Estuary and 1024
Gulf of St. Lawrence during 2001. DFO Canadian Science Advisory Secretariat Research 1025
Document 2002/067, Quebec: Fisheries and Oceans Canada, 23p. 1026
1027
Steele, M., Morison, J., Ermold, W., Rigor, I., Ortmeyer, M., Shimada, K., 2004. Circulation of 1028
summer Pacific halocline water in the Arctic Ocean. Journal of Geophysical Research, 109, 1029
C02027, doi:10.1029/2003JC002009. 1030
1031
Stein, R., Fahl, K., Schreck, M., Knorr, G., Niessen, F., Forwick, M., Gebhardt, C., Jensen, L., 1032
Kaminski, M., Kopf, A., Matthiessen, J., Jokat, W., Lohmann, G., 2016. Evidence for ice-free 1033
summers in the late Miocene central Arctic Ocean. Nature Communications, 7, 1–13. 1034
1035
33
Stein, R., Fahl, K., Gierz, P., Niessen, F., Lohmann, G., 2017. Arctic Ocean sea ice coverduring 1036
the penultimate glacial and the last interglacial. Nature Communications, 8, 373. 1037
1038
Sukhanova, I.N., Flint, M.V., Pautova, L.A., Stockwell, D.A., Grebmeier, J.M., Sergeeva, V.M., 1039
2009. Phytoplankton of the western Arctic in the spring and summer of 2002: Structure and 1040
seasonal changes. Deep-Sea Research Part II, 56, 1223–1236. 1041
1042
Suto, I., 2004. Fossil marine diatom resting spore morpho-genus Xanthiopyxis Ehrenberg in 1043
the North Pacific and Norwegian Sea. Paleontological Research, 8, 283–310. 1044
1045
Tokuhiro, K., Abe, Y., Matsuno, K., Onodera, J., Fujiwara, A., Harada, N., Hirawake, T., 1046
Yamaguchi, A., 2019. Seasonal phenology of four dominant copepods in the Pacific sector of 1047
the Arctic Ocean: Insights from statistical analyses of sediment trap data. Polar Science, 19, 1048
94–111. 1049
1050
Tsoy, I.B., Obrezkova, M.S., 2017. Atlas of Diatom Algae and Silicoflagellates from Holocene 1051
Sediments of the Russian East Arctic Seas. POI FEB RAS, Vladivostok 146 p. 1052
1053
Vare, L.L., Massé, G., Gregory, T.R., Smart, C.W., Belt, S.T., 2009. Sea ice variations in the 1054
central Canadian Arctic Archipelago during the Holocene. Quaternary Science Review, 28, 1055
1354–1366. 1056
1057
von Quillfeldt, C.H., 1997. Distribution of diatoms in the Northeast Water Polynya, Greenland. 1058
Journal of Marine Systems, 211-240. 1059
1060
von Quillfeldt, C.H., 2000. Common Diatom Species in Arctic Spring Blooms: Their 1061
Distribution and Abundance. Botanica Marina, 43, 499-516. 1062
1063
von Quillfeldt, C.H., Ambrose, W.G., Clough, L.M., 2003. High number of diatom species in 1064
first-year ice from the Chukchi Sea. Polar Biology, 26, 806-818. 1065
1066
Walsh, J.J., Dieterle, D.A., Mullerkarger, F.E., Aagaard, K., Roach, A.T., Whitledge, T.E., 1067
Stockwell, D., 1997. CO2 cycling in the coastal ocean. II. Seasonal organic loading of the Arctic 1068
Ocean from source waters in the Bering Sea. Continental Shelf Research, 17, 1-36. 1069
1070
Wang, J., Hu, H., Goes, J. I., Miksisolds, J. L., Mouw, C. B., D’sa, E. J., Gomes, H., Wang, 1071
D.R., Mizobata, K., Saitoh, S., Luo, L., 2013. A modeling study of seasonal variations of sea 1072

34
ice and plankton in the Bering and Chukchi Seas during 2007-2008. Journal of Geophysical 1073
Research: Oceans, 118, 1520-1533. 1074
1075
Wang, Q., Wekerle, C., Danilov, S., Koldunov, N. V., Sidorenko, D., Sein, D., Rabe, B., Jung, 1076
T., 2018. Arctic Sea Ice Decline Significantly Contributed to the Unprecedented Liquid 1077
Freshwater Accumulation in the Beaufort Gyre of the Arctic Ocean. Geophysical Research 1078
Letters, 45, 4956-4964. 1079
1080
Wassmann, P., 2011. Arctic marine ecosystems in an era of rapid climate change. Progress in 1081
Oceanography, 90, 1–17. 1082
1083
Wassmann, P., Bauerfeind, E., Fortier, M., Fukuchi, M., Hargrave, B., Moran, B., Noji, T., 1084
Nöthig, E.-M., Olli, K., Peinert, R., Sasaki, H., and Shevchenko, V., 2004. Particulate organic 1085
carbon flux to the Arctic Ocean sea floor. In: Stein, R., Macdonald, R.W. (eds), The organic 1086
carbon cycle in the Arctic Ocean. Berlin, Springer, pp101–138. 1087
1088
Wassmann, P., Duarte, C.M., Agusti, S., Sejr, M.K., 2011. Footprints of climate change in the 1089
Arctic marine ecosystem. Global Change Biology, 17, 1235–1249. 1090
1091
Watanabe, E., Onodera, J., Harada, N., Honda, M.C., Kimoto, K., Kikuchi, T., Nishino, S., 1092
Matsuno, K., Yamaguchi, A., Ishida, A., Kishi, M.J., 2014. Enhanced role of eddies in the Arctic 1093
marine biological pump. Nature Communication, 5, 3950, doi:10.1038/ncomms4950. 1094
1095
Watanabe, E., Onodera, J., Harada, N., Aita, M.N., Ishida, A., Kishi, J., 2015.Wind-driven 1096
interannual variability of sea ice algal production in thewestern Arctic Chukchi Borderland. 1097
Biogeosciences, 12, 1–22. doi: 10.519/bg-12-1-2015. 1098
1099
Weckström, K., Massé, G., Collins, L. G., Hanhijärvi, S., Bouloubassi, I., Sicre, M., 1100
Seidenkrantz, M.-S., Schmidt, S., Andersen, T.J., Andersen, M.L., Hill, B., Kuijpers, A., 2013. 1101
Evaluation of the sea ice proxy IP25 against observational and diatom proxy data in the SW 1102
Labrador Sea. Quaternary Science Reviews, 79, 53-62. 1103
1104
Weingartner, T., Aagaard, K. Woodgate, R., Danielson, S. Sasaki, Y., Cavalieri, D., 2005. 1105
Circulation on the north central Chukchi Sea shelf. Deep Sea Research, Part II, 52, 3150–3174. 1106
1107
Woodgate, R.A., 2018. Increases in the Pacific inflow to the Arctic from 1990 to 2015, and 1108
insights into seasonal trends and driving mechanisms from year-round Bering Strait mooring 1109

35
data. Progress in Oceanography, 160, 124-154, doi:10.1016/j.pocean.2017.12.007. 1110
1111
Woodgate, R.A., Aagaard, K., Weingartner, T.J., 2005a. Monthly temperature, salinity, and 1112
transport variability of the Bering Strait throughflow. Geophysical Research Letters, 32(4), 1113
L04601, doi:10.1029/2004GL021880. 1114
1115
Woodgate, R., Aagaard, K., Weingartner, T., 2005b. A year in the physical oceanography of the 1116
Chukchi Sea: Moored measurement from autumn 1990–1991. Deep Sea Research, Part II, 52, 1117
3116–3149. 1118
1119
Woodgate, R. A., Weingratner, T., Lindsay, R., 2010. The 2007 Bering Strait oceanic heat flux 1120
and anomalous Arctic sea-ice retreat. Geophysical Research Letters, 37, L01602, 1121
doi:10.1029/2009GL041621. 1122
1123
Woodgate, R.A., Weingartner, T.J., Lindsay, R., 2012. Observed increases in Bering Strait 1124
oceanic fluxes from the Pacific to the Arctic from 2001 to 2011 and their impacts on the Arctic 1125
Ocean water column. Geophysical Research Letters, 39, 6, doi: 10.1029/2012gl054092. 1126
1127
Woodgate, R.A., Stafford, K.M., Prahl, F.G., 2015. A Synthesis of Year-Round Interdisciplinary 1128
Mooring Measurements in the Bering Strait (1990–2014) and the RUSALCA Years (2004–1129
2011). Oceanography, 28, 46-67. 1130
1131
Xiao, X., Fahl, K., Müller, J., Stein, R., 2015. Sea-ice distribution in the modern Arctic Ocean: 1132
Biomarker records from trans-Arctic Ocean surface sediments. Geochimica et Cosmochimica 1133
Acta, 155, 16–29. 1134
1135
Yokoi, N., Matsuno, K., Ichinomiya, M., Yamaguchi, A., Nishino, S., Onodera, J., Kikuchi, T., 1136
2016. Short-term changes in a microplankton community in the Chukchi Sea during autumn: 1137
consequences of a strong wind event. Biogeosciences, 13, 913-923. 1138
1139
Zernova, V.V., Nöthig, E.-M., Shevchenko, V.P., 2000. Vertical microalga flux in the Northern 1140
Laptev Sea (from the data collected by the yearlong sediment trap). Oceanology, 40, 801–808. 1141
1142
Zhang, H., 2009. The Scientific Report on the 3rd Chinese National Arctic Research Expedition. 1143
Ocean Express, Beijing, 225p (in Chinese) 1144
1145
Zhuang, Y., Jin, H., Li, H., Chen, J., Lin, L., Bai, Y., Ji, Z., Zhang, Y., Gu, F., 2016. Pacific 1146
36
inflow control on phytoplankton community in the Eastern Chukchi Shelf during summer. 1147
Continental Shelf Research, 129, 23–32. 1148
1149
Zhuang, Y., Jin, H., Chen, J., Li, H., Ji, Z., Bai, Y., Zhang, T., 2018. Nutrient and phytoplankton 1150
dynamics driven by the Beaufort Gyre in the western Arctic Ocean during the period 2008–1151
2014. Deep-Sea Research Part I, 137, 30–37. 1152
1153
1154
Diatom composition and fluxes over the Northwind Ridge, western
Arctic Ocean: impact of marine surface circulation and sea ice
distribution
Jian Ren et al. Figures captions
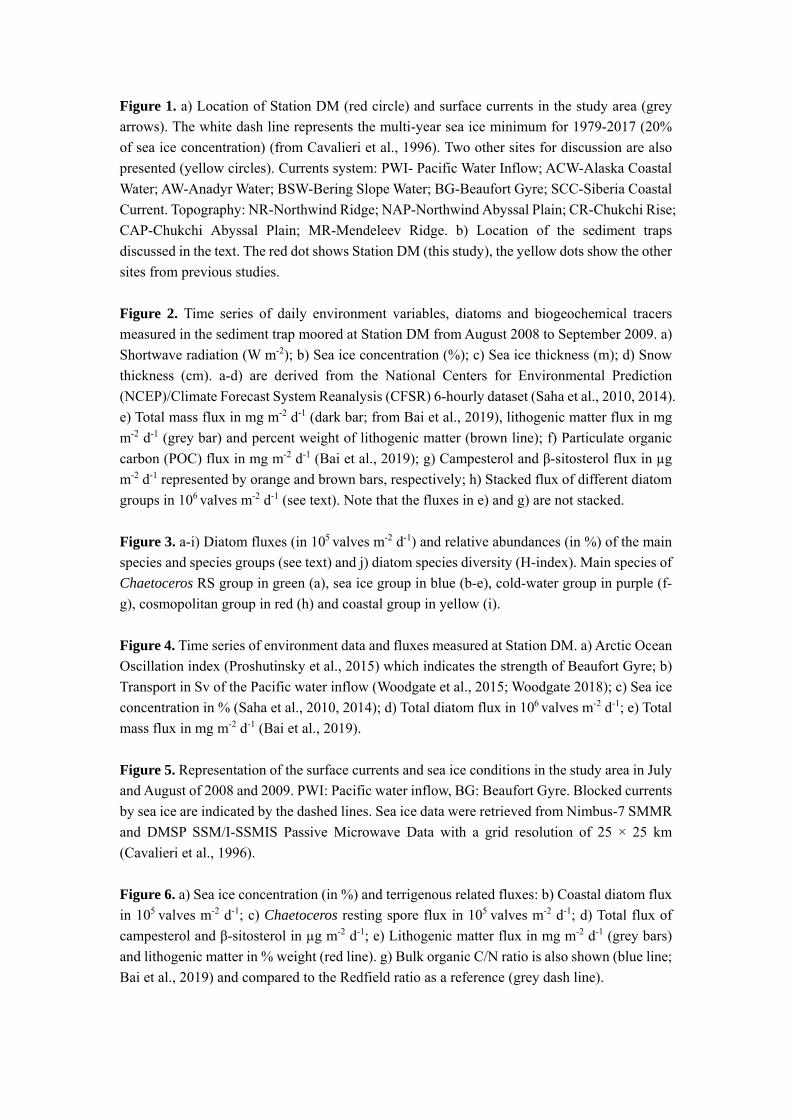
Figure 1. a) Location of Station DM (red circle) and surface currents in the study area (grey
arrows). The white dash line represents the multi-year sea ice minimum for 1979-2017 (20%
of sea ice concentration) (from Cavalieri et al., 1996). Two other sites for discussion are also
presented (yellow circles). Currents system: PWI- Pacific Water Inflow; ACW-Alaska Coastal
Water; AW-Anadyr Water; BSW-Bering Slope Water; BG-Beaufort Gyre; SCC-Siberia Coastal
Current. Topography: NR-Northwind Ridge; NAP-Northwind Abyssal Plain; CR-Chukchi Rise;
CAP-Chukchi Abyssal Plain; MR-Mendeleev Ridge. b) Location of the sediment traps
discussed in the text. The red dot shows Station DM (this study), the yellow dots show the other
sites from previous studies.
Figure 2. Time series of daily environment variables, diatoms and biogeochemical tracers
measured in the sediment trap moored at Station DM from August 2008 to September 2009. a)
Shortwave radiation (W m-2); b) Sea ice concentration (%); c) Sea ice thickness (m); d) Snow
thickness (cm). a-d) are derived from the National Centers for Environmental Prediction
(NCEP)/Climate Forecast System Reanalysis (CFSR) 6-hourly dataset (Saha et al., 2010, 2014).
e) Total mass flux in mg m-2 d-1 (dark bar; from Bai et al., 2019), lithogenic matter flux in mg
m-2 d-1 (grey bar) and percent weight of lithogenic matter (brown line); f) Particulate organic
carbon (POC) flux in mg m-2 d-1 (Bai et al., 2019); g) Campesterol and β-sitosterol flux in µg
m-2 d-1 represented by orange and brown bars, respectively; h) Stacked flux of different diatom
groups in 106 valves m-2 d-1 (see text). Note that the fluxes in e) and g) are not stacked.
Figure 3. a-i) Diatom fluxes (in 105 valves m-2 d-1) and relative abundances (in %) of the main
species and species groups (see text) and j) diatom species diversity (H-index). Main species of
Chaetoceros RS group in green (a), sea ice group in blue (b-e), cold-water group in purple (f-
g), cosmopolitan group in red (h) and coastal group in yellow (i).
Figure 4. Time series of environment data and fluxes measured at Station DM. a) Arctic Ocean
Oscillation index (Proshutinsky et al., 2015) which indicates the strength of Beaufort Gyre; b)
Transport in Sv of the Pacific water inflow (Woodgate et al., 2015; Woodgate 2018); c) Sea ice
concentration in % (Saha et al., 2010, 2014); d) Total diatom flux in 106 valves m-2 d-1; e) Total
mass flux in mg m-2 d-1 (Bai et al., 2019).
Figure 5. Representation of the surface currents and sea ice conditions in the study area in July
and August of 2008 and 2009. PWI: Pacific water inflow, BG: Beaufort Gyre. Blocked currents
by sea ice are indicated by the dashed lines. Sea ice data were retrieved from Nimbus-7 SMMR
and DMSP SSM/I-SSMIS Passive Microwave Data with a grid resolution of 25 × 25 km
(Cavalieri et al., 1996).
Figure 6. a) Sea ice concentration (in %) and terrigenous related fluxes: b) Coastal diatom flux
in 105 valves m-2 d-1; c) Chaetoceros resting spore flux in 105 valves m-2 d-1; d) Total flux of
campesterol and β-sitosterol in µg m-2 d-1; e) Lithogenic matter flux in mg m-2 d-1 (grey bars)
and lithogenic matter in % weight (red line). g) Bulk organic C/N ratio is also shown (blue line;
Bai et al., 2019) and compared to the Redfield ratio as a reference (grey dash line).

Figure 7. a) Fluxes of sea ice diatom in 105 valves m-2 d-1 and IP25 in ng m–2 d–1 (relative to the
internal standard). The occurrence of sea ice diatoms that produces IP25 are indicated by squares.
b) Correlation plot between sea ice diatom flux and IP25 flux (r2 = 0.64; p < 0.01).

1
Diatom composition and fluxes over the Northwind Ridge, western 1 Arctic Ocean: impact of marine surface circulation and sea ice 2 distribution 3 4 5 Jian Ren et al. 6 7 8 Figures 9 10 Figure 1-7 11
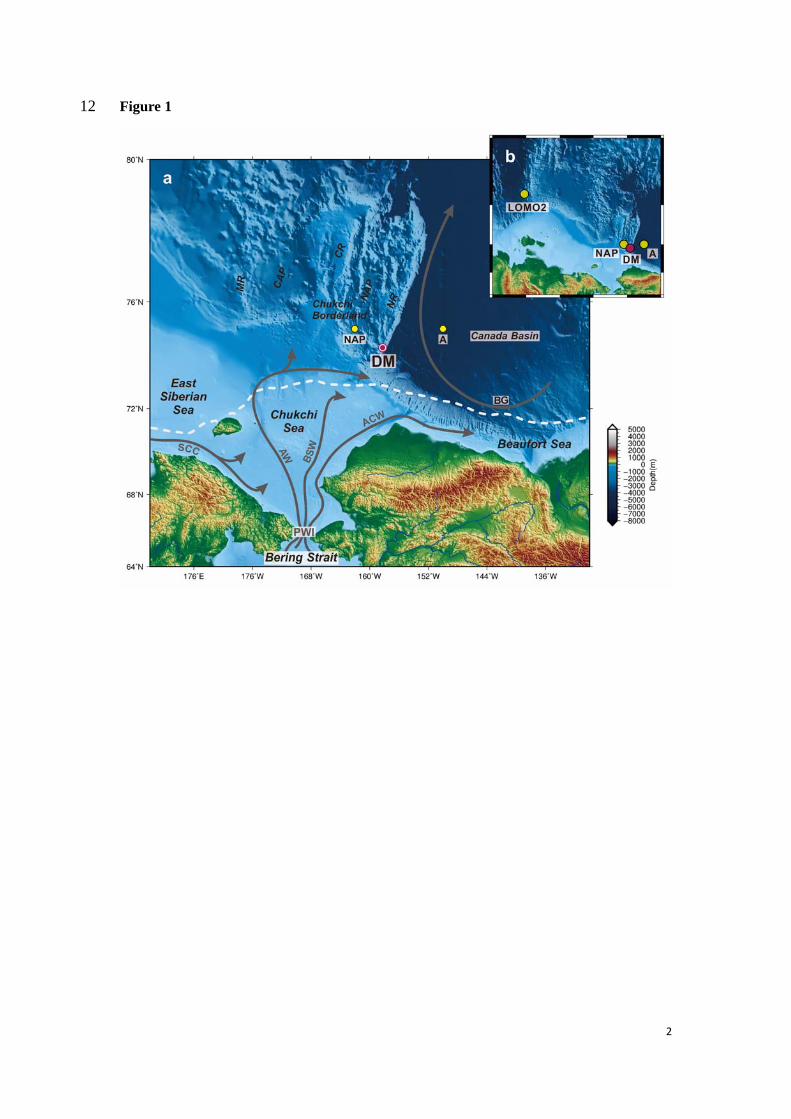
2
Figure 1 12
3
Figure 2 13

4
Figure 3 14
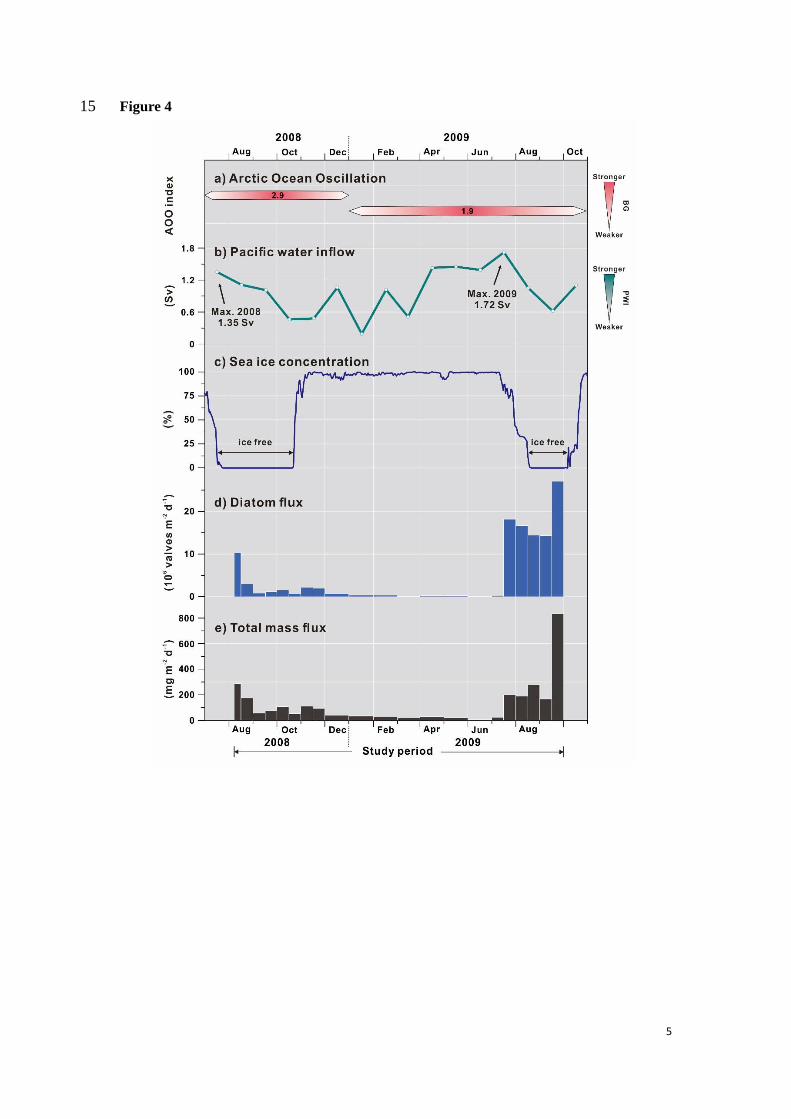
5
Figure 4 15
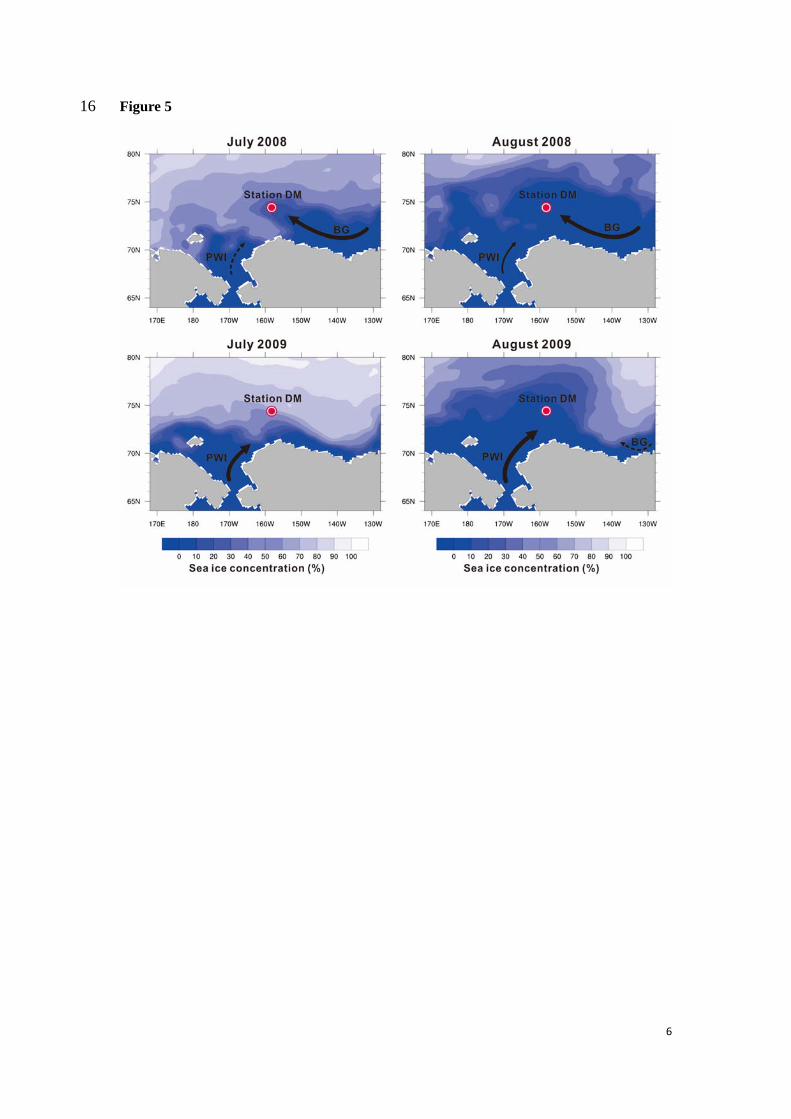
6
Figure 5 16

7
Figure 6 17
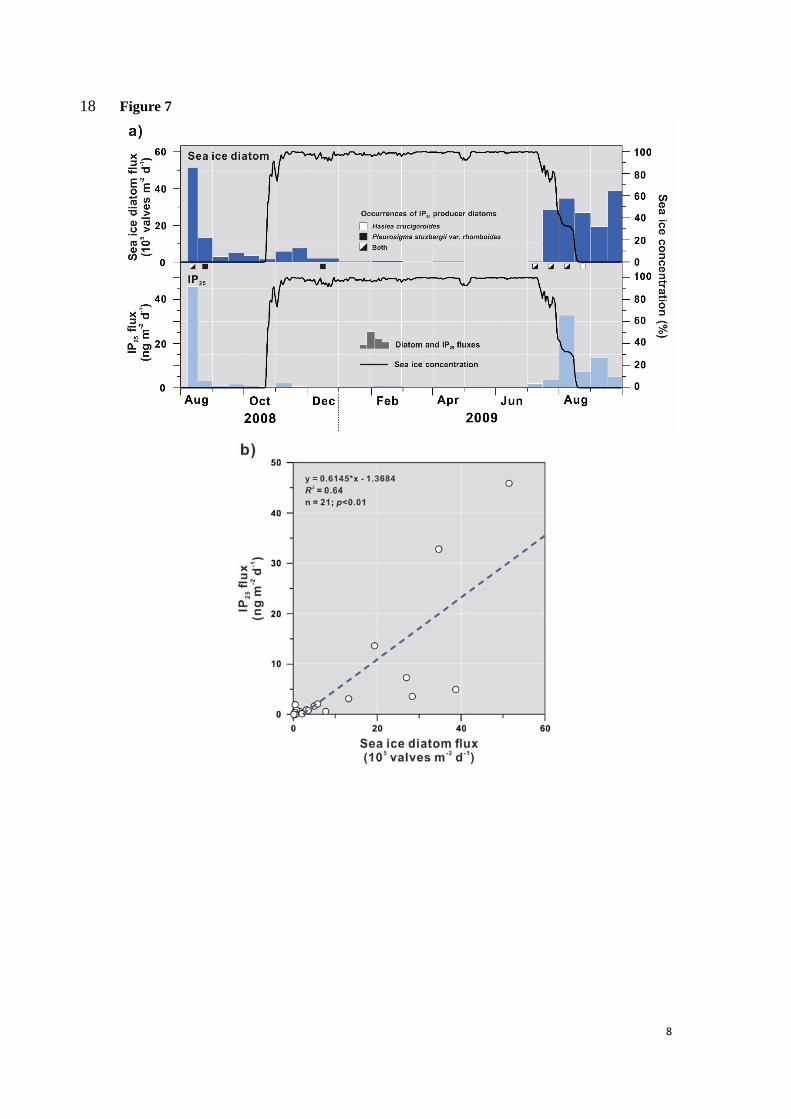
8
Figure 7 18

Diatom composition and fluxes over the Northwind Ridge, western 1
Arctic Ocean: impact of marine surface circulation and sea ice 2
distribution 3
4
5
Jian Ren et al. 6
7
8
Supplementary Figure 9
10
Figure S1 11

Figure S1 12
Figure S1. Wind field of the study area in June, July, August and September of 2008 and 2009. 13
The wind data were retrieved from the NCEP/ NCAR atmospheric reanalysis data of daily 10 14
m-height wind speed (Kistler et al., 2001), with a horizontal resolution of 1.875o. Station DM 15
and sea ice concentration are also shown. 16
17
18
19
20

1
Diatom composition and fluxes over the Northwind Ridge, western 1 Arctic Ocean: impact of marine surface circulation and sea ice 2 distribution 3 4 5 Jian Ren et al. 6 7 8 Table 1-2 9
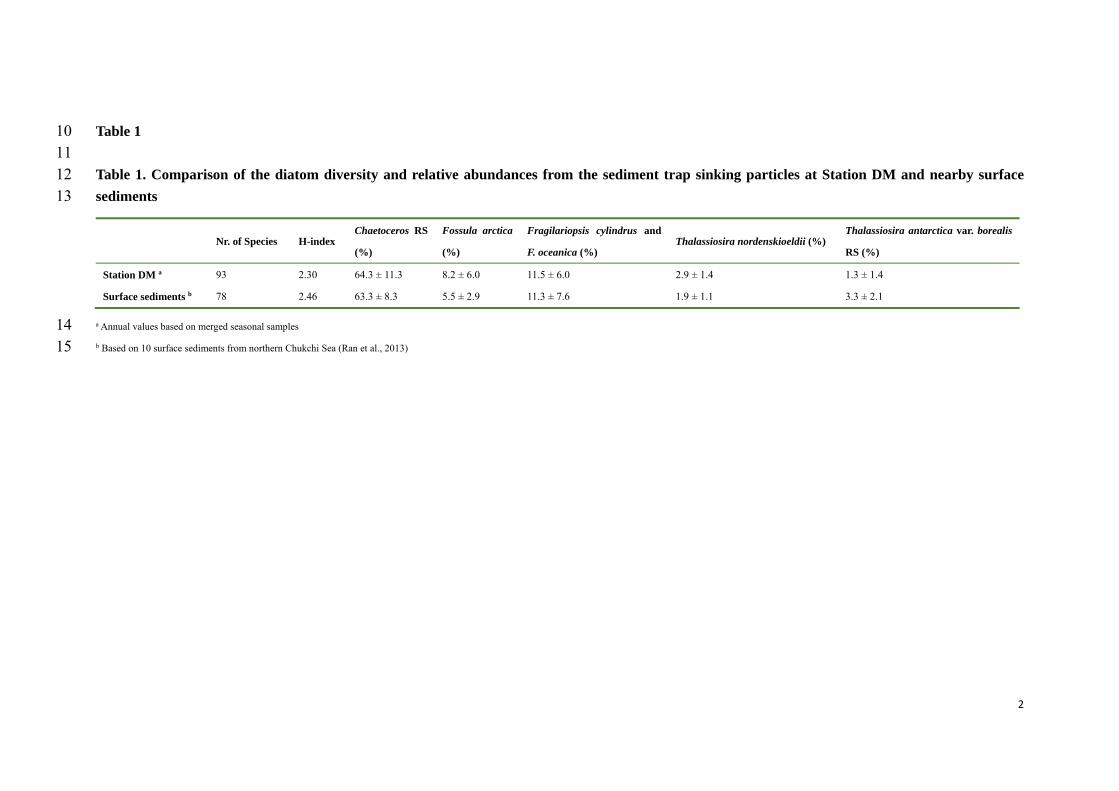
2
Table 1 10 11 Table 1. Comparison of the diatom diversity and relative abundances from the sediment trap sinking particles at Station DM and nearby surface 12 sediments 13
Nr. of Species H-index
Chaetoceros RS
(%)
Fossula arctica
(%)
Fragilariopsis cylindrus and
F. oceanica (%) Thalassiosira nordenskioeldii (%)
Thalassiosira antarctica var. borealis
RS (%)
Station DM a 93 2.30 64.3 ± 11.3 8.2 ± 6.0 11.5 ± 6.0 2.9 ± 1.4 1.3 ± 1.4
Surface sediments b 78 2.46 63.3 ± 8.3 5.5 ± 2.9 11.3 ± 7.6 1.9 ± 1.1 3.3 ± 2.1
a Annual values based on merged seasonal samples 14 b Based on 10 surface sediments from northern Chukchi Sea (Ran et al., 2013) 15

3
Table 2 16 17 Table 2. Coefficient of determination (r2) between fluxes and relative abundances (with and without Chaetoceros RS, respectively) of sea ice diatoms and cold water diatom 18 group, fluxes of brassicasterol and dinosterol and fluxes of IP25 and HBI-III from August 2008 to September 2009 at Station DM. Significant correlations are shown in bold and 19 underlined, while weak correlations are in bold and italic. 20
Sea ice diatom
fluxa
Cold-water diatom
fluxa
Sea ice
diatom %
Cold-water
diatom %
Sea ice diatom %
(without Chaetoceros RS)
Cold-water diaotom %
(without Chaetoceros RS)
Brassicasterol
fluxb
Dinosterol
fluxb
IP25
Fluxc
HBI-III
fluxc
Sea ice diatom fluxa 1 - - - - - - - - -
Cold-water diatom fluxa 0.64* 1 - - - - - - - -
Sea ice diatom % 0.02 0.09 1 - - - - - - -
Cold-water diatom % 0.02 0.09 0.002 1 - - - - - -
Sea ice diatom %
(without Chaetoceros RS)0.11 0.01 0.65* 0.05 1 - - - - -
Cold-water diatom %
(without Chaetoceros RS)0.14 0.54* 0.43* 0.281** 0.21** 1 - - - -
Brassicasterol fluxb 0.44* 0.83* 0.04 0.09 0.01 0.35* 1 - - -
Dinosterol fluxb 0.56* 0.77* 0.06 0.05 0.002 0.45* 0.67* 1 - -
IP25 fluxc 0.64* 0.16 0.09 <0.0001 0.17 0.002 0.03 0.08 1 -
HBI-III fluxc 0.48* 0.03 0.24** 0.02 0.21** 0.06 0.01 0.02 0.75* 1
a in 105 valves m-2 d-1 21 b in μg m-2 d-1 22 c in ng m-2 d-1 23 * p-value < 0.01 24 ** p-value < 0.05 25