dialog axiata plc - amazon s3
TRANSCRIPT

Dialog Axiata PLCSri Lanka's Premier Connectivity Provider
Q3 2020 Results
an axiata company

2
Dialog Axiata Group Performance
Dialog Axiata PLC - Company Performance
Subsidiary Performance – Dialog Broadband and Dialog TV

3
DIALOG GROUP PERFORMANCE HIGHLIGHTS – Q3 2020Stable Q3 2020; YTD Performance Improve on Cost Focus Despite Covid-19 Challenges
Capex Investments Directed to Fulfil Growing Demand for
Data and Digitisation Initiatives
All Key Business SegmentsDelivered Strong
Performance in Q3 20
Aggressive Subscriber Growth
Voice Revenue Rebounded in Q3 20
up 33% QoQ
Fixed
TV
EBITDA Recorded Strong Growth of 45%
QoQ
DTV Revenue Recorded 9% Growth QoQ
Mobile
Fixed
TV
MobileReached 15.3Mn
Subscribers
+1% YoY
Reached 1.5Mn Households by end
September 2020 +11% YoY
Home BB Sub Base+22% YoY
YTD 20 Capex SpendRs12.0Bn
Capex Intensity14%
PoP Coverage Mobile 4G - 93%Fixed 4G - 68%
In April 2020, Dialog contributed a sum of Rs. 200 Million towards the upliftment of Critical Health Infrastructure associated with the COVID-19 pandemic. In May Dialog enabled the commissioning of a 10 Bed ICU at the Negombo Hospital and in November commissioned another 10 Bed ICU at Homagama Hospital. As part of this initiative, Dialog also enabled high-speed PCR testing at the Bandaranaike International Airport (BIA).
Corporate
Social
Responsibility
1 Normalised for Forex Gain/Loss
YTD
1%
4%
3%
RevenueQ3 20 – Rs30.5BnYTD 20 – Rs87.9Bn
EBITDA Q3 20 – Rs13.6BnYTD 20 – Rs36.5Bn
PATQ3 20 – Rs4.8BnYTD 20 – Rs8.6Bn
15% PAT (Norm) 1
YoY
5%
14%
225%
89%
QoQ
8%
27%
108%
230%
Significant improvement in Digital adoption
• Paperless Activations – 100%• E-bills – 64%• E-Payments – 67%

4
GROUP FINANCIAL SUMMARY
1 Norm for forex losses/gains
Rs Mn YTD 2020 YTD 3Q 20 QoQ YoY
Revenue 87,894 +1% 30,471 +8% +5%
EBITDA 36,508 +4% 13,641 +27% +14%
PAT 8,597 +3% 4,797 +108% +225%
OFCF 21,456 +22% 5,507 -19% +3%
EBITDA Margin 41.5% +1.3pp 44.8% +6.8pp +3.7pp
PAT Margin 9.8% +0.2pp 15.7% +7.5pp +10.6pp
ROIC 12.1% -0.2pp 12.1% +2.4pp -0.2pp
PAT 1 9,108 +15% 4,609 +230% +89%
Normalised Performance
LKR to USD depreciated by LKR 3.7 during YTD Sep-20 resulting in a forex loss of LKR 511Mn. Sep'20
USD:LKR at LKR 185.2
Cost Optimisation Generated Rs5.5Bn in cost reduction (Opex Rs2.9Bn +
Capex Rs2.6Bn) in YTD 2020
Covid-19 Impact on YTD Sep 2020Revenue estimated at LKR 4Bn
1 2 3
5
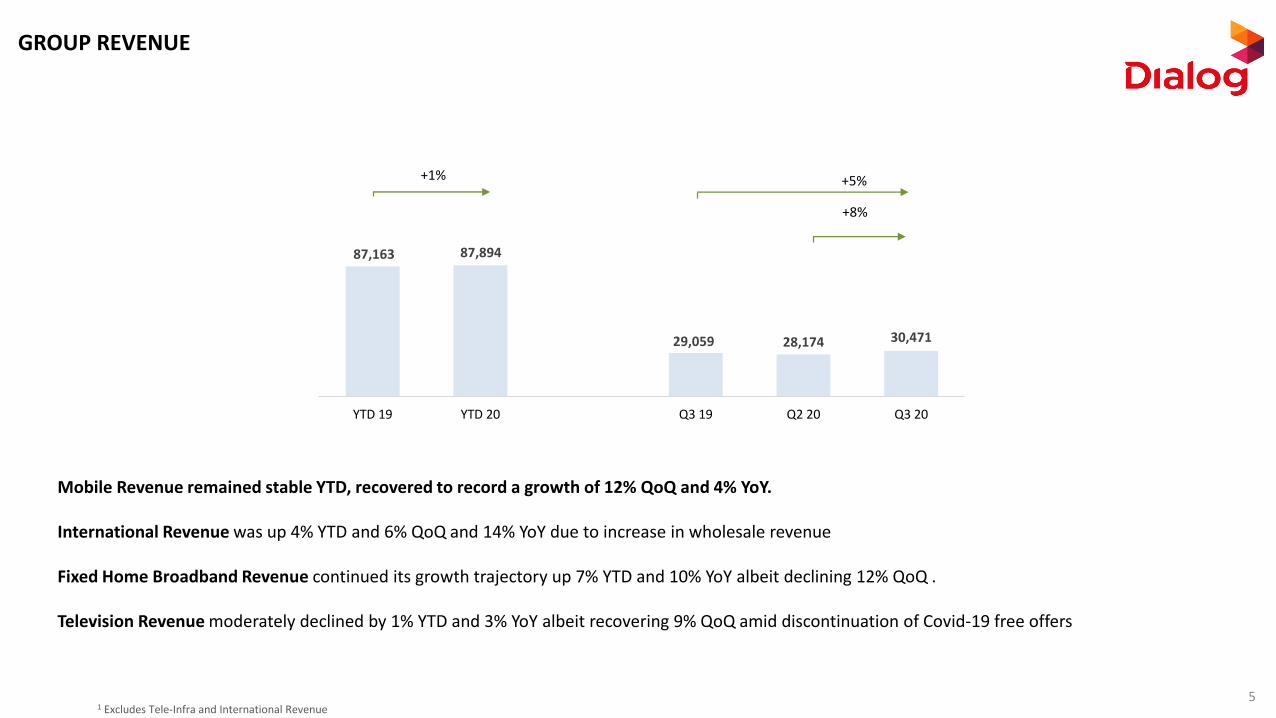
GROUP REVENUE
Mobile Revenue remained stable YTD, recovered to record a growth of 12% QoQ and 4% YoY.
International Revenue was up 4% YTD and 6% QoQ and 14% YoY due to increase in wholesale revenue
Fixed Home Broadband Revenue continued its growth trajectory up 7% YTD and 10% YoY albeit declining 12% QoQ .
Television Revenue moderately declined by 1% YTD and 3% YoY albeit recovering 9% QoQ amid discontinuation of Covid-19 free offers
1 Excludes Tele-Infra and International Revenue
87,163 87,894
29,059 28,174 30,471
0
10, 000
20, 000
30, 000
40, 000
50, 000
60, 000
70, 000
80, 000
90, 000
100 ,000
YTD 19 YTD 20 Q3 19 Q2 20 Q3 20
+8%
+5%+1%

6
GROUP EBITDA AND PAT
PAT Growth Resulting from improved EBITDA, moderate Increase in Depreciation, Decline in Finance Cost coupled with Favorable Forex
EBITDA Growth Driven by Diligent Overall Cost Management
35,046 36,508
11,919 10,702 13,641
40.2% 41.5% 41.0% 38.0% 44.8%0
5,0 00
10, 000
15, 000
20, 000
25, 000
30, 000
35, 000
40, 000
YTD 19 YTD 20 Q3 19 Q2 20 Q3 20
EBITDA EBITDA Margin (Norm)
+14%
(Rs Mn)
+27%
+4%
7,947 8,597
1,4741,397 4,609
401
914
188
511
9689.6% 9.8% 5.1% 8.2%
15.7%
0.0 %
5.0 %
10. 0%
15. 0%
20. 0%
25. 0%
30. 0%
35. 0%
40. 0%
0
1,0 00
2,0 00
3,0 00
4,0 00
5,0 00
6,0 00
7,0 00
8,0 00
9,0 00
10, 000
YTD 19 YTD 20 Q3 19 Q2 20 Q3 20
PAT Forex Gain Forex Loss PAT Margin (Norm)
+225% | Norm +89%
(Rs Mn)
4,797
+108% | Norm +230%
2,442
8,438
2,311
9,108
+3% | Norm +15%

7
FOCUSED CAPEX INVESTMENTS TO ACCOMMODATE URGENT NETWORK UPGRADESCapex Intensity at 14% in YTD 2020
Capex spend of Rs12.0Bn for YTD 20 directed mainly towardsorganization digitization and investments in High-Speed Broadbandinfrastructure consisting mainly of revenue generating capacityupgrades
Investment in Data Infrastructure includes:• 4G capacity upgrades• 4G coverage expansion
OFCF Improvement in YTD 20 Driven by Slowdown in Capex Spend and Focused Working Capital Management
(Rs Mn)
Capex Investments Directed Towards Digitizing and Expanding Data Network; Mobile 4G and Fixed LTE PoP Coverage Reached 93% and 68%
CapexIntensity
(Rs Mn)
13,904 12,033
5,232 2,810
7,273
-
2,00 0
4,00 0
6,00 0
8,00 0
10,0 00
12,0 00
14,0 00
YTD 19 YTD 20 Q3 19 Q2 20 Q3 20
16% 14% 18% 10% 24%
-39%
>+100%
-13%
17,638 21,456
5,358 6,817
5,507
20%24%
18%24%
18%
-15%
-11%
-7%
-3%
1%
5%
9%
13%
17%
21%
25%
29%
33%
37%
(1 ,500)
3,50 0
8,50 0
13,5 00
18,5 00
YTD 19 YTD 20 Q3 20 Q2 20 Q3 20OFCF As a % of Revenue

8
DIALOG GROUP MAINTAINS A STRONG BALANCE SHEET WITH LOW GEARING
30 Sep 20 30 Jun 20 31 Dec 19 30 Sep 19
Gross Debt 39,053 42,761 44,876 46,058
Net Debt 25,722 34,354 39,986 36,586
Cash and Cash Equivalents 13,331 8,407 4,890 9,472
Gross Debt / Equity (x) 0.49 0.58 0.60 0.64
Gross Debt/ EBITDA (x) 0.80 0.93 0.96 0.94
Net Debt/ EBITDA (x) 0.53 0.75 0.86 0.75
(Rs Mn)
1
1 Gross Debt includes Interest Payable on borrowings
1
9
Dialog Axiata Group Performance
Dialog Axiata PLC - Company Performance
Subsidiary Performance – Dialog Broadband and Dialog TV
10
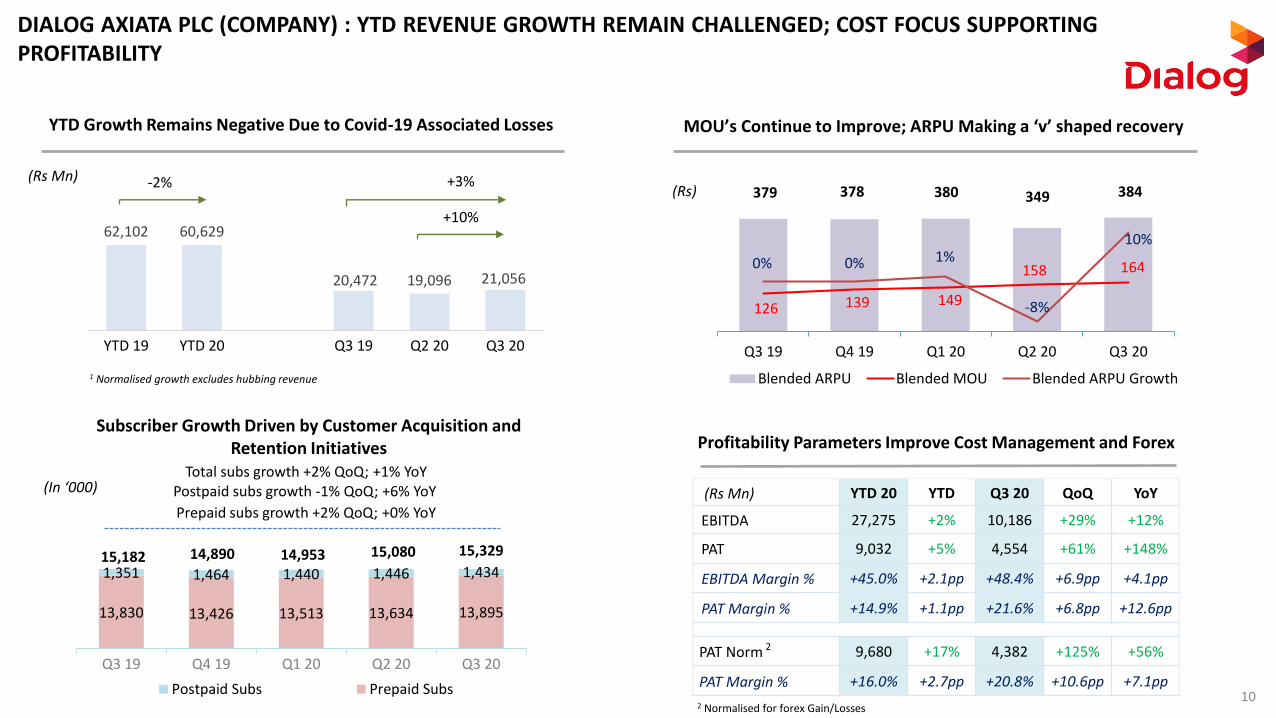
DIALOG AXIATA PLC (COMPANY) : YTD REVENUE GROWTH REMAIN CHALLENGED; COST FOCUS SUPPORTINGPROFITABILITY
13,830 13,426 13,513 13,634 13,895
1,351 1,464 1,440 1,446 1,434
Q3 19 Q4 19 Q1 20 Q2 20 Q3 20
0
2,0 00
4,0 00
6,0 00
8,0 00
10, 000
12, 000
14, 000
Postpaid Subs Prepaid Subs
Subscriber Growth Driven by Customer Acquisition and Retention Initiatives
14,89015,182 14,953 15,080 15,329
Total subs growth +2% QoQ; +1% YoYPostpaid subs growth -1% QoQ; +6% YoY
Prepaid subs growth +2% QoQ; +0% YoY
MOU’s Continue to Improve; ARPU Making a ‘v’ shaped recovery
379 378 380 349 384
126 139 149
158 164 0% 0% 1%
-8%
10%
-10%
-5%
0%
5%
10%
15%
20%
-
50
100
150
200
250
300
350
400
450
500
Q3 19 Q4 19 Q1 20 Q2 20 Q3 20
Blended ARPU Blended MOU Blended ARPU Growth
YTD Growth Remains Negative Due to Covid-19 Associated Losses
(Rs)
(In ‘000)
Profitability Parameters Improve Cost Management and Forex
1 Normalised growth excludes hubbing revenue
(Rs Mn) +3%
+10%
(Rs Mn)
2
2 Normalised for forex Gain/Losses
YTD 20 YTD Q3 20 QoQ YoY
EBITDA 27,275 +2% 10,186 +29% +12%
PAT 9,032 +5% 4,554 +61% +148%
EBITDA Margin % +45.0% +2.1pp +48.4% +6.9pp +4.1pp
PAT Margin % +14.9% +1.1pp +21.6% +6.8pp +12.6pp
PAT Norm 9,680 +17% 4,382 +125% +56%
PAT Margin % +16.0% +2.7pp +20.8% +10.6pp +7.1pp
62,102 60,629
20,472 19,096 21,056
YTD 19 YTD 20 Q3 19 Q2 20 Q3 20
-2%

11
Dialog Axiata Group Performance
Dialog Axiata PLC - Company Performance
Subsidiary Performance – Dialog Broadband and Dialog TV

12
DIALOG TELEVISIONRevenue Recovery in Q3 20 Resulting in Positive QoQ Performance. YTD Performance Challenged due to Covid
515 530 547 555 517
812 903 926 964 960
Q3 19 Q4 19 Q1 20 Q2 20 Q3 20
Post paid Pre Paid
Lower Gross Adds and Churn amid Consumer Wallet Pressure Lead to a drop in Q3 20 Subscribers
Total subs growth -3% QoQ; +11% YoY
Postpaid subs growth -7% QoQ; +6% YoY
Prepaid subs growth +0% QoQ; +25% YoY
1,4731,4331,3281,519 1,477(in ‘000s)
YTD Revenue -1% Despite Strong Revenue Recovery in Q3 2020
(Rs Mn)
+9%
6,523 6,458
2,256 2,021 2,196
0
500
1,0 00
1,5 00
2,0 00
2,5 00
3,0 00
3,5 00
4,0 00
4,5 00
5,0 00
YTD 19 YTD 20 Q3 19 Q2 20 Q3 20
-1% -3%
Profitability Improved on a QoQ basis While YTD Remains Challenged from Revenue Losses in Q2 20 Due to Covid-19 Related Free Offers; YoY in Red due to Lower Revenue Contribution and Higher
Channel, Transponder and Depreciation Cost due to Increased Contract Cost (SLFRS 15)
YTD 20 YTD Q3 20 QoQ YoY
EBITDA 1,663 -9% 601 +56% -19%
PAT -845 >-100% -221 +45% >-100%
EBITDA Margin % +25.8% -2.1pp +27.4% +8.2pp -5.6pp
PAT Margin % -13.1% -7.9pp -10.0% +9.6pp -7.1pp
13
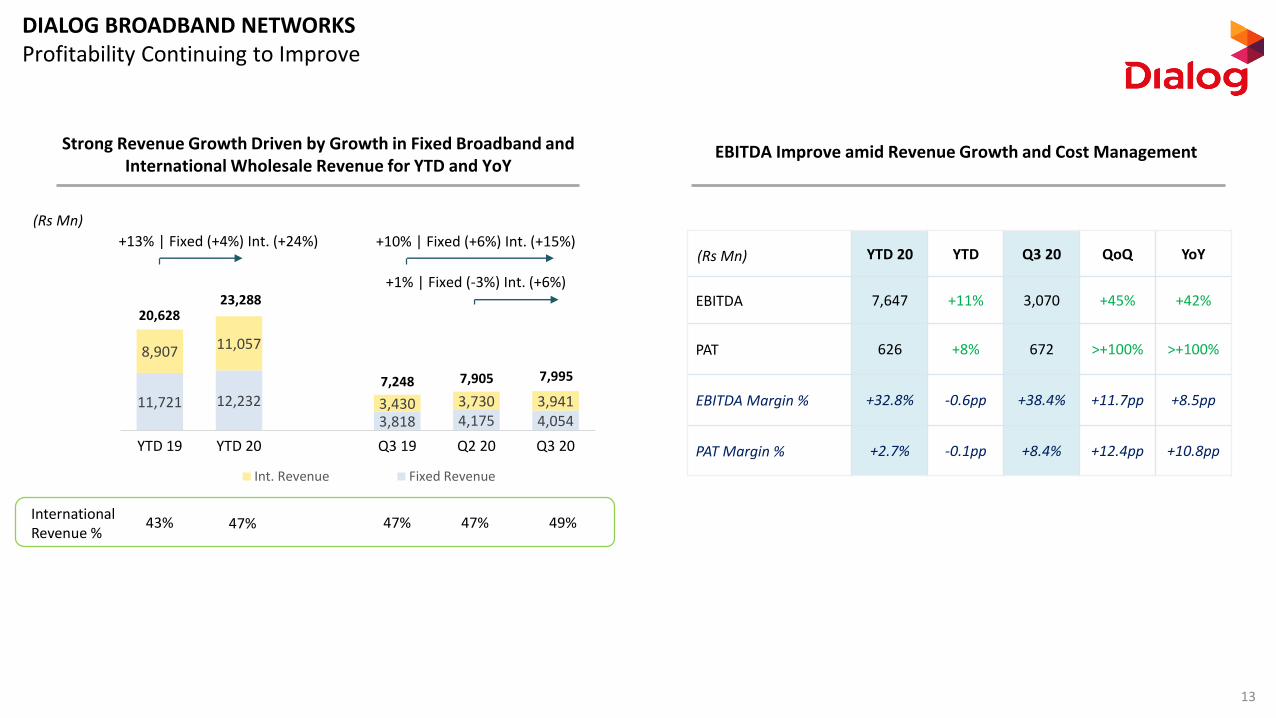
DIALOG BROADBAND NETWORKSProfitability Continuing to Improve
Strong Revenue Growth Driven by Growth in Fixed Broadband and International Wholesale Revenue for YTD and YoY
EBITDA Improve amid Revenue Growth and Cost Management
(Rs Mn)
(Rs Mn)
+10% | Fixed (+6%) Int. (+15%)
+1% | Fixed (-3%) Int. (+6%)
11,721 12,232
3,818 4,175 4,054
8,907 11,057
3,430 3,730 3,941
0
5,0 00
10, 000
15, 000
20, 000
YTD 19 YTD 20 Q3 19 Q2 20 Q3 20
Int. Revenue Fixed Revenue
International Revenue %
49%
7,905
20,628
7,995
+13% | Fixed (+4%) Int. (+24%)
47%47%47%43%
23,288
7,248
YTD 20 YTD Q3 20 QoQ YoY
EBITDA 7,647 +11% 3,070 +45% +42%
PAT 626 +8% 672 >+100% >+100%
EBITDA Margin % +32.8% -0.6pp +38.4% +11.7pp +8.5pp
PAT Margin % +2.7% -0.1pp +8.4% +12.4pp +10.8pp

14
Thank youFor further informationContact : Investor relations Team, Dialog Axiata PLCMobile : +94 777332052Email : [email protected] site : www.dialog.lk