diabetes outcome mellitus outcom outc - uhce …nchod.uhce.ox.ac.uk/diabetes.pdf · netta...
TRANSCRIPT

outcome
ome
outcom
outcoutc
ome
Report of a working group to the Department of Health
health
indicators
outcome
DIABETES MELLITUS

CONTRIBUTORS TO THIS REPORT
Chair: Philip Home
Working group: Colin Bradshaw, Mark Common, Ann Dawson, Ali Foster, Roger Gadsby, Michael Hall, Simon Higgins,Netta Lloyd-Jones, Norma McGough, Chris Newton, Michael O’Brien, Ken Paterson, Robert Snowden,Nick Vaughan, Rhys Williams.
Support groups: Unit of Health- Care Epidemiology, University of Oxford: Michael Goldacre (Project Co-ordinator),Ewan Wilkinson, John Fletcher, Alastair Mason.
CASPE Research, London: James Coles and Robert Cleary.
Edited by: Philip Home, James Coles, Michael Goldacre, Alastair Mason and Ewan Wilkinson for the WorkingGroup on Outcome Indicators for Diabetes.
This report may be referenced as follows:Home P, Coles J, Goldacre M, Mason A, Wilkinson E (eds). Health Outcome Indicators: Diabetes.Report of a working group to the Department of Health. Oxford: National Centre for Health OutcomesDevelopment, 1999.
FOREWORD
The Government consultation document “A First Class Service - Quality in the new NHS”, published in 1998, emphasised three essential aspectsof ensuring delivery of high quality of care by the National Health Service: setting, delivering and monitoring standards. It also discussed theimportance of partnership between the Government and the clinical professions and patients in achieving such quality.
This series of 10 reports concerns the third aspect - monitoring standards. It represents the culmination of work that was started several yearsago under the auspices of the Clinical Outcomes Group, chaired jointly by the then Chief Medical Officer, Sir Kenneth Calman, and the ChiefNursing Officer, Dame Yvonne Moores. The work was commissioned by the former Central Health Outcomes Unit of the Department ofHealth. The Unit has since moved and is now called the National Centre for Health Outcomes Development (NCHOD), based jointly at theInstitute of Health Sciences, University of Oxford and the London School of Hygiene and Tropical Medicine, University of London.
The background to the work was the need to ensure that the NHS is driven by considerations of quality and outcome. The Department wantedto build on an earlier set of Population Health Outcome indicators, which had been limited by the constraints of existing routine data. Ittherefore commissioned systematic work on ten clinical topics, to be undertaken by a Working Group on each, tasked to makerecommendations on ‘ideal indicators’ for each condition. ‘Ideal indicators’ were defined as statistical measures of what should be known, andrealistically could be known, about the outcomes of the condition in routine clinical practice. The Groups were asked to consider a widespectrum of possible uses of outcome indicators, from national monitoring of NHS performance by government to the periodic assessment oflocal services by clinicians and users.
The work of the Working Groups was coordinated by Michael Goldacre, University of Oxford. A particular feature of the work is that theGroups have recommended definitions and technical specifications for each indicator. It is hoped that people interested in monitoring thetopic covered by each indicator will use the same definitions so that comparisons can be facilitated. Moreover, the methodology adopted bythe Working Groups is applicable to developing health outcome indicators for many other conditions.
The publication of these reports, however, is only one further step on a long road of quality assessment in health care. The reports present‘menus’ of suggestions for ways in which outcomes might be monitored in a variety of settings, by a variety of organisations and people. Itgoes without saying that NCHOD will welcome feedback on the reports and on the development and use of outcome indicators.
I believe that the work described here shows the value and potential of partnerships between various parties. Each working group had memberswho brought together perspectives of all the relevant clinical professions plus patients, NHS managers, policy makers, researchers and othersas appropriate. The recommendations of the Working groups show quite clearly how these various perspectives may contribute to a broaderand more balanced monitoring of standards. I would personally like to congratulate and thank everyone who has worked so hard and well tobring this initiative to fruition.
Azim Lakhani (Director - National Centre for Health Outcomes Development)
AM1115-Foreword/Contributors 07/01/2000 05:28 pm Page 5

OUTCOME INDICATORS FOR DIABETES
CONTENTS OF REPORT Page
Summary of recommendations 1
Sections:
1. Introduction to the Report 5
2. Health outcome model for diabetes 7
3. Choice of candidate indicators 15
4. Candidate indicator specifications 21
5. Recommendations 87
Appendices:
A. Background to the work 95
B. Diabetes Working Group 101
C. Methods for choosing indicators 103
D. Guidance notes for indicator specifications 107
E. References 109

Category Page
A 22
E 24
B 26
F 26
F 26
C 28
C 30
C 32
C 34
C 36
C 38
1
Using a variety of check lists including a health outcome model, the Group
identified outcome indicators which were fully specified in a standard format and
are included in this Report. Outcome indicators, whose numbers correspond to the
specifications in Section 4, were grouped under three headings relating to the aim
of the intervention.
Recommendations for implementation were made for each indicator using the
following categories:
A. To be implemented generally on a routine basis.
B. To be implemented generally by periodic survey.
C. To be implemented where local circumstances allow on a routine basis.
D. To be implemented where local circumstances allow by periodic survey.
E. To be implemented following IT developments on a routine basis.
F. To be further developed either because the link with effectiveness is not clear
or the indicator specification is incomplete.
Indicators related to reducing or avoiding risk of diabetes
and appropriate detection of diabetes
1. Prevalence of clinically diagnosed diabetes.
2. Percentage prevalence of retinopathy and maculopathy at the time of
diagnosis of diabetes.
3A. Prevalence of obesity in persons aged 16-64 (defined as BMI > 30 kg/m2).
3B. Proportion of people undertaking rigorous physical activity in the previous 28
days.
3C. Proportion of people who, on average, consume fruit or vegetables or salad
each day, within the general population.
Indicators related to reducing risk of complications
4. Percentage of patients, aged 16 and over and known to have diabetes, who
smoke.
5. Percentage of patients, aged 16-64 and known to have diabetes, who have a
BMI >30 kg/m2.
6. Percentage of patients known to have diabetes with elevated blood pressure:
Type 1>140/90 mm HgType 2 >160/90mm Hg.
7. Percentage of patients known to have diabetes with HbA that was > 7.5%
on a DCCT standardised assay, at time of last recording within the previous
year.
8. Percentage prevalence of retinopathy and maculopathy within a population
known to have diabetes.
9. Percentage prevalence of microalbuminuria within a population known to
have Type 1 diabetes.
SUMMARY OF RECOMMENDATIONS

10. Percentage prevalence of protective sensation loss within a population known
to have diabetes.
11. Percentage prevalence of absence of both pulses in at least one foot within a
population known to have diabetes.
12. Percentage of patients known to have diabetes where there is no record of
blood pressure, the retinae or the feet having been assessed within the
previous year.
13. Percentage prevalence of symptomatic angina within a population known to
have diabetes.
14. Percentage prevalence of claudication within a population known to have
diabetes.
Indicators related to reducing impact of diabetes
15. Number of patients who have had at least one hypoglycaemic emergency,
within the last year, that required therapeutic intervention by a health
professional, expressed as a proportion of a population of patients known to
have diabetes.
16. Number of patients who have had at least one hyperglycaemic emergency,
within the last year, that required hospital admission expressed as a proportion
of a population of patients known to have diabetes.
17. Case fatality rate associated with acute diabetic episodes treated in hospital.
18A. SMR for death due to diabetes mellitus.
18B. Years of life lost per 10,000 resident population by death due to diabetes
mellitus.
18C. Years of life lost by death due to diabetes mellitus.
19. Annual incidence of severe visual impairment (visual acuity < 6/60 in the
better eye) within a population of patients known to have diabetes.
20. Annual incidence of leg amputation above the ankle within a population of
patients known to have diabetes.
21. Annual incidence of amputation below the ankle within a population of
patients known to have diabetes.
22. Annual incidence of myocardial infarction within a population of patients
known to have diabetes.
23. Annual incidence of stroke within a population of patients known to have
diabetes.
24. Number of patients who have started renal replacement therapy or have had a
creatinine level > 500 mol/litre recorded for the first time within the last year,
expressed as a proportion of a population of patients known to have diabetes.
25. Rates of late stillbirth and perinatal mortality in deliveries from a population of
patients known to have diabetes and who become pregnant.
26. The rate of delivery by caesarean section, in deliveries from a population of
patients known to have diabetes and who become pregnant.
C 40
C 42
C 44
C 46
C 48
A 50
A 52
C 54
A 56
A 56
A 56
C 58
C 60
C 62
C 64
C 66
D 68
C 70
C 73
2
Diabetes Outcome Indicators
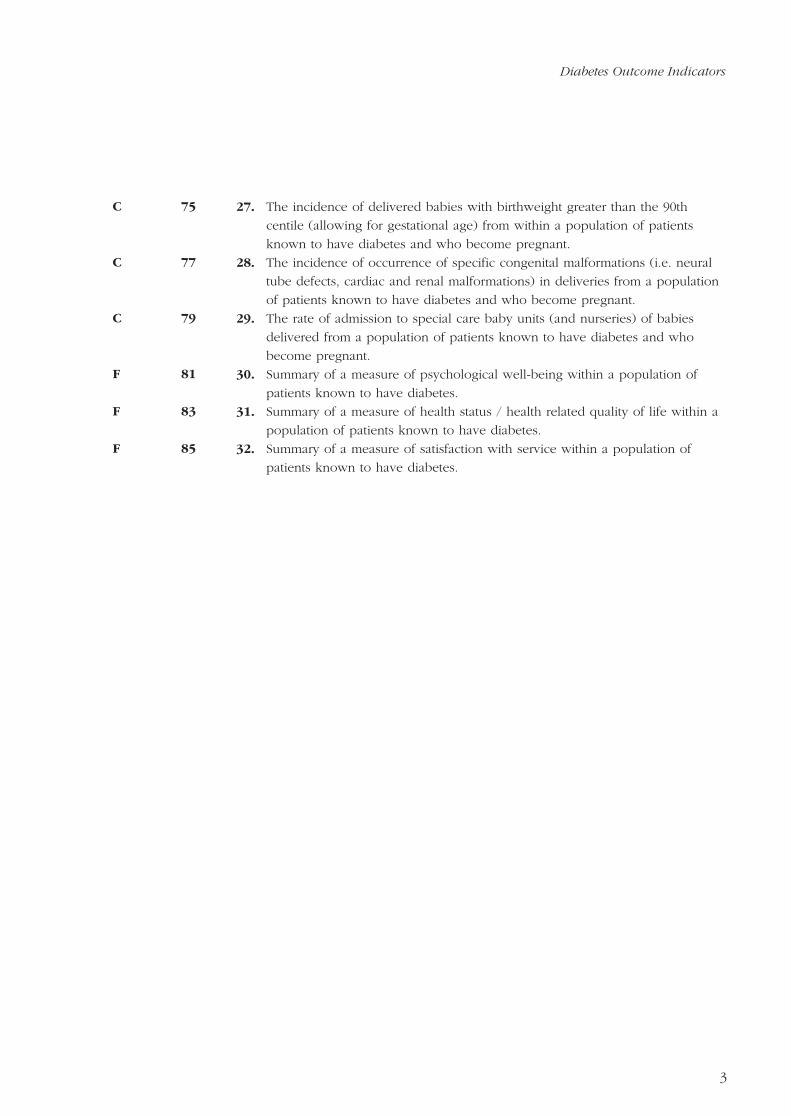
27. The incidence of delivered babies with birthweight greater than the 90th
centile (allowing for gestational age) from within a population of patients
known to have diabetes and who become pregnant.
28. The incidence of occurrence of specific congenital malformations (i.e. neural
tube defects, cardiac and renal malformations) in deliveries from a population
of patients known to have diabetes and who become pregnant.
29. The rate of admission to special care baby units (and nurseries) of babies
delivered from a population of patients known to have diabetes and who
become pregnant.
30. Summary of a measure of psychological well-being within a population of
patients known to have diabetes.
31. Summary of a measure of health status / health related quality of life within a
population of patients known to have diabetes.
32. Summary of a measure of satisfaction with service within a population of
patients known to have diabetes.
C 75
C 77
C 79
F 81
F 83
F 85
3
Diabetes Outcome Indicators

Health outcome indicators
1.1 This Report is one of a series containing the recommendations of working
groups set up to develop ‘ideal’ indicators of the health outcomes of specific
conditions. The background to the work, commissioned by the Department of
Health, is summarised in Appendix A.
1.2 Health outcomes have been defined as changes in health, health related status
or risk factors affecting health, or lack of change when change is expected.
They may be the result of the natural history of the condition or may be the
effect of interventions to prevent or treat it. The particular concern of the
working groups has been to make recommendations about outcomes which
may be attributable to interventions or the lack of them.
1.3 The term ‘indicator’ has been defined as an aggregated statistical measure,
describing a group of patients or a whole population, compiled from
measures or assessments made on people in the group or the population. An
indicator may not necessarily provide answers to whether care has been
‘good’ or ‘bad’; but well chosen indicators, as the term implies, should at least
provide pointers to circumstances which may be worth further investigation.
1.4 An ‘ideal’ indicator has been taken to mean what should be known, and
realistically could be known, about the outcomes of the prevention and care
of specific conditions. The development of the recommendations has, of
course, been tempered by considerations of the likely cost and availability of
information. However, the working groups have tried to be reasonably far-
sighted in their views about future advances in information systems.
1.5 For each condition the working group has developed a menu of indicators
which can be used by different groups of people for a variety of purposes. In
particular, an attempt has been made to recommend, within each set,
indicators which reflect a population, clinical, patient, and in relevant cases, a
carer perspective.
Diabetes Working Group
1.6 The terms of reference and membership of the Group are shown in
Appendix B. The Group included representatives of professional, managerial
and patient groups involved with the prevention and treatment of diabetes.
5
1. INTRODUCTION TO THE REPORT

1.7 The work of the Group had three main components:
- development of check lists including a health outcome model for diabetes
to assist members choose candidate indicators by which is meant potential
indicators worth detailed consideration
- specification of candidate indicators
- recommendations about implementation and further development.
1.8 In this Report:
- the health outcome model is described in Section 2
- check lists for choosing candidate indicators are outlined in Appendix C
- guidelines for specifying candidate indicators are described in Appendix D
- candidate indicators chosen for specification are listed in Section 3
- candidate indicator specifications are included in Section 4
- recommendations about implementation and development are made in
Section 5
- references to all sections and appendices are in Appendix E.
Recommendations
1.9 The recommendations made by the Group were categorised as those which:
- can be implemented generally throughout the NHS as there are systems
available which can provide the requisite data
- could be implemented now where local circumstances allow and more
generally in the near future once expected developments are in place
- will not be possible to implement in the near future but, because of their
desirability, they should be considered in the future development of clinical
and management information systems
- require further work before a recommendation can be made.
1.10 The recommendations have been further categorised as to whether the
requisite indicators should be available:
- routinely on a universal and continuous basis
- from periodic surveys and/or sampling, either at different points in time
nationally or in geographical areas when there is a particular need or
interest.
6
Diabetes Outcome Indicators

Definitions and scope of the work
2.1 Diabetes is a group of disorders with a number of features in common, of
which raised blood glucose is the most evident. The three disorders in this
group which make the most impact on the health of people in this country
are:
- Insulin dependent diabetes mellitus (IDDM or Type 1)
- Non-insulin dependent diabetes mellitus (NIDDM or Type 2)
- Gestational diabetes (or diabetes of pregnancy).
A further group of individuals may be identified who, whilst not meeting the
biochemically defined criteria recommended for the diagnosis of diabetes,
nonetheless do have impaired glucose tolerance.
2.2 The Group decided to exclude from its remit the specific consideration of
children and impaired glucose tolerance and pregnancy associated diabetes.
However, outcomes of pregnancy in women who had diabetes before
becoming pregnant are within the scope of the work.
2.3 The Group recognise that the aetiology and natural history of Type 1 and
Type 2 diabetes are very different. However, many of the serious adverse
health impacts and in particular those arising from damage to the eyes, feet,
kidneys, and heart are eventually common to both types of diabetes, as is the
importance of self management and the impact of this on lifestyle.
Accordingly, despite the differences, the Group felt able to recommend a
common set of indicators, albeit with analysis for the two types of diabetes
always being separate.
Developing a health outcome model
2.4 The greater part of the input to the development of the diabetes outcome
model came from already published national work including:
- Diabetes mellitus: an epidemiologically based needs assessment review
(Williams 1994).
- Standards of clinical care for people with diabetes (Clinical Standards
Advisory Group 1994).
- Chapter on diabetes in the Oxford Textbook of Medicine (Bell and
Hockaday 1996).
- The recommendations of the St. Vincent UK Workgroup (1996).
7
2. HEALTH OUTCOME MODEL FOR DIABETES

2.5 The health outcome model for diabetes was developed as an aid to help
Group members identify potential indicators. The model contains four
elements:
- an overview of the epidemiology of the disorder
- a review of causes and risk factors
- a review of the course, complications and impact of the disorder
- a review of relevant interventions.
Overview of epidemiology
2.6 The prevalence of clinically diagnosed diabetes of all types in England was
once thought to be around 2%, but the recent studies suggest much higher
values, depending to some extent on the racial mix of the particular
population under study. The figure of 2% is likely to be an underestimate of
the true prevalence as many patients with diabetes, particularly Type 2, will be
undiagnosed. The ratio of undiagnosed to diagnosed diabetes will vary with
geographical location. The prevalence of diabetes is higher in the lower socio-
economic groups. The prevalence of Type 2, may be at least twice as high
amongst people of Asian and Afro-Caribbean than European origin.
2.7 The incidence of diabetes in children and adolescents (those aged 0-19 years)
in England is between 10 and 15 new cases per 100,000 population per year.
It is likely that all of these people will present to medical services because
they will nearly all require insulin treatment.
2.8 Care of people with diabetes is costly, consuming around 5-8% of the UK NHS
budget or around £1.25 to 2 billion in the UK (Marks 1996). Most of the
healthcare costs of diabetes result from complications requiring hospital
admission and treatment (Clinical Standards Advisory Group 1994). Foot
problems and cardiovascular disease account for a high proportion of hospital
admissions, considerable disability and, in the case of cardiovascular disease,
considerable premature mortality.
Causes and risk factors
2.9 Type 1, insulin dependent, diabetes often has an onset in childhood or
adolescence, with genetic susceptibility in association mainly with certain HLA
antigen markers and to a much lesser extent with genes on other
chromosomes.
2.10 For clinical diabetes to develop, those with a genetic predisposition must
encounter environmental influences that precipitate diabetes. The precise
factors are unknown.
8
Diabetes Outcome Indicators

2.11 Type 2, non-insulin dependent, diabetes tends to develop during later adult
life and it appears to have a strong genetic component demonstrated by the
frequent finding of a family history of diabetes in patients with the condition.
Obesity and diabetes are often seen in association, and control of blood sugar
and lipid levels may frequently be achieved by attention to weight reduction,
dietary control and increased physical activity.
2.12 Diabetes may sometimes be secondary to other conditions such as pancreatic
and liver disease, hormonal abnormalities, genetically determined syndromes
or drug treatment. Pregnancy may be associated with impaired glucose
tolerance or diabetes in 3% of women generally, but this is considerably
greater in some ethnic groups. Though many of them will not be diabetic after
childbirth, some do continue to have a problem and many develop diabetes in
later life.
Course, complications and impact
2.13 Having diabetes may have a profound impact on social and psychological
well-being as well as physical ill health. As with any chronic disease, a
person’s employment, home life and position in society may come under
pressure, often with implications for the life and health of carers. If the late
complications develop then day to day living may be severely impaired.
2.14 There is a close association between glucose intolerance, obesity,
hypertension, dyslipidaemia, peripheral vascular disease and ischaemic heart
disease. These conditions frequently occur together in the same individual and
cause considerable mortality and morbidity.
2.15 In patients whose diabetes is untreated, including those who have newly
developed the disease, glucose metabolism may be sufficiently disturbed to
cause symptoms. The classic symptoms of high blood sugar are polyuria,
thirst, weight loss and fatigue. Left untreated, patients may become dehydrated
and suffer profound metabolic disturbance, especially if they have Type 1
diabetes, leading to coma and death.
2.16 The main complications of diabetes are eye disease, kidney disease, peripheral
neuropathy, peripheral vascular disease and cardiovascular disease. Estimates
of the prevalence of these complications are shown in Exhibit 1. The
occurrence of all of these complications is lowest in younger people and rises
quite markedly with increasing age.
9
Diabetes Outcome Indicators

Relevant interventions
2.17 The Group reviewed the relevant interventions for diabetes using the following
classification of aims of interventions:
– reduce or avoid risk of diabetes
– detect diabetes early
– reduce risk of complications of diabetes
– reduce the impact of diabetes and its complications once developed.
EXHIBIT 1: BIOMEDICAL IMPACT OF LATE COMPLICATIONS IN THE UK
(St. Vincent UK Workgroup 1996)
Diabetic patients newly requiring renal replacement therapy 600 per annum
Incidence of sight-threatening retinopathy 1.5% per annum
Prevalence of foot ulceration 3.3% per annum
Incidence of lower extremity amputation 0.6-1.0% per
annum
Incidence of new ischaemic heart disease in Type 2 3.2% per annum
Cardiovascular disease as cause of death 55%
Number of people with diabetes in UK 1,210,000
2.18 For practical purposes it is not possible at present to prevent the onset of
Type 1 diabetes. It is probable that the volume of Type 2 diabetes in the
population would be reduced by measures aimed at reducing obesity and
increasing physical activity in the population.
2.19 Those developing insulin dependent diabetes at a younger age are likely to
present to the medical services as they become acutely symptomatic. The
people who may go for years without being diagnosed as diabetic, and who
are therefore exposed to an increased risk of complications, are those with late
onset Type 2 diabetes. These undiagnosed people constitute a significant
proportion of the total population with diabetes. It is possible to screen for
glycosuria in primary care and a small study in the UK has shown that it is
feasible to do this by using urine testing sticks sent by post. Although the
testing is cheap, the logistics of maintaining a continuing surveillance
programme are currently not attractive. However, there are also problems
associated with such an approach which revolve around the sensitivity,
specificity and predictive value of testing in these circumstances, the postal
response rate, the adverse social and psychological consequences of a new
diagnosis in an asymptomatic individual and the size of any benefit to such
patients.
10
Diabetes Outcome Indicators

2.20 With respect to avoiding complications, control of hyperglycaemia is
important in avoiding acute deterioration into metabolic acidosis or
hyperosmolar state and in reducing the risks of acute infections and serious
thrombotic events. Hypoglycaemia is an unpleasant and often feared problem,
and not infrequently results in acute cognitive impairment or even coma.
2.21 It has been accepted for some time by those who care for people with
diabetes that the achievement of as normal a blood glucose concentration as
possible is advantageous in that it will contribute to the reduction or
postponement of long term complications of diabetes. The direct evidence to
support this in Type 1 diabetes has been slow in accumulating but is now
available particularly for diabetic retinopathy and renal disease.
2.22 The risk of long term complications may be reduced by attention to
cardiovascular risk factors such as smoking, hypertension, obesity and
dyslipidaemia.
2.23 There is a large degree of agreement on the aims of diabetes care and how
these might be achieved. These should include:
– maintenance of quality of life
– identification of all those with diabetes
– involvement of all those identified in planned programmes of care
– ensuring that all those with diabetes have access to appropriate education
– maintenance of metabolic control
– control of arterial factors
– elimination of the acute problems of hypo- and hyperglycaemia
– ensuring the early identification and treatment of complications
– improvement of metabolic control pre-conception and in pregnancy.
2.24 Achieving control of diabetes relies heavily on the motivation and
understanding of the condition by people with diabetes and their carers. This
is facilitated and supported by a health care team which has expertise and the
time available to enable patients to manage their diabetes (Clinical Standards
Advisory Group 1994).
11

2.25 The routine care of people with diabetes is often undertaken by a team of
health care staff working in primary and secondary care settings. Specialised
treatment and investigation of diabetes and its complications will usually be
undertaken by a hospital-based or diabetes centre-based team, while more
routine care and regular monitoring of patients is often undertaken by primary
care teams as well as by specialists in hospital out-patient clinics. The relative
effectiveness of diabetes care delivered in different settings has been the
subject of a large number of UK based studies. Such studies suggest that
where practices are enthusiastic and interested in the care of patients with
diabetes there is no detectable difference between general practice and
hospital care for the variables measured. The same is probably not true for the
less interested or less motivated practices or hospitals.
2.26 The Clinical Standards Advisory Group Report (1994) states that high quality
care is most likely to take place, wherever the setting, when the following are
available:
- well defined liaison between hospital and community teams
- trained and motivated personnel
- practice-based register of patients with diabetes, linking to a population-
based register where possible
- protected time for the initiation of treatment, education and follow-up
- clinical and educational audit of activities
- recognition of a protocol for diabetes care
- regular recall of the patients for clinical review
- curriculum for patients’ education.
2.27 Major long term complications of diabetes affecting the eye are retinopathy
and cataract. Small blood vessel disease in the back of the eye may lead to
poor blood supply, haemorrhages, exudate formation and proliferation of
small blood vessels. Laser treatment to the back of the eye is effective in
modifying the course of diabetic retinopathy. Cataracts may be removed and
replaced with an artificial lens, where appropriate, to restore sight and visual
access to the back of the eye by clinicians.
2.28 Coronary artery disease is at least twice as common in patients with diabetes
as in the normal population. Painless ischaemia appears to be more common
with diabetes, making angina an unreliable indicator of myocardial ischaemia.
Congestive cardiac failure is more common following myocardial infarction in
patients with diabetes than those without the condition.
2.29 Modifiable pathogenetic factors in Type 2 diabetes include hyperglycaemia,
dyslipidaemia, hypertension and hypercoagulability, but other factors such as
smoking and ethnic group can also be significant. In people with Type 1
diabetes premature vessel disease is often associated with diabetic renal
disease, when a similar spectrum of pathogenetic factors are often present.
12
Diabetes Outcome Indicators
2.30 Renal impairment may be caused by small vessel disease and made worse by
hypertension. Detection and treatment of renal disease, reduction of blood
pressure and dietary measures are effective at reducing the impact of renal
disease. Effective services are available for the treatment of people with renal
failure, a large proportion of whom have diabetes.
2.31 Peripheral vascular disease may be severe causing poor blood supply to the
feet and legs and a higher incidence of stroke. Impaired blood supply to the
legs makes ulcers and infections particularly problematic and may require
amputation as the only form of treatment in some cases.
2.32 To reduce the impact of the condition, people with diabetes should be
helped to manage the condition themselves as far as possible by improving
patient education and information provision, knowledge of services,
professional support and participation in social networks. Self management
may also have an impact on the physical progression of the disease and its
complications.
2.33 Whilst medical care may be aimed at reducing the risk and impact of
complications, people with diabetes may nonetheless be left with profound
impairments. At the severe end of the spectrum a patient may be blind or
have suffered a stroke or be without the use of a limb or suffer some other
major complication. These physical impairments may result in disability and
handicap and also impact on a person’s social functioning and emotional well-
being.
2.34 Carers, usually the unpaid family and friends, often share much of the burden
of living with diabetes. They cope with the administration of insulin therapy
and self monitoring, share the continuing sufferings of painful neuropathy and
angina and adopt nursing roles for those on dialysis or after a stroke.
13
Diabetes Outcome Indicators

3.1 In choosing candidate indicators the Group took into account work from:
- Audit Working Group of the British Diabetic Association and Royal College
of Physicians funded on a grant from the Department of Health to the
Royal College of Physicians.
- DiabCare Initiative of the World Health Organisation/International Diabetes
Federation (Europe) St Vincent Declaration Initiative.
- CASPE/Freeman Hospital Outcome Project.
- Diabetes Information Management and Audit Group of the British Diabetic
Association.
- Diabetes Optimisation through Information Technology (DOIT) Study
Group of the European Association for the Study of Diabetes.
3.2 To ensure that all potentially useful aspects of outcomes were considered the
matrix in Exhibit 2 was drawn up using the following dimensions:
- aim of interventions (see paragraph 2.17)
- perspectives of measurement (see paragraph C.6).
EXHIBIT 2 : MATRIX FOR DIABETES OUTCOME INDICATORS
Aim of health intervention Primary measurement perspective
Population Clinical Patient
Reduce or avoid risk of diabetes 1, 2, 3A, 3B,
and appropriate detection 3C
Reduce risk of complications:
Risk factors 4, 5, 6, 7
Metabolic control
Markers for late complications 8, 9, 10,
11, 12
Symptoms 13,14
Reduce impact of diabetes:
Incidence of acute complications 15, 16, 17,
18A, 18B, 18C
Incidence of late complications 19, 20, 21,
22, 23, 24
Complications of pregnancy 25, 26, 27,
28, 29
Impact on quality of life 30, 31,
32
15
3. CHOICE OF CANDIDATE INDICATORS

3.3 For each part of the matrix consideration was given to possible indicators. The
following paragraphs describe which indicators where chosen, grouped
together by the aim of the health intervention. The numbers in the text relate
to Exhibit 2 and to the indicator specifications in Section 4.
3.4 With respect to reducing the risk of diabetes development and detecting
the condition early the following indicators were chosen:
1: prevalence of clinically diagnosed diabetes
2: percentage prevalence of retinopathy and maculopathy at the time of
diagnosis of diabetes.
It was agreed that no indicators related to screening the general population for
diabetes should be specified.
3.5 Information about diabetes risk factors are already being collected in national
and other surveys and this includes:
3A: prevalence of obesity in persons aged 16-64 (defined as BMI > 30 kg/m2
3B: proportion of people undertaking rigorous physical activity in the previous
28 days
3C: proportion of people who, on average consume fruit or vegetables or
salad each day, within the general population.
3.6 With respect to the reduction of the risk of complications candidate
indicators have been classified as related to:
- risk factors associated with the development of complications
- metabolic control
- markers for late complications
- symptoms.
3.7 Three candidate indicators were specified with respect to risk factors
associated with the development of complications:
4: percentage of patients, aged 16 and over and known to have diabetes,
who smoke
5: percentage of patients, aged 16-64 and known to have diabetes, who have
a BMI > 30 kg/m2
6: percentage of patients known to have diabetes with elevated blood
pressure: Type 1 > 140/90 mm Hg;Type 2 > 160/90mm Hg.
16
Diabetes Outcome Indicators

3.8 One candidate indicator related to metabolic control was specified:
7: percentage of patients known to have diabetes with HbA that was
> 7.5% on a DCCT standardised assay, at time of last recording within the
previous year.
3.9 As markers of late complications, the following candidate indicators were
specified:
8: percentage prevalence of retinopathy and maculopathy within a
population known to have diabetes
9: percentage prevalence of microalbuminuria within a population known to
have Type 1 diabetes
10: percentage prevalence of protective sensation loss within a population
known to have diabetes
11: percentage prevalence of absence of both pulses in at least one foot
within a population known to have diabetes
12: percentage of patients known to have diabetes where there is no record
of blood pressure, the retinae or the feet having been assessed within the
previous year.
3.10 Two candidate indicators were specified which were related to the onset of
symptoms associated with late complications:
13: percentage prevalence of symptomatic angina within a population known
to have diabetes
14: percentage prevalence of claudication within a population known to have
diabetes.
3.11 With respect to reducing the impact of diabetes candidate indicators have
been classified as related to:
- incidence of acute complications
- incidence of late complications
- complications of pregnancy
- impact on quality of life.
17
Diabetes Outcome Indicators

3.12 The candidate indicators associated with the incidence of acute complications
which have been specified were:
15: number of patients who have had at least one hypoglycaemic
emergency, within the last year, that required therapeutic intervention by
a health professional, expressed as a proportion of a population of
patients known to have diabetes
16: number of patients who have had at least one hyperglycaemic
emergency, within the last year, that required hospital admission
expressed as a proportion of a population of patients known to have
diabetes
17: case fatality rate associated with acute diabetic episodes treated in
hospital
18A: SMR for death due to diabetes mellitus
18B: years of life lost per 10,000 resident population by death due to
diabetes mellitus
18C: years of life lost by death due to diabetes mellitus.
3.13 Candidate indicators related to the occurrence of chronic complications were
specified as follows:
19: annual incidence of severe visual impairment (visual acuity < 6/60 in the
better eye) within a population of patients known to have diabetes
20: annual incidence of leg amputation above the ankle within a population
of patients known to have diabetes
21: annual incidence of amputation below the ankle within a population of
patients known to have diabetes
22: annual incidence of myocardial infarction within a population of patients
known to have diabetes
23: annual incidence of stroke within a population of patients known to
have diabetes
24: number of patients who have started renal replacement therapy or have
had a creatinine level > 500 umol/litre recorded for the first time within
the last year, expressed as a proportion of a population of patients
known to have diabetes.
3.14 For women with pre-existing diabetes who become pregnant, indicators related
to the outcome of pregnancy were specified as follows:
25: rates of late stillbirth and perinatal mortality in deliveries from a
population of patients known to have diabetes and who become
pregnant
26: the rate of delivery by caesarean section, in deliveries from a population
of patients known to have diabetes and who become pregnant
18
Diabetes Outcome Indicators

27: the incidence of delivered babies with birthweight greater than the 90th
centile (allowing for gestational age) from within a population of patients
known to have diabetes and who become pregnant
28: the incidence of occurrence of specific congenital malformations (i.e.
neural tube defects, cardiac and renal malformations) in deliveries from a
population of patients known to have diabetes and who become
pregnant
29: the rate of admission to special care baby units (and nurseries) of babies
delivered from a population of patients known to have diabetes and
who become pregnant.
3.15 Apart from the development of complications, diabetes may affect a variety of
aspects of a patient’s life. Candidate indicators related to the impact on quality
of life were specified as follows:
30: summary of a measure of psychological well-being within a population
of patients known to have diabetes
31: summary of a measure of health status/health related quality of life
within a population of patients known to have diabetes
32: summary of a measure of satisfaction with service within a population of
patients known to have diabetes.
3.16 It was decided not to develop indicators associated with male erectile
impotence or symptomatic neuropathy. There is an absence of accepted and
commonly used definitions of these problems and clinical ascertainment is
highly variable.
3.17 It was not felt possible to make a recommendation about an indicator with
regard to control of blood lipids. Total serum cholesterol and LDL cholesterol
appear from statin trials to have the same predictive value in people with
diabetes as in any other high risk group, but epidemiological evidence points
to low HDL cholesterol and serum triglycerides as being more important.
However, the uncertainty and variability that surround measurement of these
entities post-prandially currently preclude any definite recommendation as
regards their use as indicators.
3.18 Although it was recognised that carers may have an important role to play in
the care of people with diabetes, no candidate indicators were chosen.
However, the Group reviewing outcome indicators for stroke has developed
indicators with a carer perspective and these may be appropriate for carers of
patients with other disorders (Working Group on Outcome Indicators for
Stroke 1997).
19
Diabetes Outcome Indicators


4.1 This section contains the detailed specifications of the candidate indicators
chosen by the Group. To facilitate ease of reference indicators derived from
broadly similar data have been grouped together.
4.2 Guidance notes which explain the attributes used in the specifications are
included in Appendix D.
4.3 The detailed work on the specifications was carried out by James Coles and
Robert Cleary of CASPE Research.
4.4 People with Type 1 (insulin dependent) and Type 2 (non-insulin dependent)
diabetes have a different clinical course. Data from these two groups should
never be analysed together as the proportions within the group will effect the
calculated results. Each indicator should be calculated and reported separately
for Type 1 and Type 2 diabetes.
4.5 In general, clinicians do not follow a single standard in defining people as
having either Type 1 or Type 2 diabetes, resulting in non-comparability
between samples. Accordingly both UK national and international
recommendations are that an epidemiological definition be used, albeit with
the recognition that this might result in the misclassification of a small number
of people with diabetes in either direction. This definition specifies that those
diagnosed before age 35 and requiring insulin treatment be allocated to Type
1 diabetes, while those diagnosed aged 35 or later and requiring any form of
treatment (dietary, with tablets, or with insulin) are classed as having Type 2
diabetes. The Group recognises that the chance of misclassification is higher
in populations with a higher prevalence of diabetes, particularly in some
ethnic groups, where Type 2 diabetes may be quite commonly diagnosed
before the age of 35 years.
21
4. CANDIDATE INDICATOR SPECIFICATIONS
22
Diabetes Outcome Indicators
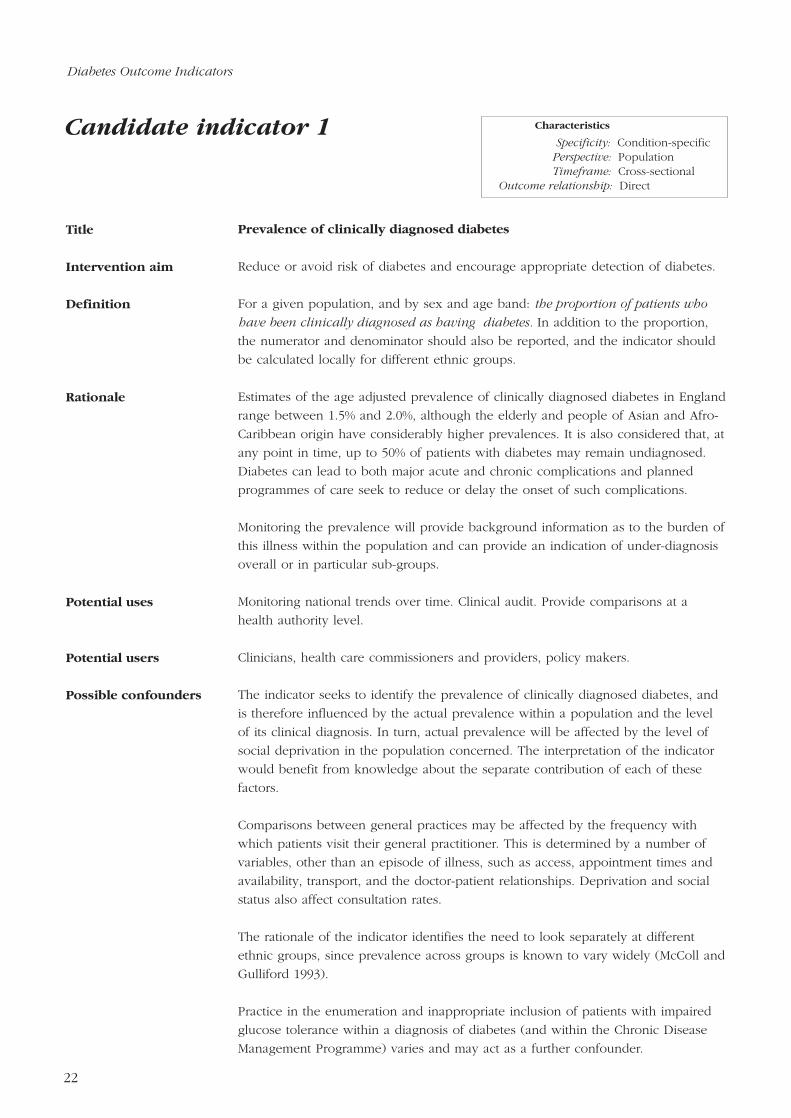
Prevalence of clinically diagnosed diabetes
Reduce or avoid risk of diabetes and encourage appropriate detection of diabetes.
For a given population, and by sex and age band: the proportion of patients who
have been clinically diagnosed as having diabetes. In addition to the proportion,
the numerator and denominator should also be reported, and the indicator should
be calculated locally for different ethnic groups.
Estimates of the age adjusted prevalence of clinically diagnosed diabetes in England
range between 1.5% and 2.0%, although the elderly and people of Asian and Afro-
Caribbean origin have considerably higher prevalences. It is also considered that, at
any point in time, up to 50% of patients with diabetes may remain undiagnosed.
Diabetes can lead to both major acute and chronic complications and planned
programmes of care seek to reduce or delay the onset of such complications.
Monitoring the prevalence will provide background information as to the burden of
this illness within the population and can provide an indication of under-diagnosis
overall or in particular sub-groups.
Monitoring national trends over time. Clinical audit. Provide comparisons at a
health authority level.
Clinicians, health care commissioners and providers, policy makers.
The indicator seeks to identify the prevalence of clinically diagnosed diabetes, and
is therefore influenced by the actual prevalence within a population and the level
of its clinical diagnosis. In turn, actual prevalence will be affected by the level of
social deprivation in the population concerned. The interpretation of the indicator
would benefit from knowledge about the separate contribution of each of these
factors.
Comparisons between general practices may be affected by the frequency with
which patients visit their general practitioner. This is determined by a number of
variables, other than an episode of illness, such as access, appointment times and
availability, transport, and the doctor-patient relationships. Deprivation and social
status also affect consultation rates.
The rationale of the indicator identifies the need to look separately at different
ethnic groups, since prevalence across groups is known to vary widely (McColl and
Gulliford 1993).
Practice in the enumeration and inappropriate inclusion of patients with impaired
glucose tolerance within a diagnosis of diabetes (and within the Chronic Disease
Management Programme) varies and may act as a further confounder.
Title
Intervention aim
Definition
Rationale
Potential uses
Potential users
Possible confounders
Candidate indicator 1 Characteristics
Specificity: Condition-specificPerspective: PopulationTimeframe: Cross-sectional
Outcome relationship: Direct
23
Diabetes Outcome Indicators
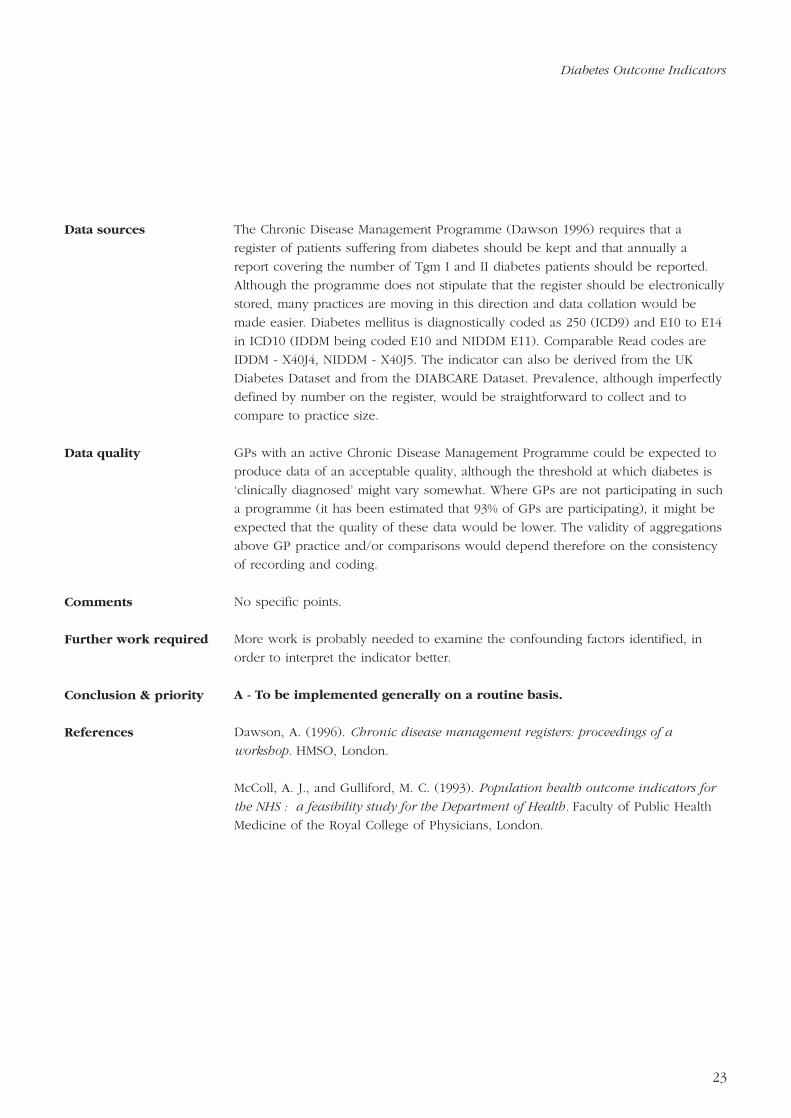
The Chronic Disease Management Programme (Dawson 1996) requires that a
register of patients suffering from diabetes should be kept and that annually a
report covering the number of Tgm I and II diabetes patients should be reported.
Although the programme does not stipulate that the register should be electronically
stored, many practices are moving in this direction and data collation would be
made easier. Diabetes mellitus is diagnostically coded as 250 (ICD9) and E10 to E14
in ICD10 (IDDM being coded E10 and NIDDM E11). Comparable Read codes are
IDDM - X40J4, NIDDM - X40J5. The indicator can also be derived from the UK
Diabetes Dataset and from the DIABCARE Dataset. Prevalence, although imperfectly
defined by number on the register, would be straightforward to collect and to
compare to practice size.
GPs with an active Chronic Disease Management Programme could be expected to
produce data of an acceptable quality, although the threshold at which diabetes is
‘clinically diagnosed’ might vary somewhat. Where GPs are not participating in such
a programme (it has been estimated that 93% of GPs are participating), it might be
expected that the quality of these data would be lower. The validity of aggregations
above GP practice and/or comparisons would depend therefore on the consistency
of recording and coding.
No specific points.
More work is probably needed to examine the confounding factors identified, in
order to interpret the indicator better.
A - To be implemented generally on a routine basis.
Dawson, A. (1996). Chronic disease management registers: proceedings of a
workshop. HMSO, London.
McColl, A. J., and Gulliford, M. C. (1993). Population health outcome indicators for
the NHS : a feasibility study for the Department of Health. Faculty of Public Health
Medicine of the Royal College of Physicians, London.
Data sources
Data quality
Comments
Further work required
Conclusion & priority
References
24
Diabetes Outcome Indicators
Percentage prevalence of retinopathy and maculopathy at the time of
diagnosis of diabetes
Reduce or avoid risk of diabetes and encourage appropriate detection of diabetes.
For a given population, and by sex and age band: the proportion of patients who,
at the time diabetes is clinically diagnosed, are examined for retinopathy (and
separately for maculopathy) and in whom it is found to be present. The indicator
implies collation at a given point in time, probably annually, and that separate
figures are obtained for the rate of examination for retinopathy/maculopathy and
for their prevalence. In each case, numerator and denominator figures should be
reported with the overall proportion.
Retinopathy and maculopathy are known to be markers for adverse visual
outcomes of diabetes and, within a diabetic population, have prevalences of about
8% and 3% (Houston 1982; Neil et al. 1989). Early detection will facilitate early
treatment and reduce their impact by up to 70-80%. Higher prevalences of
retinopathy and maculopathy at the time of diagnosis of diabetes should indicate
delayed diagnosis. The indicator recognises that detection requires both screening
of appropriate patients and the identification of the condition(s).
Clinical audit. Trends over time. Provide comparisons at a health authority level.
Clinicians, health care commissioners and providers.
As mentioned in the definition, the indicator implies that at the time of diagnosis, a
routine examination for retinopathy and maculopathy is made. If this does not
occur, the prevalence of these two conditions will be understated.
This indicator requires a diagnosis of diabetes to be made, and the presence (or
otherwise) of retinopathy (ICD9 code: 250.4, with 362; ICD10 codes: E10.3 to E14.3,
with H36.0; Read code: F4200 - Background diabetic retinopathy, F4201 -
Proliferative diabetic retinopathy, F4202 - Preproliferative diabetic retinopathy) to be
recorded at that time. Maculopathy can be coded in Read codes by X00dG or by
F4203 (Advanced diabetic maculopathy). The indicator can also be derived from
the UK Diabetes Dataset (Vaughan & Home 1995) and from the DIABCARE Dataset
(Piwernetz et al. 1995). The particular fields required are BACKGND, PREPRO,
PROLIF, MACULA and ADV-RET each with a suffix of -R or -L to identify the
particular eye (UKDD) and r_path, r_nonpro, r_prepro, r_prolif and r_adv_di again
with _l and _r suffices (DIABCARE). The denominator is defined by patients
diagnosed with diabetes and the prevalence figure includes patients diagnosed in
earlier years.
Title
Intervention aim
Definition
Rationale
Potential uses
Potential users
Possible confounders
Data sources
Candidate indicator 2 Characteristics
Specificity: Condition-specificPerspective: PopulationTimeframe: Cross-sectional
Outcome relationship: Direct
25
GPs with an active Chronic Disease Management Programme could be expected to
produce data of an acceptable quality although, as with Indicator 1, the threshold at
which diabetes is ‘clinically diagnosed’ might vary somewhat. Where GPs are not
participating in such a programme (it has been estimated that 93% of GPs are
participating), it might be expected that the quality of these data would be lower. A
similar comment might be made about the examination for, and identification of
diabetic retinopathy and maculopathy. The validity of aggregations above GP
practice and/or comparisons would depend therefore on the consistency of
recording and coding.
Prevalence figures smooth the data over time and therefore may lack sensitivity to
change. In this respect, incidence figures may be preferable but they also have
problems related to identification, collection and interpretation.
A continuing need for the standardisation of recording of eye examination findings
according to published standards.
E - To be implemented following IT development on a routine basis
Houston, A. (1982). Retinopathy in the Poole area: an epidemiological inquiry. In
Advances in diabetes epidemiology (ed. E Eschwege). Elsevier Biomedical Press.
Neil, H. A. W., Thomson, A. V., Thorogood, M., Fowler, G. H., and Mann, J. I.
(1989). Diabetes in the elderly: the Oxford community diabetes study. Diabetic
Medicine, 6, 608-613.
Piwernetz, K., Bruckmeier, A., Home, P. D., Kleinbreil, L., van Combrugge, P.,
Sando, S.H., Brundobler, M., Azzopardi, J., Massi Benedetti, M., Tamas, G., and
Kerenyi, S. (1995). Diabetes Data Set: a key element of the DIABCARE quality
network. In The St Vincent Declaration Newsletter, Supplement 1. World Health
Organisation, Copenhagen.
Vaughan, N. J. A., and Home, P. D. for the Diabetes Audit Working Group of the
Research Unit of the Royal College of Physicians and the British Diabetic
Association (1995). The UK Diabetes Dataset: a standard for information exchange.
Diabetic Medicine, 12, 717-722.
Data quality
Comments
Further work required
Conclusion & priority
References
Diabetes Outcome Indicators

26
Diabetes Outcome Indicators
Life style risk factors:
3A. prevalence of obesity in persons aged 16-64 (defined as BMI > 30 kg/m2)
3B. proportion of people undertaking rigorous physical activity in the
previous 28 days
3C. proportion of people who, on average, consume fruit or vegetables or
salad each day, within the general population
Reduce or avoid risk of diabetes and encourage appropriate detection of diabetes.
For a given population, identified separately by sex, age band and time period:
A. Indicator HON A7 from the Public Health Common Data Set - proportion of
persons aged 16 - 64 defined to be obese, having a body mass index (weight
(kg) / height (m2) greater than 30
B. proportion of people aged 16-64 who had undertaken moderate or vigorous
physical activity on four or more occasions within the previous twenty eight
days.
C. proportion of people aged 16-64 who report eating fruit, or vegetables or
salad at least once a day, on average.
Indicator definitions B and C are as used in the periodic Health Survey for England.
Information could be collected at the time of an annual review, and reported by
the following age bands:
i) Aged 16-64
ii) Aged 16-24 and by ten year age bands to 64
iii) Aged 16-44 and 45-64.
A. The obesity indicator is a Health of the Nation indicator (Institute of Public
Health 1995) used to monitor the nation’s movement to targets associated with
coronary heart disease and stroke. Diabetes can increase the likelihood of
coronary heart disease, but obesity is also a risk factor for diabetes itself.
B. Vigorous physical activity will reduce the likelihood of obesity, contributes to
maintaining a healthy circulation and reduces the incidence of diabetes.
C. A healthy diet, including frequent eating of fruit and vegetables, is also likely
to maintain body systems. The indicator, as defined, refers separately to fruit
and vegetables or salad and, to some extent, is constrained by the wording of
the current survey question.
Monitoring these risk factors should reduce the incidence of diabetes in the long
term and can help in the evaluation of educational and health promotion
programmes.
Title
Intervention aim
Definition
Rationale
Candidate indicator 3 Characteristics
Specificity: GenericPerspective: PopulationTimeframe: Cross-sectional
Outcome relationship: Indirect

27
Diabetes Outcome Indicators
Monitoring impact of preventive measures. Trends over time. HA and other
population based comparisons.
Local and national policy makers, commissioners, clinicians, the public.
Indicator B requires consistent definition and interpretation of terms such as
‘moderate’ and ‘vigorous physical activity’. Interpretation of results could be
inhibited should other clinical conditions indicate conflicting activity or dietary
requirements.
Data to be collected at least annually, at a review of the patient’s health, through
measurement and the application of questions as used in the Health Survey for
England, 1994 (Questions 73-80 re: exercise; 91 re: eating of fruit, vegetables etc.)
(Colhoun and Prescott-Clarke 1996). Denominator data to be obtained from mid-
year population estimates at HA or similar level. Read codes permit the recording of
BMI against code 22K.. , or can be calculated from body weight (X76C7) and body
height (X76Bs). Indicator A can also be derived from the UK Diabetes Dataset and
from the DIABCARE Dataset. The particular fields required are ‘BMI’ (UKDD) and
‘weight’ and ‘height’ (DIABCARE). Indicator B can be obtained from Read codes
(138J. through to 138N.) which refer to FITT activity levels in excess of one
occasion of ‘moderate/vigorous activity’ in previous four week period.
Data are obtained through self-reporting, which might cause concern about data
quality, although some clinical validation is possible. The Health Survey has found
data quality acceptable at the macro-level. The validity of aggregation to HA level
or above requires a consistency of recording and coding across practices.
No specific points.
Population studies in respect of indicators B and C to determine their relationship
with the incidence of diabetes.
3A: B - To be implemented generally by periodic survey.
3B & C: F - To be further developed because link with effectiveness is not
clear.
Colhoun, H., and Prescott-Clarke, P. (1996). Health Survey for England 1994. Joint
Health Surveys Unit, SCPR and Dept of Epidemiology and Public Health, University
College, London.
Institute of Public Health (1995). Public Health Common Data Set. University of
Surrey.
Potential uses
Potential users
Possible confounders
Data sources
Data quality
Comments
Further work required
Conclusion & priority
References

28
Diabetes Outcome Indicators
Percentage of patients, aged 16 and over and known to have diabetes, who
smoke
Reduce risk of complications - Risk factors.
For a given population and year: the number of patients aged 16 years and over
and previously diagnosed with diabetes mellitus, who report currently smoking
cigarettes, cigars or pipe divided by the number of patients, in the same age range,
previously diagnosed with diabetes mellitus. The resulting fraction should be
expressed as a percentage and reported together with its denominator, by patient
age-group and sex.
Cessation of cigarette smoking in people with diabetes is an important contributory
factor in the prevention of long term complications e.g. peripheral vascular disease
and cardiovascular disease. People with diabetes are much more susceptible to
such vascular problems, which are exacerbated by smoking.
Monitoring and addressing such risk factors should reduce the incidence of
complications in the long term and can help in the evaluation of educational and
health promotion programmes.
Monitoring impact of preventive measures. Trends over time. HA and other
population based comparisons.
Clinicians, health care commissioners and providers.
Self-reporting of smoking habits is unreliable. However, unless known biases exist,
unreliable responses are likely to occur at random through the population.
Biochemical measurements could be used to validate patient responses, but these
are likely to be considered too intrusive.
The denominator is defined by patients already diagnosed with diabetes who
should be monitored annually. Diabetes mellitus is diagnostically coded as 250
(ICD9) and E10 to E14 in ICD10 (IDDM being coded E10 and NIDDM E11) with
comparable Read codes being IDDM - X40J4, NIDDM - X40J5. Data on smoking
should be collected at least annually, on reviewing the patient’s health, through the
application of questions as used in the Health Survey for England 1994 (Questions
93b for aged 18+; and self completion booklet for 16 and 17 year olds) (Colhoun &
Prescott-Clarke 1996). The Read coding system codes ‘Current smoker’ as Va28x.
The indicator can also be derived from the UK Diabetes Dataset and from the
DIABCARE Dataset. The particular fields required are ‘SMOKING’ (UKDD) and
‘nicot_yn’ (DIABCARE).
Title
Intervention aim
Definition
Rationale
Potential uses
Potential users
Possible confounders
Data sources
Candidate indicator 4 Characteristics
Specificity: Condition-specificPerspective: ClinicalTimeframe: Cross-sectional
Outcome relationship: Direct

29
Diabetes Outcome Indicators
As mentioned above self-reporting of smoking habits can vary in its reliability. The
correct interpretation of trends and/or comparative data will depend on the validity
of the assumption that the degree of reliability is consistent.
No specific points.
Validation of changes in self reporting bias in people within the general population.
C - To be implemented where local circumstances allow on a routine basis
(compiling the indicator annually).
Colhoun, H., and Prescott-Clarke, P. (1996). Health Survey for England 1994. Joint
Health Surveys Unit, SCPR and Dept of Epidemiology and Public Health, University
College, London.
Data quality
Comments
Further work required
Conclusion & priority
References

30
Diabetes Outcome Indicators
Percentage of patients, aged 16-64 and known to have diabetes, who have a
BMI > 30 kg/m2
Reduce risk of complications - Risk factors.
For a given population and year: the number of patients, aged 16 - 64 and
previously diagnosed with diabetes mellitus, who are defined to be obese, having a
body mass index (weight (kg) / height (m2) greater than 30 divided by the number
of patients in the same age range previously diagnosed with diabetes mellitus. The
resulting fraction should be expressed as a percentage and reported together with
its denominator, by patient age-group and sex.
The obesity indicator is a Health of the Nation indicator (Institute of Public Health
1995) used to monitor the nation’s movement to targets associated with coronary
heart disease and stroke. Diabetes can increase the likelihood of coronary heart
disease, but obesity is also a risk factor for diabetes itself and is an important
marker of future problems in diabetic care.
Monitoring and addressing such risk factors should reduce the incidence of
diabetes in the long term and can help in the evaluation of educational and health
promotion programmes.
Monitoring impact of preventive measures. Trends over time. HA and other
population based comparisons.
Clinicians, health care commissioners and providers.
Existing co-morbidities may affect the interpretation of the indicator, although
obesity, however caused, is an important marker of future problems in diabetic
care.
The denominator is defined by patients already diagnosed with diabetes who
should be monitored annually. Diabetes mellitus is diagnostically coded as 250
(ICD9) and E10 to E14 in ICD10 (IDDM being coded E10 and NIDDM E11) with
comparable Read codes being IDDM - X40J4, NIDDM - X40J5. Data concerning
obesity should be collected at least annually, at a review of the patient’s health,
through measurement as made in the Health Survey for England 1994 (Colhoun &
Prescott-Clarke 1996). Read codes BMI as 22K.. which is accompanied by the
recording of the specific value. Alternatively it can be derived from codes X76Bs
(height) and X76C7 (weight). The indicator can also be derived from the UK
Diabetes Dataset and from the DIABCARE Dataset. The particular fields required
are ‘BMI’ (UKDD) and ‘weight’ and ‘height’ (DIABCARE).
Title
Intervention aim
Definition
Rationale
Potential uses
Potential users
Possible confounders
Data sources
Candidate indicator 5 Characteristics
Specificity: Condition-specificPerspective: ClinicalTimeframe: Cross-sectional
Outcome relationship: Direct
31
Diabetes Outcome Indicators
Quality will be dependent on the completeness of the annual review process
within an individual practice i.e. identification of patients with diabetes, and
appropriate monitoring systems.
The validity of aggregations above GP practice and/or comparisons would depend
on the consistency of recording.
No specific points.
None recommended.
C - To be implemented where local circumstances allow on a routine basis
(compiling the indicator annually).
Colhoun, H., and Prescott-Clarke, P. (1996). Health Survey for England 1994. Joint
Health Surveys Unit, SCPR and Dept of Epidemiology and Public Health, University
College, London.
Institute of Public Health (1995). Public Health Common Data Set. University of
Surrey.
Data quality
Comments
Further work required
Conclusion & priority
References

32
Diabetes Outcome Indicators
Percentage of patients known to have diabetes with elevated blood pressure:
Type 1 > 140/90 mm Hg.; Type 2 > 160/90 mm Hg
Reduce risk of complications - Risk factors.
For a given population and year: the number of patients previously diagnosed with
diabetes mellitus, whose resting, sitting blood pressure was found to be elevated ( as
defined by being greater than 140/90 mm Hg. for Type 1 diabetes and greater than
160/90 mm Hg. for Type 2 diabetes and independent of whether they are being
treated by anti-hypertensive therapy), divided by the number of patients previously
diagnosed with the particular Type of diabetes. The resulting fractions should be
expressed as percentages and reported separately, each with its denominator, and
by patient age-group and sex. While assessment of prevalence of hypertension in
the population should be measured independently whether people are treated or
not, recording of the percentage treated with therapy in addition is helpful to the
interpretation of the data.
Long-term blood pressure control in hypertensive patients with Type 2 diabetes
results in a significant reduction in all diabetes related endpoints (UK Prospective
Diabetes Study Group 1998a).
Monitoring and addressing blood pressure should reduce the incidence of
complications in the long term and can help in the evaluation of educational and
health promotion programmes.
Monitoring impact of preventive measures. Trends over time. HA and other
population based comparisons.
Clinicians, health care commissioners and providers.
Existing co-morbidities may affect the interpretation of the indicator, although an
elevated blood pressure, however caused, is an important marker of future
problems in diabetic care.
Consistent measurement of blood pressure can also present problems. Care should
be taken to check the calibration of the instrument periodically. Blood pressure,
like other physical and biochemical measures can be influenced by co-morbidities,
or by short-term factors operating at the time of measurement. Interpretation of
results requires the significance of such factors to be assessed alongside the
progress of the underlying condition.
Title
Intervention aim
Definition
Rationale
Potential uses
Potential users
Possible confounders
Candidate indicator 6 Characteristics
Specificity: Condition-specificPerspective: ClinicalTimeframe: Cross-sectional
Outcome relationship: Direct
33
Diabetes Outcome Indicators
The denominator is defined by patients already diagnosed with diabetes who
should be monitored annually. Diabetes mellitus is diagnostically coded as 250
(ICD9) and E10 to E14 in ICD10 (IDDM being coded E10 and NIDDM E11) with
comparable Read codes being IDDM - X40J4, NIDDM - X40J5. Data concerning
blood pressure should be collected at least annually, at a review of the patient’s
health, using the same instrument and ensuring appropriate calibration. The Read
code for systolic blood pressure is XM02X and for diastolic blood pressure is
XM02Y, each with the recording of the numeric finding. The indicator can also be
derived from the UK Diabetes Dataset and from the DIABCARE Dataset. The
particular fields required are ‘SBP’ and ‘DBP’ (UKDD) and ‘bp_sys’ and ‘bp_dia’
(DIABCARE).
Quality will be dependent on the completeness of the annual review process within
an individual practice i.e. identification of patients with diabetes, and appropriate
monitoring systems.
The validity of aggregations above GP practice and/or comparisons would depend
on the consistency of recording.
A reduced blood pressure in some groups may be contraindicated and this may
affect the interpretation of this indicator.
Understanding of the comparability of data collected in different health care
settings, by different people, and using different procedures.
C - To be implemented where local circumstances allow on a routine basis
(compiling the indicator annually).
UK Prospective Diabetes Study Group (1998a). Tight blood pressure control and
risk of macrovascular and microvascular complications in Type 2 diabetes: UKPDS
38. British Medical Journal, 317, 703-713.
Data sources
Data quality
Comments
Further work required
Conclusion & priority
References

34
Diabetes Outcome Indicators
Percentage of patients known to have diabetes with HbA that was > 7.5% on
a DCCT standardised assay, at time of last recording within the previous
year
Reduce risk of complications - Metabolic control.
For a given population and year: the number of patients previously diagnosed with
diabetes mellitus, whose HbA was, at time of last recording within the previous year,
either greater than
i) 7.5% on a DCCT standardised assay, or (if standardised assay not available)
ii) five S.D. above the local laboratory mean for the normal population, divided
by the number of patients previously diagnosed with diabetes mellitus.
The resulting fraction should be expressed as a percentage and reported together
with its denominator, by patient age-group and sex.
Improved glucose control reduces the incidence of microvascular complications in
Type 2 diabetes in the long term (UK Prospective Diabetes Study Group 1998b)
and can help in the evaluation of educational and health promotion programmes.
Better control of blood glucose levels has been shown to lessen exposure to
hyperglycaemia and the risk of ketoacidosis. Admission rate for diabetics with
ketoacidotic coma (ICD9 250.2) varied, in a six year period, between 26 and 44 per
million inhabitants per year, and for hypoglycaemic coma (ICD9 251.0) from 11 to
66 (Williams 1989). The rate of progression of retinopathy in patients receiving
intensive therapy has been shown to be less than 2 per 100 patient-years when
mean glycosylated haemoglobin is maintained below 7.5% (The Diabetes Control
and Complications Trial Research Group 1993).
Monitoring impact of preventive measures. Trends over time. HA and other
population based comparisons.
Clinicians, health care commissioners and providers.
It should be noted that the five SD alternative is less reliable because estimates of
the normal population distribution depend on the precision (variability) of the
assay as well as the actual distribution. As a result, low precision assays will have a
wider normal distribution and underestimate people with poor blood glucose
control. Additionally, because the distribution of HbA in the population is highly
skewed, this effect is magnified. HbA, like other physical and biochemical measures
can be influenced by comorbidities, or by short-term factors operating at the time
of measurement. Interpretation of results requires the significance of such factors to
be assessed alongside the progress of the underlying condition.
Title
Intervention aim
Definition
Rationale
Potential uses
Potential users
Possible confounders
Candidate indicator 7 Characteristics
Specificity: Condition-specificPerspective: ClinicalTimeframe: Cross-sectional
Outcome relationship: Direct

35
Diabetes Outcome Indicators
The denominator is defined by patients already diagnosed with diabetes who
should be monitored annually. Diabetes mellitus is diagnostically coded as 250
(ICD9) and E10 to E14 in ICD10 (IDDM being coded E10 and NIDDM E11) with
comparable Read codes being IDDM - X40J4, NIDDM - X40J5. Data concerning
blood glucose levels should be collected when patients are reviewed, on an annual
basis, and require high quality measurement and assay control. The indicator also
allows for data to be collected opportunistically at other times throughout the year.
The Read code for measurement of HbA is X772q and is accompanied by the
numerical finding. The indicator can also be derived from the UK Diabetes Dataset
and from the DIABCARE Dataset. The particular fields required are ‘GHB’ (UKDD)
and ‘hba1c’ (DIABCARE).
Quality will be dependent on the completeness of the annual review process within
an individual practice. As described in the ‘Possible confounders’ section, the
measure assumes the validity and accuracy of the normal ranges used. This is
important at individual practice level but its importance is increased at aggregations
above GP practice where collation or comparisons requires consistency of
recording and analysis.
No specific points.
Continuing efforts to standardise HbA assays are needed in accordance with WHO
policy.
C - To be implemented where local circumstances allow on a routine basis
(compiling the indicator annually).
Diabetes Control and Complications Trial Research Group (1993). The effect of
intensive treatment of diabetes on the development and progression of long-term
complications in insulin-dependent diabetes mellitus. New England Journal of
Medicine, 329, 977-986.
UK Prospective Diabetes Study Group (1998b). Intensive blood sugar control with
sulphonylureas or insulin compared with conventional treatment and risk of
complications in patients with Type 2 diabetes: UKPDS 33. Lancet, 352, 837-853.
Williams, D. R. R. (1989). Outcome indicators for diabetes services: what do we
have and what do we need? Community Medicine, 11, 57-64.
Data sources
Data quality
Comments
Further work required
Conclusion & priority
References

36
Diabetes Outcome Indicators
Percentage prevalence of retinopathy and maculopathy within a population
known to have diabetes
Reduce risk of complications - Markers of late complications.
For a given population, and year: the number of patients previously diagnosed with
diabetes mellitus and who, at the time of compilation, are known to have
retinopathy (or maculopathy), divided by the number of patients previously
diagnosed with diabetes mellitus within the given population. The condition of the
worst eye should be considered and the resulting fraction should be expressed as a
percentage and reported as an overall figure and by age-group, sex and where
possible, by severity level of the retinopathy.
Diabetic retinopathy is the single, most common cause of visual disability and
blindness in the middle years of life in most industrialised nations (Kohner et al.
1982) and is preventable by good metabolic control. Prevalence of visual acuity
< 6/60 has been estimated at 2% within the diabetic population. ‘Complex’
retinopathy (retinal neovascularisation, fibrosis retinitis proliferous, more than two
cotton wool spots plus more than two large haemorrhages in either eye) is thought
to have a prevalence of about 8% amongst patients with diabetes, while
maculopathy’s prevalence in this group is about 3% (Williams 1994).
Early detection and effective photocoagulation reduces the risk of blindness by 70 -
80% (Cheng et al. 1975; Diabetic Retinopathy Study Research Group 1981).
Clinical management of patients; clinical audit. Trends over time. HA and other
population based comparisons.
Clinicians, health care commissioners and providers.
As with other prevalence measures, this indicator can be confounded by a lack of
an effective surveillance programme for the condition and /or failure to recognise
the condition in the patient. With the introduction of severity, there will be an
increased likelihood of disagreement on coding at the boundaries between levels.
The denominator is defined by patients already diagnosed with diabetes who
should be monitored annually. Diabetes mellitus is diagnostically coded as 250
(ICD9) and E10 to E14 in ICD10 (IDDM being coded E10 and NIDDM E11) with
comparable Read codes being IDDM - X40J4, NIDDM - X40J5. Diabetic retinopathy
is coded by 362 with 250.4 diabetes with ophthalmic manifestations (ICD9); H36.0A
with E10.3 to E14.3 diabetes with ophthalmic complications (ICD10) and by F420.
(Read) and data should be collected at least annually, at a review of the patient’s
health. Only Read codes different severity levels - (F4202) pre-proliferative
retinopathy and (F4201) proliferative retinopathy. The indicator can also be derived
Title
Intervention aim
Definition
Rationale
Potential uses
Potential users
Possible confounders
Data sources
Candidate indicator 8 Characteristics
Specificity: Condition-specificPerspective: ClinicalTimeframe: Cross-sectional
Outcome relationship: Direct

37
Diabetes Outcome Indicators
from the UK Diabetes Dataset and from the DIABCARE Dataset. The particular fields
required are EYESTATUS (which provides a summary of the status of the retina) or
detailed fields such as BACKGND, PREPRO, PROLIF, MACULA and ADV-RET each
with a suffix of -R or -L to identify the particular eye (UKDD) and r_path, r_nonpro,
r_prepro, r_prolif and r_adv_di again with _l and _r suffices (DIABCARE).
Quality will be dependent on the completeness of the annual review process within
an individual practice i.e. identification of patients with diabetes and with
retinopathy, and the appropriateness of monitoring and recording systems. As
indicated above, recording severity requires the use of the Read codes and it might
be expected that data quality will increase where computerised patient record
systems, that capture such data easily, are in use.
Prevalence figures smooth the data over time and therefore may lack sensitivity to
change. In this respect, incidence figures may be preferable but they also have
problems related to identification, collection and interpretation.
None recommended.
C - To be implemented where local circumstances allow on a routine basis
(compiling the indicator annually).
Cheng, H., Kohner, E. M., Keen, H., Blach, R. H., and Hill, D. W. (1975).
Photocoagulation in the treatment of diabetic maculopathy. Lancet, 306, 1110-1111.
Diabetic Retinopathy Study Research Group (1981). Photocoagulation treatment of
proliferative retinopathy: clinical application. Ophthalmology, 88, 583.
Kohner, E. M., McLeod, D., and Marshall, J. (1982). Diabetes and the eye. In
Complications of diabetes (ed. H. Keen and J. Jarrett). Edward Arnold, London.
Williams, R. (1994). Diabetes mellitus. In Health care needs assessment (ed. A.
Stevens and J. Raftery). Radcliffe Medical Press, Oxford.
Data quality
Comments
Further work required
Conclusion & priority
References

38
Diabetes Outcome Indicators
Percentage prevalence of microalbuminuria within a population known to
have Type 1 diabetes
Reduce risk of complications - Markers of late complications.
For a given population, and year: the number of patients previously diagnosed with
Type 1 diabetes mellitus and who, at the year end, are known to have
microalbuminuria (albumin excretion level >20 (µg/min. in a resting overnight
sample), divided by the number of patients previously diagnosed with Type 1
diabetes mellitus within the given population. The resulting fraction should be
expressed as a percentage and reported as an overall figure and by age-group and
sex.
Microalbuminuria is thought to be an early sign of possible renal failure. Urinary
albumin losses in non-diabetic individuals are small but are greater in the majority
of diabetic patients and can rise markedly after exercise. After only a few years of
diabetes, albumin excretion in a resting overnight sample can rise to over 20
(µg/min, and it is these patients who may be at risk of developing frank
albuminuria and eventual renal failure (Tunbridge and Home 1991).
Initial screening for microalbuminuria is most easily performed on an early morning
sample where an albumin: creatinine ratio of > 2.5 mg/mmol in men and > 3.5
mg/mmol in women would suggest the need for overnight monitoring (Viberti et
al. 1996). Such screening should be performed annually for patients with Type 1
diabetes mellitus.
Clinical management of patients; clinical audit. Trends over time. HA and other
population based comparisons.
Clinicians, health care commissioners and providers.
As with other prevalence measures, this indicator can be confounded by a lack of
effort in screening for the condition and/or failure to recognise the condition in the
patient. This indicator can also be confounded by the misclassification of people
with Type 2 diabetes as Type 1, because of the high prevalence of
microalbuminuria in the Type 2 diabetic population, and the problem that
screening methods are often based on albumin concentrations or albumin:creatinine
ratios rather than the albumin excretion rate.
Title
Intervention aim
Definition
Rationale
Potential uses
Potential users
Possible confounders
Candidate indicator 9 Characteristics
Specificity: Condition-specificPerspective: ClinicalTimeframe: Cross-sectional
Outcome relationship: Direct
39
Diabetes Outcome Indicators
The denominator is defined by patients already diagnosed with Type 1 (primarily
insulin dependent, but see detailed definition in Section 2) diabetes who should be
monitored annually. Insulin dependent diabetes mellitus is diagnostically coded as
250 (ICD9) and E10 in ICD10 with the comparable Read codes being X40J4.
Presence of microalbuminuria is not recorded within ICD9 or 10 which only
recognise ‘Diabetes with renal manifestations or complications’ (250.3 in ICD9),
(E10.2 to E14.2 in ICD10). The Read code for microalbumin excretion rate is X773D
against which the level should be recorded with data being collected at least
annually, at a review of the patient’s health. The indicator can also be derived from
the UK Diabetes Dataset and from the DIABCARE Dataset. The particular fields
required are ‘MICROALB’ (UKDD) and ‘albuminuri’ (DIABCARE).
Quality will be dependent on the completeness of the annual review process within
an individual practice i.e. identification of patients with diabetes and with
microalbuminuria, and the appropriateness of monitoring and recording systems. As
indicated above, recording of this condition requires the use of the Read codes and
it might be expected that data quality will increase where computerised patient
record systems, that capture such data easily, are in use.
Prevalence figures smooth the data over time and therefore may lack sensitivity to
change. In this respect, incidence figures may be preferable but they also have
problems related to identification, collection and interpretation.
None recommended.
C - To be implemented where local circumstances allow on a routine basis
(compiling the indicator annually).
Tunbridge, W. M., and Home, P. D. (1991). Diabetes and endocrinology in clinical
practice. Edward Arnold, London.
Viberti, G-C., Marshall, S., Beech, R., Brown, V., Derben, P., Higson, N., Home, P.,
Keen, H., Plant, M., and Wallis, J. (1996). Report on renal disease in diabetes.
Diabetic Medicine, 13, S6-S12.
Data sources
Data quality
Comments
Further work required
Conclusion & priority
References

40
Diabetes Outcome Indicators
Percentage prevalence of protective sensation loss within a population
known to have diabetes
Reduce risk of complications - Markers of late complications.
For a given population, and year: the number of patients previously diagnosed with
diabetes mellitus and who, at the year end, are known to have developed loss of
protective sensation, in both feet, as defined by the inability to detect a 5.07 nylon
monofilament when it is pressed on the foot until it buckles (a linear pressure of
10g), divided by the number of patients previously diagnosed with diabetes mellitus
within the given population. The resulting fraction should be expressed as a
percentage and reported as an overall figure and by age-group and sex.
Distal sensory neuropathy is a major risk factor for foot ulceration in people with
diabetes and should be monitored at least annually (Edmonds et al. 1996). The
prevalence of diabetic neuropathy increases with age and has been reported to be
5% in the age group 20-29 years, rising to 44.2% in the age group 70-79 (Young et
al. 1993). Neuropathy may be detected using pin prick, vibration (using a tuning
fork), temperature sense and objective testing of vibration using a biothesiometer.
Testing cutaneous sensation with a 5.07 nylon monofilament is thought by many to
be the easiest and most discriminating method of detecting loss of protective
sensation in the practice setting (McNeely et al. 1995). If the patient does not detect
the filament when it is pressed on the foot until it buckles some degree of
protective sensation in the foot has been lost (Sosenko et al. 1990).
Clinical management of patients; clinical audit. Trends over time. HA and other
population based comparisons.
Clinicians, health care commissioners and providers.
As with other prevalence measures, this indicator can be confounded by a lack of
effort in screening for the condition and/or failure to recognise the condition in the
patient.
The denominator is defined by patients already diagnosed with diabetes who
should be monitored annually. Diabetes mellitus is diagnostically coded as 250
(ICD9) and E10 to E14 in ICD10 (IDDM being coded E10 and NIDDM E11) with
the comparable Read codes being IDDM - X40J4, NIDDM - X40J5. Diabetic
polyneuropathy is coded 250.5 with 357.2* in ICD9 and E10.4 to E14.4 with G63.2
in ICD10. The Read code for distal sensorimotor polyneuropathy is X00Ah against
which the level should be recorded with data being collected at least annually, at a
review of the patient’s health. Neuropathy can also be derived from the UK
Diabetes Dataset and from the DIABCARE Dataset although these only identify pin
prick and vibratory sensitivity, the particular fields being ‘PIN-R’, ‘PIN-L’, ‘VIBR-R’
Title
Intervention aim
Definition
Rationale
Potential uses
Potential users
Possible confounders
Data sources
Candidate indicator 10 Characteristics
Specificity: Condition-specificPerspective: ClinicalTimeframe: Cross-sectional
Outcome relationship: Direct

41
Diabetes Outcome Indicators
and ‘VIBR-L’ (UKDD) and ‘f_nor_pi_r’, ‘f_nor_pi_l’, ‘f_nor_vi_r’ and ‘f_nor_vi_l’
(DIABCARE) with each being assessed as normal or abnormal. Cut-off points for
people using a biothesiometer or Reidal-Siffert tuning fork would be 25v and Scale
4 respectively.
Quality will be dependent on the completeness of the annual review process within
an individual practice i.e. identification of patients with diabetes and protective pain
sensation loss, and the appropriateness of monitoring and recording systems. The
use of the filament in measuring diabetic polyneuropathy is strongly recommended,
since the use of other methods is likely to result in a gross underestimate.
Prevalence figures smooth the data over time and therefore may lack sensitivity to
change. In this respect, incidence figures may be preferable but they also have
problems related to identification, collection and interpretation.
Further standardisation on the use of monofilaments in surveillance for diabetic
neuropathy.
C - To be implemented where local circumstances allow on a routine basis
(compiling the indicator annually).
Edmonds, M., Boulton, A., Buckenham, T., Every, N., Foster, A., Freeman, D.,
Gadsby, R., Gibby, O., Knowles, A., Pooke, M., Tovey, F., Unwin, N., and Wolfe, J.
(1996). Report of Diabetic Foot and Amputation Group. Diabetic Medicine, 13, S27-
S43.
McNeely, M. J, Boyko, E. J., Ahroni, J. H., Stensel, V. L., Reiber, G.E., Smith, D. G.,
and Pecoraro, R. E. (1995). The independent contributions of diabetic neuropathy
and vasculopathy in foot ulceration: how great are the risks? Diabetes Care, 18, 216-
219.
Sosenko, J., Kato, M., Soto, R., and Bild, D. E. (1990). Comparison of quantitative
sensory threshold measures for their association with foot ulceration in diabetic
patients. Diabetes Care, 13, 1057-1061.
Young, M. J., Boulton, A. J. M., Macleod, A. F., Williams, D. R. R., and Sonksen, P.H.
(1993). A multicentre study of the prevalence of diabetic neuropathy in the UK
hospital clinic population. Diabetologia, 36, 150-154.
Data quality
Comments
Further work required
Conclusion & priority
References

42
Diabetes Outcome Indicators
Percentage prevalence of absence of both foot pulses in at least one foot
within a population known to have diabetes
Reduce risk of complications - Markers of late complications.
For a given population, and year: the number of patients previously diagnosed with
diabetes mellitus and who, at the year end, are identified as having both foot pulses
absent in at least one foot, divided by the number of patients previously diagnosed
with diabetes mellitus within the given population. The resulting fraction should be
expressed as a percentage and reported as an overall figure and by age-group and
sex. Additionally, the proportion of known patients, examined within the year,
should be reported.
Peripheral vascular disease in the diabetic patient is more diffuse and distal than in
non-diabetic individuals (Edmonds et al. 1996). Absent peripheral pulses may
indicate that the feet are threatened by ischaemia which can lead to ulcers, necrosis
and eventual amputation. Pecoraro et al. (1990) and Stebbings and Wood (1991)
have shown that early and effective intervention can reduce the need for major
limb amputations.
Clinical management of patients; clinical audit. Trends over time. HA and other
population based comparisons.
Clinicians, health care commissioners and providers.
As with other prevalence measures, this indicator can be confounded by a lack of
effort in screening for the condition and/or failure to recognise the condition in the
patient.
The denominator is defined by patients already diagnosed with diabetes who
should be monitored annually. Diabetes mellitus is diagnostically coded as 250
(ICD9) and E10 to E14 in ICD10 (IDDM being coded E10 and NIDDM E11) with
the comparable Read codes being IDDM - X40J4, NIDDM - X40J5. Diabetes with
peripheral circulatory disorders is coded 250.6 with 443.8* in ICD9 and E10.5 to
E14.5 with I79.2* in ICD10. Within the Read codes, a code exists for absent
peripheral pulse - Xa7sp, while more specificity could be gained by recording
absence of posterior tibial pulse (Xa7sx with 24E7 for right foot, and 24F7for left
foot) and absence of dorsalis pedis pulse (Xa7sy with 24E9 for right foot, and 24F9
for left foot). The indicator can also be derived from the UK Diabetes Dataset and
from the DIABCARE Dataset. The particular fields required are ‘PULSES-R’ and
‘PULSES-L’ (UKDD) and ‘f_p_prs_r’ and ‘f_p_prs_l’ (DIABCARE). Data should be
collected at least annually, at a review of the patient’s health.
Title
Intervention aim
Definition
Rationale
Potential uses
Potential users
Possible confounders
Data sources
Candidate indicator 11 Characteristics
Specificity: Condition-specificPerspective: ClinicalTimeframe: Cross-sectional
Outcome relationship: Direct

43
Diabetes Outcome Indicators
Quality will be dependent on the completeness of the annual review process within
an individual practice i.e. identification of patients with diabetes and protective pain
sensation loss, and the appropriateness of monitoring and recording systems.
Prevalence figures smooth the data over time and therefore may lack sensitivity to
change. In this respect, incidence figures may be preferable but they also have
problems related to identification, collection and interpretation.
None recommended.
C - To be implemented where local circumstances allow on a routine basis
(compiling the indicator annually).
Edmonds, M., Boulton, A., Buckenham, T., Every, N., Foster, A., Freeman, D.,
Gadsby, R., Gibby, O., Knowles, A., Pooke, M., Tovey, F., Unwin, N., and Wolfe, J.
(1996). Report of Diabetic Foot and Amputation Group. Diabetic Medicine, 13, S27-
S43.
Pecoraro, R. E., Geiber, G. E., and Burgess, E. M. (1990). Pathways to diabetic limb
amputation. Diabetes Care, 13, 513-521.
Stebbings, W. S. L., and Wood, R. F. M. (1991). Amputations in diabetics. Annals of
Royal College of Surgeons of England, 73, 170-175.
Data quality
Comments
Further work required
Conclusion & priority
References

44
Diabetes Outcome Indicators
Percentage of patients known to have diabetes where there is no record of
blood pressure, the retinae or the feet having been assessed within the
previous year
Reduce risk of complications - Markers of late complications.
For a given population, and year: the number of patients previously diagnosed with
diabetes mellitus and whose medical notes, at the year end, contain no record of
their:
i) blood pressure
ii) retinae, or
iii) feet
being assessed in the previous year, divided by the number of patients previously
diagnosed with diabetes mellitus within the given population. The resulting fraction
should be expressed as a percentage and reported as an overall figure and by age-
group and sex.
Previous indicators identify the potential benefits, in terms of risk reduction, that
might be occasioned by the early detection of high blood pressure, retinopathy and
foot problems (including ulceration). Conversely, this indicator identifies the
proportion of patients that have been diagnosed with diabetes, yet appear not to
have received at least one of the three monitoring checks outlined, recognised as
minimum aspects of good practice (British Diabetic Association 1993). As such, it
measures the proportion of this population (possibly through migration or through
non-attendance) that have not received basic care.
Clinical management of patients; clinical audit. Trends over time. HA and other
population based comparisons.
Clinicians, health care commissioners and providers.
This indicator requires the reporting of a departure from recommended good
practice and an apparent failure of health services. As such it might be expected
that there will be a level of under-reporting. Unlike other measures where
unreliable responses are likely to occur at random through the population, under
reporting of this indicator is more likely to occur where difficulties have been
experienced. Validation of this indicator is likely to be needed to ensure its value.
Title
Intervention aim
Definition
Rationale
Potential uses
Potential users
Possible confounders
Candidate indicator 12 Characteristics
Specificity: Condition-specificPerspective: ClinicalTimeframe: Cross-sectional
Outcome relationship: Indirect

45
Diabetes Outcome Indicators
The denominator is defined by patients already diagnosed with diabetes who
should be monitored annually. Diabetes mellitus is diagnostically coded as 250
(ICD9) and E10 to E14 in ICD10 (IDDM being coded E10 and NIDDM E11) with
comparable Read codes being IDDM - X40J4, NIDDM - X40J5. Data on the
monitoring of the three features noted should be collected at least annually, at a
review of the patient’s health.
The appropriate Read codes are as follows:
- measurement of blood pressure: systolic BP reading XM02X
diastolic BP reading XM02Y (both
with scope to add numeric finding)
- degree of retinopathy: F4202 and F4201
- examination of the foot: Xa2hv (non-disease specific) or Xa1J5
(observations on the diabetic foot & laterality attributes).
The indicator can also be derived from the UK Diabetes Dataset and from the
DIABCARE Dataset. The particular fields required are ‘SBP’, ‘DBP’, ‘EYECHECK’ and
‘CHIROPODY’ (UKDD) and ‘bp_sys’, ‘bp_dia’, ‘r_12’ and ‘f_12’ (DIABCARE),
although results of eye and foot examinations entered in other fields would also
imply a review had taken place.
As mentioned above the reporting of adverse events i.e. omission to carry out
checks could be expected to vary in its reliability, therefore it is recommended that
the data are collected in terms of where such checks have been recorded and their
complement then calculated. The strength of this intermediate outcome measure lies
in its expected correlation to future complications. The correct interpretation of
trends across time and/or through the use of comparative data depends on the
reliability of the measure which may require validation.
No specific points.
Develop means of validating and assuring the quality of the indicator.
C - To be implemented where local circumstances allow on a routine basis
(compiling the indicator annually).
British Diabetic Association (1993). What diabetic care to expect: the British Diabetic
Association’s Patients’ Charter. British Diabetic Association, London.
Data sources
Data quality
Comments
Further work required
Conclusion & priority
References

46
Diabetes Outcome Indicators
Percentage prevalence of symptomatic angina within a population known to
have diabetes
Reduce risk of complications - Symptoms.
For a given population, and year: the number of patients previously diagnosed with
diabetes mellitus and who, at the year end, have been identified as having
symptomatic angina, divided by the number of patients previously diagnosed with
diabetes mellitus within the given population. The resulting fraction should be
expressed as a percentage and reported as an overall figure and by age-group and
sex.
Ischaemic heart disease is very common in people with diabetes, the relative risk of
myocardial infarction possibly being four in middle aged men, and rather higher in
women (Tunbridge and Home 1991). The incidence of all macrovascular disease is
greater in diabetic patients with the prevalence of angina, in a group aged over 60,
having been estimated at 11% (Neil et al. 1989). Good control of diabetes should
be important in preventing, or limiting, the gradual development of arterial disease.
Blood glucose control and dietary attention are important features in preventing
this and other complications. Education efforts focusing on risk factors including
diet and smoking can also influence the indicator (Yudkin et al. 1996).
Clinical management of patients; clinical audit. Trends over time. HA and other
population based comparisons.
Clinicians, health care commissioners and providers.
As with other prevalence measures, this indicator is often confounded by a failure
to diagnose the co-morbid condition in the patient.
The denominator is defined by patients already diagnosed with diabetes who may
well be on a chronic disease management register. Diabetes mellitus is
diagnostically coded as 250 (ICD9) and E10 to E14 in ICD10 (IDDM being coded
E10 and NIDDM E11) with the comparable Read codes being IDDM - X40J4,
NIDDM - X40J5. Angina should be coded 413 in ICD9 and I20 in ICD10. The Read
code for angina is G33.. . The angina code should fall in the primary diagnosis
position with diabetes defined as a secondary condition, although the combination
of both codes being present at the time of an annual review is probably sufficient.
The indicator can also be derived from the UK Diabetes Dataset and from the
DIABCARE Dataset. The particular fields required are ‘ANGINA’ (UKDD) and
‘d_ang_p’ (DIABCARE). Data should be collected at least annually, at a review of
the patient’s health.
Title
Intervention aim
Definition
Rationale
Potential uses
Potential users
Possible confounders
Data sources
Candidate indicator 13 Characteristics
Specificity: Condition-specificPerspective: ClinicalTimeframe: Cross-sectional
Outcome relationship: Direct

47
Diabetes Outcome Indicators
Quality will be dependent on the completeness of diagnosis at annual review
within the individual practice i.e. identification of patients with diabetes who have
also presented with angina where both conditions are present contemporaneously,
and the quality of monitoring and recording systems.
Prevalence figures smooth the data over time and therefore may lack sensitivity to
change. In this respect, incidence figures may be preferable but they also have
problems related to identification, collection and interpretation.
None recommended.
C - To be implemented where local circumstances allow on a routine basis
(compiling the indicator annually).
Neil, H. A. W., Thomson, A. V., Thorogood, M., Fowler, G. H., and Mann, J. I.
(1989). Diabetes in the elderly: the Oxford community diabetes study. Diabetic
Medicine, 6, 608-613.
Tunbridge, W. M., and Home, P. D. (1991). Diabetes and endocrinology in clinical
practice. Edward Arnold, London.
Yudkin, J. S., Blauth, C., Drury, P., Fuller, J., Henley, J., Lancaster, T., Lankester, J.,
Lean, M., Pentecost, B., Press, V., and Rothman, D. (1996). Prevention and
management of cardiovascular disease in patients with diabetes mellitus: an
evidence base. Diabetic Medicine, 13, S101-S121.
Data quality
Comments
Further work required
Conclusion & priority
References

48
Diabetes Outcome Indicators
Percentage prevalence of claudication within a population known to have
diabetes
Reduce risk of complications - Symptoms.
For a given population, and year: the number of patients previously diagnosed with
diabetes mellitus and who, at the year end, have been identified as having
claudication, divided by the number of patients previously diagnosed with diabetes
mellitus within the given population. The resulting fraction should be expressed as
a percentage and reported as an overall figure and by age-group and sex.
Intermittent claudication predisposes the feet of diabetic patients to gangrene. The
condition can be improved through patient education (encouraging him/her to
walk for one hour per day; avoiding tobacco products). The prevalence of
intermittent claudication in a group of people with diabetes over 60 years old has
been reported at 11%, or 9% across the whole age range over 20 (Neil et al. 1989).
Clinical management of patients; clinical audit. Trends over time. HA and other
population based comparisons.
Clinicians, health care commissioners and providers.
As with other prevalence measures, this indicator can be confounded by a lack of
effort in screening for the condition and/or failure to recognise the condition in the
patient.
The denominator is defined by patients already diagnosed with diabetes who
should be monitored annually. Diabetes mellitus is diagnostically coded as 250
(ICD9) and E10 to E14 in ICD10 (IDDM being coded E10 and NIDDM E11) with
the comparable Read codes being IDDM - X40J4, NIDDM - X40J5. Diabetes with
peripheral circulatory disorders or complications is coded 250.6 with 443.8* in ICD9
(although intermittent claudication can be coded as 443.9) and E10.5 to E14.5 with
I79.2* (peripheral angiopathy) in ICD10. The corresponding Read code for
intermittent claudication is G73z0. The indicator can also be derived from the UK
Diabetes Dataset and from the DIABCARE Dataset. The particular fields required
are ‘CLAUD’ (UKDD) and ‘d_claud’ (DIABCARE). Data should be collected at least
annually, at a review of the patient’s health.
Quality will be dependent on the completeness of the annual review process
within an individual practice i.e. identification of patients with diabetes and
claudication, and the appropriateness of monitoring and recording systems.
Title
Intervention aim
Definition
Rationale
Potential uses
Potential users
Possible confounders
Data sources
Data quality
Candidate indicator 14 Characteristics
Specificity: Condition-specificPerspective: ClinicalTimeframe: Cross-sectional
Outcome relationship: Direct

49
Diabetes Outcome Indicators
Prevalence figures smooth the data over time and therefore may lack sensitivity to
change. In this respect, incidence figures may be preferable but they also have
problems related to identification, collection and interpretation.
None recommended.
C - To be implemented where local circumstances allow on a routine basis
(compiling the indicator annually).
Neil, H. A. W., Thomson, A. V., Thorogood, M., Fowler, G. H., and Mann, J. I.
(1989). Diabetes in the elderly: the Oxford community diabetes study. Diabetic
Medicine, 6, 608-613.
Comments
Further work required
Conclusion & priority
References
50
Diabetes Outcome Indicators
Number of patients who have had at least one hypoglycaemic emergency,
within the last year, that required therapeutic intervention by a health
professional, expressed as a proportion of a population of patients known
to have diabetes
Reduce impact of diabetes - Incidence of acute complications or death.
For a given population, and year: the number of patients previously diagnosed with
diabetes mellitus and who, during the year, suffered at least one hypoglycaemic
emergency that required therapeutic intervention by a health professional, divided
by the number of patients previously diagnosed with diabetes mellitus within the
given population. The resulting fraction should be expressed as a percentage and
reported as an overall figure and by age-group, sex and treatment modality (i.e.
diet alone, diet plus oral agents and insulin).
Hypoglycaemic emergencies are life threatening events to patients and are
potentially avoidable. Twenty-seven per cent of attendances at A&E departments,
by those people with diabetes, are attributable to hypoglycaemia (Holmwood et al.
1992) although this is considered to be only the ‘tip of the iceberg’ of all diabetic
hypoglycaemic occurrences in the population. As well as measuring admission or
attendance at hospital for hypoglycaemia, the indicator includes any emergency that
requires a therapeutic intervention such as an injection of glucose or glucagon.
Clinical management of patients; clinical audit. Trends over time. HA and other
population based comparisons.
Clinicians, health care commissioners and providers.
Failure to recognise hypo- and hyperglycaemic events within hospital episode data
might underestimate the occurrence by up to 30%. Multiple re-admissions of the
same individual can also confuse the picture, while hypoglycaemia can be a part
cause of the admission, particularly in the elderly, leading to recording and coding
anomalies. Treatment in A&E departments need to be included in the numerator.
Finally, as noted in other indicators, the ethnic composition of the population is
likely to affect the indicator.
The numerator can imply a hospital admission, with the data being obtained from
HES data where the primary diagnosis of diabetes mellitus (ICD9 - 250; ICD10 -
E10 - E14) is recorded and diabetic hypoglycaemia is coded. This should be coded
by a suffix of .0 in ICD10, which should probably occur in the primary position,
and is non-specific being used also for hyperglycaemic coma. However, it also
includes attendance at A&E or treatment by a GP or paramedic that would require
alternative data collection methods via the A&E minimum data set, through the use
of appropriate Read codes and within the paramedical services. The Read code for
Title
Intervention aim
Definition
Rationale
Potential uses
Potential users
Possible confounders
Data sources
Candidate indicator 15 Characteristics
Specificity: Condition-specificPerspective: PopulationTimeframe: Cross-sectional
Outcome relationship: Direct

51
Diabetes Outcome Indicators
a hypoglycaemic event in diabetes is X40Jq, although this might be used without
reference to the definition as used above i.e. ‘requiring therapeutic intervention by
health professional’. The denominator requires identification of patients having been
diagnosed with diabetes, including those outside hospital. Diabetes mellitus is
diagnostically coded as 250 (ICD9) and E10 to E14 in ICD10 (IDDM being coded
E10 and NIDDM E11) with the comparable Read codes being IDDM - X40J4,
NIDDM - X40J5. Compilation of the indicator may prove complex requiring linkage
between hospital and GP records and with paramedical or other sources in primary
care.
The indicator can be derived from the UK Diabetes Dataset and from the
DIABCARE Dataset. The particular fields required are ‘HYPO-HSP’ and ‘HYPO-GP’
(UKDD) the latter being defined as an intervention by a GP or paramedic while
‘hypo’ (DIABCARE) is defined as ‘requiring help from a third party’.
Quality will be dependent on the completeness and validity of the recording of
relevant hospital admissions (see ‘Possible confounders’) and of recording GP
interventions. The denominator requires a valid and up to date register of patients
with diabetes within an individual practice.
No specific points.
Further work may be needed to assure the mechanics of data collection, particularly
with respect to paramedic systems, and the collation and compilation of the
indicator. Further national/international standardisation of recording of
hypoglycaemia episodes is desirable.
A - To be implemented generally on a routine basis.
Holmwood, K. I., Williams, D. R. R., and Roland, J. M. (1992). Accident and
emergency. Diabetic Medicine, 9, 379-385.
Data quality
Comments
Further work required
Conclusion & priority
References

52
Diabetes Outcome Indicators
Number of patients who have had at least one hyperglycaemic emergency,
within the last year, that required hospital admission expressed as a
proportion of a population of patients known to have diabetes
Reduce impact of diabetes - Incidence of acute complications or death.
For a given population, and year: the number of patients previously diagnosed with
diabetes mellitus and who, during the year, suffered at least one hyperglycaemic
emergency that required a hospital admission, divided by the number of patients
previously diagnosed with diabetes mellitus within the given population. The
resulting fraction should be expressed as a percentage and reported as an overall
figure and by age-group and sex.
(A similar indicator could be produced that considers the number of such
emergencies across the whole GP population, i.e. to take into account where
diabetes had not been diagnosed prior to the emergency occurring).
Hyperglycaemic emergencies, which carry a significant risk of mortality are mostly
avoidable with careful and experienced management (Tunbridge and Home 1991).
Better control of blood glucose lessens exposure to hyperglycaemia and the risk of
ketoacidosis. Since these emergencies are potentially avoidable, the objective
should be to reduce the rate to as low as possible, recognising that it is not realistic
to eliminate these admissions completely.
Clinical management of patients; clinical audit. Trends over time. HA and other
population based comparisons.
Clinicians, health care commissioners and providers.
Failure to recognise the hypo- and hyperglycaemic events within hospital episode
data might underestimate occurrence by up to 30%. Deaths due to diabetic coma
and ketoacidosis occurring in the community or before admission to hospital will
affect the indicator and should be considered for inclusion in the numerator.
Finally, as noted in other indicators, the ethnic composition of the population is
likely to affect the indicator.
Since the numerator requires a hospital admission (although see caveat with respect
to treatment in A&E), these data may be obtained from contract minimum data set
(CMDS) data where the primary diagnosis of diabetes mellitus (ICD9 - 250; ICD10 -
E10-E14) is recorded. Coma with ketoacidosis, or hyperosmolar coma is coded
250.2 in ICD9, and by a suffix of .0 in ICD10, and might occur in the primary
position, although the latter suffix is also used for hypoglycaemic coma, and hence
differentiation would be needed. The Read codes have a code for hyperglycaemia
Title
Intervention aim
Definition
Rationale
Potential uses
Potential users
Possible confounders
Data sources
Candidate indicator 16 Characteristics
Specificity: Condition-specificPerspective: PopulationTimeframe: Cross-sectional
Outcome relationship: Direct

53
Diabetes Outcome Indicators
(X40J2) which could be attached to the diagnosis of diabetes to ensure its
appropriate collection. The use of the word ‘emergency’ should imply a particular
mode of admission, also readily available from CMDS. The denominator requires
identification of patients having been diagnosed with diabetes, including those
outside hospital. Diabetes mellitus is diagnostically coded as 250 (ICD9) and E10 to
E14 in ICD10 (IDDM being coded E10 and NIDDM E11) with the comparable Read
codes being IDDM - X40J4, NIDDM - X40J5. The construction of the indicator
requires linkage between hospital and GP records, the numerator being based on
hospital admissions while the denominator is defined by primary care populations.
The indicator can also be derived from the UK Diabetes Dataset and from the
DIABCARE Dataset. The particular fields required are ‘ADM-DKA’ (UKDD) and
‘hyper’ (DIABCARE) although the latter is defined as ‘requiring professional help’
rather than requiring a hospital admission.
Quality will be dependent on the completeness and validity of the recording of
relevant hospital admissions (see ‘Possible confounders’). The denominator requires
a valid and up to date register of patients with diabetes within an individual
practice.
This indicator is known to be sensitive to effective patient education.
No specific points.
A - To be implemented generally on a routine basis.
Tunbridge, W. M., and Home, P. D. (1991). Diabetes and endocrinology in clinical
practice. Edward Arnold, London.
Data quality
Comments
Further work required
Conclusion & priority
References

54
Diabetes Outcome Indicators
Case fatality rate associated with acute diabetic episodes treated in hospital
Reduce impact of diabetes - Incidence of acute complications or death.
For a given provider unit, or group thereof, and time period: the proportion of in-
patients with a primary diagnosis of diabetes mellitus (or manifestation thereof,
including hypoglycaemia) who die within 30 days of their admission. The
numerator and denominator are to be reported as well as the derived rate.
Mortality in hospital, or within 30 days of admission, may in part represent an
adverse outcome of antecedent health care. Comparisons of mortality, with suitable
case mix controls, across providers may reflect the effectiveness of care within
individual provider units. In particular, comparisons in large populations over time
may indicate whether care is resulting in improved outcomes.
Provider based comparisons of the effectiveness of secondary care provision.
Clinical audit of individual fatal cases within the provider unit. Trends over time.
(N.B. The validity of comparisons between providers will be affected by many
factors including the rarity of the event, the accuracy of source data and the
presence of confounding factors. With small numbers, it may be more appropriate
to monitor over time, at national or regional level.)
Provider management, purchasers, clinicians.
The attribution of deaths is often confounded by an incomplete recording of deaths
due to diabetes where ketoacidosis, hyperglycaemia or hypoglycaemia is the acute
admitting reason, but death itself occurs from cardiological, respiratory, renal or
other complications of the management of that episode. Additionally there are
problems through interactions between co-morbidities precipitating the
hyperglycaemic emergency (such as infections, myocardial infarction) or the
inappropriate use of alcohol or non-therapeutic drugs. Furthermore, comparisons
should be made in the context of information on the relative severity of diabetes
within the patient populations. This might be described by the type of diabetes, the
level of current complications and the propensity of the population to diabetic
trauma.
For in-hospital mortality, the numerator and denominator data may be obtained
from CMDS data with a primary diagnosis of diabetes mellitus and discharge
method coded as death (code 4). Identification of all deaths, including those
outside hospital, within a defined time-period such as 30 days would require
linkage between hospital records and death certificates. Severity data could require
linkage to GP information about the presence of complications.
Title
Intervention aim
Definition
Rationale
Potential uses
Potential users
Possible confounders
Data sources
Candidate indicator 17 Characteristics
Specificity: GenericPerspective: PopulationTimeframe: Longitudinal
Outcome relationship: Direct

55
Diabetes Outcome Indicators
The indicator proposed requires diabetes to be coded as the primary diagnosis.
Data quality could be compromised, in individual cases, by incorrect coding of
diabetes as a secondary diagnosis when it is the major cause of death.
Problems with accuracy of items in CMDS and availability of data from GP systems
might be overcome by review and abstraction from clinical notes, where considered
necessary, in view of the small number of deaths in any one locality.
Deaths among people with diabetes under the age of 50 has been variously
estimated at between 5 and 19 per million (McColl and Gulliford 1993). In the
population aged over 50 the number of deaths will be greater but only a proportion
of these will occur during or soon after an in-patient episode. This indicator should
provide useful information, particularly comparing trends in large populations over
time when used in conjunction with hospital admission rates (From Indicators 15
and 16).
The data are already available, although linkage of data elements outside the
hospital setting may continue to produce problems in the short-term. However, the
indicator is probably of limited local use due to the relative rarity of its occurrence.
Its value in monitoring long-term trends over time in a large population (e.g.
nationally) is worth exploring, as is its value for study as a sentinel event.
C - To be implemented where local circumstances allow on a routine basis
(compiling the indicator annually).
McColl, A. J., and Gulliford, M. C. (1993). Population health outcome indicators for
the NHS: a feasibility study for the Department of Health. Faculty of Public Health
Medicine of the Royal College of Physicians, London.
Data quality
Comments
Further work required
Conclusion & priority
References

56
Diabetes Outcome Indicators
Mortality indicators from the Public Health Common Data Set:
18A. SMR for death due to diabetes mellitus (similar to CDS C5)
18B. Years of life lost per 10,000 resident population by death due to
diabetes mellitus (CDS C6)
18C. Years of life lost by death due to diabetes mellitus (CDS C7)
Reduce impact of diabetes - Incidence of acute complications or death.
For a given population, identified separately by sex, and time period:
18A. SMR for death due to diabetes mellitus: the ratio of observed to
expected deaths in a population, multiplied by 100, where the
expected deaths are derived by applying the age-specific death rates
for England & Wales (in similar age bands) to the population under
consideration.
18B. YLL rate = YLL * 10,000 / P, where P is the resident population.
18C. Years of life lost (YLL) up to the age of 75 due to diabetes mellitus (ICD
E10 to E14), calculated as:YLL = (74.5-y) * Ny, summed over ages 0 to 74,
where y is age at death and Ny is the number of deaths due to diabetes
mellitus at age y.
Variations in mortality due to diabetes mellitus may be partly explained by
variations in the prevalence of clinically diagnosed diabetes or in its severity. Given
that these variables are currently unmeasured across the whole population,
geographical differences cannot easily be interpreted as reflecting differences in
health service provision. A substantial proportion of deaths due to diabetes are
recognised as avoidable (Borch-Johnsen et al. 1987) and, within a region, the
effectiveness of interventions aimed at preventing them should be reflected by
changes in the indicator over time.
Measuring impact of disease on premature death; population based comparisons;
trends over time.
Local and national policy makers, purchasers, clinicians, the public.
Apart from the effect of patient variables other than age and sex, this indicator will
reflect diabetes-related mortality caused by both immediate and longer term factors.
Earlier studies (Gulliford and Burney 1991) have recommended trying to separate
these influences.
For 18A and 18C, the indicator is already being produced within the Public Health
Common Data Set. SMR indicators are also being compiled for selected conditions.
Although diabetes mellitus is not one of these, this indicator can be easily compiled
using data collected by the Office for National Statistics.
Title
Intervention aim
Definition
Rationale
Potential uses
Potential users
Possible confounders
Data sources
Candidate indicator 18 Characteristics
Specificity: GenericPerspective: PopulationTimeframe: Cross-sectional
Outcome relationship: Direct

57
Diabetes Outcome Indicators
The indicator depends on the reliability of recording the underlying cause of death
by the death certificate, and considerable under-reporting has been recorded in a
number of studies. The quality of these data are thought to be improved in patients
under the age of 45. The recording of deaths caused by other conditions, which are
more prevalent in patients with diabetes, need to be treated consistently across
regions and over time.
This indicator is particularly useful in monitoring trends over time and for
comparing across large populations. The data on which the indicator is based are
collected routinely, and although improvements in data quality are urgently needed,
it is proposed that the indicator should be used now.
Ongoing work to assure the reliability of recording cause of death; separation of
deaths due to acute exacerbations of the condition from longer term factors.
A - To be implemented generally on a routine basis.
Borch-Johnsen, K., Nissen, H., Salling, N., Henriksen, E., Kreiner, S., Deckert, T.,
and Nerup, J. (1987). The natural history of insulin-dependent diabetes in Denmark:
long-term survival - who and why. Diabetic Medicine, 4, 211-216.
Gulliford, M. C., and Burney, P. G. J. (1991). Year of birth and mortality caused by
diabetes mellitus under 45 years: England and Wales 1927-1986. Journal of Public
Health Medicine, 13, 204-208.
Data quality
Comments
Further work required
Conclusion & priority
References

58
Diabetes Outcome Indicators
Annual incidence of severe visual impairment (visual acuity < 6/60 in the
better eye) within a population of patients known to have diabetes
Reduce impact of diabetes - Incidence of late complications.
For a given population and year: the number of patients previously diagnosed with
diabetes mellitus and who, during the year, are newly identified as having a visual
acuity < 6/60 in the better eye, divided by the number of patients previously
diagnosed with diabetes mellitus within the given population. The resulting fraction
should be expressed as a percentage and reported overall and by age-group and
sex.
The St Vincent Declaration (Krans et al. 1992) called for a reduction of one third or
more in new blindness due to diabetes. For the purposes of this indicator,
blindness has been defined to be visual acuity of less than 6/60 in the better eye.
Hence, if the patient was already blind in one eye, the incidence of blindness in
the second eye would be counted.
Comparison of incidence rates are therefore proposed and reflect the effect of
prevention policies if suitable adjustment is made for differences in the risk status
of patients considered.
Measuring impact of disease; population and provider based comparisons (although
small numbers may limit the value of comparisons at the provider level); trends
over time.
Local and national policy makers, purchasers, clinicians, provider management.
The incidence of blindness within a diabetic population might be expected to
increase with the average time from onset within that population. To remove this
effect, the indicator could be standardised and reported together with the time
element. It may, however, be difficult to estimate accurately the time from onset in
any particular case since visual acuity often fluctuates around 6/60 in patients with
severe impairment. Longitudinal data are needed to ensure that identification of a
deterioration is genuinely new.
Co-existing ocular pathology, e.g. cataracts, may influence the level of acuity and
hence the recording of the incidence of blindness attributable to diabetes.
Candidate indicator 19 Characteristics
Specificity: Condition-specificPerspective: ClinicalTimeframe: Longitudinal
Outcome relationship: Direct
Title
Intervention aim
Definition
Rationale
Potential uses
Potential users
Possible confounders

59
Diabetes Outcome Indicators
The denominator is defined by patients already diagnosed with diabetes as on a
particular day (probably 31st December). Diabetes mellitus is diagnostically coded
as 250 (ICD9) and E10 to E14 in ICD10 (IDDM being coded E10 and NIDDM E11)
with the comparable Read codes being IDDM - X40J4, NIDDM - X40J5. Although
visual acuity is almost uniformly recorded by means of a Snellen chart, there is no
standard system, which is widely applied, for the routine collection of these data in
a form that can be readily aggregated. ICD10 supports the coding of acuity in terms
of the ‘better eye’ (H54.0) as do the Read codes (e.g. Visual acuity, right eye, 6/60:
2B68; Visual acuity, left eye, 6/60: 2B78). The indicator can also be derived from
the UK Diabetes Dataset and from the DIABCARE Dataset. The particular fields
required are ‘VA-R’ and ‘VA-L’ (UKDD) and ‘vis_acu_r’ and vis_acu_l’ (DIABCARE).
The other fields ‘sv_blind’ and ‘sv_blind12’ (DIABCARE) measure incidence of
blindness in one eye, rather than in the ‘better’ eye as defined here. Numerator data
require the collection of newly identified cases of severe visual impairment within
each year (probably a calendar year), across a period of at least three to five years.
Measurements of visual acuity made in a specialist setting are likely to be more
valid and reliable, although it is within primary care that the majority of acuity
checks will be initiated. However, all measurements should be made as ‘best
corrected’. The quality of the data will also be dependent on the completeness of
the recording within individual practices i.e. of the identification of patients with
diabetes, and of the incidence of blindness.
No specific points.
It is suggested that a sample survey be undertaken to ascertain current practice in
respect of the recording of visual acuity in patients with diabetes, its retrieval and
collation.
C - To be implemented where local circumstances allow on a routine basis
(compiling the indicator annually).
Krans, H. M. J., Porta, M., and Keen, H. (1992). Diabetes care and research in
Europe; the St Vincent Declaration action programme. World Health Organisation,
Copenhagen.
Data sources
Data quality
Comments
Further work required
Conclusion & priority
References

60
Diabetes Outcome Indicators
Annual incidence of leg amputation above the ankle within a population of
patients known to have diabetes
Reduce impact of diabetes - Incidence of late complications.
For a given population and year: the number of patients previously diagnosed with
diabetes mellitus and who, during the year, have a leg amputated above the ankle,
divided by the number of patients previously diagnosed with diabetes mellitus within
the given population. The resulting fraction should be expressed as a percentage
and reported as an overall figure and by age-group and sex.
There is a substantial literature (Davidson 1983; Edmonds et al. 1986; Pecoraro et
al. 1990; Stebbings and Wood 1991) that has shown that the appropriate
management of diabetes, including the identification and provision of appropriate
care for the diabetic foot which leads to early and effective intervention where
needed, can be effective in reducing the incidence of major amputations. The
prevalence of lower limb amputation in a population with diabetes has been
recorded at 3% (Neil et al. 1989). The amputation is counted even if the person had
a previous below ankle amputation on the same side.
Comparisons of incidence rates are proposed and reflect the effect of preventive
policies and practice if suitable adjustment is made for differences in the risk status
of the patients considered. In this respect, comparisons with the annual incidence
of amputations in similar non-diabetic populations would be particularly useful.
Measuring impact of disease; population and provider based comparisons; trends
over time.
Local and national policy makers, purchasers, clinicians, provider management.
Co-existing pathologies may influence the level of amputation and thereby
confound the recording of the incidence of diabetes related amputations.
The denominator is defined by patients already diagnosed with diabetes as on a
particular day (probably 31st December). Diabetes mellitus is diagnostically coded
as 250 (ICD9) and E10 to E14 in ICD10 (IDDM being coded E10 and NIDDM E11)
with the comparable Read codes being IDDM - X40J4, NIDDM - X40J5. OPCS codes
for a leg amputation above the ankle are X09.1 to X09.9, with diabetes coded
diagnostically within the same episode/spell. The indicator can also be derived
from the UK Diabetes Dataset and from the DIABCARE Dataset. The particular
fields required are ‘AMPUTLEG-R’ and ‘AMPUTLEG-L’ (UKDD) and ‘sv_a_ank’ and
‘sv_a_ank12’ (DIABCARE) with the latter being particularly relevant as it indicates
occurrence within the last 12 months. Numerator data require the collection of
newly undertaken procedures of above-ankle leg amputation within a one year
period, probably a calendar year.
Title
Intervention aim
Definition
Rationale
Potential uses
Potential users
Possible confounders
Data sources
Candidate indicator 20 Characteristics
Specificity: Condition-specificPerspective: ClinicalTimeframe: Longitudinal
Outcome relationship: Direct
Diabetes Outcome Indicators
Some studies have found variation in lower limb amputation rates (Williams 1989)
and have reported up to 40% under reporting of diabetes as a co-morbidity in such
cases (Macleod et al. 1988).
No specific points.
None recommended.
C - To be implemented where local circumstances allow on a routine basis
(compiling the indicator annually).
Davidson, J. K. (1983). The Grady Memorial Hospital diabetes programme. In
Diabetes in epidemiological perspective. (ed. J. Mann, K. Pyorala, and A. Teuscher.).
Churchill Livingstone, Edinburgh.
Edmonds, M. E., Blundell, M. P., Morris, M. E., Thomas, E. M., Cotton, L. T., and
Watkins, P. J. (1986). Improved survival of the diabetic foot: the role of a specialised
foot clinic. Quarterly Journal of Medicine, 60, 763-771.
Macleod, C. A., Murchison, L. E., Russell, E. M., and Dingwall-Fordyce, I. (1988).
Measuring outcome of diabetes: a retrospective survey. Diabetic Medicine, 6, 59-63.
Neil, H. A. W., Thomson, A. V., Thorogood, M., Fowler, G. H., and Mann, J. I.
(1989). Diabetes in the elderly: the Oxford community diabetes study. Diabetic
Medicine, 6, 608-613.
Pecoraro, R. E., Geiber, G. E., and Burgess, E. M. (1990). Pathways to diabetic limb
amputation. Diabetes Care, 13, 513-521.
Stebbings, W. S. L., and Wood, R. F. M. (1991). Amputations in diabetics. Annals of
Royal College of Surgeons of England, 73, 170-175.
Williams, D. D. R. (1989). Outcome indicators for diabetes services: what do we
have and what do we need? Community Medicine, 11, 57-64.
Data quality
Comments
Further work required
Conclusion & priority
References
61

62
Diabetes Outcome Indicators
Annual incidence of amputation below the ankle within a population of
patients known to have diabetes
Reduce impact of diabetes - Incidence of late complications.
For a given population and year: the number of patients previously diagnosed with
diabetes mellitus and who, during the year, have an amputation below the ankle,
divided by the number of patients previously diagnosed with diabetes mellitus within
the given population. The resulting fraction should be expressed as a percentage
and reported as an overall figure and by age-group and sex.
There is a substantial literature (Davidson 1983; Edmonds et al. 1986; Pecoraro et
al. 1990; Stebbings and Wood 1991) that has shown that the appropriate
management of diabetes, including the identification and provision of appropriate
care for the diabetic foot which leads to early and effective intervention where
needed, can be effective in reducing the incidence of amputations. The prevalence
of lower limb amputation in a population with diabetes has been recorded at 3%
(Neil et al. 1989). The amputation is counted even if the person had a previous
below ankle amputation on the same side.
Comparisons of incidence rates are proposed and reflect the effect of preventive
policies and practice if suitable adjustment is made for differences in the risk status
of the patients considered. In this respect, comparisons with the annual incidence
of amputations in similar non-diabetic populations would be particularly useful.
Measuring impact of disease; population and provider based comparisons; trends
over time.
Local and national policy makers, purchasers, clinicians, provider management.
Co-existing pathologies may influence the level of amputation and thereby
confound the recording of the incidence of diabetes related amputations.
The denominator is defined by patients already diagnosed with diabetes as on a
particular day (probably 31st December). Diabetes mellitus is diagnostically coded
as 250 (ICD9) and E10 to E14 in ICD10 (IDDM being coded E10 and NIDDM E11)
with the comparable Read codes being IDDM - X40J4, NIDDM - X40J5. OPCS codes
for an amputation below the ankle are X10.1 to X10.9 (foot) and X11.1 to X11.9
(toe), with diabetes coded diagnostically within the same episode/spell. The
indicator can also be derived from the UK Diabetes Dataset and from the
DIABCARE Dataset. The particular fields required are ‘AMPUTOFT-R’ and
‘AMPUTOFT-L’ (UKDD) and ‘sv_b_ank’ and ‘sv_b_ank12’ (DIABCARE) with the
latter being particularly relevant as it indicates occurrence within the last 12
months. Numerator data require the collection of newly undertaken procedures of
below-ankle amputation within a one year period, probably a calendar year.
Title
Intervention aim
Definition
Rationale
Potential uses
Potential users
Possible confounders
Data sources
Candidate indicator 21 Characteristics
Specificity: Condition-specificPerspective: ClinicalTimeframe: Longitudinal
Outcome relationship: Direct

63
Diabetes Outcome Indicators
Some studies have found variation in lower limb amputation rates (Williams 1989)
and have reported up to 40% under-reporting of diabetes in such cases (Macleod et
al. 1988).
No specific points.
None recommended.
C - To be implemented where local circumstances allow on a routine basis
(compiling the indicator annually).
Davidson, J. K. (1983). The Grady Memorial Hospital diabetes programme. In
Diabetes in epidemiological perspective. (ed. J. Mann, K. Pyorala, and A. Teuscher.).
Churchill Livingstone, Edinburgh.
Edmonds, M. E., Blundell, M. P., Morris, M. E., Thomas, E. M., Cotton, L. T., and
Watkins, P. J. (1986). Improved survival of the diabetic foot: the role of a specialised
foot clinic. Quarterly Journal of Medicine, 60, 763-771.
Macleod, C. A., Murchison, L. E., Russell, E. M., and Dingwall-Fordyce, I. (1988).
Measuring outcome of diabetes: a retrospective survey. Diabetic Medicine, 6, 59-63.
Neil, H. A. W., Thomson, A. V., Thorogood, M., Fowler, G. H., and Mann, J. I.
(1989). Diabetes in the elderly: the Oxford community diabetes study. Diabetic
Medicine, 6, 608-613.
Pecoraro, R. E., Geiber, G. E., and Burgess, E. M. (1990). Pathways to diabetic limb
amputation. Diabetes Care, 13, 513-521.
Stebbings, W. S. L., and Wood, R. F. M. (1991). Amputations in diabetics. Annals of
Royal College of Surgeons of England, 73, 170-175.
Williams, D. D. R. (1989). Outcome indicators for diabetes services: what do we
have and what do we need? Community Medicine, 11, 57-64.
Data quality
Comments
Further work required
Conclusion & priority
References

64
Diabetes Outcome Indicators
Annual incidence of myocardial infarction within a population of patients
known to have diabetes
Reduce impact of diabetes - Incidence of late complications.
For a given population and year: the number of patients previously diagnosed with
diabetes mellitus and who, during the year, are diagnosed as having suffered a
myocardial infarction (MI), divided by the number of patients previously diagnosed
with diabetes mellitus within the given population. The resulting fraction should be
expressed as a percentage and reported as an overall figure and by age-group and
sex.
The diagnosis is based on clinical findings and history, namely of a prodrome and
typical laboratory test results e.g. enzyme levels or ECG changes.
Myocardial infarction and strokes resulting from macrovascular disease are the
commonest causes of death in people with diabetes over the age of 50 (Macleod et
al. 1987). The prevalence of ‘possible’ myocardial infarction in a group of people
with diabetes over 60 years old has been estimated at 9% (Neil et al. 1989). People
with diabetes are also more prone to myocardial infarction and strokes at an earlier
age than other patients (Yudkin et al. 1996).
Comparisons of incidence rates are proposed and reflect the effect of preventive
policies and practice if suitable adjustment is made for differences in the risk status
of the patients considered.
Measuring impact of disease; population and provider based comparisons; trends
over time.
Local and national policy makers, purchasers, clinicians, provider management.
Co-existing pathology may affect the incidence of myocardial infarction and thereby
confound the recording of the incidence of diabetes related MI.
‘Silent’ MIs may lead to an understated incidence, while data on the occurrence of
infarcts outside of hospital need a comprehensive and reliable recording system.
Title
Intervention aim
Definition
Rationale
Potential uses
Potential users
Possible confounders
Candidate indicator 22 Characteristics
Specificity: Condition-specificPerspective: ClinicalTimeframe: Longitudinal
Outcome relationship: Direct

65
Diabetes Outcome Indicators
The denominator is defined by patients already diagnosed with diabetes as on a
particular day (probably 31st December). Diabetes mellitus is diagnostically coded
as 250 (ICD9) and E10 to E14 in ICD10 (IDDM being coded E10 and NIDDM E11)
with the comparable Read codes being IDDM - X40J4, NIDDM - X40J5. Coding for
the occurrence of a MI are 410 & 412 (ICD9), and I21 & I22 (ICD10) with diabetes
coded diagnostically within the same episode/spell. The corresponding Read codes
are G30.. . Diagnosis of MI requires a prodrome, and rise in enzyme levels or
appropriate change in ECG trace.
The indicator might also be derived from the UK Diabetes Dataset and from the
DIABCARE Dataset, although UKDD’s definition excludes the requirement of a
prodrome, while DIABCARE’s definition includes the incidence of CABG or PTCA
with that of an MI. The particular fields within these datasets are ‘MI’ (UKDD) and
‘sv_m_inf’ and ‘sv_m_inf12’ (DIABCARE) with the UKDD and the latter DIABCARE
variables indicating occurrence within the last 12 months. Numerator data require
the collection of newly identified (although not necessarily first) occurrence of
myocardial infarction within the diabetic population, within a one year period,
probably collected over a calendar year.
The quality of the data will be dependent on the completeness of the recording
within individual practices i.e. of the identification of patients with diabetes, and
recognition of the incidence of myocardial infarction, which in turn requires good
communication between hospitals and primary care. As mentioned above, the
recording of MI can be ambiguous, particularly in those MIs that are never admitted
to hospital. This may lead to an understated incidence.
No specific points.
None recommended.
C - To be implemented where local circumstances allow on a routine basis
(compiling the indicator annually).
Macleod, J., Edwards, C., and Bouchier, I. (1987). Diabetes mellitus. In Davidson’s
principles of medicine. Churchill Livingstone, Edinburgh.
Neil, H. A. W., Thomson, A. V., Thorogood, M., Fowler, G. H., and Mann, J. I.
(1989). Diabetes in the elderly: the Oxford community diabetes study. Diabetic
Medicine, 6, 608-613.
Yudkin, J. S., Blauth, C., Drury, P., Fuller, J., Henley, J., Lancaster, T., Lankester, J.,
Lean, M., Pentecost, B., Press, V., and Rothman, D. (1996). Prevention and
management of cardiovascular disease in patients with diabetes mellitus: an
evidence base. Diabetic Medicine, 13, S101-S121.
Data sources
Data quality
Comments
Further work required
Conclusion & priority
References

66
Diabetes Outcome Indicators
Annual incidence of stroke within a population of patients known to have
diabetes
Reduce impact of diabetes - Incidence of late complications.
For a given population and year: the number of patients previously diagnosed with
diabetes mellitus and who, during the year, are diagnosed as having suffered a
stroke, divided by the number of patients previously diagnosed with diabetes mellitus
within the given population. The resulting fraction should be expressed as a
percentage and reported as an overall figure and by age-group and sex.
Myocardial infarction and strokes resulting from macrovascular disease are the
commonest cause of death in people with diabetes over the age of 50 (Macleod et
al. 1987). The prevalence of stroke in a group of people with diabetes over 60
years old has been estimated at 5% (Neil et al. 1989). People with diabetes are also
more prone to myocardial infarction and strokes at an earlier age than other
patients.
Comparisons of incidence rates are proposed and reflect the effect of preventive
policies and practice if suitable adjustment is made for differences in the risk status
of patients considered.
Measuring impact of disease; population and provider based comparisons; trends
over time.
Local and national policy makers, purchasers, clinicians, provider management.
Co-existing pathology may affect the incidence of stroke or, at time of occurrence,
diabetes may not be identified or recorded, thus affecting the accurate reporting of
the incidence of the diabetes related condition. The threshold for the recording of
‘stroke’, particularly those where admission to hospital does not take place may
lead to an understated incidence.
The denominator is defined by patients already diagnosed with diabetes as on a
particular day (probably 31st December). Diabetes mellitus is diagnostically coded
as 250 (ICD9) and E10 to E14 in ICD10 (IDDM being coded E10 and NIDDM E11)
with the comparable Read codes being IDDM - X40J4, NIDDM - X40J5. Coding for
the occurrence of a stroke is 431, 432, 434 and 436 (ICD9) and I61 to I64 (ICD10)
with diabetes coded diagnostically within the same episode/spell. The
corresponding Read codes are stroke (X00D1), or cerebral infarction unspecified
(Xa0kZ). The indicator can also be derived from the UK Diabetes Dataset and from
the DIABCARE Dataset. The particular fields required are ‘CVA’ (UKDD) and
‘sv_strok’ and ‘sv_strok12’ (DIABCARE) with the UKDD and the latter DIABCARE
variables being particularly relevant as they indicate occurrence within the last 12
Title
Intervention aim
Definition
Rationale
Potential uses
Potential users
Possible confounders
Data sources
Candidate indicator 23 Characteristics
Specificity: Condition-specificPerspective: ClinicalTimeframe: Longitudinal
Outcome relationship: Direct

67
Diabetes Outcome Indicators
months. Numerator data require the collection of newly identified (although not
necessarily first) occurrence of stroke within the diabetic population, within a one
year period, probably collected over a calendar year.
The quality of the data will be dependent on the completeness of the recording
within individual practices i.e. on the identification of patients with diabetes, and
recognition of the incidence of stroke. As mentioned above, the recording of stroke
can be ambiguous, particularly in those cases that are never admitted to hospital.
This may lead to an understated incidence. As with many indicators, the
completeness and accuracy of data capture also depends on good communications
between hospitals and primary care.
No specific point.
None recommended.
C - To be implemented where local circumstances allow on a routine basis
(compiling the indicator annually).
Macleod, J., Edwards, C., and Bouchier, I. (1987). Diabetes mellitus. In Davidson’s
principles of medicine. Churchill Livingstone, Edinburgh.
Neil, H. A. W., Thomson, A. V., Thorogood, M., Fowler, G. H., and Mann, J. I.
(1989). Diabetes in the elderly: the Oxford community diabetes study. Diabetic
Medicine, 6, 608-613.
Data quality
Comments
Further work required
Conclusion & priority
References

68
Diabetes Outcome Indicators
Number of patients who have started renal replacement therapy or have
had a creatinine level > 500 µmol/litre recorded for the first time within the
last year, expressed as a proportion of a population of patients known to
have diabetes
Reduce impact of diabetes - Incidence of late complications.
For a given population and year: the number of patients previously diagnosed with
diabetes mellitus and who, during the year, have either:
i) started renal replacement therapy i.e. started on dialysis or have received a
transplant, or
ii) had a creatinine level > 500 µmol/litre recorded for the first time,
divided by the number of patients previously diagnosed with diabetes mellitus
within the given population.
The resulting single fraction should be expressed as a percentage and reported as
an overall figure and by age-group and sex.
A significant percentage of all Type I patients develop diabetic nephropathy
(Viberti et al. 1996) and will go into end-stage renal failure (ESRF) after an average
diabetes duration of 20-25 years. Mortality associated with diabetic nephropathy is
up to 100 times that of a matched background population (Borch-Johnsen et al.
1985). Good metabolic control from the time of diagnosis is probably the most
important feature in the good management of diabetic renal disease. However, it is
also important for the diabetic patient to enter renal replacement therapy early and
possibly receive transplantation at relatively low creatinine levels (below 500
(µmol/litre). The indicator measures, therefore, the proportion of patients with
diabetes who are considered appropriate for transplantation and therefore identifies
the impact of this complication. Knowledge of those receiving a transplant might
also indicate the shortfall in the level of donor organs or service provision.
Measuring impact of disease; population and provider based comparisons; trends
over time.
Local and national policy makers, purchasers, clinicians, provider management.
Co-existing pathologies may affect the incidence of end stage renal disease and
hence the start of renal replacement therapy, thus making the interpretation of the
indicator, and its relationship to diabetes care, difficult.
End stage renal disease is time related from onset of diabetes. To remove this
effect, the indicator could be standardised and reported with the time element. It
may, however, be difficult to estimate accurately the time from onset in any
particular case.
Title
Intervention aim
Definition
Rationale
Potential uses
Potential users
Possible confounders
Candidate indicator 24 Characteristics
Specificity: Condition-specificPerspective: ClinicalTimeframe: Cross-sectional
Outcome relationship: Direct

69
Diabetes Outcome Indicators
The denominator is defined by patients already diagnosed with diabetes as on a
particular day (probably 31st December). Diabetes mellitus is diagnostically coded
as 250 (ICD9) and E10 to E14 in ICD10 (IDDM being coded E10 and NIDDM E11)
with the comparable Read codes being IDDM - X40J4, NIDDM - X40J5. Renal
transplant and dialysis have been variously coded as V42.0 and V56.0 respectively
in ICD9, and M01.- and X40.1 (OPCS). End stage renal disease has been coded 585
(ICD9) and N18.0 (ICD10). Comparable Read codes are renal transplant (7B00.),
renal dialysis (7L1A0), ESRF (X30J0). The indicator can also be derived from the UK
Diabetes Dataset and from the DIABCARE Dataset. The particular fields required are
‘DIALYSIS’ and ‘CREAT’ (UKDD) and ‘sv_dialy12’ and ‘crea’ (DIABCARE). In the
case of the creatinine variables, there is a need to identify the level going above
500(µmol/litre for the first time in the year under consideration. Numerator data
require the identification of the number of patients with diabetes who have started
renal replacement therapy in the last year or who clinically require it, probably
collected over a calendar year.
The quality of the data will be dependent on the completeness of the recording
within individual practices i.e. on the identification of patients with diabetes, and
knowledge of creatinine level (or status of renal replacement therapy), which in
turn requires good communication between hospitals and primary care.
No specific points.
None recommended.
D - To be implemented where local circumstances allow by periodic survey.
Borch-Johnsen, K., Anderson, P. K., and Deckert, T. (1985). The effect of proteinuria
on relative mortality in Type 1 (insulin dependent) diabetes mellitus. Diabetologia,
28, 590.
Viberti, G-C., Marshall, S., Beech, R., Brown, V., Derben, P., Higson, N., Home, P.,
Keen, H., Plant, M., and Wallis, J. (1996). Report on renal disease in diabetes.
Diabetic Medicine, 13, S6-S12.
Data sources
Data quality
Comments
Further work required
Conclusion & priority
References
70
Diabetes Outcome Indicators
Rates of late stillbirth and perinatal mortality in deliveries from a
population of patients known to have diabetes and who become pregnant
Reduce impact of diabetes - Complications of pregnancy.
For a given population of patients previously diagnosed with diabetes mellitus, by
age group, and for a given year: the number of pregnancies that result in:
i) the delivery of a fetus, after the 24th week of gestation, which did not at any
time after delivery breathe or show any other signs of life,
and separately,
ii) the death of the infant between 24 completed weeks gestation and one week
after birth, divided by the number of completed pregnancies in the population
of interest and in the given year.
The resulting rates, expressed as percentages, should be reported separately and
with their numerators.
Diabetes during pregnancy carries risks to both the mother and the developing
fetus. Indicators 25 to 29 focus mainly on outcomes associated with the fetus, but
the sub-population of mothers who are known to have diabetes before becoming
pregnant is likely to suffer greater problems from hypertension, ketoacidosis,
retinopathy and nephropathy than a similar non-pregnant population (Tunbridge
and Home 1991; Jardine Brown et al. 1996) and it may be appropriate to examine
this sub-group of patients separately when considering other relevant indicators.
Early metabolic disturbance can lead to abnormal development, which may lead to
fetal death or congenital malformations, and hence close monitoring and control
during the ante-natal period is to be desired. The rate of late stillbirths and
perinatal mortality within this subgroup is known to be significantly higher than in
the normal population. (Hawthorne et al. 1997).
Clinical audit, trends over time and as a basis for provider comparisons, although
small numbers may require special consideration.
Clinicians, provider management and commissioners. Local and national policy
makers.
Adverse outcomes of pregnancy in this patient group need to be considered in the
context of information about maternity outcomes in the general and local
population, and those associated with other maternity risk factors and other co-
morbidities.
Title
Intervention aim
Definition
Rationale
Potential uses
Potential users
Possible confounders
Candidate indicator 25 Characteristics
Specificity: Condition-specificPerspective: ClinicalTimeframe: Cross-sectional
Outcome relationship: Direct
71
Diabetes Outcome Indicators
Generally, the indicator will result from an in-patient episode with data being
captured via diagnostic coding within the contract minimum data set or through
other routine data capture systems. However, should the delivery (or deliveries, in
the case of the denominator figure) have taken place at home, or should the death
occur post discharge, data will need to be collected from GP systems. As with other
indicators collation from the two separate systems will be required which would be
facilitated by use of a diabetic register.
The denominator is defined by patients already diagnosed with diabetes before
booking as pregnant and who have completed a pregnancy. Diabetes mellitus is
diagnostically coded as 250 (ICD9) and E10 to E14 in ICD10 (IDDM being coded
E10 and NIDDM E11) with the comparable Read codes being IDDM - X40J4,
NIDDM - X40J5, with details of the outcome of the delivery being collected on the
mother’s record in the delivery episode. The UK Diabetes Dataset does not identify
outcomes of pregnancy in patients with diabetes. However, the DIABCARE Dataset
includes fields which would allow some of these indicators to be derived. The
particular fields required to derive this indicator are ‘p_yes_12’, ‘p_mis_12’ and
‘p_peri_12’ (DIABCARE) with each relating to occurrences within the last 12
months. However, these fields (p_mis_12 and p_peri_12) define stillbirths as
occurring at up to 28 weeks, with perinatal deaths occurring after that point.
The validity of the data will depend on the accuracy and completeness of clinical
coding for both numerator and denominator. In particular, the indicator is
dependent on the identification of diabetes as a secondary diagnosis in the coded
record, and the separation of gestational diabetes from the pre-existing condition.
With many provider units having fewer than ten cases per year, this indicator is
likely to be best reported at a sub-region level, the indicator being calculated
annually.
An indicator recording stillbirths and perinatal deaths in mothers with diabetes has
been introduced into the Confidential Enquiry into Stillbirths and Deaths in Infancy
(CESDI) since 1998.
None recommended.
C - To be implemented where local circumstances allow on a routine basis
(compiling the indicator annually).
Data sources
Data quality
Comments
Further work required
Conclusion & priority

72
Diabetes Outcome Indicators
References Jardine Brown, C., Dawson, A., Dodds, R., Gamsu, H., Gillmer, M., Hall, M.,
Hounsome, B., Knopfler, A., Ostler, J., Peacock, I., Rothman, D., and Steel, J.
(1996). Report of the Pregnancy and Neonatal Care Group. Diabetic Medicine, 13,
S43-S53.
Hawthorne, G., Robson, S., Ryall, E.A., Sen, D., Roberts, S.H., and Ward Platt, M.P.
on behalf of the Northern Diabetic Pregnancy Audit, 1994 (1997). Prospective
population based survey of outcome of pregnancy in diabetic women: results of
the Northern Diabetic Pregnancy Audit, 1994. British Medical Journal, 315, 279-281.
Tunbridge, W. M., and Home, P. D. (1991). Diabetes and endocrinology in clinical
practice. Edward Arnold, London.

73
Diabetes Outcome Indicators
The rate of delivery by caesarean section in deliveries from a population of
patients known to have diabetes and who become pregnant
Reduce impact of diabetes - Complications of pregnancy.
For a given population of patients previously diagnosed with diabetes mellitus, by
age group, and for a given year: the number of pregnancies that result in the
delivery of an infant by means of caesarean section, divided by the number of
completed pregnancies in the population of interest and in the given year. The
resulting rates should be reported as percentages and with their numerators.
Diabetes during pregnancy carries risks to both the mother and the developing
fetus. Indicators 25 to 29 focus mainly on outcomes associated with the fetus, but
the sub-population of mothers known to have diabetes before becoming pregnant
is likely to suffer greater problems from hypertension, ketoacidosis, retinopathy and
nephropathy than a similar non-pregnant population (Tunbridge and Home 1991;
Jardine Brown et al. 1996) and it may be appropriate to examine this sub-group of
patients when considering other relevant indicators.
Such risks may require a greater level of intervention than in the non-pregnant
population, but such interventions also carry their own level of risk. The degree of
variability across units is probably not clinically justifiable, but determining
‘appropriate’ rates is fraught with difficulties.
Clinical audit, trends over time and as a basis for provider comparisons although
small numbers may require special consideration.
Clinicians, provider management and commissioners. Local and national policy
makers.
Adverse outcomes of pregnancy in this patient group need to be considered in the
context of information about maternity outcomes in the general and local
population, and those associated with other maternity risk factors, and other co-
morbidities. Caesarean section rates vary as a matter of policy between obstetric
units and localities and therefore the indicator may need reporting as a ratio of the
local general population rate. However, the rate may also be confounded by the
use of other interventions e.g. early induction and might benefit by being linked to
gestational age.
Title
Intervention aim
Definition
Rationale
Potential uses
Potential users
Possible confounders
Candidate indicator 26 Characteristics
Specificity: Condition-specificPerspective: ClinicalTimeframe: Cross-sectional
Outcome relationship: Direct

74
Diabetes Outcome Indicators
Data sources
Data quality
Comments
Further work required
Conclusion & priority
References
Generally, the indicator will result from an in-patient episode with data being
captured via diagnostic coding within the contract minimum data set or through
other routine data capture systems. However, where the delivery (in the case of the
denominator figure) has taken place at home data will need to be collected from
GP systems. As with other indicators collation from the two separate systems will be
required which would be facilitated by use of a diabetic register.
The denominator is defined by patients already diagnosed with diabetes before
booking as pregnant and who have completed a pregnancy. Diabetes mellitus is
diagnostically coded as 250 (ICD9) and E10 to E14 in ICD10 (IDDM being coded
E10 and NIDDM E11) with the comparable Read codes being IDDM - X40J4,
NIDDM - X40J5. Delivery by caesarean section is recorded as 669.7 (ICD9) and by
O82 (ICD10) as well as via other fields in the delivery episode on the mother’s
record. Neither the UK Diabetes Dataset nor the DIABCARE Dataset includes fields
that would enable this indicator to be derived from them.
The validity of the data will depend on the accuracy and completeness of clinical
coding for both numerator and denominator. In particular, the indicator is
dependent on the identification of diabetes as a secondary diagnosis in the coded
record, and the separation of gestational diabetes from the pre-existing condition.
With many provider units having fewer than ten cases per year, this indicator is
likely to be best reported at a sub-region level, the indicator being calculated
annually.
No specific points.
None recommended.
C - To be implemented where local circumstances allow on a routine basis
(compiling the indicator annually).
Jardine Brown, C., Dawson, A., Dodds, R., Gamsu, H., Gillmer, M., Hall, M.,
Hounsome, B., Knopfler, A., Ostler, J., Peacock, I., Rothman, D., and Steel, J. (1996).
Report of the Pregnancy and Neonatal Care Group. Diabetic Medicine, 13, S43-S53.
Tunbridge, W. M., and Home, P. D. (1991). Diabetes and endocrinology in clinical
practice. Edward Arnold, London.
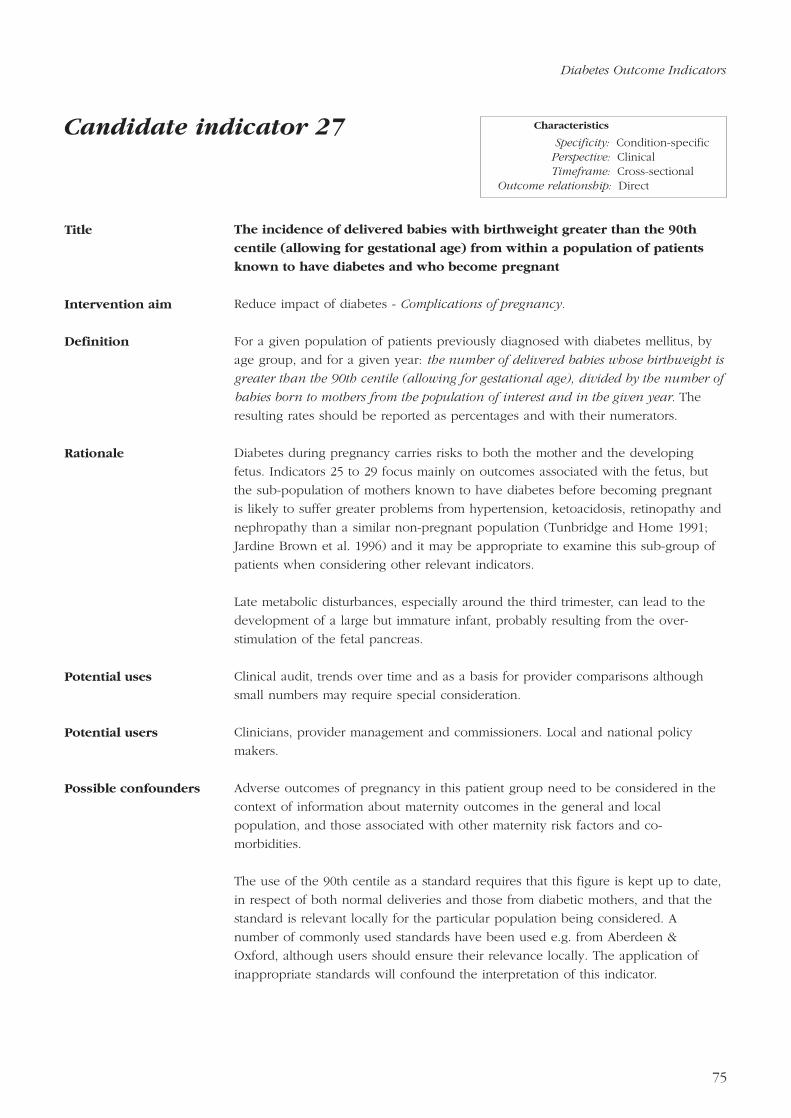
75
Diabetes Outcome Indicators
The incidence of delivered babies with birthweight greater than the 90th
centile (allowing for gestational age) from within a population of patients
known to have diabetes and who become pregnant
Reduce impact of diabetes - Complications of pregnancy.
For a given population of patients previously diagnosed with diabetes mellitus, by
age group, and for a given year: the number of delivered babies whose birthweight is
greater than the 90th centile (allowing for gestational age), divided by the number of
babies born to mothers from the population of interest and in the given year. The
resulting rates should be reported as percentages and with their numerators.
Diabetes during pregnancy carries risks to both the mother and the developing
fetus. Indicators 25 to 29 focus mainly on outcomes associated with the fetus, but
the sub-population of mothers known to have diabetes before becoming pregnant
is likely to suffer greater problems from hypertension, ketoacidosis, retinopathy and
nephropathy than a similar non-pregnant population (Tunbridge and Home 1991;
Jardine Brown et al. 1996) and it may be appropriate to examine this sub-group of
patients when considering other relevant indicators.
Late metabolic disturbances, especially around the third trimester, can lead to the
development of a large but immature infant, probably resulting from the over-
stimulation of the fetal pancreas.
Clinical audit, trends over time and as a basis for provider comparisons although
small numbers may require special consideration.
Clinicians, provider management and commissioners. Local and national policy
makers.
Adverse outcomes of pregnancy in this patient group need to be considered in the
context of information about maternity outcomes in the general and local
population, and those associated with other maternity risk factors and co-
morbidities.
The use of the 90th centile as a standard requires that this figure is kept up to date,
in respect of both normal deliveries and those from diabetic mothers, and that the
standard is relevant locally for the particular population being considered. A
number of commonly used standards have been used e.g. from Aberdeen &
Oxford, although users should ensure their relevance locally. The application of
inappropriate standards will confound the interpretation of this indicator.
Title
Intervention aim
Definition
Rationale
Potential uses
Potential users
Possible confounders
Candidate indicator 27 Characteristics
Specificity: Condition-specificPerspective: ClinicalTimeframe: Cross-sectional
Outcome relationship: Direct

76
Diabetes Outcome Indicators
Generally, the indicator will result from an in-patient episode with data being
captured via the contract minimum data set or through other routine data capture
systems. However, should the delivery (or deliveries, in the case of the
denominator figure) have taken place at home data will need to be collected from
GP systems. As with other indicators collation from the two separate systems will
be required which would be facilitated by use of a diabetic register.
The denominator is defined by babies born to patients already diagnosed with
diabetes before booking as pregnant and who have completed a pregnancy.
Diabetes mellitus is diagnostically coded as 250 (ICD9) and E10 to E14 in ICD10
(IDDM being coded E10 and NIDDM E11) with the comparable Read codes being
IDDM - X40J4, NIDDM - X40J5. Birthweight is recorded within the delivery episode
of the mother’s record as is gestational age. Neither the UK Diabetes Dataset nor
the DIABCARE Dataset includes fields that would enable this indicator to be
derived from them.
The validity of the data will depend on the accuracy and completeness of clinical
coding for both numerator and denominator. In particular, the indicator is
dependent on the identification of diabetes as a secondary diagnosis in the coded
record, and the separation of gestational diabetes from the pre-existing condition.
With many provider units having fewer than ten cases per year, this indicator is
likely to be best reported at a sub-region level, the indicator being calculated
annually.
No specific points.
To validate the standard distributions of birthweight by gestational age, and to
examine their relationship to ethnic group and other variables.
C - To be implemented where local circumstances allow on a routine basis
(compiling the indicator annually).
Jardine Brown, C., Dawson, A., Dodds, R., Gamsu, H., Gillmer, M., Hall, M.,
Hounsome, B., Knopfler, A., Ostler, J., Peacock, I., Rothman, D., and Steel, J.
(1996). Report of the Pregnancy and Neonatal Care Group. Diabetic Medicine, 13,
S43-S53.
Tunbridge, W. M., and Home, P. D. (1991). Diabetes and endocrinology in clinical
practice. Edward Arnold, London.
Data sources
Data quality
Comments
Further work required
Conclusion & priority
References

77
Diabetes Outcome Indicators
The incidence of occurrence of specific congenital malformations (i.e.
neural tube defects, cardiac and renal malformations) in deliveries from a
population of patients known to have diabetes and who become pregnant
Reduce impact of diabetes - Complications of pregnancy.
For a given population of patients previously diagnosed with diabetes mellitus, by
age group, and for a given year: the number of delivered babies who are identified
with specific congenital malformations (i.e. neural tube defects, cardiac and renal
malformations), divided by the number of babies born to mothers from the
population of interest and in the given year. The resulting rates should be reported
as percentages and with their numerators.
Diabetes during pregnancy carries risks to both the mother and the developing
fetus. Indicators 25 to 29 focus mainly on outcomes associated with the fetus, but
the sub-population of mothers known to have diabetes before becoming pregnant
is likely to suffer greater problems from hypertension, ketoacidosis, retinopathy and
nephropathy than a similar non-pregnant population (Tunbridge and Home 1991;
Jardine Brown et al. 1996) and it may be appropriate to examine this sub-group of
patients when considering other relevant indicators.
Early metabolic disturbance can lead to abnormal development which may lead to
fetal death or congenital malformations (Hawthorne et al. 1997).
Clinical audit, trends over time and as a basis for provider comparisons although
small numbers may require special consideration.
Clinicians, provider management and commissioners. Local and national policy
makers.
Adverse outcomes of pregnancy in this patient group need to be considered in the
context of information about maternity outcomes in the general and local
population, and those associated with other maternity risk factors and co-
morbidities.
Generally, the indicator will result from an in-patient episode (in this case the birth
episode, which relates to the baby) with data being captured via the contract
minimum data set or through other routine data capture systems. However, should
the delivery (or deliveries, in the case of the denominator figure) have taken place
at home, data will need to be collected from GP systems. As with other indicators
collation from the two separate systems will be required which would be facilitated
by use of a diabetic register.
Title
Intervention aim
Definition
Rationale
Potential uses
Potential users
Possible confounders
Data sources
Candidate indicator 28 Characteristics
Specificity: Condition-specificPerspective: ClinicalTimeframe: Cross-sectional
Outcome relationship: Direct

78
Diabetes Outcome Indicators
Data quality
Comments
Further work required
Conclusion & priority
References
The denominator is defined by babies born to patients already diagnosed with
diabetes before booking as pregnant and who have completed a pregnancy.
Diabetes mellitus is diagnostically coded as 250 (ICD9) and E10 to E14 in ICD10
(IDDM being coded E10 and NIDDM E11) with the comparable Read codes being
IDDM - X40J4, NIDDM - X40J5. The particular congenital malformations included
are coded as Q00-Q07, Q20-Q26 and Q60, Q61, Q63 (ICD10). Within the Read
codes there are many abnormalities listed, some examples being given by X77q9
(neural tube defect), X785S (congenital abnormality of kidney) and X77tV
(congenital abnormality of heart). The UK Diabetes Dataset does not identify
outcomes of pregnancy in patients with diabetes. However, the DIABCARE Dataset
includes fields which would allow some of these indicators to be derived. The
particular fields required to derive this indicator are ‘p_yes_12’ and ‘p_alf_12’
(DIABCARE) although the latter variable, relating to the specific nature of the
malformation is defined as only including cardiovascular and neuroskeletal
abnormalities.
The validity of the data will depend on the accuracy and completeness of clinical
coding for both numerator and denominator. In particular, the indicator is
dependent on the identification of diabetes as a secondary diagnosis in the coded
record, and the separation of gestational diabetes from the pre-existing condition.
With many provider units having fewer than ten cases per year, this indicator is
likely to be best reported at a sub-region level, the indicator being calculated
annually.
No specific points.
To specify particular congenital abnormalities of interest.
C - To be implemented where local circumstances allow on a routine basis
(compiling the indicator annually).
Jardine Brown, C., Dawson, A., Dodds, R., Gamsu, H., Gillmer, M., Hall, M.,
Hounsome, B., Knopfler, A., Ostler, J., Peacock, I., Rothman, D., and Steel, J.
(1996). Report of the Pregnancy and Neonatal Care Group. Diabetic Medicine, 13,
S43-S53.
Hawthorne, G., Robson, S., Ryall, E.A., Sen, D., Roberts, S.H., and Ward Platt, M.P.
on behalf of the Northern Diabetic Pregnancy Audit, 1994 (1997). Prospective
population based survey of outcome of pregnancy in diabetic women: results of
the Northern Diabetic Pregnancy Audit, 1994. British Medical Journal, 315, 279-
281.
Tunbridge, W. M., and Home, P. D. (1991). Diabetes and endocrinology in clinical
practice. Edward Arnold, London.

79
Diabetes Outcome Indicators
The rate of admission to special care baby units (and nurseries) of babies
delivered from a population of patients known to have diabetes and who
become pregnant
Reduce impact of diabetes - Complications of pregnancy.
For a given population of patients previously diagnosed with diabetes mellitus, by
age group, and for a given year: the number of delivered babies who are admitted to
a special care baby unit (and/or nursery) immediately following the birth episode,
divided by the number of babies born to mothers from the population of interest and
in the given year. The resulting rates should be reported as percentages and with
their numerators.
Diabetes during pregnancy carries risks to both the mother and the developing
fetus. Indicators 25 to 29 focus mainly on outcomes associated with the fetus, but
the sub-population of mothers who are known to have diabetes before becoming
pregnant is likely to suffer greater problems from hypertension, ketoacidosis,
retinopathy and nephropathy than a similar non-pregnant population (Tunbridge
and Home 1991; Jardine Brown et al. 1996) and it may be appropriate to examine
this sub-group of patients when considering other relevant indicators.
Admission to Special Care Baby Unit (SCBU) immediately following the birth is
likely to be attributable to an adverse outcome of the pregnancy, other than where
SCBU admission protocols are based on other criteria e.g. birthweight.
Clinical audit, trends over time and as a basis for provider comparisons although
small numbers may require special consideration.
Clinicians, provider management and commissioners. Local and national policy
makers.
Adverse outcomes of pregnancy in this patient group need to be considered in the
context of information about maternity outcomes in the general and local
population, and those associated with other maternity risk factors and co-
morbidities.
As mentioned above, some SCBUs have a range of admission criteria which are not
necessarily directly related to clinical need. This, together with the effect of the
variability of available resources, may confound the interpretation of this indicator
as an outcome measure of antecedent care.
Title
Intervention aim
Definition
Rationale
Potential uses
Potential users
Possible confounders
Candidate indicator 29 Characteristics
Specificity: Condition-specificPerspective: ClinicalTimeframe: Cross-sectional
Outcome relationship: Direct

80
Diabetes Outcome Indicators
By definition, this indicator will result from an in-patient episode (in this case, the
episode immediately following the birth episode) with data being captured via the
contract minimum data set or through other routine data capture systems.
The denominator is defined by babies born to patients already diagnosed with
diabetes before booking as pregnant and who have completed a pregnancy.
Diabetes mellitus is diagnostically coded as 250 (ICD9) and E10 to E14 in ICD10
(IDDM being coded E10 and NIDDM E11) with the comparable Read codes being
IDDM - X40J4, NIDDM - X40J5. Admission to SCBU will be recorded through the
standard hospital systems and should produce a separate episode from the birth
episode. Neither the UK Diabetes Dataset nor the DIABCARE Dataset include fields
that would enable this indicator to be derived from them.
The validity of the data will depend on the accuracy and completeness of clinical
coding for both numerator and denominator. In particular, the indicator is
dependent on the identification of diabetes as a secondary diagnosis in the coded
record, and the separation of gestational diabetes from the pre-existing condition.
With many provider units having fewer than ten cases per year, this indicator is
likely to be best reported at a sub-region level, the indicator being calculated
annually.
No specific points.
None recommended.
C - To be implemented where local circumstances allow on a routine basis
(compiling the indicator annually).
Jardine Brown, C., Dawson, A., Dodds, R., Gamsu, H., Gillmer, M., Hall, M.,
Hounsome, B., Knopfler, A., Ostler, J., Peacock, I., Rothman, D., and Steel, J.
(1996). Report of the Pregnancy and Neonatal Care Group. Diabetic Medicine, 13,
S43-S53.
Tunbridge, W. M., and Home, P. D. (1991). Diabetes and endocrinology in clinical
practice. Edward Arnold, London.
Data sources
Data quality
Comments
Further work required
Conclusion & priority
References

81
Diabetes Outcome Indicators
Summary of a measure of psychological well-being within a population of
patients known to have diabetes
Reduce impact of diabetes - Impact on quality of life.
For a GP population of patients previously diagnosed with diabetes mellitus, and
for a given year: a summary of patients’ responses to a questionnaire measuring
psychological well-being (to be specified), administered at an annual review. The
summary statistics (which have not been specified), will describe the distribution of
scores from the instrument, broken down by patient age-group and sex.
Psychological influences within diabetes are well recognised (Tunbridge and Home
1991). Patient’s psychological states will have a significant influence on what they
gain from a consultation or an educational session, or whether they feel capable of
altering their lifestyle in a desirable way.
Psychological states are also affected by patient’s underlying personalities which can
also interact with the disease and with their treatment. A particular example lies in
whether the patient’s see the disease as external to themselves and therefore to be
managed by others, or something in need of self management.
An assessment of psychological well-being should be made at least annually, at a
review of the patient’s health, and at other times if necessary and will provide
information for the ongoing management of the individual patient. Aggregated
longitudinal measures can indicate the appropriateness, or otherwise, of the care
programme in meeting patients’ psychological needs.
At present there is no validated instrument in routine use to assess the
psychological well-being of the diabetic patient, although a number (Hutchinson et
al. 1995; Bradley 1994) have been used in diabetic populations with encouraging
results. The issues that need to be addressed when considering assessing this aspect
of diabetic care have been well documented by Bradley.
Clinical audit; trends over time.
Clinicians, provider management, commissioners, public.
It is recognised that different configurations of services are available in different
places and that this may have a direct effect on the results obtained through the use
of such indicators. While this may be considered to be an important assessment of
‘outcome’ e.g. a particular configuration is preferred by patients, it is important to
understand how such effects impact on the benefits to be obtained in respect of the
clinical and other dimensions of care.
Title
Intervention aim
Definition
Rationale
Potential uses
Potential users
Possible confounders
Candidate indicator 30 Characteristics
Specificity: Condition-specificPerspective: PatientTimeframe: Cross-sectional
Outcome relationship: Direct

82
Diabetes Outcome Indicators
No specific measure to support this indicator has so far been identified. A selected
instrument might be applied at the time of an annual review of a patient’s health
either through personal interview or through the administration of a questionnaire.
As with some other indicators, specification of a suitable data collection method
may have to consider the role of carers as informants, in those cases where direct
data collection from the patient is impractical.
The indicator might also be derived from the UK Diabetes Dataset but the
DIABCARE Dataset does not contain fields to address this indicator. The particular
fields required are ‘G-DEPR-WB’ and ‘D-DEPR-WB’ (UKDD) which refer to scores
obtained from the Depressed Well-being Scale which that dataset has proposed
(Wilson et al. 1993).
As indicated above, the chosen instrument should have been previously tested and
validated within a diabetic population. The quality of the data will also be
dependent on the completeness of its application within individual practices i.e.
requiring the identification of patients with diabetes and the instrument’s
application, an adequate response rate from patients and appropriate recording and
interpretation of results.
No specific points.
Development and testing of appropriate data collection methods.
F - To be further developed either because the indicator specification is
incomplete.
Bradley, C. (1994). Handbook of psychology and diabetes. Harwood Academic
Publishers.
Hutchinson, A., McColl, E., Meadows, K., Riccalton, K., and Fowler, P. (1995). A
health status measures guide for asthma & diabetes. Universities of Hull and
Newcastle.
Tunbridge, W. M., and Home, P. D. (1991). Diabetes and endocrinology in clinical
practice. Edward Arnold, London.
Wilson, A. E., and Home, P. D. for a Working Group of the Research Unit of the
Royal College of Physicians and the British Diabetic Association (1993). A dataset to
allow exchange of information for monitoring continuing diabetes care. Diabetic
Medicine, 10, 378-390.
Data sources
Data quality
Comments
Further work required
Conclusion & priority
References
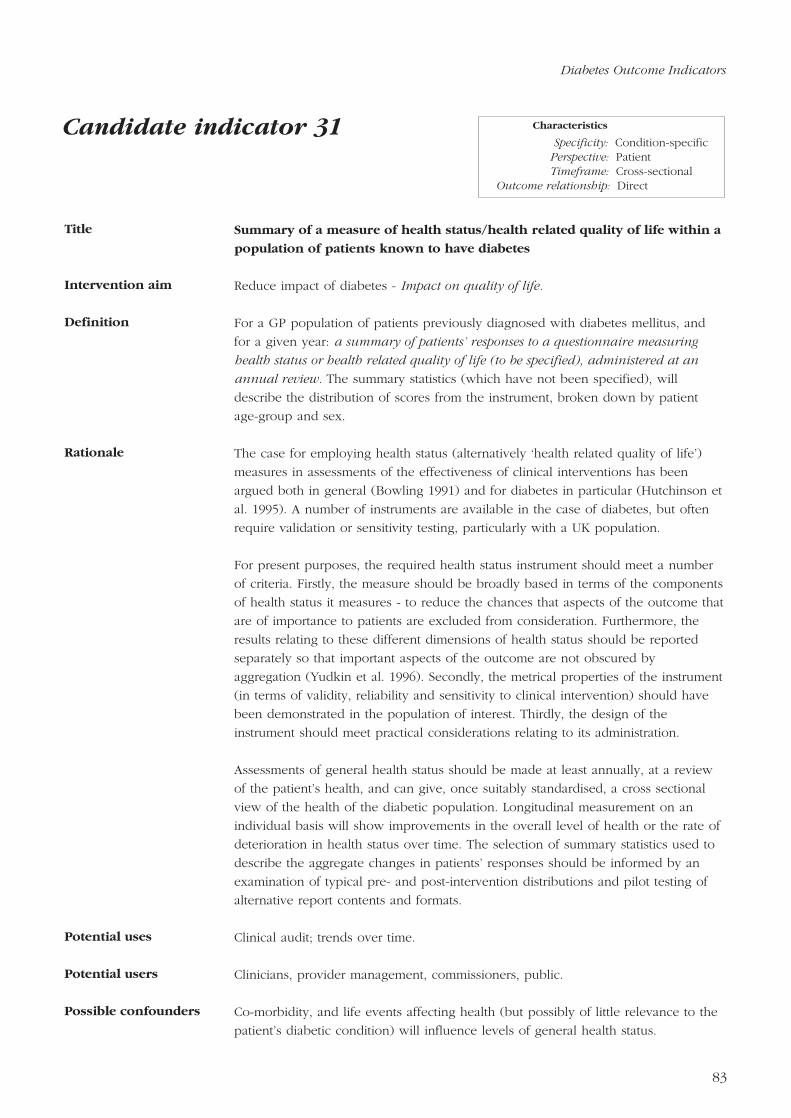
83
Diabetes Outcome Indicators
Summary of a measure of health status/health related quality of life within a
population of patients known to have diabetes
Reduce impact of diabetes - Impact on quality of life.
For a GP population of patients previously diagnosed with diabetes mellitus, and
for a given year: a summary of patients’ responses to a questionnaire measuring
health status or health related quality of life (to be specified), administered at an
annual review. The summary statistics (which have not been specified), will
describe the distribution of scores from the instrument, broken down by patient
age-group and sex.
The case for employing health status (alternatively ‘health related quality of life’)
measures in assessments of the effectiveness of clinical interventions has been
argued both in general (Bowling 1991) and for diabetes in particular (Hutchinson et
al. 1995). A number of instruments are available in the case of diabetes, but often
require validation or sensitivity testing, particularly with a UK population.
For present purposes, the required health status instrument should meet a number
of criteria. Firstly, the measure should be broadly based in terms of the components
of health status it measures - to reduce the chances that aspects of the outcome that
are of importance to patients are excluded from consideration. Furthermore, the
results relating to these different dimensions of health status should be reported
separately so that important aspects of the outcome are not obscured by
aggregation (Yudkin et al. 1996). Secondly, the metrical properties of the instrument
(in terms of validity, reliability and sensitivity to clinical intervention) should have
been demonstrated in the population of interest. Thirdly, the design of the
instrument should meet practical considerations relating to its administration.
Assessments of general health status should be made at least annually, at a review
of the patient’s health, and can give, once suitably standardised, a cross sectional
view of the health of the diabetic population. Longitudinal measurement on an
individual basis will show improvements in the overall level of health or the rate of
deterioration in health status over time. The selection of summary statistics used to
describe the aggregate changes in patients’ responses should be informed by an
examination of typical pre- and post-intervention distributions and pilot testing of
alternative report contents and formats.
Clinical audit; trends over time.
Clinicians, provider management, commissioners, public.
Co-morbidity, and life events affecting health (but possibly of little relevance to the
patient’s diabetic condition) will influence levels of general health status.
Title
Intervention aim
Definition
Rationale
Potential uses
Potential users
Possible confounders
Candidate indicator 31 Characteristics
Specificity: Condition-specificPerspective: PatientTimeframe: Cross-sectional
Outcome relationship: Direct

84
Diabetes Outcome Indicators
No existing measures to support this indicator have so far been identified. A
selected instrument might be applied at the time of an annual review either
through personal interview or through the administration of a questionnaire. As
with some other indicators, specification of a suitable data collection method may
have to consider the role of carers as informants, in those cases where direct data
collection from the patient is impractical. Neither the UK Diabetes Dataset nor the
DIABCARE Dataset include fields that would enable this indicator to be derived
from them.
As indicated above, the chosen instrument should have been previously tested and
validated within a diabetic population. The quality of the data will also be
dependent on the completeness of its application within individual practices i.e.
requiring the identification of patients with diabetes and the instrument’s
application, an adequate response rate from patients and appropriate recording and
interpretation of results. Use of such health status questionnaires within the UK has
generally shown acceptable response rates and good validity and reliability,
although the latter requires attention to training if interviewers are to be used.
Biases can be introduced, when using particular forms of administration, by
excluding or limiting access from e.g. non-English speakers, those who do not own
telephones etc.
No specific points.
Development and testing of appropriate data collection methods.
F - To be further developed because the indicator specification is
incomplete.
Bowling, A. (1991). Measuring health: review of quality of life measurement scales.
Open University Press, Milton Keynes.
Hutchinson, A., Hewison, J., and Eccles, M. (1996). Assessing health outcomes in
chronic disease. In Health outcome measures in primary and out-patient care (ed.
A. Hutchinson, E. McColl, M. Christie, C. Riccalton). Harwood Academic Publishers,
Amsterdam.
Yudkin, J. S., Blauth, C., Drury, P., Fuller, J., Henley, J., Lancaster, T., Lankester, J.,
Lean, M., Pentecost, B., Press, V., and Rothman, D. (1996). Prevention and
management of cardiovascular disease in patients with diabetes mellitus: an
evidence base. Diabetic Medicine, 13, S101-S121.
Data sources
Data quality
Comments
Further work required
Conclusion & priority
References

85
Diabetes Outcome Indicators
Summary of a measure of satisfaction with service within a population of
patients known to have diabetes
Reduce impact of diabetes - Impact on quality of life.
For a GP population of patients previously diagnosed with diabetes mellitus, and
for a given year: a summary of patients’ responses to a questionnaire measuring
satisfaction with in-patient care and/or community care (to be specified)
administered at the time of an annual review. The summary statistics (which have
not been specified), will describe the distribution of scores from the instrument,
broken down by patient age-group and sex.
While patient satisfaction is itself a desirable outcome, there is also evidence that
care which is less satisfactory to the patient is also less effective (Kaplan et al.
1989). It has also been shown that patients’ reported levels of satisfaction can reflect
doctors’ technical competence as judged by independent, professional assessors
(Dimatteo and Hays 1980).
Clinical audit; provider based comparisons. Trends over time.
Clinicians, provider management, commissioners, public.
A range of social and demographic variables have been shown to influence patient
satisfaction (Fitzpatrick 1990). As a minimum, comparative analyses of satisfaction
would be informed by knowledge of the age/sex of patients within different
populations.
There are a number of generic measures that have been widely used to assess
patient satisfaction (Thompson 1988; Smith 1992; Wilkin et al. 1992) within the NHS
although these have been designed for different purposes and for different modes
of application. Before selecting a specific instrument, it is necessary to decide on
the focus of the indicator e.g. acute episode, general management of the patient
etc., and the mode of application, as well as understanding the need to ensure the
appropriateness of the particular instrument to the survey’s purpose (Bradley 1994).
The indicator might also be derived from the UK Diabetes Dataset but the
DIABCARE Dataset does not contain the relevant fields. The particular field required
is ‘SATIS-SERV’ (UKDD).
One criticism of patient satisfaction surveys is that the results are insensitive
suggesting that the majority of patients are highly satisfied with their care. Concerns
have also been expressed as to the potential bias resulting from selecting out
certain patients unable to participate in the survey and the lack of a well
established, valid and reliable measure of satisfaction.
Title
Intervention aim
Definition
Rationale
Potential uses
Potential users
Possible confounders
Data sources
Data quality
Candidate indicator 32 Characteristics
Specificity: Condition-specificPerspective: PatientTimeframe: Cross-sectional
Outcome relationship: Direct

86
Diabetes Outcome Indicators
Needs validation against objective measures of quality.
Selection of a generic measure or development of condition specific questionnaire,
on the basis of pilot data collection experience with patients under care for
diabetes.
F - To be further developed because the indicator specification is
incomplete.
Bradley, C. (1994). Handbook of psychology and diabetes. Harwood Academic
Publishers.
Dimatteo, M. R., and Hays, R. (1980). The significance of patients’ perceptions of
physician conduct: a study of patient satisfaction in a family practice centre.
Journal of Community Health, 6, 18-34.
Fitzpatrick, R. (1990). Measurement of patient satisfaction. In Measuring the
outcomes of medical care (ed. A. Hopkins and D. Costain). Royal College of
Physicians, London.
Kaplan, S., Greenfield, S., and Ware, J. (1989). Assessing the effects of physician-
patient interactions on the outcomes of chronic disease. Medical Care, 27, S110-
S127.
Smith, C. (1992). Validation of a patient satisfaction system in the United Kingdom.
Quality Assurance in Health Care, 4, 171-177.
Thompson, A. G. H. (1988). The measurement of patient’s perceptions of the quality
of hospital care. Doctoral thesis, University of Manchester.
Wilkin, D., Hallam, L., and Doggett, M. (1992). Measures of need and outcome for
primary health care. Oxford University Press.
Comments
Further work required
Conclusion & priority
References

87
To be implemented generally on a routine basis
5.1 It is recommended that the following indicators be implemented generally
on a routine basis (the numbers refer to the indicator specifications in
Section 4) :
1: prevalence of clinically diagnosed diabetes
15: number of patients who have had at least one hypoglycaemic
emergency, within the last year, that required therapeutic
intervention by a health professional expressed as a proportion
of a population of patients known to have diabetes
16: number of patients who have had at least one hyperglycaemic
emergency, within the last year, that required hospital admission
expressed as a proportion of a population of patients known to
have diabetes
18A: SMR for death due to diabetes mellitus
18B: years of life lost per 10,000 resident population by death due to
diabetes mellitus
18C: years of life lost by death due to diabetes mellitus.
Indicators 18A-C are currently included in the Public Health Common
Data Set.
5.2 The prevalence of clinically diagnosed diabetes defines the denominator
population for many of the other indicators and also gives a basis for the
planning of services. The number of people with undiagnosed diabetes is
unknown, except where it has been ascertained in local population-based
prevalence surveys. However, this group needs to be borne in mind as they
are also in need of services.
5.3 The proportion of people known to have diabetes who have at least one
hypoglycaemic emergency reflects the quality of self care undertaken by
people with diabetes and this may be related to the standard of diabetic care
provided for them by health professionals. This indicator will allow monitoring
of trends over time, but its validity will be dependent on the completeness of
the data available. Many such episodes are treated in primary care or A&E
departments where the data are not readily available.
5.4 Hyperglycaemic episodes requiring admission to hospital carry a high
risk to the patient and the data quality is good as the indicator is derived from
in-patient data. This indicator will facilitate monitoring of trends over time and
the identification of populations with higher than average rates of admission.
5. RECOMMENDATIONS

88
Diabetes Outcome Indicators
5.5 Three mortality indicators are already calculated for the Public Health
Common Data Set. The information can be used to monitor trends over time
and identify populations with higher than expected mortality related to
diabetes. It is important that due emphasis is given to accurate death
certification as the underlying cause of death is not always completed
correctly.
To be implemented generally by periodic survey
5.6 It is recommended that the following indicator be implemented generally by
periodic survey:
3A: prevalence of obesity in persons aged 16-64 (defined as BMI > 30
kg/m2).
5.7 Obesity is a known risk factor for diabetes. The data are currently collected
nationally but they could also be collected locally by periodic survey.
To be implemented where local circumstances allow on a routine basis
5.8 It is recommended that the following indicators be implemented where local
circumstances allow on a routine basis:
Risk factors
4: percentage of patients, aged 16 and over and known to have
diabetes, who smoke
5: percentage of patients, aged 16-64 and known to have diabetes,
who have a BMI > 30 kg/m2
6: percentage of patients known to have diabetes with elevated blood
pressure: Type 1 > 140/90 mm Hg.; Type 2 > 160/90 mm Hg.
Metabolic control
7: percentage of patients known to have diabetes with HbA1C that
was > 7.5% on a DCCT standardised assay, at time of last recording
within the previous year.

89
Diabetes Outcome Indicators
Markers for late complications
8: percentage prevalences of retinopathy and maculopathy within a
population known to have diabetes
9: percentage prevalence of microalbuminuria within a population
known to have Type 1 diabetes
10: percentage prevalence of protective sensation loss within a
population known to have diabetes
11: percentage prevalence of absence of both foot pulses in at least one
foot within a population known to have diabetes
12: percentage of patients known to have diabetes where there is no
record of blood pressure, the retinae or the feet having been
assessed within the previous year.
Symptoms
13: percentage prevalence of symptomatic angina within a population
known to have diabetes
14: percentage prevalence of claudication within a population known
to have diabetes.
Incidence of acute complications
17: case fatality rate associated with acute diabetic episodes treated in
hospital.
Incidence of long term complications
19: annual incidence of severe visual impairment (visual acuity < 6/60
in the better eye) within a population of patients known to have
diabetes
20: annual incidence of leg amputation above the ankle within a
population of patients known to have diabetes
21: annual incidence of amputation below the ankle within a
population of patients known to have diabetes
22: annual incidence of myocardial infarction within a population of
patients known to have diabetes
23: annual incidence of stroke within a population of patients known
to have diabetes.

90
Diabetes Outcome Indicators
Complications of pregnancy
25: rates of late stillbirth and perinatal mortality in deliveries from a
population of patients known to have diabetes and who become
pregnant
26: the rate of delivery by caesarean section, in deliveries from a
population of patients known to have diabetes and who become
pregnant
27: the incidence of delivered babies with birthweight greater than the
90th centile (allowing for gestational age) from within a population
of patients known to have diabetes and who become pregnant
28: the incidence of occurrence of specific congenital malformations
(i.e. neural tube defects, cardiac and renal malformation) in
deliveries from a population of patients known to have diabetes
and who become pregnant
29: the rate of admission to special care baby units (and nurseries) of
babies delivered from a population of patients known to have
diabetes and who become pregnant.
5.9 Monitoring the prevalence of risk factors for complications of diabetes
including smoking, obesity and elevated blood pressure will facilitate the
assessment of the impact of health promotion measures in people with
diabetes in areas where the information can be collected.
5.10 Good glucose control reduces the incidence of complications of diabetes and
HbA1c is the best way of assessing glucose control. This indicator will show
the proportion of patients whose diabetes is well controlled.
5.11 The indicators relating to the prevalence of the late complications of diabetes
are retinopathy and maculopathy, microalbuminuria, loss of protective
sensation, absence of the foot pulses. Some complications may be avoided
by good glucose control. When present, they require monitoring or
appropriate treatment to minimise the sequelae. These indicators demonstrate
the outcome of earlier diabetic care and that the complications have been
identified. Indicator 12 highlights people who are not recorded as having the
recommended assessments within the past year. This group is unlikely to be
receiving adequate care.
5.12 Vascular disease is a common complication of diabetes. The symptomatic
indicators, the prevalence of angina and intermittent claudication, may
reflect the patients’ chosen lifestyles but also the advice and care they have
received.

91
Diabetes Outcome Indicators
5.13 Fatalities associated with acute diabetic episodes treated in hospital will be
relatively rare but they are important as they may be avoidable and may
reflect the standard of care the individual has received previously. The small
numbers will require careful interpretation.
5.14 The specified indicators relating to the incidence of late complications of
diabetes are the annual incidence of severe visual impairment,
amputation above the ankle, amputation below the ankle, myocardial
infarction, and stroke. Comparison of age-adjusted incidence rates may
allow monitoring of trends over time and comparison between geographical
areas. The effectiveness of preventive strategies may be assessed.
5.15 Diabetes in pregnancy increases the risk to the mother and infant. We have
therefore specified indicators relating to mortality, the rate of intervention
in delivery and the size of the infant. The specific effect that diabetes may
have on the development of the fetus is reflected by the incidence of
specific congenital malformations. The rate of admission to a special care
baby unit is an indirect indicator relating to the infants’ condition at birth.
Together these indicators will give some reflection of the outcome of care in
pregnancy, although they will have to be interpreted with care as none of
them occurs only in relation to diabetes.
To be implemented where local circumstances allow by periodic survey
5.16 It is recommended that the following indicator be implemented where local
circumstances allow by periodic survey:
24: number of patients who have started renal replacement therapy or
have had a creatinine level > 500 µmol/litre recorded for the first
time within the last year, expressed as a proportion of a
population of patients known to have diabetes.
5.17 Recording those who have started renal replacement therapy or have a
creatinine level > 500 µmol/litre identifies those who may benefit from a
renal transplant and also those whose care may have been less than ideal in
the past as the incidence of renal failure in diabetes is thought to be reduced
with good metabolic control. Trends over time and comparisons of
geographical areas may highlight areas where diabetic care may need to be
reviewed to reduce the incidence of renal disease.

92
Diabetes Outcome Indicators
To be implemented following IT developments on a routine basis
5.18 It is recommended that the following indicator be implemented following IT
developments on a routine basis:
2: percentage prevalence of retinopathy and maculopathy at time of
diagnosis of diabetes.
5.19 The presence of retinopathy or maculopathy at the time of diagnosis
suggests the late diagnosis of diabetes, but only some general practitioners
may code the result of examination, particularly if it is negative. This indicator
can be implemented where the findings are routinely coded on computer and
the data can be aggregated. Small numbers may make the interpretation of this
indicator difficult in practices gathering the data.
To be further developed
5.20 It is recommended that the following indicators require further development
either because the link with effectiveness is not clear or the indicator
specification is incomplete:
3B: proportion of people undertaking vigorous physical activity in the
previous 28 days
3C: proportion of people who, on average, consume fruit or vegetables
or salad each day, within the general population
30: summary of a measure of psychological well-being within a
population of patients known to have diabetes
31: summary of a measure of health status / health related quality of
life within a population of patients known to have diabetes
32: summary of a measure of satisfaction with service within a
population of patients known to have diabetes.
5.21 Indicators 3B and C are currently collected by the Office of National Statistics
as part of the Health Survey of England. The results should be reviewed in the
context of diabetes to see if vigorous physical activity and consumption
of fruit or vegetables are directly related to diabetes. They are important
generally in the promotion of better health.
5.22 Measures of the impact of diabetes on individuals’ lives are relevant in order
to identify areas that could be improved, as there is some evidence that such
improvements may lead to better metabolic control as well. However,
indicators of psychological well-being, health status / health related
quality of life, and satisfaction with service are still being developed and
no one measurement instrument can currently be recommended as being
superior for use in this context.

93
Diabetes Outcome Indicators
Conclusions
5.23 As has been described in the indicator specifications, indicators collected
routinely may be used to highlight differences:
- over time
- between providers
- between groups of patients.
5.24 The main use of such indicators is to make broad comparisons to identify
significant differences or anomalies that require further detailed examination.
Small differences in routine indicators may be attributable to a wide range of
factors, many of which will probably not reflect differences in health outcomes
which can be attributed to the process of care.
5.25 Some indicators may best be used in combination to aid interpretation. For
example:
- The indicators relating to pregnancy (paragraph 5.15) should be considered
as a group as individually they give little interpretable information.
- It would suggest that there are problems with a local diabetic service if,
there is generally poor metabolic control as shown by HbA1c (Indicator 7)
with a high incidence of hypoglycaemic or hyperglycaemic emergencies
(Indicators 15 & 16), and an increased number of people with diabetes with
no record of routine assessment in the past years (Indicator 12) compared
to other providers.
- If the incidence of late complications (Indicators 19-24) including severe
visual impairment, amputation above and below the ankle, myocardial
infarction, stroke and end stage renal failure is raised compared with other
providers or the population, the prevalence of markers for late
complications (Indicators 8-10) such as retinopathy, microalbuminuria and
loss of sensation should be reviewed to see if they are also raised.

95
Summary
A.1 Over the last few years a major component of the Department of Health’s and
NHS Executive’s strategy has been to promote the development and use of
measures of health outcome. In July 1993 the Central Health Outcome Unit
(CHOU) was set up within the Department of Health (DoH). Commissioned
by the DoH, in 1993 a feasibility study of potential outcome indicators was
published by the Faculty of Public Health Medicine and a package of
indicators was published by the University of Surrey for consultation.
Following these two phases of development, a third phase of work was
initiated by the CHOU. Its remit is to report on ‘ideal’ health outcome
indicators.
Central Health Outcome Unit
A.2 The CHOU is an internal DoH unit whose goal is ‘to help secure continuing
improvement in the health of the people of England through cost-effective
and efficient use of resources’ (Lakhani 1994). The objectives of the Unit are
to:
- encourage and co-ordinate the development of health outcome assessment,
particularly in respect of the development of appropriate methods,
appropriate data collection systems, expertise, analytical skills, and
interpretation
- encourage and support the use of health outcome assessment and
information in making policy about health interventions and in the
planning, delivery and monitoring of services.
A.3 Several national committees have a special interest in outcomes and have
been kept informed of progress:
- Clinical Outcomes Group
- Public Health Network
- CMO Working Group on Information Management and Technology.
APPENDIX A: BACKGROUND TO THE WORK

96
Diabetes Outcome Indicators
Phases 1 and 2
A.4 The Faculty of Public Health Medicine was commissioned to undertake a
feasibility study of potential indicators which reflect health end-points for
health services and which cover topics in which health care has an important
contribution to make. This work (McColl and Gulliford 1993) was constrained
in that the set of indicators were to:
- be based on reliable routinely collected data
- reflect health service interventions rather than the wider influences on
health.
A.5 The University of Surrey was commissioned to produce a package of
comparative statistics based on the outcome measures recommended in the
feasibility study. Forty indicators were chosen, 18 for maternal and child
health, three for mental health and the rest for other topics in adult health.
The publication (Department of Health 1993) contained indicator definitions,
maps and scatter plots showing geographical variations, and tables presenting
the rates, with corresponding observed numbers and confidence intervals
when appropriate.
The Phase 3 work : ideal indicators of health outcomes
A.6 In the third and current phase of the work on health outcomes a number of
research institutions were commissioned to assist in developing a structured
approach to identify indicators to cover a number of clinical topics. The prime
contractor is the Unit of Health-Care Epidemiology, Department of Public
Health and Primary Care, University of Oxford.
A.7 The respective roles of the supporting organisations were as follows:
- Unit of Health-Care Epidemiology, University of Oxford, to provide
epidemiological and managerial support to the Group and co-ordinate the
input of the other agencies.
- CASPE Research, in London, to provide technical advice with regard to the
indicators and their data sources, and prepare the detailed indicator
specifications.
- Royal College of Physicians’ Research Unit, in London, to co-ordinate the
clinical input.

97
Diabetes Outcome Indicators
A.8 In the previous work a key criterion for selection of indicators was the
requirement for the work to be based on routinely available data. This
practical constraint has meant that the recommended indicators selected were
an opportunistic rather than an ideal set. This inevitably led, as the DoH
acknowledged, to a bias towards outcomes which may be measurable now
but which may not necessarily be those which are most appropriate and most
needed. The aim of the third phase is to advise on and develop ‘ideal’
outcome indicators without confining recommendations to data which have
been routinely available in the past.
A.9 The initial task of the third phase of the work was to select clinical topics for
detailed study. In order to ensure that the work would be manageable, and
that the NHS would have the capacity to absorb the output, the CHOU
decided to limit the activity to five clinical topics a year.
A.10 A workshop to initiate the work which was attended by over 70 individuals
representing a wide range of interests was held in January 1995. A report of
the proceedings has been published (Goldacre and Ferguson 1995). The main
aims were:
- to identify the criteria which should be used to choose clinical topics for
the Phase 3 work
- to suggest a list of potential clinical topics which workshop participants
would like to be included in the Phase 3 work.
A.11 Following further consultation within and outside the DoH, the CHOU
decided in June 1995 to include the following topics in the first two years of
Phase 3 work:
- Asthma
- Breast cancer
- Cataract
- Diabetes mellitus
- Fracture of neck of femur
- Incontinence
- Myocardial infarction
- Pregnancy and childbirth
- Severe mental illness
- Stroke.

98
Diabetes Outcome Indicators
A.12 The Group was influenced in its work by considering the potential uses of
outcome information, as follows:
- for clinical decision-making and audit of clinical work, including:
• audit and management of health professionals’ practice
• research
- for informing decisions about the strategic and operational development of
services
- for comparisons of organisations in the delivery of services which may be:
• provider based
• population based
- for assessing progress towards agreed standards or targets for health
outcomes, agreed nationally or locally, which may be:
• identified from the research literature
• set by clinical and managerial decisions.
A.13 Current managerial interests which are relevant to the use of health outcome
information include:
- The NHS goal ‘to secure, through the resources available, the greatest
improvement in the physical and mental health of people in England’
- clinical audit
- evidence-based commissioning.
A.14 An important purpose of this work has been to recommend indicators which,
if possible, would allow ‘health gain’ to be assessed alongside information
used to measure health service input. Our particular focus has been to make
recommendations about aggregated statistical information about people with
diabetes which can be used to:
- enable providers of care to review outcomes of the care of their patients
- make comparisons, where appropriate, of health outcomes against locally
agreed targets and/or between different places and/or over time.
A.15 Information for outcome indicators may be obtained from systems which
collect data routinely as part of clinical care, but when such information is not
routinely necessary, or when the cost or complexity of this is high, use should
be made of sample survey techniques or periodic surveys.

99
Diabetes Outcome Indicators
A.16 Health indicators are more likely to be successful if they fit naturally into the
everyday work of health care professionals than when they have to be
collected as a separate activity. The aim is to have indicators that are:
- Relevant because professionals use them everyday in clinical management
and will record them accurately.
- Reliable because they can be validated or cross checked from other
sources.
- Responsive because they readily identify changes in the patient’s state of
health.
- Research-based because there is a likely link between processes of care
and outcome.
A.17 In common with the approach taken to other types of indicators by the NHS,
the Group recognises that useful outcome indicators should be capable of
identifying circumstances worthy of investigation but that, in themselves, they
may not necessarily provide answers to whether care has been optimal or
sub-optimal. In particular it is recognised that there may be difficulties in
drawing causal conclusions - say, that a particular aspect of care caused a
particular outcome - from indicators derived from non-experimental clinical
settings. Nonetheless the vast majority of clinical care is delivered in routine
rather than experimental practice. The assessment of its outcomes entails, by
definition, the use of observational rather than experimental data.
A.18 To be useful, work on ‘ideal’ outcome aspects needs to incorporate
considerations of practicability. It is a time of rapid change in information
technology. What may be feasible now in some places may not be feasible
everywhere. What may not be practical today may become so in a year or
two.

101
B.1 The Diabetes Working Group was formally constituted in April 1996 and met
three times, completing its work in February 1997. The Report was completed
in September 1997. The terms of reference were:
- To advise on indicators of health outcomes of the prevention and treatment
of diabetes and its complications.
- To make recommendations about the practicalities of the compilation and
interpretation of the indicators, and to advise if further work is needed to
refine the indicators and/or make them more useful.
B.2 The membership of the Working Group and the staff of the supporting
organisations are shown below. The composition of the Group included the
major professional and managerial groups and representatives of patients and
carers involved with the prevention, management and care of diabetes.
Chairman and members
Physicians : Philip Home Newcastle (Chairman)
Nick Vaughan Brighton
Ken Paterson Glasgow
GPs : Michael Hall Exeter
Roger Gadsby Nuneaton
Colin Bradshaw South Shields
Nurse : Susan Higgins Manchester
Chiropodist : Ali Foster London
Dietitian : Norma McGough London
Researchers : Rhys Williams Leeds
Michael O’Brien Northumberland
CEOs : Mark Common Wrexham
Chris Newton South Yorkshire
Voluntary body : Robert Snowden British Diabetic
Association
DoH : Ann Dawson -
Netta Lloyd-Jones -
Academic support and secretariat
Michael Goldacre, Alastair Mason, Ewan Wilkinson & John Fletcher, University
of Oxford
James Coles & Robert Cleary, CASPE Research
APPENDIX B: DIABETES WORKING GROUP

103
C.1 Candidate outcome indicators were identified by the Group with the help of
the following:
- the health outcome model for diabetes (see Section 2)
- various classifications of the characteristics of outcome indicators.
C.2 The Group noted that indicators may be related to:
i. causal factors in the general population or relating to the individual
ii. knowledge, attitudes, behaviour in the general population
iii. knowledge, attitudes including satisfaction with service delivery and
behaviour of individual patients with diabetes
iv. patients’ symptoms, function, health status and well-being
v. patients’ clinical state
vi. patients’ pathological/physiological state
vii. events occurring to patients as endpoints of the earlier occurrence of
disease and/or interventions such as contacts with general practitioners,
issuing of prescriptions, out-patients visits, in-patient admissions, death
viii knowledge, satisfaction with service delivery, emotional and physical
well-being of carers.
C.3 The data sources for the indicator entities noted in paragraph C.2 will differ.
It is likely that:
- indicators for (i) and (ii) would come from population surveys
- indicators for (iii), (iv) and (viii) would come from patients either
opportunistically or when specifically called
- indicators for (v) and (vi) would come from doctors and other health
professionals
- indicators for (vii) would come from administrative information systems.
C.4 The Group recognised the cost and complexity of obtaining information from
continuous data collection systems. Particular consideration was given to
obtaining outcome indicator data from sample survey techniques such as a
periodic survey when it is not essential to have continuously collected
information.
APPENDIX C: METHODS FOR CHOOSING INDICATORS

104
Diabetes Outcome Indicators
C.5 Four characteristics of an outcome indicator have been identified and each has
been classified. They are:
- measurement perspective, relating to whose perspective the indicator is
most relevant (see paragraph C.6)
- specificity (see paragraph C.7)
- measurement timeframe (see paragraph C.8)
- outcome relationship, in that the indicator is either a direct or an indirect,
proxy measurement of outcome (see paragraph C.9)
C.6 For the Group’s purposes measurement perspective was classified as that from
the patient’s, the carer’s, the clinical, or the population’s viewpoint. In the
treatment of diabetes, for example, a measure of quality of life may be most
relevant to the patient’s perspective while clinical concerns may properly focus
on biochemical measures. The population perspective has a broader view, best
addressed by measures able to assess the burden of the condition as a whole.
Of course, these perspectives are not necessarily in opposition and will often
be associated with shared goals. Where possible, a set of indicators should be
developed which satisfies all three measurement perspectives.
C.7 The specificity of an indicator relates to whether it is specific or generic in
application. For example, the measurement of blood glucose is specific to
carbohydrate metabolism. The measurement of general health status is much
less specific and would be influenced by a number of conditions. Condition-
specific indicators have the advantage that their relative insensitivity to other
conditions is likely to increase their sensitivity to changes in the condition of
interest. Generic measures provide outcomes relevant to a wide range of
conditions. A comprehensive indicator set might contain examples of both
generic and specific indicators.
C.8 The measurement timeframe relates to whether the indicator is:
- cross-sectional and thus an indicator at a single point in time for any one
individual
- a longitudinal measure of progression over time for any one individual.
C.9 The Group’s main task has been to develop direct indicators of health
outcome although in many areas it may be difficult to identify or obtain such
information. However, it is recognised that some care processes are so closely
related to the production of benefits that the successful completion of the
intervention might be used as a proxy measure of the actual outcome. In the
absence of direct outcomes, proxy indicators have therefore been developed.

105
Diabetes Outcome Indicators
C.10 There is increasing recognition of the importance of outcome measures
derived from data generated by patients and carers. For the purposes of our
work, three main areas of interest have been identified:
- impact of the condition on the patient and/or carer
- satisfaction of the patient and/or carer with the care provided
- awareness of the patient and/or carer of the management of the condition.
C.11 The condition may impact on the patient in terms of:
- general health
- specific impairments associated with the condition
- disabilities
- handicaps.
C.12 The condition may impact on carers in terms of their:
- physical health
- psychological health
- social functioning.
C.13 With the assistance of the check-lists and a knowledge of the condition the
Group addressed the following key questions:
- What are health professionals trying to achieve for each patient?
- What can each patient realistically expect will be achieved for him/herself?
- What should be achieved for the population as a whole in respect of the
prevention, care or cure of the condition?

107
APPENDIX D: GUIDANCE NOTES FOR INDICATOR SPECIFICATIONS
A short title to identify the indicator
Distinguishes the level of intervention for which the indicator is primarily
developed. It is assumed that, for a given condition, an ideal set of indicators
would be reasonably balanced across the spectrum of health intervention stages.
For diabetes these stages are:
- reduce or avoid risk of diabetes.
- detect diabetes early.
- reduce risk of complications of diabetes.
- reduce the impact of diabetes and its complications once developed.
Classifies the indicator on four dimensions:
- Specificity: condition specific or generic.
- Perspective: population, clinical, patient or carer.
- Timeframe: cross-sectional measure or longitudinal assessment of change.
- Outcome relationship: whether it is a direct measure of outcome or an indirect
measure of structure or process, used as a proxy for outcome.
In addition to a definition of the variable of interest, the description
specifies:
- how the variable is to be aggregated across cases, e.g. definitions of both a
numerator and a denominator
- if a variable is to be reported with respect to a set of denominators, e.g.
mortality broken down by age and sex
- if appropriate, how longitudinal change in the variable is to be represented, e.g.
over what time interval and whether absolute difference or proportional change.
A brief statement of the reasons and objectives behind the indicator, both in terms
of the issues it addresses and it’s selection from a range of potential alternatives.
A single definition of diabetes will be used as identified in paragraph 2.1. Its
application is affected by the rationale, location of incidence and data sources used
and these factors are addressed in each indicator definition.
The following classification has been used:
- local clinical practice
- clinical audit
- provider based comparisons
- population based comparisons
- assessment of regional/national trends or progress towards targets.
It is recognised that a given indicator may serve several purposes. Indicators that
Indicator title
Intervention aim
Characteristics
Indicator definition
Rationale
Diabetes definition
Potential uses

108
Diabetes Outcome Indicators
are valuable for the management of individual patients are likely to have practical
advantages with respect to data collection in a clinical setting. However, in order
for such indicators to be useful for other purposes, a method of aggregation across
cases must be specified for the variable of interest.
The following classification has been used:
- clinicians
- provider management
- commissioners
- national/regional policy makers
- consumers/public.
This section has attempted to identify the population risk factors likely to influence
the outcome indicator, and therefore useful in its interpretation. Where such factors
are well defined and have a clear or potential association with the outcome of
interest, they may be used to specify denominators to be included in the indicator
definition itself.
Where possible, existing sources of data have been identified for deriving the
indicator and the degree to which complete coverage of the population of interest
would be obtained has been noted. Where data are not widely available from
existing systems, suggestions for new methods of data collection, capable of wide
implementation have been made.
While the theoretical capabilities of existing and proposed information systems are
outlined above, the actual or expected limitations of those systems - in terms of
their completeness and accuracy etc. - are noted in this section.
General comments regarding the indicator’s definition, validity, practicality etc.
Suggestions about the additional research and development work
required to complete the indicator’s specification to a level appropriate for large
scale piloting.
A statement indicating the Working Group’s assessment of the priority
for implementation.
Appropriate references used in the construction of the indicators.
Potential users
Possible confounders
Data sources
Data quality
Comments
Further work required
Conclusions & priority
References
109
Diabetes Outcome Indicators
Bell, J., and Hockaday, T. (1996). Diabetes. In Oxford Textbook of Medicine (ed. D.
Weatherall, J. Ledingham, D. Warrell). Oxford University Press.
Borch-Johnsen, K., Anderson, P. K., and Deckert, T. (1985). The effect of
proteinuria on relative mortality in Type 1 (insulin dependent) diabetes mellitus.
Diabetologia, 28, 590.
Borch-Johnsen, K., Nissen, H., Salling, N., Henriksen, E., Kreiner, S., Deckert, T.,
and Nerup, J. (1987). The natural history of insulin-dependent diabetes in
Denmark: long-term survival - who and why. Diabetic Medicine, 4, 211-216.
Bowling, A. (1991). Measuring health: review of quality of life measurement scales.
Open University Press, Milton Keynes.
Bradley, C. (1994). Handbook of psychology and diabetes. Harwood Academic
Publishers.
British Diabetic Association (1993). What diabetic care to expect: the British
Diabetic Association’s Patients’ Charter. British Diabetic Association, London.
Cheng, H., Kohner, E. M., Keen, H., Blach, R.H., and Hill, D.W. (1975).
Photocoagulation in the treatment of diabetic maculopathy. Lancet, 306, 1110-
1111.
Clinical Standards Advisory Group (1994). Standards of clinical care for people
with diabetes. The Stationery Office, London.
Colhoun, H., and Prescott-Clarke, P. (1996). Health Survey for England 1994. Joint
Health Surveys Unit, SCPR and Dept of Epidemiology and Public Health, University
College, London.
Davidson, J. K. (1983). The Grady Memorial Hospital diabetes programme. In
Diabetes in epidemiological perspective. (Ed. J. Mann, K. Pyorala, and A. Teuscher.).
Churchill Livingstone, Edinburgh.
Dawson, A. (1996). Chronic disease management registers: proceedings of a
workshop. HMSO, London.
Department of Health (1993). Population health outcome indicators for the NHS:
a consultation document. Department of Health, London.
Diabetic Retinopathy Study Research Group (1981). Photocoagulation treatment of
proliferative retinopathy: clinical application. Ophthalmology, 88, 583.
APPENDIX E: REFERENCES

110
Diabetes Outcome Indicators
Diabetes Control and Complications Trial Research Group (1993). The effect of
intensive treatment of diabetes on the development and progression of long-term
complications in insulin-dependent diabetes mellitus. New England Journal of
Medicine, 329, 977-986.
Dimatteo, M. R., and Hays, R. (1980). The significance of patients’ perceptions of
physician conduct: a study of patient satisfaction in a family practice centre. Journal
of Community Health, 6, 18-34.
Edmonds, M. E., Blundell, M. P., Morris, M. E., Thomas, E. M., Cotton, L. T., and
Watkins, P. J. (1986). Improved survival of the diabetic foot: the role of a specialised
foot clinic. Quarterly Journal of Medicine, 60, 763-771.
Edmonds, M., Boulton, A., Buckenham, T., Every, N., Foster, A., Freeman, D., Gadsby,
R., Gibby, O., Knowles, A., Pooke, M., Tovey, F., Unwin, N., and Wolfe, J. (1996).
Report of Diabetic Foot and Amputation Group. Diabetic Medicine, 13, S27-S43.
Fitzpatrick, R. (1990). Measurement of patient satisfaction. In Measuring the outcomes
of medical care (ed. A. Hopkins and D. Costain). Royal College of Physicians, London.
Goldacre, M. J., and Ferguson, J. (1995). Health outcome indicators for the NHS Phase
3: report of a workshop held at the Royal Society of Medicine. Unit of Health-Care
Epidemiology, University of Oxford.
Gulliford, M. C., and Burney, P. G. J. (1991). Year of birth and mortality caused by
diabetes mellitus under 45 years: England and Wales 1927-1986. Journal of Public
Health Medicine, 13, 204-208.
Hawthorne, G., Robson, S., Ryall, E.A., Sen, D., Roberts, S.H., and Ward Platt, M.P. on
behalf of the Northern Diabetic Pregnancy Audit, 1994 (1997). Prospective population
based survey of outcome of pregnancy in diabetic women: results of the Northern
Diabetic Pregnancy Audit, 1994. British Medical Journal, 315, 279-281.
Holmwood, K. I., Williams, D. R. R., and Roland, J. M. (1992). Accident and
emergency. Diabetic Medicine, 9, 379-385.
Houston, A. (1982). Retinopathy in the Poole area: an epidemiological inquiry. In
Advances in diabetes epidemiology (ed. E Eschwege). Elsevier Biomedical Press.
Hutchinson, A., McColl, E., Meadows, K., Riccalton, C., and Fowler, P. (1995). A health
status measures guide for asthma & diabetes. Universities of Hull and Newcastle.
Hutchinson, A., Hewison, J., and Eccles, M. (1996). Assessing health outcomes in
chronic disease. In Health outcome measures in primary and out-patient care (ed. A.
Hutchinson, E. McColl, M. Christie, C. Riccalton). Harwood Academic Publishers,
Amsterdam.

111
Diabetes Outcome Indicators
Institute of Public Health (1995). Public Health Common Data Set. University of
Surrey.
Kaplan, S., Greenfield, S., and Ware, J. (1989). Assessing the effects of physician-
patient interactions on the outcomes of chronic disease. Medical Care, 27, S110-S127.
Jardine Brown, C., Dawson, A., Dodds, R., Gamsu, H., Gillmer, M., Hall, M.,
Hounsome, B., Knopfler, A., Ostler, J., Peacock, I., Rothman, D., and Steel, J. (1996).
Report of the Pregnancy and Neonatal Care Group. Diabetic Medicine, 13, S43-S53.
Kohner, E. M., McLeod, D., and Marshall, J. (1982). Diabetes and the eye. In
Complications of diabetes (ed. H. Keen and J. Jarrett). Edward Arnold, London.
Krans, H. M. J., Porta, M., and Keen, H. (1992). Diabetes care and research in Europe:
the St Vincent Declaration action programme. World Health Organisation,
Copenhagen.
Lakhani, A. (1994). Central Health Outcome Unit. Department of Health, London.
Macleod, C. A., Murchison, L. E., Russell, E. M., and Dingwall-Fordyce, I. (1988).
Measuring outcome of diabetes: a retrospective survey. Diabetic Medicine, 6, 59-63.
Macleod, J., Edwards, C., and Bouchier, I. (1987). Diabetes mellitus. In Davidson’s
principles of medicine. Churchill Livingstone, Edinburgh.
Marks, L. (1996). Counting the cost: the real impact of non-insulin dependent diabetes.
British Diabetic Association, London.
McColl, A. J., and Gulliford, M. C. (1993). Population health outcome indicators for
the NHS: a feasibility study for the Department of Health. Faculty of Public Health
Medicine of the Royal College of Physicians, London.
McNeely, M. J., Boyko, E. J., Ahroni, J. H., Stensel, V. L., Reiber, G.E., Smith, D. G.,
and Pecoraro, R. E. (1995). The independent contributions of diabetic neuropathy and
vasculopathy in foot ulceration: how great are the risks? Diabetes Care, 18, 216-219.
Neil, H. A. W., Thomson, A. V., Thorogood, M., Fowler, G. H., and Mann, J. I. (1989).
Diabetes in the elderly: the Oxford community diabetes study. Diabetic Medicine, 6,
608-613.
Pecoraro, R. E., Geiber, G. E., and Burgess, E. M. (1990). Pathways to diabetic limb
amputation. Diabetes Care, 13, 513-521.

112
Diabetes Outcome Indicators
Piwernetz, K., Bruckmeier, A., Home, P. D., Kleinbreil, L., van Combrugge, P., Sando,
S.H., Brundobler, M., Azzopardi, J., Massi Benedetti, M., Tamas, G., and Kerenyi, S.
(1995). Diabetes Data Set: a key element of the DIABCARE quality network. In The
St Vincent Declaration Newsletter, Supplement 1. World Health Organisation,
Copenhagen.
Smith, C. (1992). Validation of a patient satisfaction system in the United Kingdom.
Quality Assurance in Health Care, 4, 171-177.
Sosenko, J., Kato, M., Soto, R., and Bild, D. E. (1990). Comparison of quantitative
sensory threshold measures for their association with foot ulceration in diabetic
patients. Diabetes Care, 13, 1057-1061.
St Vincent UK Work Group (1996). St Vincent and improving diabetic care. Diabetic
Medicine, 13, S1-128.
Stebbings, W. S. L., and Wood, R. F. M. (1991). Amputations in diabetics. Annals of
Royal College of Surgeons of England, 73, 170-175.
Thompson, A. G. H. (1988). The measurement of patients’ perceptions of the quality
of hospital care. Doctoral thesis, University of Manchester.
Tunbridge, W. M., and Home, P. D. (1991). Diabetes and endocrinology in clinical
practice. Edward Arnold, London.
UK Prospective Diabetes Study Group (1998a). Tight blood pressure control and risk
of macrovascular and microvascular complications in Type 2 diabetes: UKPDS 38.
British Medical Journal, 317, 703-713.
UK Prospective Diabetes Study Group (1998b). Intensive blood sugar control with
sulphonylureas or insulin compared with conventional treatment and risk of
complications in patients with Type 2 diabetes: UKPDS 33. Lancet, 352, 837-853.
Vaughan, N. J. A., and Home, P. D. for the Diabetes Audit Working Group of the
Research Unit of the Royal College of Physicians and the British Diabetic Association
(1995). The UK Diabetes Dataset: a standard for information exchange. Diabetic
Medicine, 12, 717-722.
Viberti, G-C., Marshall, S., Beech, R., Brown, V., Derben, P., Higson, N., Home, P.,
Keen, H., Plant, M., and Wallis, J. (1996). Report on renal disease in diabetes. Diabetic
Medicine, 13, S6-S12.
Wilkin, D., Hallam, L., and Doggett, M. (1992). Measures of need and outcome for
primary health care. Oxford University Press.
113
Diabetes Outcome Indicators
Williams, D. R. R. (1989). Outcome indicators for diabetes services: what do we have
and what do we need? Community Medicine, 11, 57-64.
Williams, R. (1994). Diabetes mellitus. In Health care needs assessment (ed. A.
Stevens and J. Raftery). Radcliffe Medical Press, Oxford.
Wilson, A. E., and Home, P. D. for a Working Group of the Research Unit of the Royal
College of Physicians and the British Diabetic Association (1993). A dataset to allow
exchange of information for monitoring continuing diabetes care. Diabetic Medicine,
10, 378-390.
Working Group on Outcome Indicators for Stroke (1997). Report to the Department
of Health. Unit of Health-Care Epidemiology, University of Oxford.
Young, M. J., Boulton, A. J. M., Macleod, A. F., Williams, D. R. R., and Sonksen, P.H.
(1993). A multicentre study of the prevalence of diabetic neuropathy in the UK
hospital clinic population. Diabetologia, 36, 150-154.
Yudkin, J. S., Blauth, C., Drury, P., Fuller, J., Henley, J., Lancaster, T., Lankester, J.,
Lean, M., Pentecost, B., Press, V., and Rothman, D. (1996). Prevention and
management of cardiovascular disease in patients with diabetes mellitus: an evidence
base. Diabetic Medicine, 13, S101-S121.
ISBN 1840750103
Reports in the Series on Health Outcome IndicatorsAsthma ISBN 1840750073
Breast Cancer ISBN 1840750081
Cataract ISBN 18407509X
Diabetes Mellitus ISBN 1840750103
Fractured Proximal Femur ISBN 1840750111
Myocardial Infarction ISBN 1840750138
Normal Pregnancy and Childbirth ISBN 1840750146
Severe Mental Illness ISBN 1840750154
Stroke ISBN 1840750162
Urinary Incontinence ISBN 1840750170
Additional copies of the reports listed above are available from
P.O. Box 777, London SE1 6XH.
Fax: 01623 724 524