diabetes care across america: results from...
TRANSCRIPT

DIABETES CARE ACROSS AMERICA: RESULTS FROM THE AACE MULTI‐CITY TRANSCULTURAL ENDOCRINOLOGY SUMMITS
Jeffrey I. Mechanick, M.D.Professor of MedicineMedical Director, Marie‐Josee and Henry R. Kravis Center for
Cardiovascular Health at Mount Sinai HeartDirector, Metabolic SupportDivisions of Cardiology and Endocrinology, Diabetes and Bone DiseaseIcahn School of Medicine at Mount Sinai
Chair, ACE Center for Transcultural Endocrinology (ACTE)Immediate Past President, American College of EndocrinologyPast President, American Association of Clinical Endocrinologists

Disclosures and Acknowledgements
Honoraria for lectures and program development from Abbott Nutrition International
Summit Program sponsored by Sanofi Partners: Mount Sinai Heart, Houston Methodist Hospital, and XIX Davidson‐MestmanCursoIntensivo de Diabetes, Endocrinología y Enfermedades Metabólicas Faculty
AACE Staff (Leadperson: Beverly Hastings)

Faculty
Jeffrey I. Mechanick, M.D. (Chair) Sadhu Archana, M.D. Jaime Davidson, M.D. Rodolfo Galindo, M.D. Steven M. Petak, M.D., J.D. Susan L. Samson, M.D., Ph.D. Guillermo E. Umpierrez, M.D.

Outline What is transcultural endocrinology Lessons from the global tDNA project The American Diabetes Problem Focus on Transcultural Drivers in Type 2 Diabetes Summit Findings Conclusions

Precision Medicine
Treating the individual Population based strategies Genes, Genomics, Epigenomics Environment Transcultural Factors

AMONG PATIENTS WITH HIGH GENETIC RISK, A FAVORABLE LIFESTYLE WAS ASSOCIATED WITH 50% LOWER RELATIVE RISK FOR CAD

What is culture?
Culture: clustering of non‐physical attributes distinguishing categories of people
Race: clustering of physical and genetic attributes
Ethnicity is a larger category that includes culture + race + ancestry + region + linguistics + political ideology

Attributes of culture
General Related to Health Care
Intangible aspects
Shared behaviors Among individuals Among communities
Shared knowledge
Models for living
Collective programming
Historical designs
Distinctive achievements
Gender roles
Language barriers
Personal space orientation
Attitudes toward lifestyle
Exposure to toxin (EDCs)
Socio‐economics
Practice patterns
Health care politics

Impact of socio‐economics
Poverty Fatalism Need for government aid Drug and alcohol abuse Dysfunctional family life Low self‐esteem Community dis‐engagement Increased risk for disease and complications Decreased access to health care

What is transculturalization?
Transculturalization – adapting concepts from one culture to another
Acculturation – transitions when two or more cultures interact
Deculturation – losing a previous culture Neoculturation – formation of a new culture Transculturation – formation of a new culture when two or more cultures merge

Problems with terminology “Latin America” – South and Central America + Mexico
(dominant language Spanish or Portugese) “Latino” – Latin American ancestry, including Brazilian “Hispanic” – people from Spain and Spanish‐speaking
Latin American, excludes Brazilians “African Immigrant”: sub‐saharan ancestry “African‐Caribbean Immigrant”: African descent,
migrated from Caribbean “African‐American”: descendant of those who were
enslaved “Black American” – inclusive term “Non‐Hispanic Black” – used in demographics

Transcultural Drivers for Chronic Disease (examples) Broad Contextualization Built environment (physical, human‐made) Cultural (nonphysical)
Other ethno‐cultural correlates Genotoxic: endocrine disruptors Allostatic load: chronic stress Mitochondrial DNA

Wallace DC. A mitochondrial paradigm of metabolic and degenerative diseases, aging, and cancer: a dawn for evolutionary medicine. Annu Rev Genet 2005; 39: 359-410.

The Global Diabetes Pandemic Projected Prevalence 2030
Diabetes Care 2004 27:1047-1053

Age‐Adjusted Diabetes Prevalence Hawaiian Acculturation, 1965‐1968
Lifestyle Impact on T2D
The association between acculturation to Western lifestyle and prevalence of diabetes was studied among 8,006 Japanese‐American men living in Hawaii. Each had varying exposure to traditional Japanese society and culture in 1965 to 1968.Higher physical activity and dietary carbs, less fat and animal protein led to lower prevalence of T2D.
Acculturationcharacteristics
Diabetes Non‐diabetes
Prevalence (%)
Birthplace
Japan 58 977 5.24
Hawaii 424 6,583 6.36
Years in Japan
≥ 10 80 1,327 5.19
1‐9 65 1,057 6.04
< 1 338 5,070 6.51
Current Diet Type
Asian 65 1,075 5.23
Mixed 317 5,362 5.60
Western 98 1,012 9.58
Huang. Am J Epidemiol Vol. 144, No. 7, 1996

tDNA Template Developers and Reviewers
Jeffrey I. Mechanick, MD
Co-chairman
USA
Osama Hamdy MD, PhD
Co-chairman
USA
Ulf Risérus, MMED, PhD• SWEDEN
Andreas Pfeiffer, MD• GERMANY
Cyril Kendall, PhD• CANADA
Caroline Apovian, MD• USA
David Jenkins, MD• CANADA
Enrique Mendoza, MD• PANAMA
Miguel Leon Sanz, MD• SPAIN
Peter H. Bisschop, MD, PhD• NETHERLANDS
Rejeanne Gougeon, PhD• CANADA
Shashank Joshi, MD • INDIA
J Sievenpiper, MD, PhD• CANADA
Albert Marchetti, MD• USA
Alexis Bolio Galvis,MD, PhD• MEXICO
Alexander Koglin Benchimol, MD• BRAZIL
Patrizio Tatti, MD, PhD• ITALY
Man-Wo Tsang, MBBS• CHINA
Wayne Huey-Heng Sheu, MD, PhD• TAIWAN
Joseph Vidal-Cortada, MD• SPAIN
V. Mohan, MD, PhD• INDIA
Refaat Hegazi, MD PhD, MPH• USA
LATIN AMERICA PARTICIPANTS

tDNA template
17

Mechanick JI, et al. Curr Diab Rep. 2012. Feb 9. [Epub ahead of print]

Table 8: Common International Foods and Glycemic Indices
19
Mechanick JI, et al. Curr Diab Rep. 2012. Feb 9. [Epub ahead of print]
Carbohydrate foods
Glycemic Index
Fruits Glycemic Index
White wheat bread
75 Apple 36
Whole wheat bread
74 Banana 51
Multigrain bread 53 Dates 42Wheat roti 62 Mango 51Chapati 52 43Corn tortilla 46 Peach 43White rice 73 Pineapple 59Brown rice 68 Watermelon 76Barley 28 VegetablesCorn 52 Potato, boiled 78Spaghetti 49 Potato, instant
mash87
Rice noodles 53 Potato, fried 63Udon noodles 55 Sweet potato 63Couscous 65 Carrots, boiled 39
Glycemic index (GI) ranks carbohydrates according to their effect on blood glucose levels. High GI = 70; medium GI = 56-69; low GI = 55.Adapted from Atkinson FS, Foster-Powell K, Brand-Miller JC. International tables of glycemic index and glycemic load values: 2008. Diabetes Care. 2008;31:2281-2283 .
Carbohydrate foods Glycemic Index
White wheat bread 75Whole wheat bread 74Multigrain bread 53Wheat roti 62Chapati 52Corn tortilla 46White rice 73Brown rice 68Barley 28Corn 52Spaghetti 49Rice noodles 53Udon noodles 55Couscous 65


Established to enhance clinical endocrine care within the U.S. and across the globe by specifically addressing diverse ethnic and culturally sensitive factors.
Pan-American AACE Conference: “Only one level of excellent care”
American College of Endocrinology Center for Transcultural Endocrinology
(ACTE)


Summit Mission and Vision Mission Statement To provide a core set of recommendations for
endocrinologists and other health care professionals that can optimize diabetes management by improving Recognition of ethno‐cultural variables among African‐American, Latino, Asian, and Native American subpopulations in the U.S.,
Implementing specific strategies that address these variables, and Prompt systems changes regarding awareness, communication and health messaging, adherence, resource availability, and economic feasibility to improve clinical outcomes.
Vision To complete a nationwide series of Transcultural Summits on Diabetes Care in America 2017‐2018
To publish findings in Endocrine Practice by early 2019

Summit Logistics Prework Community Leader Forum (tonight) Generate key challenges and discussion points to guide conference panel discussions
Formal Conference Generate information to drive synthesis of core recommendations
Information: curate and analyze Formulate affirmed and emergent recommendations
Write paper and submit to Endocrine Practice

Summit Deliverable
Core set of recommendations of how to adapt evidence‐based information on diabetes care for specific ethnic and cultural populations in the U.S. Understandable, Relevant, Translatable, Actionable, with Expectation of Positive Impact
Affirmed recommendations Emergent recommendations Potential for implementation, validation, education, and further adaptation/optimization

The Diabetes Problem in America type 1 vs. type 2 diabetes; prediabetes In 2017, 30.3 million Americans (9.4%) In 2015, 23.8% with diabetes and 88.4% with
prediabetes did not know they had the condition Ethnicities African‐Americans (non‐Hispanic blacks; 12.7%) Latinos (12.1%; Mexican 13.8%; Puerto Ricans 12.0%; Cubans
9.0%; Central/South America 8.5%) Asians (8.0%; India 11.2%; Philippines 8.9%; China 4.3%;
Other 8.5%) Native Americans (15.1%; 6.0 for Alaska Natives; 22.2% in
certain Southwest regions) Caucasians (non‐Hispanic whites; 7.4%)


http://www.diabetes.org/assets/pdfs/basics/cdc-statistics-report-2017.pdf

http://www.diabetes.org/assets/pdfs/basics/cdc-statistics-report-2017.pdf
2007-2009 14.2% 8.4% 12.6% 11.8% 7.1%

http://www.diabetes.org/assets/pdfs/basics/cdc-statistics-report-2017.pdf
1. Diabetes prevalence increasing2. Rates by ethnicity differ3. Rates also affected by geography and by extension, culture4. Rates differ by diabetes type5. What else affects prevalence rates?
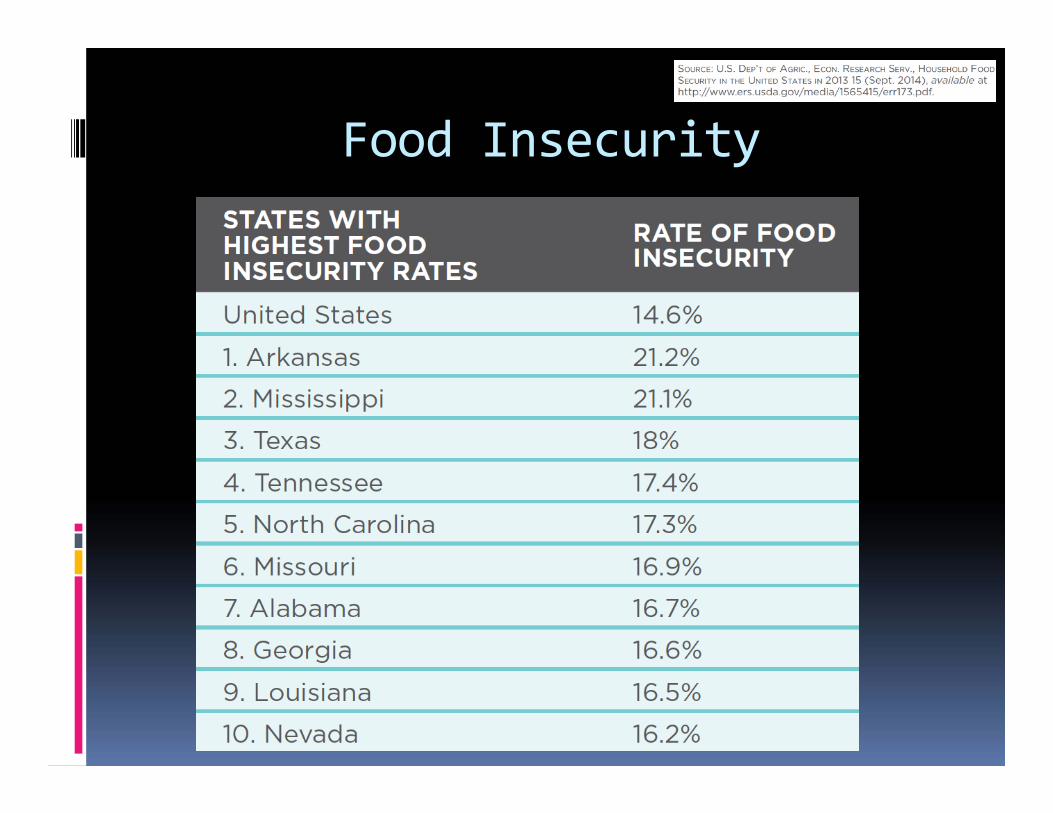
Food Insecurity

Risk Factors for Complications Smoking (15.9% current, 34.5% quit) Adiposity (87.5% overweight/obese) Physical inactivity (40.8% < 10 min/wk > mod act) Hypertension (73.6% > 140/90 or on meds) Hi Cholesterol (58.2% without CVD needing statin actually on med; 66.9% with CVD on med)
Severe hyperglycemia 15.6% with A1C > 9% Chronic kidney disease 36.5%
Total cost of diabetes 2012 = 245 billion

Gallagher D et al. In Mechanick/Kushner, Lifestyle Medicine, 2016

EATING PATTERNS
•Mediterranean•DASH•Tibetan•Nordic•DGA 2015•Vegan•Paleo

African‐Americans in the U.S.
2010 Census Data

By Srobinson71 - Own work, CC BY-SA 3.0, https://commons.wikimedia.org/w/index.php?curid=12214061
SOCIO-ECONOMICS
Highest concentration in metropolitan cities
AFRICAN-AMERICAN HOMEOWNERSHIP
AFRICAN-AMERICAN INCOME

African‐American Health
Life expectancy yrs: 70.8 (men), 77.5 (women) Obesity: 31.6% (men), 41.2% women Diabetes: 12.7% (“non‐hispanic blacks”; CDC) In 2013: highest cancer rates Violence and homocide HIV: 48% of total HIV‐positive population

Diabetes in African‐Americans Higher prevalence group Disproportionately higher morbidity/mortality Disparities (lower quality/accessibility) health care Less randomized controlled study data Atypical diabetes: DKA presentation then T2D Metabolic syndrome – manage with lifestyle Intensive TxT2D – remission in 30‐40% Recommend Case management nurses Bilingual care coordinator Structured disease management protocols

African‐American Cultural Factors Origins: West/Central Africa, Caribbean, European,
and Native American Literature: slave narratives, Harlem renaissance, and
contemporary writers Music: spirituals, call‐and‐answer songs, blues, jazz,
rhythm and blues, rap Current: urban and hip‐hop culture focus on issues of crime,
dysfunctional families, frustration, gangs, and poverty Growing middle class Upper middle class or “black elite”: “Black bourgeoisie”
culture of education, tradition, family (E. Franklin Frazier; 1955 in French) Therese Rochon

Additional Cultural Elements Hairstyles, fashion, dance, visual art, worldview Civic disinvestment, inner cities but also neighborhoods, churches, museums
Traditional cuisine Mixing and cooking leftover ingredients into a mixture between stew and soup
Sharing of food, particularly in community settings Cultivation and use of yams, peanuts, rice, okra, sorghum, grits
Chicken, fish, macaroni/cheese, cornbread, hoppin’ john (black‐eyed peas and rice)
Often high in saturated fat, sodium, starch

Zakharia F, Basu A, Absher D, et al. Characterizing the admixed African ancestry of African Americans. Genome Biology 10: R141, 2009. http://genomebiology.com/2009/10/12/R141.
GENOME-WIDE STUDIES OF AFRICAN-AMERICANS
• West-African 73.2 – 82.1%• European 16.7 – 24.0%• Native American 00.8 – 01.2%

N = 93 Black Caribbean immigrant survey on acculturation into African-American culture• Less likely to engage with favorable view of ethnic (e.g., Haitian) group• More likely to engage with favorable view of racial (e.g., Black) group
• Effect amplified with low levels race-related stress• Effect unchanged with high levels race-related stress
Therefore, racial contextualization influences acculturation: social status and psychological well-being

Commonalities between AA and EUR
More research needed to understand the genetic architecture for T2D in AA
RED – SIGNIFICANTASSOCIATION
BLUE– INSIGNIFICANTASSOCIATION

Additional Biological Markers AKT2 and fasting insulin (Diabetes 2017; 66:2019)
rs1050828 G6PD variant and A1C (PLoS 2017)
ABCB1 gene expression (Pharmagenom J, 2016) GFG23/APOL1 and mortality (Diab Care 2017)
F2isoprostane inverse with T2D/weight (OMCL 2017)
Hepatocyte growth factor and CAD (Heart 2017; 103: 1185)
Hi aldosterone and renin and CVD risk (JACCHF, 2017)
Diet quality (Alt Healthy Eating Index and DASH), improved lipids, reduced inflammation, improved adiponectic (Br J Nutr2017; 118: 312)
Coffee and mortality from T2D (Ann Int Med 2017) Vitamin d and insulin sensitivity (JCEM 2017;102:2781)
Renal and cognitive dysfunction (Am J Kid Dis 2017)

A1Cunderestimates
risk
A1Cunderestimates risk

Increased insulin Secretion baseline and prediabetes in AA
Also -
Decreased hepatic >> extrahepaticInsulin degradation (clearance) in AAPiccinini et al. Diabetes 2017; 66: 2564.

All diabetes typesSecretagogues and Insulin Tx

Relatively higher risks for atherosclerotic cardiovascular disease, hypertension, stroke, heart failure, peripheral artery disease
Leverage strengths in cultural environment Church – reaches women and older adults Policy changes – affordable care act, cigarette smoking bans, healthy food availability in schools
Create and sustain positive health behaviors

N=319 black male patron cohort sBP > 140Cluster-randomized trial
HEALTH PROMOTION BY BARBERSSPECIALTY-TRAINED PHARMACISTSCOUPLED MED MANAGEMT IN SHOP
ONLY BARBERS ENCOURAGINGLIFESTYLE AND MD APPOINTMENTS


Exposure to endocrine‐disrupting compounds is a feature of enviromental inequality and contributes to diabetes disparities
Examples of EDCs PCBs – polychlorinated biphenyls OC (organochlorine) pesticides Air pollutants Bisphenol A Phthalates

Trust Experimentation Communication Logistics Need better recruitment and research strategies that are culturally sensitive

Latin Culture
Multiple influences Pre‐Colombian European colonial Immigrant African Immigrant Asian
Spanish and Portugeselanguages Primarily, Christian religion
Constructionist movement
Muralism (art) Positivism Experimental
cinematography Energetic dance Cuisine with typical
foods

WA
OR
WY
UT
TX
SD
OK
ND
NM
NVNE
MT
LA
KS
ID
HI
COCA
ARAZ
AK
WI
WV VA
TNSC
OH
NCMO
MS
MN
MI
KY
IAINIL
GA
FL
AL
VT
PA
NY
NJ
NHMA
ME
DC
CT
DE
RI
MD
7‐11% (15 states, including DC)< 6% (18 states)
> 12% (18 states)
MEXICANOTHER
CUBAN
PUERTO RICAN
LATINOS IN THE U.S.

Arizona Pimas Mexican Pimas
Height (cm) 164 160
Hour of hard work/wk 3 >40
BMI (kg/m2) 33.4 24.9
% Diabetic, male 54% 6%% Diabetic, female 37% 11%
Ravussin et al, Diabetes Care 17:1067, 1994
Genes or Lifestyle?
Total cholesterol, mg/dl 174 146
Sonora TarahumarasArizona Pimas vs Mexican Pimas

Food preferences of U.S. Latinos
High fat meats are preferred High fiber content (eg. corn, beans, etc) Fats/Lards are freely used in cooking Many traditional fried foods Inadequate portion control High glycemic index foods

52.345.3 45.743.142.040.3
50.6
41.236.331.4
46.041.9 46.6
40.536.1
49.6
0
10
20
30
40
50
60
NH White NH Black Hispanic Other race
Perc
ent o
f Pop
ulat
ion
Men '01 Women '01 Men '05 Women '05
(NHANES: 2003-2006). Source: NCHS and NHLBI. NH – non-Hispanic.
Prevalence of regular leisure-time physical activity among adults age 18 and older by race/ethnicity, and sex

Prevalence of Overweight and obesity Among Adults with Diagnosis of Diabetes,
1998‐1994 and 1999‐2002NHANES II (1988‐1994) 5NHANES 1999‐2002
BMI Group Race % 95% CI % 9545% CI
Overweight White 78.1 (69‐87) 85.9 (77‐94)
Black 79.4 (72‐86) 86.1 (79‐93)
Hispanic 84.0 (77‐91) 86.9 80‐94)
Total 78.5 (72‐85) 85.2 (81‐90)
Obese White 45.4 (33‐58) 57.9 47‐69)
Black 45.0 (38‐52) 63.0 (51‐75)
Hispanic 47.0 (34‐60) 54.9 49‐70)
Total 45.7 (37‐55) 54.8 (46‐64)
Results were standardized to the 2000 US standard population by age groups. Pregnant female were excluded
MMWR, Nov 9, 2004

Insulin Sensitivity Differs Among Ethnic Groups in Healthy Subjects

Diabetes Care Across Ethnic Groups SelfMonitoring of Blood Glucose
05
101520253035404550
Not Insulin Treated Insulin Treated
Non-Hispanic WhiteNon-Hispanic African AmericanMexican American * p < 0.01
* *
Harris MI. Diabetes Care. 2001 Mar;24(3):454-9.
Percent

Barriers to Care in Latinos Language barriers 25% of Latinos do not speak English 5% of doctors and 2% of nurses are Latinos
Different health care beliefs Distrust of health care providers that are not
Latinos Symptom improvement equals a cure, so
patients discontinue drug use More medications = worsening of the
condition

Asian Population in US – Fastest Growing Racial Group since 2000
2010 Census bureau data17.3 Million Asian Americans (5.6% of US pop)
Asian population grew 3.4% by 2014‐2015 to 21 M
Hispanic population grew by 2.2% to 56.6M
African American population grew by 1.3% to 46.3M
American Indian and Alaska Native population grew 1.5% to 6.6M
By 2060, Asian American population is projected to be 34.4M or 8.2% of the US population
*http://fortune.com/2016/06/23/census-bureau-race-age/, accessed Nov 22, 2017

Heterogeneity in the Asian American population Defined by at least 23 different countries and most
Asian Americans are immigrants
Speak at least 19 different languages
Varying Income: highest median incomes but also with higher rate of poverty than non‐Hispanic whites
Varying education levels
At least four different major religions: Christian, Buddhist, Hindu, Muslim
Extremely diverse geographically, culturally and genetically
https://en.wikipedia.org/wiki/Demographics_of_Asian_Americans

Asian Countries of Origin Chinese, Indian, Filipino,
Vietnamese, Korean, Japanese,
Pakistani, Cambodian, Hmong,
Thai, Laotian, Bangladeshi,
Burmese, Nepalese,
Indonesian,
Sri Lankan, Malaysian,
Bhutanese, Mongolian
http://www.pewresearch.org/fact-tank/2017/09/08/key-facts-about-asian-americans/ft_17-09-08_asianamericans_theasianpopulation/

Distribution of Diabetes among Asian Americans in the US
https://www.cdc.gov/mmwr/preview/mmwrhtml/mm6445a2.htm#Fig, Accessed Nov 22, 2017

Asian Diets:Benefits and Risks
Benefits• Green tea• Rich Variety of vegetables
and fruits• Spices• Low red meat consumption• Beans and nuts• Fish and seafood• Fruit as desserts• Whole grains (at one time)• Smaller portion sizes• Soy consumption
Risks• White rice and other refined
grains• Use of animal fat and palm oil• Unhealthy trans fats, not
labelled on packages• Sweets and snacks high in
sugar• Tea or coffee with too much
added sugar• Too much salt• Excessive consumption of
pickled vegetables and cured meats

Physical Activity – Asian Indians
Asian Indians are more sedentary than Caucasians
Lower physical activity is inversely correlated with BMI, WC, SBP, plasma glucose, and plasma insulin
Sedentary lifestyle is an important factor contributing to CVD in Asian Indians
Muslim custom requires fully covered attire which is a barrier to exercise and results in Vitamin D deficiency
Sweating in public is an embarrassment
Recommend: 60 minutes of physical activity/day with 30 min of moderate intensity aerobic, 15 min of muscle strengthening and 15 min of work‐related activity
Misra A, et al. Diabetes Technol Ther. 2011 Consensus physical activity guidelines for Asian Indians

Cultural and Religious Factors
Holidays are frequent both secular and religious (Hindu, Muslim, Christian, Buddhist, Jain, Zoroastrian) and may cause missed appointments
Each holiday may have different dietary patterns resulting in either overeating or fasting patterns (Hindu, Muslim, Jainism)
Jainism is completely vegetarian but also has strict list of exclusions of onions, potatoes, eggplants and garlic
Noncompliance with diabetes therapy is more frequent during holidays
Asian have deep rooted history in the practice of alternative medicine (non‐Western) particularly in India and China.

Medication Adherence
8/20 studies reviewed
Lack of understanding of need for escalation of care
Fatalistic views for initiating medications
Took partial doses or as needed doses based on dietary consumption
Noncompliance when traveling to home country
Concern of long term harm of taking medications
Preferred use of ayurvedic and phytotherapy due to perception of safety
Reluctant to disclose missing or reduced doses
Sohal T, et al. PLOS ONE, 2015; DOI:10.1371/journal.pone.0136202

Management of Diabetes During Ramadan
• Risk stratification based on hypoglycemia, hyperglycemia and comorbidities
• Individualize insulin therapy in advance of starting the fast. Avoid pre‐mixed insulin during fasting
• Frequent monitoring of blood glucose, especially those on insulin therapy
• Before starting the fast, include more slowly absorbed food (low GI), such as basmati rice and dhal, in your meal, along with fruit and vegetables
• Try to eat just before sunrise, at the start of the fast• Avoid only eating sweet or fatty foods• Normal physical activity, avoid excessive activity that may lad to
hypoglycemia• End the fast if hypoglycemia occurs or if blood glucose is over 300
mg/dl• Ramadan focused diabetes and nutrition education in advance
Al-Arouj M, et al. Diabetes Care, 2010;33(8):1895-1902

Dietary Changes with Ramadan
Dawn meal (Suhur): balance low glycemic index starches and protein to maintain satiety for a longer period of time• Whole grain cereal, low‐fat milk, cottage cheese with sliced peaches topped
with toasted almonds • Plain Greek Yogurt flavored with blueberries and cinnamon, whole wheat
toast with nut butter.• Foul (a middle eastern breakfast dish made of lentils or fava beans), small
serving of sliced fruit• Whole wheat roti (unleavened bread) and egg khagina (a southeast Asian
dish)
Sunset meal (Iftar): Avoid overeating and drink ample water or sugar free beverages• Limits dates to 1‐2 each night • Whole grains, lean meat, fish and poultry and unsaturated fats. Avoid
sugar and caffeine

Pharmacotherapy during RamadanBefore Ramadan During Ramadan
Diet and Exercise alone Modify time/intensity of exercise, adequate fluid
Biguanides (metformin 500 mg TID or more) Larger dose at sunset meal than predawn meal
TZD, AGIs or incretin based therapies No change needed
Sulfonylureas once daily Do not take before sunset meal; adjust dose based on glycemic control/hypoglycemia risk
Sulfonylureas twice a day Half usual dose at predawn meal and usual dose at sunset meal
Insulin Analogs Adjust based on risk for hypoglycemia and hyperglycemia
Premix insulin or NPH Consider changing to long acting analog in the evening and rapid acting with meals orUsual dose at sunset meal and ½ usual dose at predawn meal
Al-Arouj M, et al. Diabetes Care, 2010;33(8):1895-1902
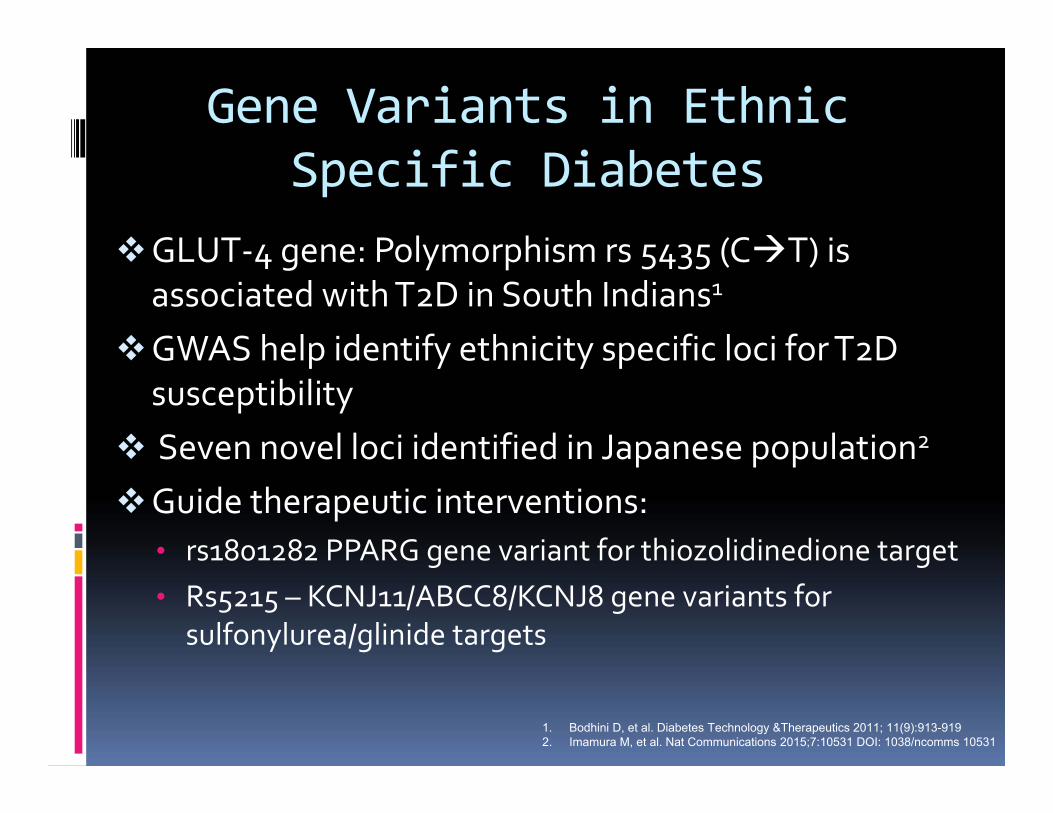
Gene Variants in Ethnic Specific Diabetes
GLUT‐4 gene: Polymorphism rs 5435 (CT) is associated with T2D in South Indians1
GWAS help identify ethnicity specific loci for T2D susceptibility
Seven novel loci identified in Japanese population2
Guide therapeutic interventions: • rs1801282 PPARG gene variant for thiozolidinedione target• Rs5215 – KCNJ11/ABCC8/KCNJ8 gene variants for
sulfonylurea/glinide targets
1. Bodhini D, et al. Diabetes Technology &Therapeutics 2011; 11(9):913-9192. Imamura M, et al. Nat Communications 2015;7:10531 DOI: 1038/ncomms 10531

Targeted Drug TherapyPost hoc analysis of EMPA‐REG and CANVAS Trials
show that empaglifozin had more CV benefits in Asians than canaglifozin1
Pharmacogenomics study of DPP4‐inhibotors in Taiwanese patients with T2D, showed 45 SNPs involved in therapeutic response2
Incretin therapies have suspected to have more profound glucose lowering effects in Asians by improving beta cell function which is thought to be more causative than insulin resistance in Asians
1. Rastogi A, Bhanasli A. Diabetes Ther, 2017; 8:1245-12512. Liao WL, et al. Oncotaraget, 2017;8(11):18058

Regional differences in age adjusted T2D prevalence in Native Americans
Modified from Espey et al. 2014. Methods for improving the quality and completeness of mortality data for American Indians and Alaskan natives. Am J. Public Health 104: S286-S294 and Rice-Burrows CDC 1999

Gestational Diabetes and T2D in offspring
Sellers et al. 2016. Exposure to Gestational Diabetes Mellitus: Impact on the Development of Early-Onset Type 2 Diabetes in Canadian First Nations and Non–First Nations Offspring. Diabetes Care 39: 2240-2246. (Manitoba)

T2D as a cause of death
Native Americans: 41% died <65 yrs old versus 23% of Non-Hispanic-Whites
Cho et al. 2014. Diabetes-related mortality among American Indians and Alaska Natives, 1990-2009. Am J Public Health 104: S496-S503.

U.S. 2009 Obesity Data
Men WomenAmerican Indian
46.2% 45.5%
Black 29.3% 44.7%Hispanic 32.0% 36.8%Asian/Pacific Islander
10.3% 6.7%
Comparison Population
28.6+% 26.0+%
Racial and Ethnic Approaches to Community Health www.cdc.gov/chronicdisease/resources/publications/aag/reach.htm

Indigenous Foods by RegionNorthwest Plains Southwest
Plants AcornsVarious wild plants
BeansBuffalo berriesCamas bulbs,Chokecherries
CurrantsPlumsTurnips
AcornsPinon nutsCactiCentury plantScrewbeansMesquite beans
Agaves or mescalsBerriesSeeds Cultivated corn, cotton, pumpkins, sunflowers, beans
Proteins SalmonTroutHalibut HerringWhalesOttersSeals
BearsBeaversLynxDeerRabbitsHares
AntelopesBeaversBuffaloDeerDucksElkMuskrats, Prairie dogs
RabbitsRaccoonsPorcupinesPrairie chickensSkunksWolf pupsBison
TurkeysDeerAntelope
RabbitsFishInsects
Devon A. Mihesuah, Recovering Our Ancestors’ Gardens: Indigenous Recipes and Guide to Diet and Fitness (U Nebraska Press, 2005)

Preliminary Summit Findings
1. Principal cultural drivers for T2D are dietary patterns, physical activity, tobacco and alcohol use, and environmental stressors
2. Culturally‐sensitive toolkits should be developed and implemented
3. Evidence‐based white‐papers should be transculturalized according to a standardized protocol

Findings (continued)
Ethnicity‐related biological correlates can help with clinical management Anthropometrics: adiposity, dysglycemia, beta‐cell mass, insulin resistance, inflammation, sarcopenia
Behavioral medicine correlates require further study to devise effective tactics Medication and fingerstick testing adherence Time and stress management Community engagement Trusting health care professionals

Findings (continued)
Improve training and education Basic language and communication skills Holidays, festivals, customs
Increase minority/diversity representation in clinical trials (recruitment/retention)
Better terminology

Conclusions Positive messaging with emphasis on “Health” Patients identify their own ethnicity and culture Transculturalization is a necessary part of
precision (or N=1) medicine Organize summit findings into a cogent theory
capable of producing testable hypotheses to modify clinical endocrine practice and improve outcomes, domestically and globally Specific eating patterns Specific physical activity recommendations Ethno‐culturally specific pharmacotherapeutics Adaption for socio‐economics and belief structures