dhaka-bank-and city bank compared
TRANSCRIPT

Ratio Analysis of Dhaka Bank
Introduction
This is a report of performance analysis of the company entitled Dhaka Bank. The ratio analysis
will help to compare the financial performance of this bank with City Bank Limited. The period
of analysis is from 2004 to 2009. The performance of Dhaka Bank has been analyze in terms of
Liquidity ratios
Leverage ratios
Activity (efficiency) ratios
Profitability ratios
Market Position ratios
Liquidity Ratios
The most important tasks that the management of any financial institution faces is ensuring
adequate liquidity at all times in any emergencies. This mean that a liquid financial firm either
has the right amount of immediately spendable funds on hand when they are required or can raise
liquid funds in timely fashion by borrowing or selling assets. A liquid asset is one that trades in
an active market and hence can be quickly converted to cash at the going market price and a firm
liquidity position deals with the question such as will the firm be able to pay off its debt as they
come due over next year or so? Will it have trouble satisfying the obligation? A full liquidity
analysis require the use of cash budget, but by relating the amount the cash and other current
asset to current obligation, Ratio analysis provides a quick, easy-to–use measures of liquidity.
Some of the categories of ratios are given below.
i. Cash position indicator: Cash and deposit due form depository institution / total asset,
where greater proportion of cash implies the institution is in a stronger position to handle
immediate cash needs.
1

Ratio Analysis of Dhaka Bank
ii. Liquid securities indicators: Govt. securities / total asset, which compares the most
marketable securities an institutions can hold with the overall size of its asset portfolio, the
greater the portion of the government securities, the more liquid the depository
institution’s position tends to be.
iii. Capacity ratio: Net loans and leases/ total asset, which is really a negative liquidity
indicator because loans and leases are often the most illiquid of asset.
iv. Core deposit ratio: Core deposit / total asset, where core deposits include total deposits
less all deposits over $ 100K. core deposit are primarily small denomination checking and
savings accounts that are considered un likely to be withdrawn on short notices and so
carried lower liquidity requirement.
v. Deposit composition ratio: Demand deposit/time deposits, where demand deposits are
subject to immediate withdrawal via check writing, while time deposits have fixed
maturities with penalties for early withdrawal. This ratio measures how stable a funding
base each institution possesses; a decline suggests greater deposit stability and a lesser
need for liquidity.
vi. Hot money ratio: Money market assets divided by volatile liabilities. It reflects whether
the institution has roughly balanced the volatile liabilities it has issued with money market
assets it holds.
Leverage Ratios
Debt Management Ratios attempt to measure the firm's use of Financial Leverage and ability to
avoid financial distress in the long run. These ratios are also known as Long-Term Solvency
Ratios.
2

Ratio Analysis of Dhaka Bank
Debt is called Financial Leverage because the use of debt can improve returns to stockholders in
good years and increase their losses in bad years. Debt generally represents a fixed cost of
financing to a firm. Thus, if the firm can earn more on assets which are financed with debt than
the cost of servicing the debt then these additional earnings will flow through to the stockholders.
Moreover, our tax law favors debt as a source of financing since interest expense is tax
deductible.
With the use of debt also comes the possibility of financial distress and bankruptcy. The amount
of debt that a firm can utilize is dictated to a great extent by the characteristics of the firm's
industry. Firms which are in industries with volatile sales and cash flows cannot utilize debt to
the same extent as firms in industries with stable sales and cash flows. Thus, the optimal mix of
debt for a firm involves a tradeoff between the benefits of leverage and possibility of financial
distress.
i. Total debt to total asset ratio: The ratio of the Total debt to total asset, generally called
debt ratio, measures the percentage of funds provided by creditors. Total debt includes
both current liability and long term debt. Creditors preferred lower debt ratio because the
lower the ratio, the greater cushion against the creditors’. On the other hand stockholders
want more leverage because it magnifies expected earnings.
ii. Debt equity The Debt to Equity Ratio measures how much money a company should
safely be able to borrow over long periods of time. It does this by comparing the
company's total debt (including short term and long term obligations) and dividing it by
the amount of owner's equity The result get after dividing debt by equity is the
percentage of the company that is indebted (or "leveraged"). The normal level of debt to
equity has changed over time, and depends on both economic factors and society's
general feeling towards credit. Generally, any company that has a debt to equity ratio of
over 40 to 50% should be looked at more carefully to make sure there are no liquidity
problems.
iii. Interest Coverage Ratio: The interest coverage ratio is a measurement of the number of
times a company could make its interest payments with its earnings before interest and
3

Ratio Analysis of Dhaka Bank
taxes; the lower the ratio, the higher the company’s debt burden. As a general rule of
thumb, investors should not own a stock that has an interest coverage ratio under 1.5. An
interest coverage ratio below 1.0 indicates the business is having difficulties generating
the cash necessary to pay its interest obligations. The history and consistency of earnings
is tremendously important. The more consistent a company’s earnings, the lower the
interest coverage ratio can be. EBIT has its short fallings; companies do pay taxes,
therefore it is misleading to act as if they didn’t. A wise and conservative investor would
simply take the company’s earnings before interest and divide it by the interest expense.
This would provide a more accurate picture of safety.
Activity (Efficiency) Ratios
A ratio used to calculate a bank's efficiency. Not all banks calculate the efficiency ratio the same
way. Asset management, also called asset utilization, ratios tells a company how well their assets
are working to generate sales. Cash is always the best asset but it doesn't generate any revenue.
The other assets on your balance do generate sales revenue. Those other assets are accounts
receivable, inventory, and fixed assets.
i. Operating Efficiency Ratio: Operating efficiency ratio measures how efficiently bank
manages its expanse, which usually means reducing operating expense and incasing
operating revenue.
ii. Employee Productivity Ratio: This ratio means reducing operating expenses and
increasing of their employee through use of automated equipment and improved
employee training, which is calculated by Net operating income / Number full time
equivalent employees.
iii. Tax management efficiency: Tax management efficiency ratio reflecting the use of
security gain or losses and other management tools (such as buying tax- exempt bonds)
to minimize tax exposure, which is the ratio of before- tax income to total revenue as an
indicator of how many dollars of revenue survive after operating expense removed,
which is basically a measure of operating efficiency and expense control.
4

Ratio Analysis of Dhaka Bank
iv. Expense management efficiency: This is a ratio of pre tax net operating income to
total operating revenue. Measures how efficiently the bank able to manage its operating
expense.
v. Asset management efficiency: Which is nothing but the degree of asset utilization
(AU) that reflects the portfolio manages policies, especially the mix and yield on asset.
This ratio is calculated by total operating revenue divided by total asset.
vi. Funds management efficiency: Which is nothing but equity multiplier (EM),
calculated as total asset divided by total equity capital. EM reflects leverage or financing
policy: the source chosen to fund the financial institution- debt financing or equity
financing.
Profitability Ratios
The profitability ratios are used to measure how well a company is performing in terms of
profit. The profitability ratios are considered to be the basic bank financial ratios. In other words,
the profitability ratios give the various scales to measure the success of the firm.
The profitability ratios can also be defined as the financial measurement that evaluates the
capacity of a company to produce yield against the expenses and costs over a particular time
period. If a company is having a higher profitability ratio compared to its competitor, it can be
inferred that the company is doing better than that particular competitor. The higher or same
profitability ratio of a company compared to its previous period also indicates that the company
is doing well. Some of the categories of ratios are given below.
i. Return on Equity (ROE): The amount of net income returned as a percentage of
shareholders equity. Return on equity measures a corporation's profitability by
revealing how much profit a company generates with the money shareholders have
invested. ROE is expressed as a percentage and calculated as, Return on Equity = Net
Income/Shareholder's Equity.
ii. Return on Assets (ROA): An indicator of how profitable a company is relative to its
total assets. ROA gives an idea as to how efficient management is at using its assets to
5

Ratio Analysis of Dhaka Bank
generate earnings. Calculated by dividing a company's annual earnings by its total
assets, ROA is displayed as a percentage. Sometimes this is referred to as "return on
investment". The formula for return on assets is, Net income divided by total asset.
Some investors add interest expense back into net income when performing this
calculation because they'd like to use operating returns before cost of borrowing.
iii. Net Interest Margin (NIM): Is a measurement of the difference between the interest
incomes generated by banks or other financial institutions and the amount of interest
paid out to their lenders (for example, deposits). It is considered similar to the gross
margin of non-financial companies, which basically measures how large a spread
between interest revenue and interest cost management has been able to achieve by
close control over earning asset and pursuit of the cheapest sources of funding.
Calculated as (interest income – interest expense) / Total earning asset.
iv. Net Non interest Margin: Unlike Net interest Margin, Net Non interest Margin
measures the amount of non-interest revenue generating from service fees the financial
firm has been able to collect relative to the amount of non- interest cost incurred from
salaries and wages, repair and maintenance of facilities , and probation for loan loss
expense. Calculated as (Non Interest Revenues – Non Interest Expenses)/ Total Assets.
v. Net Operating Margin: A ratio used to measure a company's pricing strategy and
operating efficiency. It is a measurement of what proportion of a company's revenue is
left over, before taxes and other indirect costs (such as rent, bonus, interest, etc.), after
paying for variable costs of production as wages, raw materials, etc. A good operating
margin is needed for a company to be able to pay for its fixed costs, such as interest on
debt. Calculated as, (Total Operating Revenues – Total Operating Expenses) / Total
Assets.
vi. Earnings per Share (EPS): The portion of a company's profit allocated to each
outstanding share of common stock, which serves as an indicator of a company's
profitability. Calculated as, Net Income After Tax / Common Equity Shares
Outstanding.
6

Ratio Analysis of Dhaka Bank
Market Position Ratios
Market position ratio, reflect the firms stocks price to it earnings, cash flow and book value per
share. This ratio gives management an indication of what investors think of the company’s past
performance and future prospects. If the liquidity, assets management, debt management and
profitability ratios all look good then the market value ratios will be high and the stock price will
probably be as high as can be expected.
i. Price-Earning (P/E) Ratio: The P/E Ratio indicates how much investors are paying for
per dollar of return. It is calculated by dividing current market price of share by the
earning per share of common stock.
ii. Market-Book Ratio: The Market-to-Book Ratio is calculated by dividing market price
per share by the book value per share. A firm's book value reflects historical cost
accounting. Hence the market to book value ratio compares the market value of the
company’s investment to their cost. Market-book value ratio indicates what the investors
are giving against each taka value of share. It also reflects overall performance of the
company.
iii. Dividend per Share (DPS): Dividend per share ratio shows how much return the
common shareholders are getting against each share. It is calculated by dividing the net
income by number of common share outstanding.
iv. Dividend Yield: The dividend yield is a comparison between the dividend and market
price of share. It shows the return that the share holder gets against each taka of
investment.
7

Ratio Analysis of Dhaka Bank
CALCULATION AND
ANALYSIS OF
RATIOS
Liquidity Ratios
1. Cash position indicator:
2004 2005 2006 2007 2008 2009
8
Ratio Analysis of Dhaka Bank
Dhaka Bank 0.038 0.046 0.051 0.053 0.106 0.106
City Bank 0.056 0.068 0.059 0.071 0.055 0.067
Time series analysis:
Dhaka Bank: In 2004 the cash position indicator of the bank shows that it is 3.8%, which tells
us that for every BDT 100 this bank has TK. 3.8 as cash and deposit due from depository
institutions. As the time passes by the bank’s cash deposit indicator increases steadily till 2009
when its cash position indicator ratio was 10.6%. Dhaka bank had a sharp increase in this ratio
from 2007 to 2008 when in increased by 5.3%, thus we can say that its liquidity position has
become better with the passage of time.
City Bank: In 2004 the cash position indicator ratio was 5.60%, which means for each BDT
100 of total asset the bank had BDT 5.60 as a cash and deposit due form depositary institutions.
However in following years City bank’s cash position indicator has increased and finally in 2009
it had 6.70% though there was a decline in 2006 when this ratio was 5.9% whereas the ratio in
the previous year was 6.8%.
Cross-sectional analysis:
9

Ratio Analysis of Dhaka Bank
In comparing the two banks we can see that though City Bank was in a good position in relation
to Dhaka Bank during the years 2004-2007, Dhaka bank exceeded them in the year 2008 when
Dhaka bank’s cash position indicator was almost twice as more than the City Bank. Thus we can
say that as the time passed Dhaka bank’s performance in handing it cash has improved which is
observable from the comparison of the two banks. Thus we can say that Dhaka bank’s liquidity
position has become better in compared to City bank with the passage of time.
2. Liquid security indicator:
2004 2005 2006 2007 2008 2009
Dhaka
Bank 0.099 0.108 0.123 0.093 0.100 0.109
City
Bank
0.112 0.091 0.124 0.146 0.133 0.111
Time series analysis:
Dhaka Bank: In 2004 liquid security indicator ratio for Dhaka Bank was 9.9% i.e. for each
TK.100 this bank is holding TK.9.9 worth government securities. There was a continuous
increase for this ratio till 2006 when it was 12.3% and then there was a decrease in 2007 and then
it increased steadily to 2009 when this ratio was 10.9%. By analyzing this we can say that this
bank on an average holds 10% liquid assets and its liquidity position has become better in 2009
in compared 2004.
10
Ratio Analysis of Dhaka Bank
City Bank: In 2004 liquid security indicator ratio was 11.2 % which means for each BDT 100
the bank is holding BDT 11.2 government securities. Between several up and down it end up in
2009 by keeping 11.1% of government securities. By analyzing this we can say that this bank on
an average holds more than 10% liquid assets.
Cross-sectional analysis: in comparing both the banks we see that in 2004 the Dhaka Bank’s
liquid security indicator ratio was lower than City bank. Then in the next year this ratio for
Dhaka Bank was higher than the City Bank by 1.7%. In 2006 both the bank’s liquid security
indicator ratio becomes almost same and in the later years City bank’s liquid security indicator
ratio was more than Dhaka bank and in 2009 this ratio for both the bank’s was almost equal. By
analyzing these two banks in this regards we can say that City Bank on an average has more
liquid assets than the Dhaka bank.
3. Capacity ratio:
2004 2005 2006 2007 2008 2009
Dhaka
Bank 58.7 70.7 70.7 69.6 69.9 68.0
City Bank 64.6 66.1 64.9 54.9 60.3 56.9
Time series analysis:
11

Ratio Analysis of Dhaka Bank
Dhaka Bank: Capacity ratio, which is basically a negative liquidity indicator, indicates that with
the passes of time and till 2006 capacity ratio for Dhaka bank has increased though at a very
small pace and then it decreased till 2009. Though the change in the capacity ratio was not much
and it was almost stable. In 2004 Capacity ratio for this bank was 58.9% and in 2009 it decreased
to 68%. Thus we can say that in 2004 Dhaka Bank’s capacity ratio was 58.90%, which means for
each BDT 100 Dhaka Bank made BDT 58.9 as a loan, which is very illiquid and it has increased
at a very little pace with the passage of time.
City Bank: In 2004 City Bank’s capacity ratio was 64.60%, which means for each BDT 100
City Bank made BDT 64.60 as a loan, which is very illiquid. Moreover in 2005-2006 years also
it had almost same amount of loan. But in 2007, its capacity ratio decreased to 54.9%, then again
increased to 60.3%in 2008 and again reduced to 56.9% in 2009. Thus we can say there was a
fluctuation in the liquidity position of this bank in relation to its loan.
Cross-sectional analysis: By comparing the two banks we see that except 2004 Dhaka bank was
more illiquid than the City bank. Though City bank’s fluctuation in regard to this ratio was
higher than the Dhaka bank then also City bank’s capacity ratio remained below Dhaka bank and
thus we can say that Dhaka bank is more illiquid than City bank thus Dhaka bank may face more
problems when it might require a large sum of liquid money.
4. Core deposit ratio:
2004 2005 2006 2007 2008 2009
Dhaka
Bank 0.608 0.633 0.685 0.661 0.617 0.609
City
Bank
0.524 0.604 0.599 0.516 0.509 0.556
12

Ratio Analysis of Dhaka Bank
Time series analysis:
Dhaka Bank: From the graph it is noticeable that Dhaka Bank’s core deposit ratio all through
the time between 2004 and 2009 has been more than 60%. Its highest core deposit ratio was in
2006 when it was 68.5% and it was lowest during 2004 when the ratio was 60.8%. The ratio
increased constantly till 2006 and then decreased constantly till 2009 and it ends up in 60.9%.
Thus we can say that on an average this bank has maintained more than BDT 60 as core deposit
for each BDT 100. Thus from this ratio we can say that this bank has a quite satisfactory
liquidity position.
City Bank: In 2004 the core deposit ratio was 52.4%, which means for each BDT 100 of asset
City had BDT 52.4 as core deposit. The higher this ratio is the better the liquidity position has. In
2005, its Core deposit ratio increased to 60.4% but declined to 59.9% to 50.9% in 2006-2008.
After that, in 2009 it’s increased to 55.6%.
Cross-sectional analysis: By analyzing both the banks we can say that Dhaka bank has
constantly maintained a higher core deposit ratio than City Bank. Moreover City bank has more
fluctuations in its core deposit ratio graph than Dhaka bank. Thus from here we can say that
Dhaka bank is more liquid than City bank since Dhaka bank’s has more core deposit than City
bank.
5. Deposit Composition
Ratio:
2004 2005 2006 2007 2008 2009
Dhaka Bank 0.314 0.359 0.227 0.288 0.205 0.242
City Bank 0.672 0.475 0.419 0.612 0.548 0.468
13

Ratio Analysis of Dhaka Bank
Time series analysis:
Dhaka Bank: This ratio for Dhaka Bank was 31.4% in 2004, and then it increased and decreased
alternatively and became 24.2% in 2009. From here it can be said that this ratio has decreased
from 31.4% in 2004 to 24.2% in 2009, thus it can be said that over the time the liquidity
requirement of the bank has decreased as this ratio said that the lower the ratio the lower the
requirement for external fund.
City Bank: This ratio measures how stable funding bases the bank posses. The demand deposits
are subject to immediate withdrawal while time deposits have fixed maturities with penalties for
early withdrawal. Therefore, a decline in this ratio suggests higher liquidity. In 2004, City
Bank’s deposit composition ratio was 67.2%. It gradually declined to 47.5% and 41.9%.But it
increased to 61.2% in 2007, again decreased 54.8%in 2008 and to 46.8% in 2009.
Cross-sectional analysis:
By comparing this ratio for the two banks it can be said that requirement of the external fund is
lower for Dhaka bank that City bank as this ratio constantly has been lowers for Dhaka bank in
comparison to City bank.
6. Hot money ratio:
14

Ratio Analysis of Dhaka Bank
2004 2005 2006 2007 2008 2009
Dhaka Bank 2.560 2.835 7.059 0.852 2.891 3.164
City Bank 1.121 0.914 0.778 0.692 0.625 0.754
Time series analysis:
Dhaka Bank: This ratio has a very different structure in compared to others, from 2004 there
was a sharp rise in this ratio in 2006 where it rises from 2.56 times in 2004 to 7.059 times in
2006 and in 2007 it reaches its minimum to .852 times and it became 3.164 times in 2009. It can
thus be said except 2006 and 2007 the amount of money market assets to cover the volatile
liabilities has been almost equal. Thus liquidity position has shown betterment from 2004-2006
and then again shown betterment from 2007-2009.
City Bank: In 2004 the hot money ratio was 1.121 times. The lower this ratio is the higher the
liquidity position. In 2005, its hot money ratio decreased to 0.914 times and continue to fall to
0.625 times in 2008, but increased to 0.754 times in 2009. Overall, the hot money ratio of City
bank declined.
Cross-sectional analysis: By comparing both the banks it can be said that although the times
City bank require less money market assets to cover the volatile liabilities in comparison to the
Dhaka bank. Thus from this perspective it can be said that City bank has a better position in
paying out its volatile liabilities. Thus we can say that Dhaka bank has more liquid than City
bank.
15

Ratio Analysis of Dhaka Bank
7. Tangible Net Worth plus Term Liabilities/Net Fixed Asset:
2004 2005 2006 2007 2008 2009Dhaka Bank
149.1913
189.659
163.625175
141.193
123.955
123.2114
City Bank
20.44157
28.246
22.7125509
20.1529
13.2497
17.34674
Time series analysis: Dhaka bank: With the passage of time Dhaka bank has shown a great
fluctuation in this ratio. Throughout the time it has maintained a very high equity and term
deposit in comparison to its fixed asset, where we see that this ratio reaches its peak in 2005
when this ratio was 189.6 and it then decreased to 123.21 in 2009. So, we can say that this bank
has maintained a great amount of Net Worth plus Term Liabilities in comparison to its Net Fixed
Asset.
Cross-sectional analysis When both of the banks are compared then it is found that Dhaka
bank’s Tangible Net Worth plus Term Liabilities/Net Fixed Asset is much higher than the City
bank. Thus, we can say that Dhaka bank has maintained its Net Worth plus Term Liabilities in
comparison to its Net Fixed Asset far more better than the City bank, which means Dhaka bank
has more potential to generate higher amount of Net Worth plus Term Liabilities by utilizing its
Net Fixed Asset.
8. Loans to Deposits ratio:
16

Ratio Analysis of Dhaka Bank
2004 2005 2006 2007 2008 2009Dhaka Bank 0.764 0.847 0.913 0.858 0.916 0.912City Bank 0.817 0.809 0.838 0.668 0.777 0.707
Time series analysis:
With the passage of time it has been found that this ratio has increased, this ratio has been 76.4%
in 2004 and it became 91.1% in 2009, though there was a decline in this ratio in 2007. So, it can
be said that with the passage of time this bank’s gross loan has increased, which can pose a threat
to its liquidity position.
Cross-sectional analysis: By comparing both the banks it can be said that Dhaka bank has higher amount of gross loan in comparison to the total deposit, thus Dhaka bank has higher potential to earn more income than to pay for its interest expense in comparison to the City bank. So, we can say that Dhaka bank is more efficient in controlling its gross loan in comparison to its total deposit, which is good for this ban when we compare this bank with the City bank.
9. Liquid Assets to Total Deposits:
2004 2005 2006 2007 2008 2009Dhaka Bank 0.965326 0.81995 1.61978419 0.86188 0.87905 0.919256City Bank 0.8293 0.7251 0.7083 0.6324 0.5945 0.5946
17

Ratio Analysis of Dhaka Bank
Time series analysis:
It has been found that this ratio has remained constant with the passage of time except in 2006
when it has risen up to 1.62 times, whereas it was found that this ratio was .965 times in 2004
and in 2009 it was found to decreased to 0.919 times. So, it can be said that changes in liquid
asset has been almost proportionate to the change in total deposit, thus has maintained a
satisfactory liquidity position.
Cross-sectional analysis: By comparing both the banks it can be said that Dhaka bank has a
higher proportion of liquid asset out of their total deposit in compared to City bank. Thus it can
be said that Dhaka bank has a better liquidity position according to this ratio in compared to City
bank.
10. Loan commitment ratio:
2004 2005 2006 2007 2008 2009
Dhaka Bank 0.398 0.507 0.503 0.358 0.365 0.322
City bank 0 0 0 0 0 0
18

Ratio Analysis of Dhaka Bank
Time series analysis:
Loan commitment ratio has been found to increasing from 2004 (39.8%) to 50.7% in 2005 and
then it decreased to 35.8% in 2007. Though it increased in 2008, in deceased again in 2009
where it was 32.2%. So, it can be said that with the passage of time Unused loan commitment
has varied and this variation was not proportionate with the change in total asset, though it varied
but it was not to a great extent. Since the Unused loan commitment ratio was least in 2009 thus
we can say that there is least liquidity risk in this year in compared to other years. Since the loan
commitment is least in 2009 thus we can say that Dhaka bank has a better liquidity position in
2009 than 2004.
Cross-sectional analysis: By comparing both the banks it was found that City bank does not
have any loan commitment thus this ratio was found to be zero for them but Dhaka bank has
some unused loan commitment, thus we can say that city bank does not have any risk associated
with Unused loan commitment but Dhaka bank has this type of risk.
Leverage Ratios
1. Debt to total assets:
2004 2005 2006 2007 2008 2009
Dhaka
Bank 0.947 0.933 0.947 0.946 0.944 0.936
19

Ratio Analysis of Dhaka Bank
City Bank 0.946 0.945 0.947 0.941 0.926 0.923
Time series analysis:
Dhaka Bank: From the graph we can see that there exists a great fluctuation in this ratio. In
2004 the debt to total assets ratio was 94.7%, which means that for BDT 100 of the total asset of
the bank it has BDT 94.7. After 2004 there was a sudden fall in this ratio to 93.3% in 2005 and in
2006 it again jumped to 94.7% and then it fall constantly to 93.6% in 2009. Thus from here we
can say that on an average the stockholder wealth may go down with the passage of the time as
higher debt to total assets ratio brings more money for the shareholders.
City Bank: In 2004 the debt to total assets ratio was 94.6 % which means for BDT 100 of total
asset the bank holding BDT 94.6 as debt. In following years it maintained almost similar amount
of debt like 94.5% (2005), 94.7% (2006), 94.1% (2007), 92.6% (2008) and finally 92.3% (2009).
Cross-sectional analysis: By analyzing both the banks we can say that as with the passage of
time City bank’s debt to total assets ratio has fallen at a higher pace than the Dhaka bank.
Though in 2005 City bank’s debt to total assets ratio was higher than Dhaka bank but except that
year in all other years the Dhaka bank’s debt to total assets ratio was higher than City bank.
Thus, we can say that leverage for the Dhaka bank is higher than City bank and thus debt holder
may have more faith on City bank, whereas shareholders in Dhaka bank has more potential to
20

Ratio Analysis of Dhaka Bank
earn more and risk of City bank’s shareholder is lower as leverage for this bank is lower than
Dhaka bank.
2. Debt to equity:
2004 2005 2006 2007 2008 2009
Dhaka
Bank 17.938 13.925 17.873 17.378 16.786 14.661
City Bank 17.607 17.027 17.747 15.962 12.542 12.04
Time series analysis:
Dhaka Bank: It can be noted from the graph that with the passage of the time debt to equity
ratio of this bank has decreased where in 2004 this ratio was 17.938 i.e. the debt is 17.938 times
than equity and in 2009 the ratio has decreased to 14.661. Thus we can say that with the passage
of time the debt have gone up or the equity has increased.
City Bank: In 2004 the debt to equity ratio was 17.61 which mean which mean City bank held
17.61 times of total equity as a long term loan. In following years it fluctuates and ends up in
2009 by 12.04 times, which mean it had almost 12.18 times equity in response to debt.
21

Ratio Analysis of Dhaka Bank
Cross-sectional analysis: By comparing the two banks we can say that City bank’s debt to
equity ratio was higher in first 3 years and in the last three years Dhaka bank’s debt to equity
ratio was higher. Thus we can say that though both the bank’s debt to equity ratio has decreased
with the passage of time, City bank’s decrease was in much more rapid pace than the Dhaka
bank. So, Dhaka bank’s leverage is higher than the city bank in the long run and risk is also
higher for Dhaka bank in this perspective.
3. Interest coverage ratio:
2004 2005 2006 2007 2008 2009
Dhaka
Bank 1.455 1.357 1.281 1.378 1.358 1.395
City Bank 1.831 1.914 1.582 1.388 1.555 1.614
Time series analysis:
Dhaka Bank: Dhaka bank’s interest coverage ratio was highest in 2004 when it was 1.455
which means that this bank could cover their interest expenses by 1.455 times with their current
level of EBIT. Then it decreased steadily till 2006 and then there was ups and down and it
become 1.395 in 2009. So, we can say that with the fluctuation in the interest coverage ratio the
debt burden of the bank has also fluctuated.
City Bank: In 2004 the ratio was 1.831 times, which means City bank could cover their interest
expenses by 1.831 times with their current level of EBIT. Moreover, its ratio managed to
22

Ratio Analysis of Dhaka Bank
increase EBIT into 1.914 times over debt in 2005, but decreased to 1.582times to 1.614 times in
the following years.
Cross-sectional analysis: By comparing both the banks we can say that City bank has a better
position in paying off its interest expense in comparison to Dhaka bank. In most cases except
2007 City bank has a interest coverage ratio higher than 1.5 thus we can say that they have a
lower interest rate risk but Dhaka bank’s interest coverage ratio has been consistently less than
1.5 thus we can presume that they have a higher interest rate risk than the City bank.
Activity (Efficiency) Ratios
1. Operating efficiency ratio:
2004 2005 2006 2007 2008 2009
Dhaka
Bank 0.412 0.399 0.696 0.366 0.348 0.336
City Bank 0.423 0.408 0.435 0.512 0.481 0.484
Time series analysis:
Dhaka Bank: It was found that operating efficiency ratio for Dhaka bank was 41.4% in 2004
which mean that for every BDT 100 this bank has TK.41.4 as expense. Operating efficiency ratio
decreases in the next year but in 2006 it has a sharp rise and it increases to 69.6% and in the later
23

Ratio Analysis of Dhaka Bank
years it decreased constantly and it was 33.6% in 2009. Thus we can say that over the time the
bank has decreased its expenses except in 2006 which is a good thing for the bank.
City Bank: In 2004 the ratio was 42.3% which for each BDT100 the bank incur BDT 42.3 as an
expense. Moreover in the following years Bank did slightly weak expanse management,
therefore in 2009 it had operating efficiency 48.4%.
Cross-sectional analysis: when we compare both the banks then we find that City bank’s
operating efficiency ratio was lower than Dhaka bank in 2005 and 2006, except these two years
this ratio for Dhaka bank was lower than the City bank. So, we can say that Dhaka bank was
actually better than City bank in managing their expense and was better able to reduce its
operating cost.
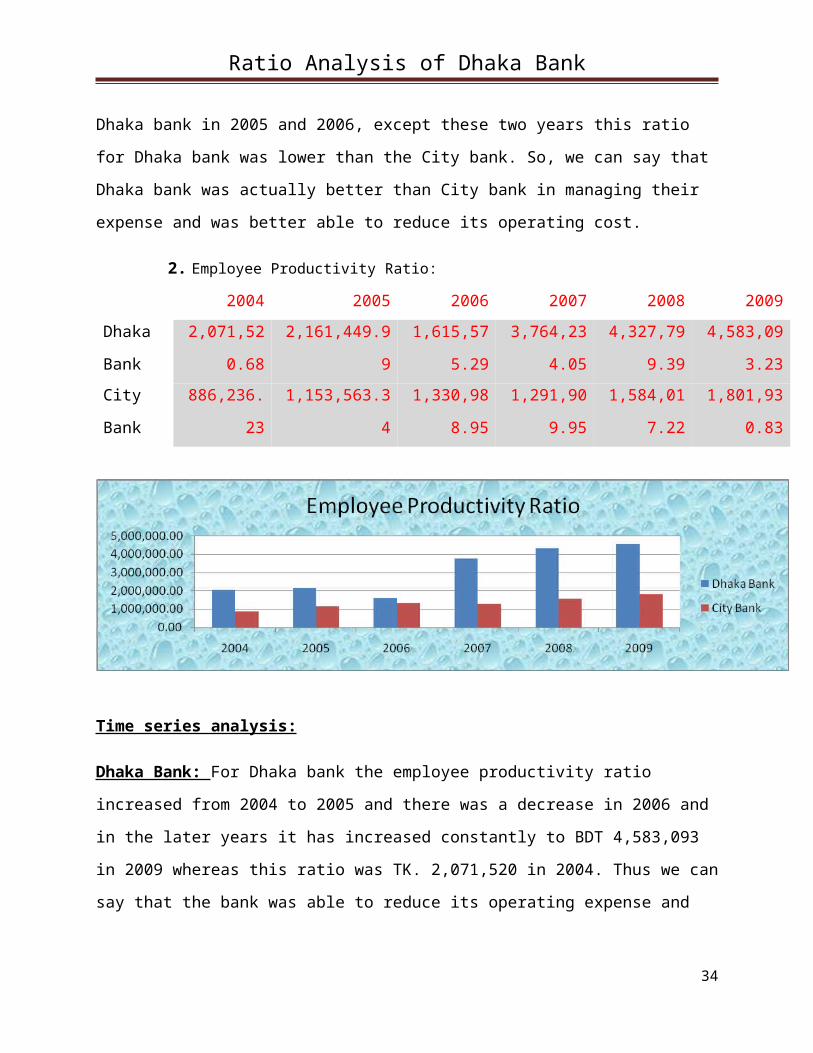
2. Employee Productivity Ratio:
2004 2005 2006 2007 2008 2009
Dhaka
Bank 2,071,520.68 2,161,449.99 1,615,575.29 3,764,234.05 4,327,799.39 4,583,093.23
City
Bank 886,236.23 1,153,563.34 1,330,988.95 1,291,909.95 1,584,017.22 1,801,930.83
Time series analysis:
Dhaka Bank: For Dhaka bank the employee productivity ratio increased from 2004 to 2005 and
there was a decrease in 2006 and in the later years it has increased constantly to BDT 4,583,093
in 2009 whereas this ratio was TK. 2,071,520 in 2004. Thus we can say that the bank was able to
24

Ratio Analysis of Dhaka Bank
reduce its operating expense and has increased its operating income with the passage of time and
the employees were very productive.
City Bank: In 2004 each employee generated operating income of TK 886,236 on average. In
2005 each employee generated operating income of TK 6,828,805 on average. The ratio
increased because operating income was more than what it was in 2004. In 2006 the ratio again
decreased but from 2007, 2008 and 2009 the ratio increased again. The employee productivity
increased because during the year operating income almost doubled whereas number of
employee didn’t increase in such proportion.
Cross-sectional analysis: By comparing both the banks we can say that this ratio was far higher
for Dhaka bank in comparison to the City bank. Thus we can say that Dhaka bank was more able
to reduce its operating cost or its employees were more enthusiastic towards their work and thus
they have shown better performance in this regards.
3. Tax management efficiency:
2004 2005 2006 2007 2008 2009
Dhaka
Bank 0.565 0.603 0.535 0.460 0.450 0.449
City Bank 0.462 0.478 0.368 0.425 0.393 0.59
Time series analysis:
Dhaka Bank: During 2004 tax management efficiency ratio for Dhaka bank was .565, which
means that the bank’s after tax income is .565 times the pretax income. In the next year there was
an increase in this ratio to .603 times and in the following years it has decreased constantly
25

Ratio Analysis of Dhaka Bank
to .449 in 2009. Thus we can observe that the bank is not managing its taxable assets properly
with the passage of time.
City Bank: In 2004 bank had after tax income 0.462 times the pretax income. After several
fluctuations it was 0.59 times in 2009, which means it has increased its tax deductible
investment. Moreover, they tried to increase their ratio in following years.
Cross-sectional analysis: When analyzing both the banks together, it was found that except in
2005 Dhaka bank showed a constant decrease in this ratio but for city bank there were several
fluctuations and except in 2009 this ratio was lower than the Dhaka bank. Thus it can be
presumed that except 2009 the Dhaka bank was better able to manage its taxable assets in
comparison to the City bank.
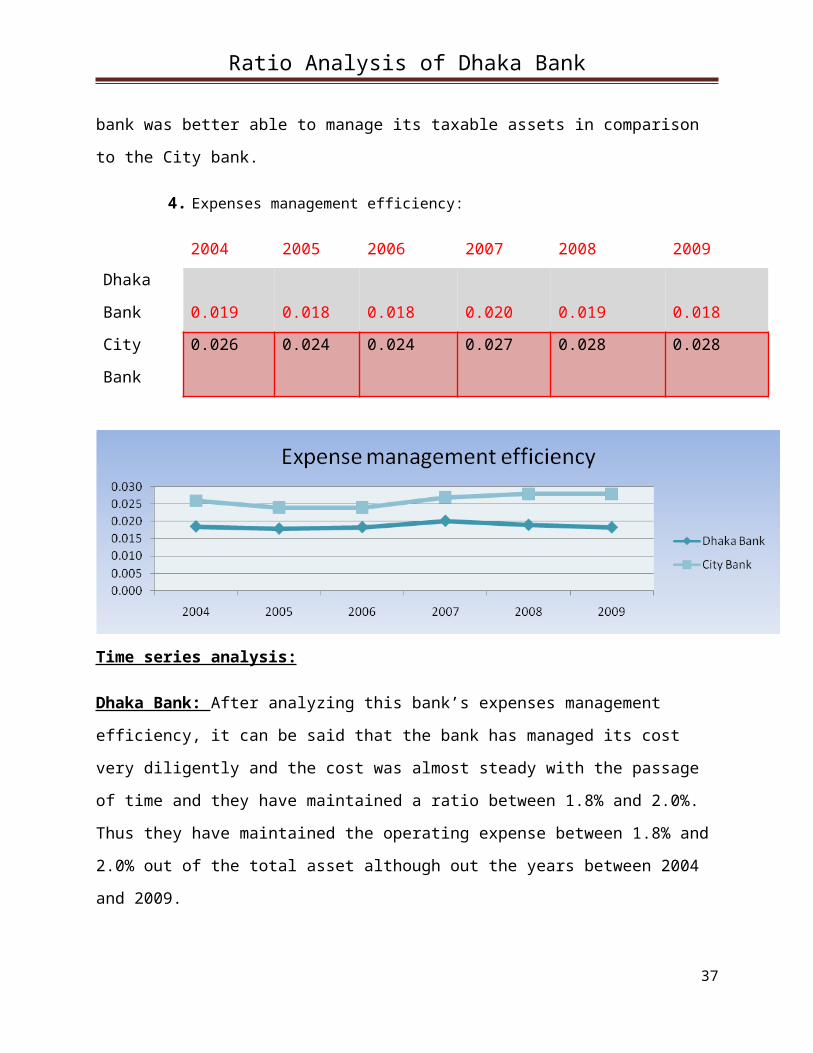
4. Expenses management efficiency:
2004 2005 2006 2007 2008 2009
Dhaka
Bank 0.019 0.018 0.018 0.020 0.019 0.018
City Bank 0.026 0.024 0.024 0.027 0.028 0.028
Time series analysis:
Dhaka Bank: After analyzing this bank’s expenses management efficiency, it can be said that
the bank has managed its cost very diligently and the cost was almost steady with the passage of
time and they have maintained a ratio between 1.8% and 2.0%. Thus they have maintained the
26

Ratio Analysis of Dhaka Bank
operating expense between 1.8% and 2.0% out of the total asset although out the years between
2004 and 2009.
City Bank: Bank has managed its expenses very nicely over times. Initially in 2004 it had 2.6%
of operating expenses over total assets. However at the end of 2009 they smartly hold that ratio
into 2.8%.
Cross-sectional analysis: It is observable that Dhaka bank was better able to minimize its
operating cost in relation to the assets in comparison with the City bank although out the years
between 2004 and 2009.
5. Asset Management efficiency (asset utilization (AU)):
2004 2005 2006 2007 2008 2009
Dhaka
Bank 0.045 0.045 0.026 0.055 0.055 0.054
City Bank 0.061 0.06 0.056 0.053 0.059 0.057
Time series analysis:
Dhaka Bank: In 2004 Dhaka bank’s asset utilization (AU) ratio was 4.5%, which remained
same in the next year but in 2006 there was a sudden decline to 2.6% and then it rises to 5.4% in
2009. From here it can be said that this bank has recovered 4.5% of the assets by its operating
revenue in 2004 which then increases to 5.5% in 2008 and 5.4% in 2009. Thus we can presume
27

Ratio Analysis of Dhaka Bank
that with the passage of time the bank became more efficient and thus increased its operating
revenue by utilizing its assets except in 2006.
City Bank: In 2004 this bank managed 6.1% operating revenue over its total asset. Their
performance had been almost stable in following years. There for it had 5.7% asset management
ratio in 2009.
Cross-sectional analysis: By comparing both the banks we can conclude that except in 2007
City bank was more efficient than Dhaka bank in earning its operating revenue by utilizing its
assets and thus their operating revenue was higher than the Dhaka bank.
6. Fund management efficiency (equity multiplier (EM)) :
2004 2005 2006 2007 2008 2009
Dhaka
Bank 18.938 14.925 18.873 18.378 17.786 15.661
City Bank 18.607 18.027 18.747 16.962 13.542 13.04
Time series analysis:
Dhaka Bank: Fund management efficiency ratio for Dhaka bank has fluctuated over the time
and it was highest in 2004 which was 18.938 and then there were downs and ups and in 2009 this
ratio was 15.661. Thus it can be said that though this bank had total assets were 18.938 times the
28

Ratio Analysis of Dhaka Bank
total equity in 2004 but this has decreased to 15.661 in 2009. Thus its total equity on an average
has increased over the time.
City Bank: In 2004 bank had total asset 18.607 times higher than total equity. That means, at
that time bank had huge debt. However in following year it decreased and came into 13.040
times in 2009.
Cross-sectional analysis: except in 2005 Dhaka bank’s fund management efficiency ratio has
been higher than the City bank. Thus it can be presumed that City bank has lower equity in
comparison to its total assets than the Dhaka bank. Thus City bank has more leveraged than the
Dhaka bank.
7. Rate Paid on Funds
2004 2005 2006 2007 2008 2009Dhaka Bank 0.0708 0.0787 0.0841 0.0881 0.0916 0.0878City Bank 0.0556 0.0515 0.0701 0.0955 0.0753 0.0707
Time series analysis:
Dhaka Bank: As we can see from the graph that this ratio increases from 2004 to 2008 and then
it decreased in 2009. Thus it can be said that though total interest expense in relation to earning
assets has increased till 2008 but it decreased in 2009, thus it can be concluded that in 2009
Dhaka bank was more efficient than in other years.
29

Ratio Analysis of Dhaka Bank
Cross-sectional analysis: By comparing both the banks we can conclude that except in 2007
Dhaka bank has more earnings generated from earning assets to pay for its interest expense when
compared to City bank. Thus, we can say that Dhaka bank has a better position in this regard
than the City bank.
8. Efficiency Ratio
2004 2005 2006 2007 2008 2009Dhaka Bank 0.382181 0.66486 0.74734296 0.57662 0.53395 0.506742City Bank 0.422953 0.40809 0.43539607 0.51175 0.48084 0.483586
Time series analysis: It has been found that this ratio has increased from 38.2% in 2004 to
50.67% in 2009 and this ratio was highest in 2006 which was 74.73%. Thus it can be concluded
that except in 2006 when this ratio was highest, change in the total non interest expense has been
proportionately lower when in compared to the net interest and non interest income, thus it can
be said that with the passage of time this bank became efficient and thus was able to reduce their
non interest expense.
Cross-sectional analysis: By comparing both the banks we can say that Dhaka bank’s efficiency ratio is better than the City bank’s ratio. Here we can say that Dhaka bank has better ability to cover up total noninterest expense with its income from interest and non-interest. So, it can be concluded that Dhaka bank has a higher earning potential in this respect in consideration to the City bank.
30

Ratio Analysis of Dhaka Bank
Profitability Ratios
1. Return on Equity (ROE):
2004 2005 2006 2007 2008 2009
Dhaka
Bank 24.032 20.874 19.934 22.516 20.972 19.320
City Bank 26.827 27.621 9.484 11.949 9.44 13.961
Time series analysis:
Dhaka Bank: In 2004 return on equity for Dhaka bank was 24.032%, which means that Dhaka
bank has earned TK 24.032 for their shareholders per BDT 100 equity money. In the next two
year this ratio has decreased and it became 19.934% in 2006 and then it again increased in 2007
to 22.972%. In the next two years there was again a decline in this ratio and it became 19.320%
in 2009. From here it can be said that though Dhaka bank earned a higher return for its
shareholders in 2004 but it has declined with the passage of time and it became lowest in 2009.
City Bank: In 2004 the share holder’s of City bank has earned TK 26.82 per TK 100 worth of
their investments. In 2005 shareholder earning was the highest among these six years of analysis
which is 27.62. In 2006 the share holder’s of this bank has earned TK 9.484 per TK 100 worth
of their investments. The ratio has decreased a drastically as total equity capital increased at
higher proportion compare to net income after tax. In 2007 the share holder’s of City bank has
earned TK 11.949 per TK 100 worth of their investments. In 2008 and 2009, the share holder’s
31

Ratio Analysis of Dhaka Bank
of this bank has earned TK 9.44 and TK 13.96 respectively, per TK 100 worth of their
investments. The ratio has decreased significantly as total equity capital increased at higher
proportion compare to net income after tax.
Cross-sectional analysis: In comparing the two banks it was found that though City bank’s
return on equity was higher in first two years but it then decreased drastically and it became
lower than Dhaka bank. Thus it can be said that though Dhaka bank’s return on equity decreased
over time but in relation to the City bank it decreased at a lower rate, thus relative return for
Dhaka bank’s shareholders was higher than City bank’s shareholders.
2. Return on Assets (ROA):
2004 2005 2006 2007 2008 2009
Dhaka
Bank 1.269 1.399 1.056 1.225 1.179 1.234
City Bank 1.442 1.532 0.506 0.704 0.697 1.071
Time series analysis:
Dhaka Bank: In 2004 the return on assets (ROA) for this bank was 1.269%, which means that
by utilizing BDT 100 the bank can earn a net income of TK 1.269. The return on assets (ROA)
was lowest in 2006 when it was 1.056% and it was highest in 2005 when this ratio was 1.399%.
After 2006 there was an increase in this ratio to 1.225% and it became 1.234% in 2009. Thus it
32

Ratio Analysis of Dhaka Bank
can be said that there was fluctuation in the net income and thus the return on assets (ROA) has
also several fluctuations.
City Bank: In 2004 City bank has made a net profit of TK 1.44 by utilizing TK 100 worth of
Assets. In 2005 Return on asset was almost same as in 2004. In 2006 it has decreased
significantly due to decrease in net income after tax. In 2007 return on asset was slightly higher
than in 2006 and it was TK 0.704. In 2008, return on asset was same as in 2007. In 2009 its ratio
was TK 1.071 by utilizing TK 100 worth of Assets.
Cross-sectional analysis: In comparing both the banks it can be said that though Dhaka bank
has fluctuations in the return on assets (ROA) but this fluctuation was lower than City bank
whose fluctuation was much higher and except in the first two years Dhaka bank’s return on
assets (ROA) was higher than the City bank. Thus it can be concluded that Dhaka bank earns a
more stable net income in comparison to the City bank.
3. Net interest Margin:
2004 2005 2006 2007 2008 2009
Dhaka
Bank 2.207 2.262 1.999 2.763 2.752 2.649
City Bank 2.653 3.057 2.533 1.944 2.638 2.708
Time series analysis:
Dhaka Bank: It can be said that in 2004 the bank made a net interest income of TK 2.207 by
utilizing TK 100 worth of Assets. This ratio has shown a steady increase except in 2006 and
33
Ratio Analysis of Dhaka Bank
became 2.649% in 2009. Thus it can be said that with the passage of time the bank has earned a
higher net interest income which is actually good for the bank.
City Bank: In 2004 the bank made a net interest income of TK 2.65 by utilizing TK 100 worth
of Assets. In 2005 this bank made a net interest income rise to TK 3.06. In 2006 this bank made
a net interest income fall to TK 2.55. The ratio decreased because the income from holding asset
decreased at a significant rate compare to the decrease in supply cost of funds for holding assets.
In 2007 the company made a net interest income of TK 1.94 by utilizing TK 100 worth of
Assets. In 2008 the company made a net interest income of TK 2.64 by utilizing TK 100 worth
of Assets. The ratio increased because the difference between interest income & interest expense
was increased at a higher proportion compare to the increase in total assets.
Cross-sectional analysis: When both the banks are compared then it is observable that except
2007 and 2008 Dhaka bank’s net interest margin was lower than the City bank. Thus it can be
said that Dhaka bank has a lower net interest income in relation to the City bank and it would be
wiser for Dhaka bank to try and increase their net interest income as this is one of the most
important income that the banks make to compete effectively with the City bank.
4. Net Non-interest Margin:
2004 2005 2006 2007 2008 2009
Dhaka Bank 2.299 2.701 2.32 0.737 0.809 0.965
City Bank 0.843 0.48 0.617 0.632 0.435 0.242
34

Ratio Analysis of Dhaka Bank
Time series analysis:
Dhaka Bank: In 2004 net non-interest margin for Dhaka bank was 2.299%, which means Dhaka
bank earns TK 2.299 of net non-interest income by investing its BDT 100 worth of its total
assets. After 2004 there was a steady decrease of this ratio till 2007 when net non-interest margin
becomes 0 .737% and then it increased in the next two years and it was 0.965% in 2009. Thus it
can be said that this bank’s net non-interest income has gone down after 2004 and then again it
showed an increase from 2008.
City Bank: Initially City bank had net interest margin of 0.843 times of its total asset. Between
several fluctuations finally bank able to decrease its net interest margin in 2009. However in
2007 it had highest net interest margin with 0.632 times.
Cross-sectional analysis: Between 2004 and 2009, in all the years Dhaka bank’s net non-
interest margin was higher than the City bank. Though this ratio was almost same in 2007 but
still Dhaka bank’s net non-interest margin was higher. Thus it can be said that Dhaka bank earns
a higher net non-interest income than the City bank and thus Dhaka bank are in a better position
than the City bank in earning net non-interest income.
5. Net operating Margin:
2004 2005 2006 2007 2008 2009
Dhaka
Bank 2.650 2.701 0.801 3.500 3.561 3.614
City Bank 3.496 3.537 3.15 2.576 3.073 2.95
35

Ratio Analysis of Dhaka Bank
Time series analysis:
Dhaka Bank: From the analysis of the Dhaka bank it can be said that it made a net operating
profit of TK 3.5 by utilizing TK 100 worth of assets. Over the time this ratio has increased at a
constant pace except in 2006 when it decreased to 0 .801% and then it increased again and
became 3.614% in 2009. Thus it can be said that over the time this bank has earned a higher
operating profit by utilizing its assets which tells us that the bank has became more efficient in
controlling its operating expenses with the passage of time.
City Bank: In 2004 City bank made a net operating profit of TK 3.5 by utilizing TK 100 worth
of assets. Over the year City bank almost maintained its net operating ratio but it dropped to
2.95% in 2009.
Cross-sectional analysis: By comparing both the banks it is noticeable that in the first three
years Dhaka bank’s net operating margin was lower than the City bank and in the later years its
net operating margin was higher than the City bank. This suggests that where Dhaka bank has
became more efficient in controlling its operating expenses City bank became less efficient in
controlling this expense, thus Dhaka bank earn a higher net operating profit in relation to its total
assets with the passage of time compared to the City bank.
6. Earnings per share (EPS):
2004 2005 2006 2007 2008 2009
Dhaka
Bank 60.750 43.990 45.170 36.390 39.420 45.099
City Bank 79.22 75.13 20.2 25.14 25.34 52.11
36
Ratio Analysis of Dhaka Bank
Time series analysis:
Dhaka Bank: The higher the EPS the higher the earning potential for the bank’s shareholders
and higher the growth. In case of Dhaka bank it is observed that EPS has alternative ups and
downs, where it increased in one year and in the next year it decreased again except 2008 and
2009, where there was consecutive rise in the EPS. In 2004 the EPS was TK60.75, which was
highest and the EPS was lowest in 2007 when it was TK.36.39. In 2009 the EPS became
TK45.099. This means that the shareholders have earned a fluctuated EPS, which may not be
very good for the bank as they may have problems in finding out future equity capital.
City Bank: In 2004 the common stockholder earning per share was TK 79.22. In 2005 the
common stockholder earning per share was TK 75.13. In 2006, 2007 and 2008 EPS was TK
20.20, TK 25.14 and TK 25.34 respectively. The EPS has fallen because net income after tax
decreased and also the number of common stock outstanding increased significantly. But 2009
earnings per share rose due to increase in net income after tax and EPS was TK 52.11.
Cross-sectional analysis: When two banks are compared then it was found that Dhaka bank’s
EPS was much more stable than the City bank, whose EPS has showed a higher fluctuation and it
moved in between TK79.22 and TK20.2 whereas Dhaka bank’s EPS was in between TK60.75
and TK36.39. Thus it can be said that shareholders for City bank has experienced a much higher
fluctuation in EPS due to fluctuation of net income and number of common stock than Dhaka
bank’s shareholders.
7. Earnings spread
2004 2005 2006 2007 2008 2009
Dhaka Bank 0.061 0.048 0.046 0.011 0.053 0.052
37

Ratio Analysis of Dhaka Bank
It has been found that with the passage of time this ratio has fluctuated a lot where it was found
that this ratio has decreased till 2007 and it 2007 it became least and reached 1.1% and then it
increased and became 5.2% in 2009. So, it can be said that total interest income in relation to
total earning asset has decreased in a higher rate than total interest expense in relation to total
interest bearing liability, which is not a good scenario for this bank.
8. Net profit margin
2004 2005 2006 2007 2008 2009
Dhaka
Bank 0.282 0.311 0.400 0.222 0.216 0.227
City Bank 0.237 0.2563 0.090 0.13 0.11 0.18
Time series analysis:
38

Ratio Analysis of Dhaka Bank
This ratio has increased from 28.2% in 2004 to 40% in 2006 and then it decreased to 22.2% in
2007 and in increased a little and became 22.7% in 2009. Thus it can be said that Net income in
relation to total operating revenue has increased from 2004 to 2006 thus in this period the firm’s
profit was more satisfactory and it was most satisfactory in 2006 and then the profit margin in
relation to total operating revenue decreased which shows a declining condition for this bank.
Cross-sectional analysis:
Since Dhaka bank’s Net profit margin was found to be more than City bank with the passage of
time thus it can be said that profitability of Dhaka bank is actually better than the City bank.
9. Overhead Margin
2004 2005 2006 2007 2008 2009
Dhaka
Bank 0.019 0.018 0.018 0.020 0.019 0.018
City
Bank
0.026 0.024 0.024 0.027 0.028 0.028
Time series analysis:
39

Ratio Analysis of Dhaka Bank
Dhaka bank: From here it can be said that with the passage of time this ratio has remained almost
same for this bank, which was 1.9% in 2004 and it became 1.8% in 2009 and it reached 2% in
2007 which was the highest. Thus it can be said that total non interest expense in relation to the
total asset has remained almost constant thus it can be presumed that non interest expense for this
bank has not changed a lot with the passage of time.
Cross-sectional analysis:
In comparing the two banks it can be said that this ratio for Dhaka bank’s has been constantly
lower than City bank. Thus it can be concluded that Dhaka bank is more efficient in controlling
its non interest expense than the City bank.
Market position Ratio:
1. Price earnings ratio:
2004 2005 2006 2007 2008 2009
Dhaka
Bank14.033 10.662 10.317 19.401 9.158 10.732
City Bank 11.08 10.236 19.307 28.848 17.818 14.009
Time series analysis:
Dhaka Bank: It has been found that P/E ratio of the bank has constantly decreased from 2004 to
2006 where the P/E ratio was 14.033 in 2004 it decreased to 10.317 in 2006. Then it again
40

Ratio Analysis of Dhaka Bank
increased in 2007 and it was highest in this year which was 19.401 and it decreased in 2008 to
9.158 and in 2009 it became 10.732. By observing the trend we can say that the P/E ratio has
fluctuated with the passage of time mainly due to the fluctuation of EPS and change in the
market value of the share which decreased drastically in 2008 which reflect the downward
movement of the P/E ratio in 2008. Thus in 2004 the bank’s shareholders could have earned TK1
by investing TK14.033, though in the following years the shareholders have earned TK1 by
investing less money but at the same time the growth rate of the bank has gone down.
City Bank: In 2004 the price of the share was TK 11.08 for every TK 1 it generates. In 2005 the
ratio was almost same and was TK 10.24 per share but in 2006 and 2007 the ratio rose because
price per share decrease at a higher proportion compare to decrease in EPS. But in 2008 the ratio
declined because price per share decrease at a higher proportion compare to decrease in EPS and
2009 the ratio also declined because the increase in EPS at a higher proportion compare to the
increase in price per share.
Cross-sectional analysis: By comparing both the banks we see that except for the first two years
the P/E ratio of Dhaka bank has been lower than the City bank. This has mainly happened due to
decrease in the EPS of the City bank from 2006 till 2008 and a higher market value of the share,
though this price was not very high in comparison to Dhaka bank. Since on an average City
bank’s P/E ratio is higher than the Dhaka bank thus we can say that City bank has a higher
growth rate and is more profitable for the shareholders in the long run, though in Dhaka bank the
shareholders can earn TK1 return by investing less money.
2. Market book value ratio:
2004 2005 2006 2007 2008 2009
Dhaka
Bank 3.792 2.599 2.356 4.368 1.746 2.074
City Bank 2.972 2.827 1.831 3.447 1.682 1.956
41

Ratio Analysis of Dhaka Bank
Time series analysis:
Dhaka Bank: In 2004 the investors of Dhaka bank are willing pay TK 3.792 for TK 1 book
value of share. Then in the next two years investors of Dhaka bank are willing pay less money
for TK 1 book value of share and again this ratio has increased and reached its peak in 2007
when investors faith in this bank was highest thus they wanted to pay TK4.368 for TK 1 book
value of share. In the next year in reaches it’s minimum level to 1.746 and then again increases
to 2.074 in 2009. This fluctuation was mainly due to the change in the market value of the share
which decreased drastically in 2008 which reflect the downward movement of the market book
value ratio.
City Bank: In 2004 the investors are willing pay TK 2.97 for TK 1 book value of share. In 2005
and 2006 the ratio decrease as market share price decreased compare to book value of the share
decreases. In 2007 the ratio increase as market share price increased at a higher proportion where
as the book value of the share decreased. The ratio was found inconsistent. In 2009 it was TK
1.96 for TK 1 book value of share.
Cross-sectional analysis: Except in 2005 in all other years the investors of Dhaka bank had
higher faith in Dhaka bank in comparison to the City bank, thus the market book value ratio for
Dhaka bank was higher in these cases. It reflects that if the bank is liquidated except 2005 the
Dhaka bank would get higher amount money in comparison to the City bank.
42

Ratio Analysis of Dhaka Bank
3. Dividend per Share (DPS):
2004 2005 2006 2007 2008 2009
Dividend per ShareDhaka Bank 6.057 8.798 3.957 5.459 6.505 11.250
City Bank 50 50 10 15 15 25
43

Ratio Analysis of Dhaka Bank
Time series analysis:
Dhaka Bank: DPS of the Dhaka bank has shown several fluctuations with the passage of time.
In 2004 DPS was 6.057% and in 2009 it became 11.25%. This ratio was least in 2006 when it
became 3.957%. So, it can be said that though the earning for the shareholders on one share was
Tk.6.057 against each share they hold which has increased to Tk. 11.25 in 2009. Thus we can say
that the shareholders income has increased from 2004 to 2009 but it declined in 2006.
City Bank: In 2004 and 2005 the shareholder’s got TK 50 as dividend against each share they
hold. In 2006 the ratio decreased to Tk 10 against each share they hold. But in 2007 & 2008 the
ratio was same Tk 15 against each share they hold. The ratio decreased mainly because the
dividend paid increased compare to the total equity share outstanding. In 2009 it was Tk 25 as
dividend against each share they hold.
Cross-sectional analysis
By analyzing both the banks it can be said that though City Bank’s DPS has fluctuated a lot but
Dhaka bank’s DPS fluctuation was lower. Where City bank’s DPS has decreased from 50% to
10% in 2006, Dhaka bank’s DPS has remained almost static and it was within 5-11%. By
comparing these two banks’s it can be said that the earning for the shareholders in City bank was
much higher than Dhaka bank in the beginning but in the later years Dhaka bank has made
progress in this issue.
4. Dividend Yield:
2004 2005 2006 2007 2008 2009
Dividend Yield
Dhaka Bank 0.713 1.876 0.849 0.773 1.802 2.324
City Bank
5.69638
3
6.501950
6 2.5641
2.0682
5
3.3222
6
3.4246
6
44

Ratio Analysis of Dhaka Bank
Time series analysis:
Dhaka Bank:
The dividend yield ratio shows the return that the share holder gets against each taka of
investment. It’s a comparison of dividend and market share price. This bank’s dividend yield has
increased from 2004to 2005 and then it decreased in 2006 to 2005 and then it increased in the
next two years and became 2.324% in 2009 where it was only .713% in 2004. This increase in
this ratio might encourage share holder to invest and cause the share price to go up.
City Bank: We find that the City bank dividend yield was not consistent during these six years
of analysis. In 2005 dividend yield of City bank was higher than rest of the five years. Overall
this bank’s dividend yield decreased from year 2004 to year 2009. It is very important ratio for
the investor. So this decrease discourage share holder to invest and cause the share price down.
Cross-sectional analysis
Though city bank’s Dividend yield has been greater than Dhaka bank but it showed a great
fluctuation and it has decreased a lot with the passage of time, whereas Dhaka bank’s dividend
yield has increased with the passage of time and in 2009 this bank has almost catch up City bank
in this regards. Thus with the passage of time this increase in this ratio might encourage share
holder to invest and cause the share price to go up in Dhaka bank in relation to the City bank.
5. Dividend Payout:
2004 2005 2006 2007 2008 2009
45

Ratio Analysis of Dhaka Bank
Dividend Payout Dhaka Bank 0.112 0.234 0.127 0.150 0.150 0.250
City Bank 0.631154 0.6655131 0.49505 0.59666 0.59195 0.47975
Time series analysis:
Dhaka Bank: This ratio was 11.2% in 2004 and it increased to 25% in 2009, which was a great
increase though this ratio was 15% in 2008. The higher this ratio is the better for stockholders.
Thus, since this ratio has increased to a greater degree from 2004 to 2009, thus we can say that
Dhaka bank is serving well to their shareholders.
Cross-sectional analysis: By comparing the two banks it is found that City bank’s dividend
payout ratio is much higher than Dhaka bank though City bank’s dividend payout ratio has
decreased from 2004 to 2009 then also this ratio for City bank was much higher than the Dhaka
bank. Thus it can be said that City bank’s shareholders are actually earning more than the Dhaka
bank’s shareholders.
6. Book value per share:
2004 2005 2006 2007 2008 2009
Dhaka Bank 224.135 180.440 197.817 161.618 206.773 233.385
City Bank 295.302 272.005 212.998 210.391 268.445 373.248
46

Ratio Analysis of Dhaka Bank
Time series analysis:
Dhaka Bank: Dhaka bank’s Book value per share has increased from 224.135 (2004) to 233.385
in 2009, though this ratio has been lower in between these two periods. Thus it can be said that
Dhaka bank if liquidated today will earn a higher amount of money than if it were liquidated in
the earlier years, so this bank’s value has increased will the passage of time as shown in 2009.
Cross-sectional analysis): By comparing the two banks it is found that City bank’s Book value
per share is much higher than Dhaka bank and this ratio was higher through out the years. Thus it
can be said that Dhaka bank if liquidated today will earn a lower amount of money than City
bank. Though earning potential for both the bank’s has increased over the time.
RECOMMENDATIONS
After observing all of the ratios I want to suggest investors to buy Dhaka Bank’s share as its
performance has shown an increase with the passage of time. If we look very closely to its ROA
and ROE we come to know that Dhaka bank has maintained these two ratios better than City
bank and with the passage of time it has not fluctuated much rather in ROA we find them to be
increasing. We find some fluctuation in EPS and P/E of Dhaka bank, thus I believe that they
must be more cautious in maintaining these two ratios and thus try to increase these by
increasing market price of the share. Dhaka bank’s Dividend per Share (DPS) was found to be
47

Ratio Analysis of Dhaka Bank
lower than the City Bank and I believe that it would be better for the investors if Dhaka bank’s
management decide to increase cash dividend to their shareholders or make them understand of
the future increment of return due present investment as they are retaining a large portion of the
net income, otherwise they may lose the opportunity to equity money in the future when it is
needed. Dhaka bank should do their best to improve their leverage position as all these ratios
shows that they have a very high leverage and thus they also have a higher risk, thus in this
respect they need to increase the amount of equity capital as too much leverage may be
associated with more risk. Dhaka bank also need to take essential measure to improve their tax
management ratio as this ratio has decreased in 2009 and became lower than city bank though
this ratio in all other years has been more than City bank and thus can increase their nontaxable
assets which can reduce overall tax for the company.
Dhaka bank should also take effective measure to decrease its total noninterest expense as
efficiency ratio has shown a decline in 2009.
Bibliography
1. http://www.dhakabankltd.com/
2. http://www.dhakabankltd.com/about_branches.php
48