developments in the atlantic lng - ihs markit · thank you! andrew ellis director of european gas...
TRANSCRIPT

Developments in the Atlantic LNG
Andrew EllisGlobal Insight

Copyright © 2006 Global Insight, Inc. 2
Changing Economics of LNG – Impact of Higher Costs
Changing Economics of LNG
Atlantic Basin Trade
Atlantic Arbitration Issue

Copyright © 2006 Global Insight, Inc. 3
Changes in the LNG equation
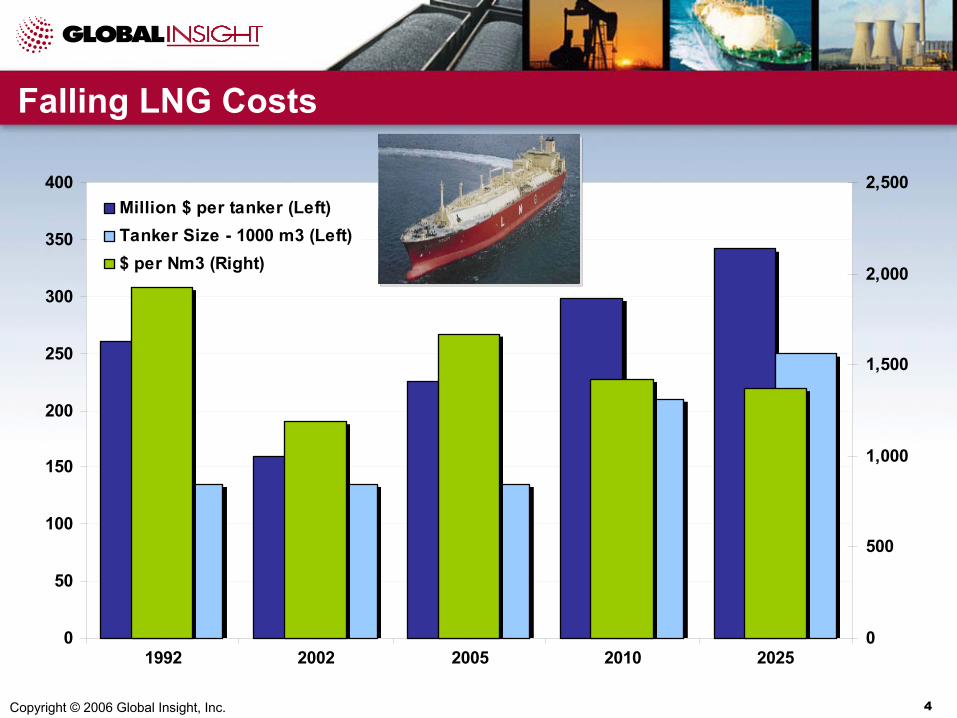
• Fundamentals shifted in favour of LNGInvestment costs fell over 1990sLNG competitive over shorter distances
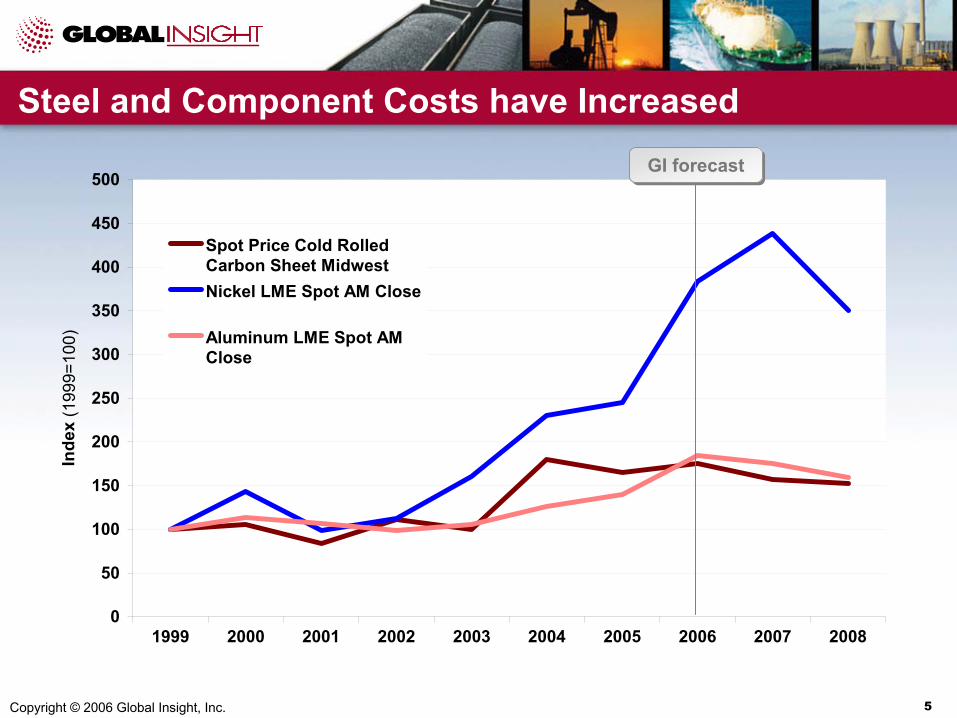
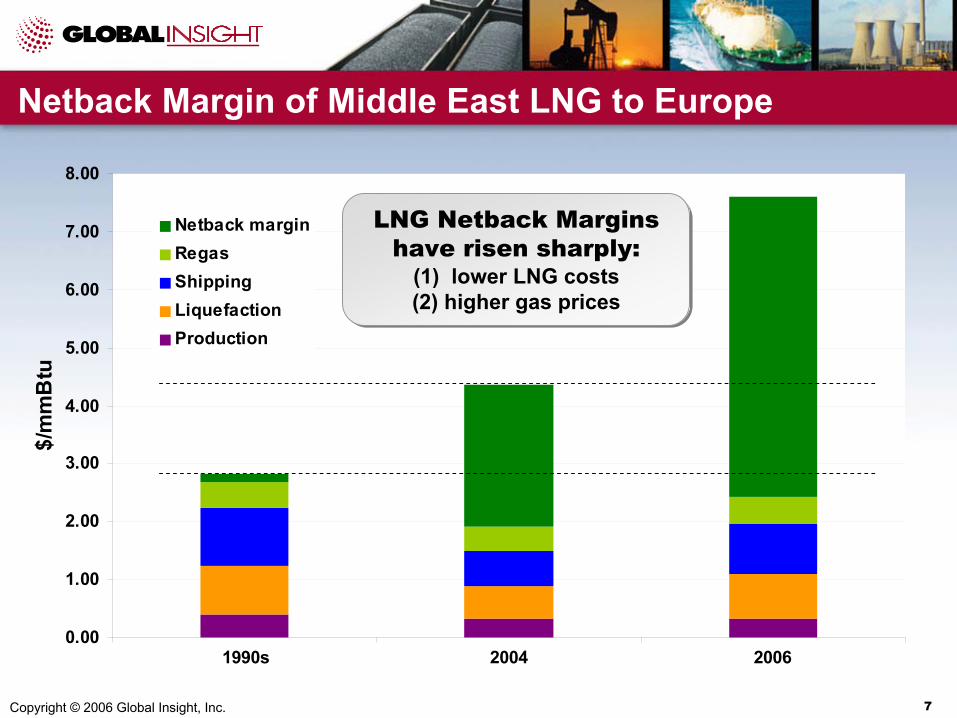
• Gas prices have risen on higher oil pricesNetback margins have increased significantlyRecent cost escalation not reversed earlier fall
• Incremental supplies coming from further afield
90% of gas resources available to Europe are more than 3000 km away (60% are more than 4000 km away)
Copyright © 2006 Global Insight, Inc. 4
0
50
100
150
200
250
300
350
400
1992 2002 2005 2010 20250
500
1,000
1,500
2,000
2,500Million $ per tanker (Left)Tanker Size - 1000 m3 (Left) $ per Nm3 (Right)
Falling LNG Costs
Copyright © 2006 Global Insight, Inc. 5
Steel and Component Costs have Increased
0
50
100
150
200
250
300
350
400
450
500
1999 2000 2001 2002 2003 2004 2005 2006 2007 2008
Inde
x (1
999=
100)
Spot Price Cold RolledCarbon Sheet MidwestNickel LME Spot AM Close
Aluminum LME Spot AMClose
GI forecastGI forecast

Copyright © 2006 Global Insight, Inc. 6
Economics (LNG vs. Pipeline)
0.00
0.50
1.00
1.50
2.00
2.50
3.00
100 500 900 1,300 1,700 2,100 2,500 2,900 3,300 3,700 4,100 4,500 4,900Distance (km)
$/m
mB
tu
Pipeline costs (2002) Pipeline costs (2006)LNG (mid-90s) LNG (2002)LNG (2006) LNG (2010)LNG (2025)
Copyright © 2006 Global Insight, Inc. 7
0.00
1.00
2.00
3.00
4.00
5.00
6.00
7.00
8.00
1990s 2004 2006
$/m
mB
tu
Netback marginRegasShippingLiquefactionProduction
Netback Margin of Middle East LNG to Europe
LNG Netback Margins have risen sharply:
(1) lower LNG costs(2) higher gas prices
LNG Netback Margins have risen sharply:
(1) lower LNG costs(2) higher gas prices
Copyright © 2006 Global Insight, Inc. 8
Atlantic Basin Trade – Burgeoning Growth
Changing Economics of LNG
Atlantic Basin Trade
Atlantic Arbitration Issue

Copyright © 2006 Global Insight, Inc. 9
Global Liquefaction & Regasification Capacity
0
50
100
150
200
250
300
350
400
2000 2001 2002 2003 2004 2005 2006 2007 2008 2009 2010
mill
ion
tonn
es L
NG
EuropeNorth AmericaSouth AmericaMiddle EastFar EastWest AfricaNorth Africa
0
100
200
300
400
500
600
700
2000 2001 2002 2003 2004 2005 2006 2007 2008 2009 2010
mill
ion
tonn
es L
NG
South AmericaNorth AmericaEuropeChina & IndiaAsia Pacific
Key growth areas:• Africa (N & W)• Middle East• Australia
Key growth areas:• Africa (N & W)• Middle East• Australia
Key growth areas:• Europe• N. America
Key growth areas:• Europe• N. America
LiquefactionLiquefaction RegasifactionRegasifaction

Copyright © 2006 Global Insight, Inc. 10
Global Liquefaction & Regasification Capacity
0
50
100
150
200
250
300
350
400
2000 2001 2002 2003 2004 2005 2006 2007 2008 2009 2010
mill
ion
tonn
es L
NG
EuropeNorth AmericaSouth AmericaMiddle EastFar EastWest AfricaNorth Africa
0
100
200
300
400
500
600
700
2000 2001 2002 2003 2004 2005 2006 2007 2008 2009 2010
mill
ion
tonn
es L
NG
South AmericaNorth AmericaEuropeChina & IndiaAsia Pacific
LiquefactionLiquefaction RegasifactionRegasifaction
Delays:• Australia – Gorgon – 10 mtpa• Bolivia – 7 mtpa• Nigeria – Brass River, OK, Ni T7 –
19.6 mtpa• Russia – Shtokman – 15 mtpa• Trinidad – Train X – 10.4 mtpa
Delays:• Australia – Gorgon – 10 mtpa• Bolivia – 7 mtpa• Nigeria – Brass River, OK, Ni T7 –
19.6 mtpa• Russia – Shtokman – 15 mtpa• Trinidad – Train X – 10.4 mtpa
Delays:• UK – Canvey Island• US – 2nd & 3rd stage expansion,
Cameron Parish, Mobile (Alabama)
Delays:• UK – Canvey Island• US – 2nd & 3rd stage expansion,
Cameron Parish, Mobile (Alabama)

Copyright © 2006 Global Insight, Inc. 11
Expanding Global LNG TradeFigures in BCM for 2010
Expanding markets• Europe & N. AmericaNew markets• China and India
Expanding markets• Europe & N. AmericaNew markets• China and India
Copyright © 2006 Global Insight, Inc. 12
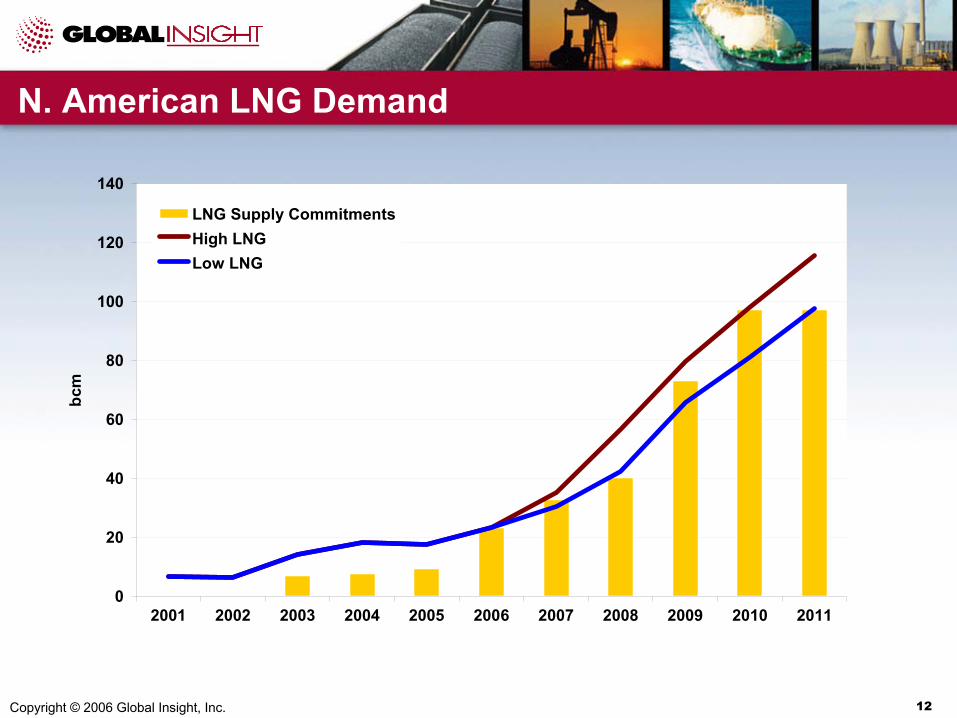
N. American LNG Demand
0
20
40
60
80
100
120
140
2001 2002 2003 2004 2005 2006 2007 2008 2009 2010 2011
bcm
LNG Supply CommitmentsHigh LNGLow LNG
Copyright © 2006 Global Insight, Inc. 13
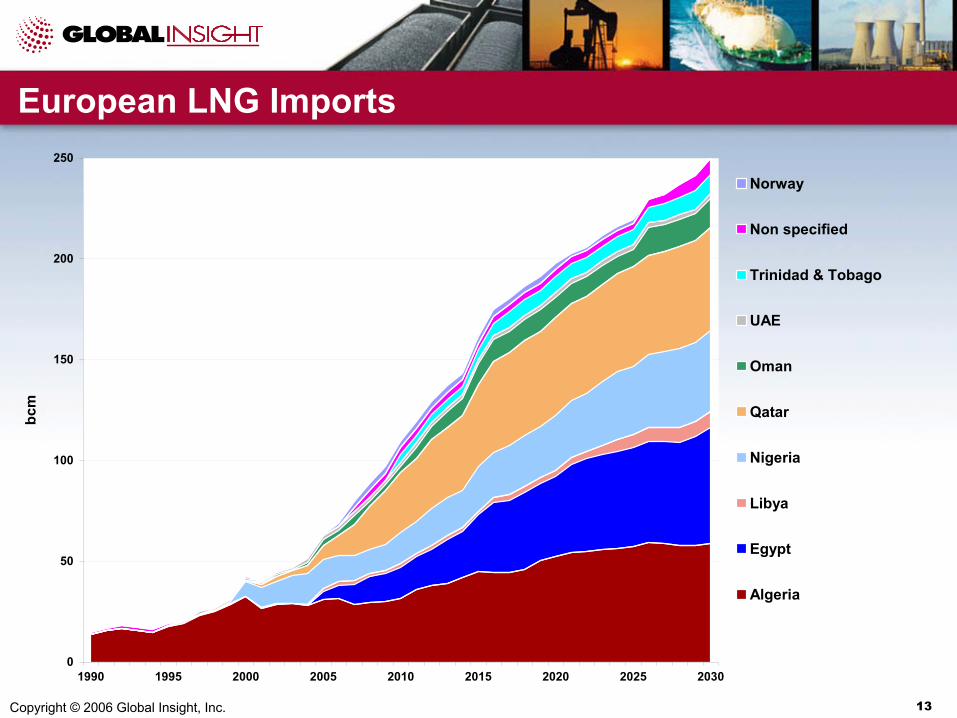
European LNG Imports
0
50
100
150
200
250
1990 1995 2000 2005 2010 2015 2020 2025 2030
bcm
Norway
Non specified
Trinidad & Tobago
UAE
Oman
Qatar
Nigeria
Libya
Egypt
Algeria
Copyright © 2006 Global Insight, Inc. 14
Atlantic Arbitration – Resource Competition, Pricing & Netbacks
Changing Economics of LNG
Atlantic Basin Trade
Atlantic Arbitration Issue
Copyright © 2006 Global Insight, Inc. 15
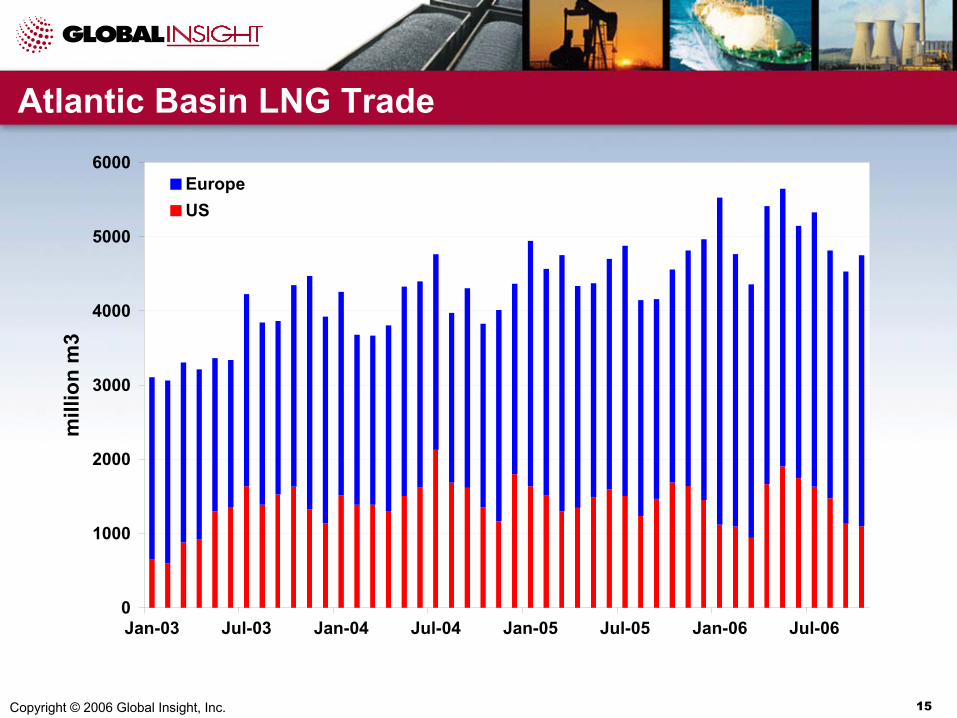
Atlantic Basin LNG Trade
0
1000
2000
3000
4000
5000
6000
Jan-03 Jul-03 Jan-04 Jul-04 Jan-05 Jul-05 Jan-06 Jul-06
mill
ion
m3
EuropeUS

Copyright © 2006 Global Insight, Inc. 16
U.S. vs. European Prices
Henry Hub versus Spanish Oil-indexed LNG
Henry Hub versus Spanish Oil-indexed LNG Henry Hub versus NBPHenry Hub versus NBP
-8.00
-6.00
-4.00
-2.00
0.00
2.00
4.00
6.00
8.00
10.00
12.00
14.00
16.00
Jan-98 Jan-99 Jan-00 Jan-01 Jan-02 Jan-03 Jan-04 Jan-05 Jan-06
$/m
mB
tu
US minus NBPHenry HubNBP
-4.00
-2.00
0.00
2.00
4.00
6.00
8.00
10.00
12.00
14.00
16.00
Jan-98 Jan-99 Jan-00 Jan-01 Jan-02 Jan-03 Jan-04 Jan-05 Jan-06
$/m
mB
tu
US minus Spanish LNGHenry HubSpanish LNG
Copyright © 2006 Global Insight, Inc. 17
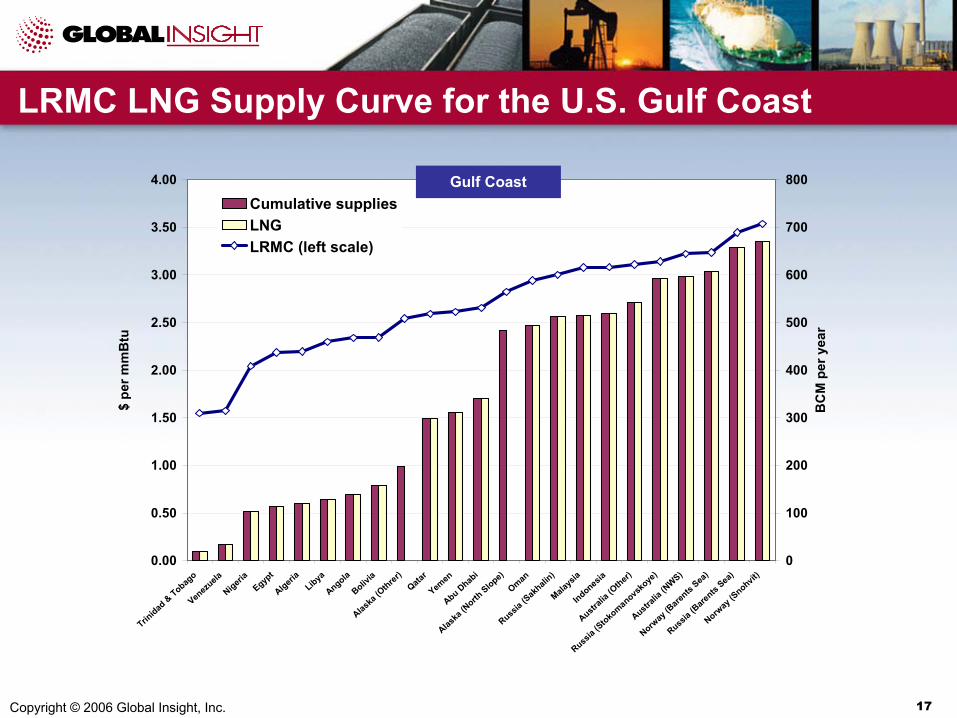
LRMC LNG Supply Curve for the U.S. Gulf Coast
0.00
0.50
1.00
1.50
2.00
2.50
3.00
3.50
4.00
Trinidad
& Tobago
Venez
uela
Nigeria
Egypt
Algeria
Libya
Angola
Bolivia
Alaska
(Othrer
)Qata
r
Yemen
Abu Dhabi
Alaska
(North
Slope)
Oman
Russia (S
akhali
n)
Malays
ia
Indonesia
Australi
a (Other)
Russia
(Stokomanovs
koye
)
Australia
(NWS)
Norway
(Bare
nts Sea
)
Russia (B
arents
Sea)
Norway
(Snohvit
)
$ pe
r mm
Btu
0
100
200
300
400
500
600
700
800
BC
M p
er y
ear
Cumulative suppliesLNGLRMC (left scale)
Gulf Coast

Copyright © 2006 Global Insight, Inc. 18
LRMC LNG Supply Curve for the U.S. East Coast
0.00
0.50
1.00
1.50
2.00
2.50
3.00
3.50
Canada (
exist
ing)
Trinidad
& Tobago
Venez
uela
Canad
a (Mac
kenzie
Delta)
Algeria
Nigeria
Egypt
Alaska
(Othrer
)Libya
Angola
Alaska
(North
Slope)
Abu Dhabi
Qatar
Yemen
Bolivia
Oman
Russia (S
tokomanovs
koye
)
Norway
(Bare
nts Sea
)
Malays
ia
Indonesia
Australia
(Other)
Russia (B
arents
Sea)
Russia (S
akhali
n)
$ pe
r mm
Btu
0
100
200
300
400
500
600
700
800
BC
M p
er y
ear
Cumulative suppliesLNGLRMC (left scale)
East Coast
Copyright © 2006 Global Insight, Inc. 19
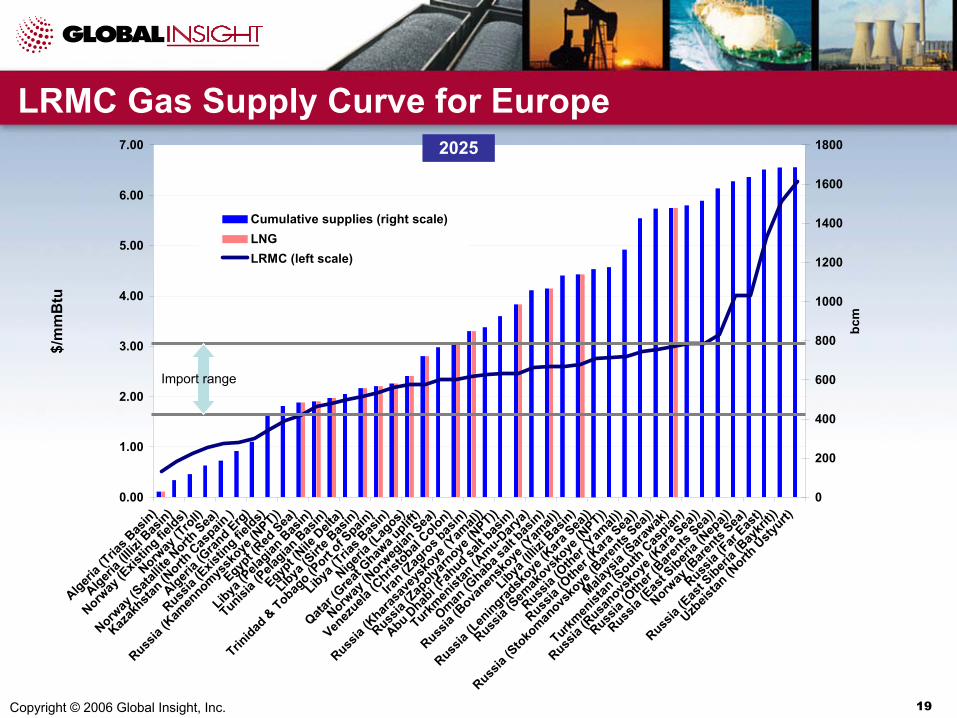
LRMC Gas Supply Curve for Europe
0.00
1.00
2.00
3.00
4.00
5.00
6.00
7.00
Algeria (
Trias B
asin)
Algeria (
Illizi
Basin)
Norway
(Exis
ting fie
lds)
Norway
(Tro
ll)
Norway
(Sata
llite N
orth Sea
)
Kazak
hstan (N
orth C
aspain
)
Algeria (
Grand Erg
)
Russia
(Exis
ting fie
lds)
Russia
(Kam
ennomys
skoye
(NPT))
Egypt (R
ed Sea
)
Libya (P
elagian
Bas
in)
Tunisia (
Pelagian
Bas
in)
Egypt (N
ile D
elta)
Libya (S
irte B
asin)
Trinidad
& Tobag
o (Port
of Spain
)
Libya (T
rias B
asin)
Nigeria (
Lagos)
Qatar (
Great G
hawa u
plift)
Norway
(Norw
egian
Sea)
Venez
uela (C
hristobal
Colon)
Iran (Z
agro
s bas
in)
Russia
(Khara
save
ysko
ye (Y
amal)
)
Russia
(Zapolya
rnoye
(NPT))
Abu Dhab
i (Fah
ud salt b
asin)
Turkmen
istan
(Amu-D
arya)
Oman (G
haba s
alt bas
in)
Russia
(Bova
nensk
oye (Y
amal)
)
Libya (Il
lizi B
asin)
Russia
(Leningrad
skoye
(Kara
Sea))
Russia
(Sem
akovs
koye
(NPT))
Russia
(Other
(Yam
al))
Russia
(Other
(Kara
Sea))
Russia
(Stoko
manovs
koye
(Bare
nts Sea
))
Malays
ia (S
arawak
)
Turkmen
istan
(South C
aspian
)
Russia
(Rusa
novsko
ye (K
ara Sea
))
Russia
(Other
(Bare
nts Sea
))
Russia
(Eas
t Siberi
a (Nep
a))
Norway
(Bare
nts Sea
)
Russia
(Far Eas
t)
Russia
(Eas
t Siberi
a (Bay
krit))
Uzbeis
tan (N
orth U
styurt)
$/m
mB
tu
0
200
400
600
800
1000
1200
1400
1600
1800
bcm
Cumulative supplies (right scale)LNGLRMC (left scale)
2025
Import range

Copyright © 2006 Global Insight, Inc. 20
Comparative LRMC of Supply (Europe vs. U.S.)
0.00
0.50
1.00
1.50
2.00
2.50
3.00
Spain UK East Coast Gulf Coast
$/m
mB
tu
Middle EastNorth AfricaWest AfricaTrinidad
Copyright © 2006 Global Insight, Inc. 21
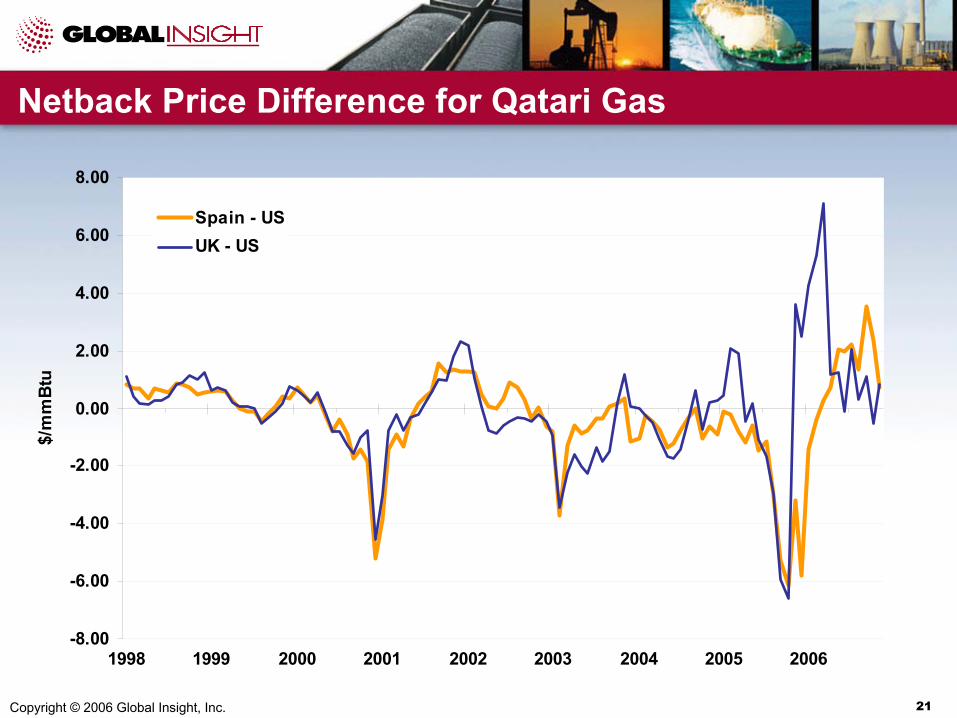
Netback Price Difference for Qatari Gas
-8.00
-6.00
-4.00
-2.00
0.00
2.00
4.00
6.00
8.00
1998 1999 2000 2001 2002 2003 2004 2005 2006
$/m
mB
tu
Spain - USUK - US

Copyright © 2006 Global Insight, Inc. 22
Average Netback Difference (U.S. vs. EU)
-2.00
-1.50
-1.00
-0.50
0.00
0.50
Middle East North Africa West Africa Trinidad
$/m
mB
tu
1998-20032004-present
Copyright © 2006 Global Insight, Inc. 23
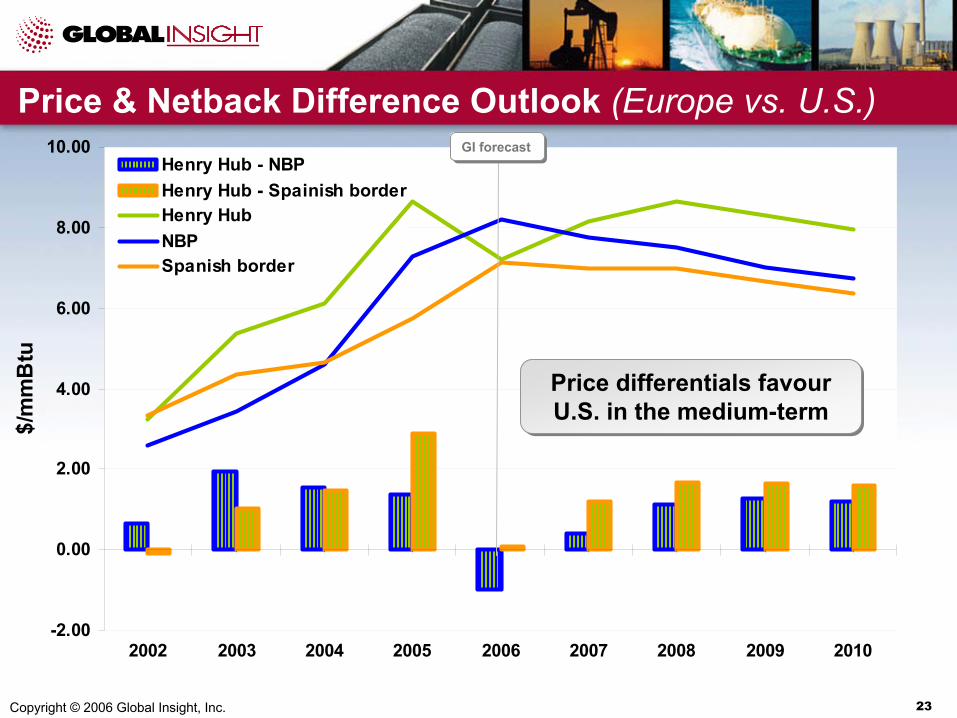
-2.00
0.00
2.00
4.00
6.00
8.00
10.00
2002 2003 2004 2005 2006 2007 2008 2009 2010
$/m
mB
tu
Henry Hub - NBPHenry Hub - Spainish borderHenry HubNBPSpanish border
Price & Netback Difference Outlook (Europe vs. U.S.)GI forecastGI forecast
Price differentials favour U.S. in the medium-termPrice differentials favour U.S. in the medium-term
Copyright © 2006 Global Insight, Inc. 24
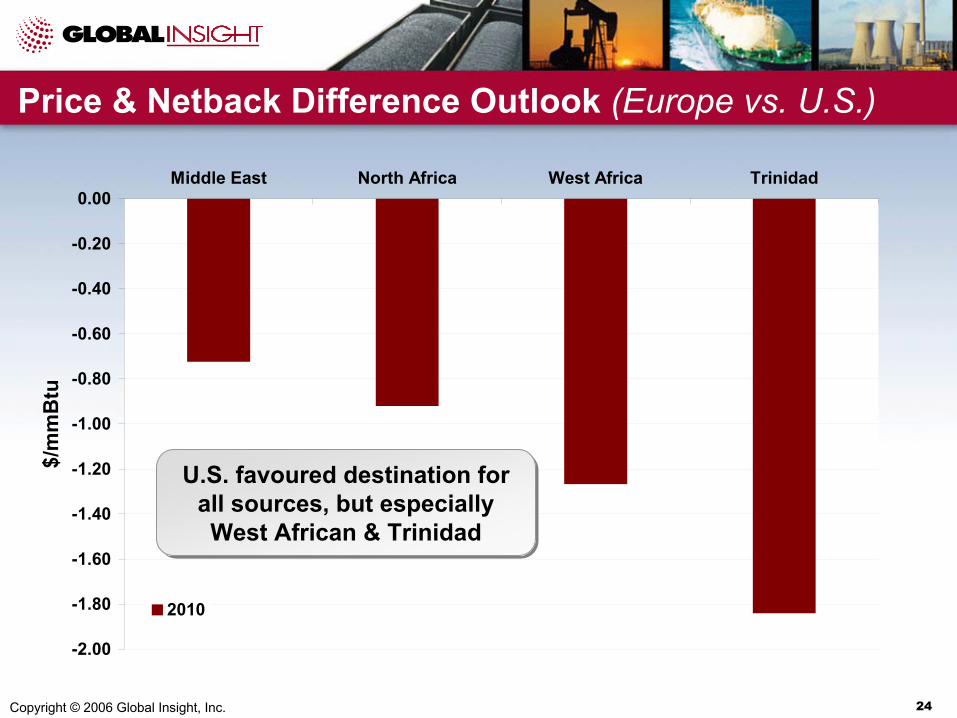
Price & Netback Difference Outlook (Europe vs. U.S.)
-2.00
-1.80
-1.60
-1.40
-1.20
-1.00
-0.80
-0.60
-0.40
-0.20
0.00Middle East North Africa West Africa Trinidad
$/m
mB
tu
2010
U.S. favoured destination for all sources, but especially West African & Trinidad
U.S. favoured destination for all sources, but especially West African & Trinidad
Copyright © 2006 Global Insight, Inc. 25
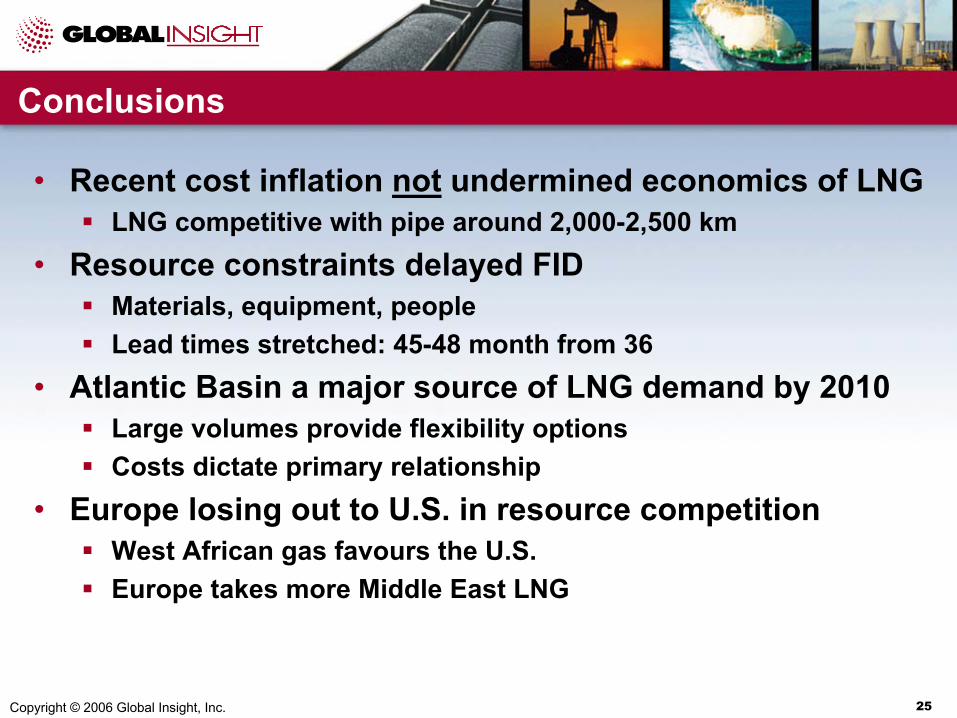
Conclusions
• Recent cost inflation not undermined economics of LNGLNG competitive with pipe around 2,000-2,500 km
• Resource constraints delayed FIDMaterials, equipment, peopleLead times stretched: 45-48 month from 36
• Atlantic Basin a major source of LNG demand by 2010Large volumes provide flexibility optionsCosts dictate primary relationship
• Europe losing out to U.S. in resource competitionWest African gas favours the U.S.Europe takes more Middle East LNG