developmental cell article - harvard universityliulab.dfci.harvard.edu/publications/dev...
TRANSCRIPT

Developmental Cell
Article
Differentiation-Specific Histone ModificationsReveal Dynamic Chromatin Interactions and Partnersfor the Intestinal Transcription Factor CDX2Michael P. Verzi,1,3,6 Hyunjin Shin,2,6 H. Hansen He,1,2 Rita Sulahian,1,3 Clifford A. Meyer,2 Robert K. Montgomery,1,4
James C. Fleet,5 Myles Brown,1,3 X. Shirley Liu,2 and Ramesh A. Shivdasani1,3,*1Department of Medical Oncology2Department of Biostatistics and Computational BiologyDana-Farber Cancer Institute, Boston, MA 02115, USA3Department of Medicine, Brigham & Women’s Hospital and Harvard Medical School, Boston, MA 02115, USA4Gastroenterology and Nutrition Division, Children’s Hospital, Boston, MA 02115, USA5Department of Foods and Nutrition, Purdue University, West Lafayette, IN 47907, USA6These authors contributed equally to this work
*Correspondence: [email protected]
DOI 10.1016/j.devcel.2010.10.006
SUMMARY
Cell differentiation requires remodeling of tissue-specific gene loci and activities of key transcriptionalregulators, which are recognized for their dominantcontrol over cellular programs. Using epigenomicmethods, we characterized enhancer elements spe-cifically modified in differentiating intestinal epithelialcells and found enrichment of transcription factor-binding motifs corresponding to CDX2, a criticalregulator of the intestine. Directed investigationrevealed surprising lability in CDX2 occupancy ofthe genome, with redistribution from hundreds ofsites occupied only in proliferating cells to thousandsof new sites in differentiated cells. Knockout miceconfirmed distinct Cdx2 requirements in dividingand mature adult intestinal cells, including responsi-bility for theactive enhancer configurationassociatedwith maturity. Dynamic CDX2 occupancy corre-sponds with condition-specific gene expressionand, importantly, to differential co-occupancy withother tissue-restricted transcription factors, such asGATA6 and HNF4A. These results reveal dynamic,context-specific functions and mechanisms of aprominent transcriptional regulator within a celllineage.
INTRODUCTION
Thousands of transcripts are coordinately regulated in differenti-
ating cells, in part as a result of stable, heritable, cell type-
specific changes in chromatin structure and in part through the
actions of selected transcription factors (TFs) at many gene
loci (Struhl, 1999). TFs that are highly restricted in their expres-
sion, regulate large numbers of genes within a cell lineage, and
may hence confer a cell’s distinctive properties are often consid-
Developme
ered ‘‘master regulators.’’ Examples of such TFs include PHA4 in
the worm pharynx (Gaudet and Mango, 2002) and mammalian
myogenic basic helix-loop-helix proteins (Molkentin and Olson,
1996). Although these TFs may function in both progenitor and
terminally differentiated cells of a lineage, their interactions
with alternative chromatin states are insufficiently characterized.
Nor is it clear if they occupy cis-regulatory DNA elements stably
throughout differentiation and whether distinct TF combinations
control genes in different cell states within a lineage. We ad-
dressed these questions on a genome scale in the context of
intestinal epithelial cells.
The adult intestine is a site of continual cell differentiation
(Potten, 1998). Stem and dividing progenitor cells in the small
bowel mucosa are confined to the crypts of Lieberkuhn, whereas
the differentiated postmitotic cells that serve essential absorp-
tive and secretory functions reside along villous projections.
Gene expression differs substantially in crypts and villi (Tremblay
et al., 2006) and, as with other self-renewing tissues, constitutive
proliferation and arrested differentiation underlie intestinal
tumorigenesis (van de Wetering et al., 2002). Gut epithelial cells
hence serve as an excellent model to investigate gene regulation
during differentiation.
Recent delineation of chromatin modifications at activated
gene loci provides new tools to investigate the epigenomic basis
of cell differentiation (Barski et al., 2007; Bernstein et al., 2006;
Pokholok et al., 2005). Mono- and dimethylation of Lys4
(K4Me2) and acetylation of Lys27 (K27Ac) residues on Histone
3 (H3) are particularly associated with distant transcriptional
enhancers and gene activation in cultured mammalian cells
(Bernstein et al., 2005; He et al., 2010; Heintzman et al., 2009).
Monitoring these chromatin modifications as cells transition
from one state to another could identify the cis-elements respon-
sible for differentiation in individual tissues, and characterization
of such elements should help elucidate underlying transcriptional
mechanisms. To identify cis-regulatory elements that are differ-
entially active in proliferating and terminally mature intestinal
epithelial cells, we mapped genome-wide histone H3 modifica-
tions. Our subsequent detailed analysis uncovered a prominent
role and mechanisms for the homeodomain protein CDX2.
ntal Cell 19, 713–726, November 16, 2010 ª2010 Elsevier Inc. 713

Developmental Cell
Dynamic Binding and Functions of CDX2
CDX2 expression is restricted at different developmental
stages and its ability to specify cell fates or axial position in
each context makes it a strong candidate ‘‘master regulator.’’
Expression of Cdx2 in mouse embryonic stem cells induces
trophoblasts (Niwa et al., 2005) and expression in stomach or
esophageal cells confers intestinal properties (Liu et al., 2007;
Silberg et al., 2002). Conversely, Cdx2 loss in mouse embryos
disrupts trophoblast, axial skeleton, and intestine development
(Chawengsaksophak et al., 1997; Gao et al., 2009; Grainger
et al., 2010). In adult mammals, Cdx2 expression is confined to
the intestinal epithelium, where it is expressed in both progenitor
and differentiated cells (James et al., 1994; Silberg et al., 2000).
To examine if CDX2 behaves as a key regulator and to investi-
gate its potentially diverse functions in dividing and mature cells,
we assessed CDX2 binding properties during differentiation. We
find that CDX2 interactions with the genome and with other
sequence-specific TFs are surprisingly fluid; it interacts dynam-
ically with active chromatin and co-occupies DNA differentially
with other intestinal TFs, GATA6 or HNF4A, to regulate distinct
genes in dividing and differentiated intestinal cells, respectively.
A new conditional knockout mouse line revealed distinct Cdx2
functions in progenitor and differentiated cells in vivo and its
requirement for differentiation-specific chromatin modifications.
These results illustrate the dynamic functions and mechanisms
of a critical TF in distinct cellular contexts within a continually
differentiating tissue.
RESULTS
Epigenomic Analysis of Intestinal Epithelial CellsImplicates CDX2 in Cell MaturationCaco-2 human intestinal cells are widely used to investigate
epithelial functions, intestinal geneexpression, and transcriptional
mechanisms of differentiation (Fleet et al., 2003; Halbleib et al.,
2007; Soutoglou and Talianidis, 2002). These cells proliferate
rapidly in sparse cultures but stop dividing at confluence (Fig-
ure 1A) and developmorphologic features of mature enterocytes;
the transcriptional changes that accompany cell differentiation
mirror differences in gene expression between intestinal crypts
and villi (Saaf et al., 2007; Tremblay et al., 2006). Accordingly,
they serve as an ideal model to study pivotal cellular transitions.
To identify cis-regulatory sequences associated with Caco-2
cell differentiation,weevaluatedadistinctpatternof histonemodi-
fications attributed to active enhancer elements (He et al., 2010;
Heintzmanetal., 2009): abundantH3K4Me2andH3K27Acmarks,
with depletion of labile nucleosomes within an altered chromatin
configuration (Figure 1B). We digested chromatin from prolifer-
ating and postconfluent Caco-2 cells with micrococcal nuclease
(MNase), precipitated the mononucleosome fraction with
H3K4Me2- or H3K27Ac antibodies (Ab), and characterized the
chromatin immunoprecipitates (ChIP) using Illumina high-
throughput sequencing (ChIP-seq). Subsequent analysis of the
two H3 modifications gave similar results (Pearson correlation
coefficient 0.4 (p value <10e-22) (see Figure S1 available online);
for simplicity, here we show the analysis of H3K4Me2 ChIP.
We analyzed 14.5 million and 13 million mappable sequence
tags for H3K4Me2 ChIP from proliferating and mature cells,
respectively, using published methods (He et al., 2010), and
identified 219,266 and 208,762 positioned nucleosomes under
714 Developmental Cell 19, 713–726, November 16, 2010 ª2010 Els
the two conditions (Figure S2). H3K4Me2 marks were restricted
either to transcriptional start sites (TSSs) or to dispersed short
intergenic and intronic regions, with little background signal
across the genome (examples in Figure 1C). Approximately
60% of nucleosomes bearing the H3K4Me2 mark in each
condition were present more than 5 kb from a TSS and hence
represent putative distant cis-regulatory elements. We focused
on these distal elements because previous work indicates that
enhanced H3K4Me2 signals at flanking nucleosomes and a
corresponding diminution of intervening signal typifies sites
where nucleosomes are depleted or destabilized to allow TF
binding (He et al., 2010; Heintzman et al., 2007; Jin et al.,
2009). A computational method to infer increased H3K4Me2
signals at flanking nucleosomes relative to the intervening region
uncovered thousands of individual sites that acquire or lose this
signature during Caco-2 cell differentiation (sample tracings in
Figure 1D). We used the magnitude of difference in signal
between replicating and mature cells to assign Nucleosome
Stability-Destability (NSD) scores (He et al., 2010) and to rank
genomic regions. The resulting patterns, displayed in composite
plots of 1000 sites with the highest NSD scores in proliferating
(Figure 1E) and differentiated (Figure 1F) cells, underscore the
considerable genome-wide modulation of chromatin during
cell differentiation.
To identify proteins that might associate with labile regions,
we searched for TF-binding sequence motifs that are overrepre-
sented at the centers of the most differentially modified
chromatin domains (Table S1). In regions active exclusively in
proliferating cells, the most enriched motif matched the GATA
protein family (Figure 1E). Motifs enriched in chromatin that is
active mainly in differentiated cells corresponded to the tran-
scription factors HNF1, HNF4A, and CDX2 (Figure 1F; Table
S1), all of which are tissue-restricted proteins previously impli-
cated in controlling genes expressed in mature enterocytes
(Beck, 2004; D’Angelo et al., 2010; Mouchel et al., 2004; Steg-
mann et al., 2006). The selective overrepresentation of these
sequences within differentially active enhancers reinforces the
idea that NSD scores signify a regulatory function.
In vitro studies suggest that CDX2 controls intestinal genes
like SI, LCT, and CDH17 through their proximal promoters
(Fang et al., 2000; Hinoi et al., 2002; Traber and Silberg, 1996),
contributing to the idea of a ‘‘master’’ function. Indeed, Cdx2 is
required to specify embryonic intestinal epithelium in vivo (Gao
et al., 2009; Grainger et al., 2010), but in the adult intestine it is
abundantly and equally expressed in crypt progenitors and
differentiated villus cells (Silberg et al., 2000) and its function is
unknown. The enrichment of CDX2 motifs at differentiation-
associated enhancers suggested broad and distinct functions
in controlling adult intestinal differentiation through distant cis-
elements and provided fresh impetus to study its mechanisms.
CDX2 Interacts Dynamically with the Genomeof Differentiating CellsCDX2 is expressed in both crypt and villus cells (Silberg et al.,
2000) and could in principle regulate different loci in these two
contexts. To verify CDX2 binding at enhancer regions, as the
H3K4Me2 and H3K27Ac ChIP results suggested, and to deter-
mine if CDX2 interacts differently with the genome over the
course of differentiation, we used ChIP-seq to identify CDX2
evier Inc.
Proliferating Differentiated
CH3 CH3CH3
Flank FlankCenter Flank FlankCenter
H3K
4me2
Tag
Co
un
t 50
50
10 kb
CH3 CH3
Motifs enrichedat active chromatinin proliferating cells
Motifs enriched at active chromatin indifferentiated cells
Proliferating Differentiated
Proliferating Differentiated
chr 10: 116,220,000 - 116,270,000
H3K
4me2
Tag
Co
un
t
2
4
10
6
8
0 500-500
45
45
20
200 bp
chr 10: 116,249,300 - 50,300
chr 10: - 52,001,500-2,500
Proliferating
Differentiated
0 500-500
H3K
4me2
Co
mp
osi
te T
ag C
ou
nt
2
4
10
6
8
0 500-500 0 500-500
12
H3K
4me2
Co
mp
osi
te T
ag C
ou
nt
chr 5: 141,525,750 - 526,750
Proliferating > Differentiated
Proliferating < Differentiated
H3K
4me2
Tag
Co
un
t
Bit
sB
its
Bit
s
HNF4
CDX2
HNF1
t stat = 10.4
t stat = 12.6
t stat = 7.6
Bit
s
GATA t stat = 12.2
BACH1 t stat = 10.9
0 1 02
1 03
1 04
1 05
D NA S yn the sis
0
50
100
150
200
250
# C
ell
s
0 1 02
1 03
1 04
1 05
D NA S yn the sis
A
B
C
D
E
F
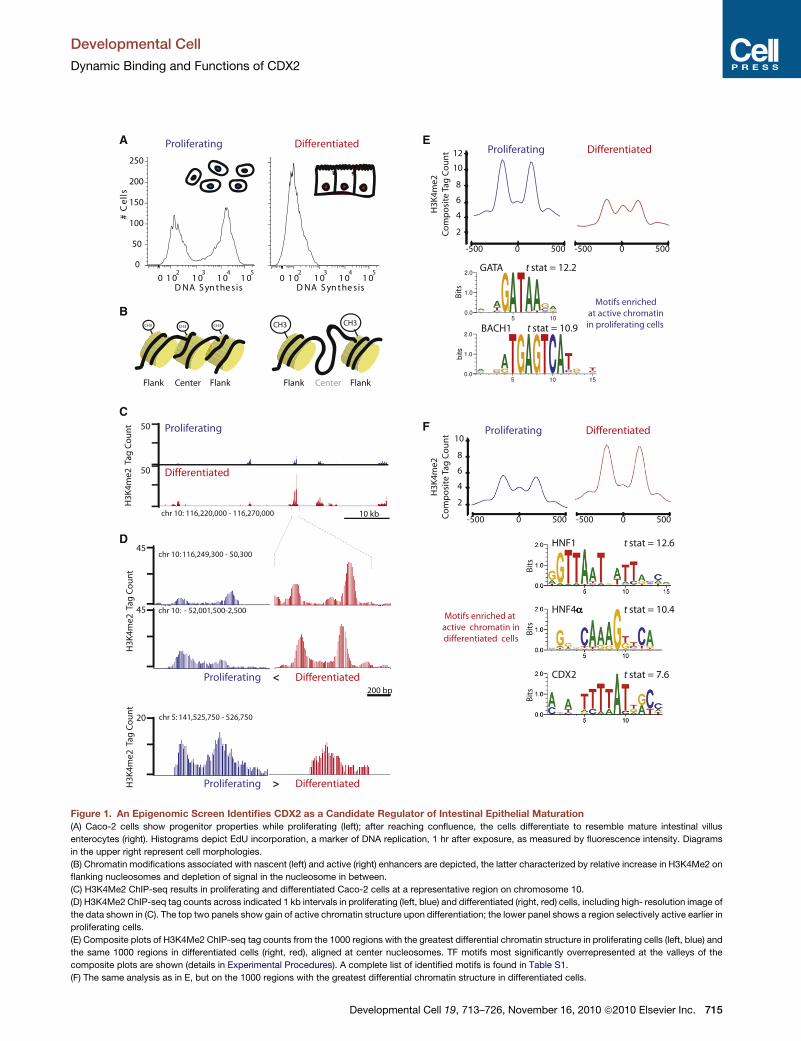
Figure 1. An Epigenomic Screen Identifies CDX2 as a Candidate Regulator of Intestinal Epithelial Maturation
(A) Caco-2 cells show progenitor properties while proliferating (left); after reaching confluence, the cells differentiate to resemble mature intestinal villus
enterocytes (right). Histograms depict EdU incorporation, a marker of DNA replication, 1 hr after exposure, as measured by fluorescence intensity. Diagrams
in the upper right represent cell morphologies.
(B) Chromatin modifications associated with nascent (left) and active (right) enhancers are depicted, the latter characterized by relative increase in H3K4Me2 on
flanking nucleosomes and depletion of signal in the nucleosome in between.
(C) H3K4Me2 ChIP-seq results in proliferating and differentiated Caco-2 cells at a representative region on chromosome 10.
(D) H3K4Me2 ChIP-seq tag counts across indicated 1 kb intervals in proliferating (left, blue) and differentiated (right, red) cells, including high- resolution image of
the data shown in (C). The top two panels show gain of active chromatin structure upon differentiation; the lower panel shows a region selectively active earlier in
proliferating cells.
(E) Composite plots of H3K4Me2 ChIP-seq tag counts from the 1000 regions with the greatest differential chromatin structure in proliferating cells (left, blue) and
the same 1000 regions in differentiated cells (right, red), aligned at center nucleosomes. TF motifs most significantly overrepresented at the valleys of the
composite plots are shown (details in Experimental Procedures). A complete list of identified motifs is found in Table S1.
(F) The same analysis as in E, but on the 1000 regions with the greatest differential chromatin structure in differentiated cells.
Developmental Cell
Dynamic Binding and Functions of CDX2
Developmental Cell 19, 713–726, November 16, 2010 ª2010 Elsevier Inc. 715

CDX2 ChIP in Differentiated Cells
CDX2 ChIP inProliferating Cells
Proliferation-Specific CDX2 Site Differentiation-Specific CDX2 Site
50
50
25
25
Seq
uen
ce T
ag C
ou
nt
CDX2 ChIP proliferating
CDX2 ChIP differentiated
1 kb40
40
20
20
digestion
lipid catabolic process
carboxylic acid metabolism
organic acid metabolism
lipid metabolism
-log p-val 10
placental development
organ development
embryonic development
tissue development
-log p-val 10
CDX2 Binding at Corresponding Genes
CDX2 Binding inProliferating Cells
CDX2 Bindingin Mature Cells
0.5
1.0
1.5
2.0
2.5
NSD score (750 paired nucleosomes/point)
No
rmal
ized
CD
X2
bin
din
g
CDX2 proliferatingCDX2 differentiated
Proliferation-activeChromatin
StaticChromatin
Differentiated-activeChromatin
chr5: 173975,000-173,985,000 chr10: 34,202,000-34,212,000
Relative Gene Expression During Differentiation
Proliferation-Specific Differentiation-Specific unchanged
0-1 1
2.40.5 1
A
B
D
C
E
Figure 2. CDX2 Interacts Dynamically with the Genome during Intestinal Cell Differentiation
(A) Venn diagram representation of binding sites identified by CDX2 ChIP-seq in proliferating and mature Caco-2 cells.
(B) Histograms of normalized CDX2 ChIP-seq tags at representative sites bound exclusively early in proliferating (left) or late in differentiated cells (right).
Additional examples appear in Figure S3.
(C) Condition-specific CDX2 binding corresponds to condition-specific active chromatin. H3K4Me2-marked putative cis-elements were ranked from most
differentially active chromatin signatures in proliferating (left) to differentiated cells (right) and plotted along the x axis in bins of 750. CDX2 occupancy
was then plotted relative to occupancy in areas where active chromatin did not vary (center). CDX2 binding sites specific to proliferating (blue triangles) or
differentiated cells (red squares) correlated with proliferating and differentiated cell-specific active chromatin, respectively.
(D) Heat maps demonstrating correlation of stage-specific CDX2 occupancy with stage-specific gene expression. Top: Early (left, blue) versus late (right, red)
genes were ranked and binned in groups of 100; genes with unaltered expression are represented in the center. The color map (blue–red) presents the scale
of log2 fold change (�1 to +1) in gene expression levels in the two stages. Bottom: The frequency of condition-specific CDX2 binding within 100 kb of each
gene expression bin is indicated by the intensity of yellow shading. Numbers below the color map correspond to the minimum, mean, and maximum ratios
(0.5, 1, and 2.4, respectively) between the average number of CDX2 binding sites within 100 kb from the genes in the same bin over the average number of binding
sites near all genes.
(E) Gene Ontology term analysis reveals that expressed genes with condition-specific CDX2 binding match functions classically attributed to differentiated (red)
or proliferating (blue) cells. Complete analysis is found in Table S2.
Developmental Cell
Dynamic Binding and Functions of CDX2
binding sites in Caco-2 cells.We detected CDX2 occupancywith
high confidence (p % 10�10) at 3122 regions in subconfluent,
proliferating cells and at 16,198 sites in terminally differentiated
cells (Figure 2A). Six hundred seventy-nine sites were unique
to proliferating cells and 13,755 were unique to differentiated
cells (examples in Figure 2B; Figure S3). CDX2-bound regions
in both states were strongly enriched for the consensus CDX2
recognition motif and showed high, centered evolutionary
conservation; most sites were far from TSSs (Figure S4), similar
to findings with other TFs (Carroll et al., 2006). Thus, although
716 Developmental Cell 19, 713–726, November 16, 2010 ª2010 Els
CDX2 binds many regions common to the two states, its occu-
pancy across the genome is surprisingly fluid, with hundreds of
distinct ‘‘early’’ binding sites specific to proliferating cells and
thousands of ‘‘late’’ sites specific to mature cells. As CDX2
protein levels increase no more than 2- to 3-fold in differentiated
cells (data not shown), changes in CDX2 binding are unlikely to
reflect only the protein concentration; furthermore, occupancy
at many early sites is selectively diminished in mature cells.
To test the significance of condition-specific CDX2 occu-
pancy, first we defined condition-specific binding rigorously,
evier Inc.
Developmental Cell
Dynamic Binding and Functions of CDX2
considering only high-stringency sites from one condition (p %
10�10) that were unoccupied in the other, even at lower
stringency (p % 10�3) (Figure S3). To determine how these high-
confidence, condition-specific CDX2 sites relate to H3K4Me2
modifications, we mapped binding sites onto the genome-wide
distribution of nucleosomes that are differentially marked in
replicatingandmatureCaco-2cells. EarlyCDX2bindingoccurred
more frequently at enhancers that carry the active chromatin
signature in proliferating cells, whereas late CDX2 binding
predominated in regions of active chromatin in mature cells (Fig-
ure 2C). CDX2 occupancy at early sites was also strongly associ-
ated with transcripts whose expression is enriched selectively in
dividing Caco-2 cells (p < 7.3e-6, Fisher’s exact test), whereas
lateCDX2binding correlatedbetter, and strongly, with transcripts
that increase in differentiated cells (p < 1.6e-23) (Figure 2D). More-
over, loci selectively occupied and expressed in dividing cells
were enriched for geneontology (GO) functions related toprogen-
itors, including embryonic, organ, and tissue development,
whereas GO terms associated with differentiated enterocytes,
such as lipid metabolism and digestion, predominated among
genes selectively occupied by CDX2 and expressed in terminally
mature cells (Figure 2E; Table S2). Thus, labile CDX2 interactions
with distant cis-elements in dividing and mature intestinal cells
have observable counterparts in differential chromatin structure
and gene expression. These results provided strong rationale to
investigate the dynamic actions of a transcriptional regulator in
the course of cell differentiation.
Cdx2 Is Required for Both Intestinal EpithelialDifferentiation and Proliferation In VivoWhereas knockout mice have revealed Cdx2 functions in spec-
ifying fetal intestinal epithelium (Gao et al., 2009), its roles in the
adult organ remain untested in vivo. To circumvent neonatal
lethality associated with embryonic Cdx2 deficiency, we gener-
ated a new conditional null allele,Cdx2fV, with LoxP sites flanking
exon 2 (Figure S5A–S5F), and crossed targeted mice with the
intestine-specific, tamoxifen-inducible Cre recombinase-
expressing transgenic strain Villin-CreER(T2) (el Marjou et al.,
2004). Tamoxifen-treated adult Cdx2fV/fV;Villin-CreER(T2) mice
showed loss of Cdx2 protein in >99% of small intestine villi
and absence of Cdx2 mRNA (Figures 3A and 3B; Figures S5G
and S5H); expression of putative Cdx2 target genes, Sucrase
Isomaltase and Intestine Specific Homeobox (Choi et al., 2006;
Traber and Silberg, 1996), was profoundly reduced (Figure 3B).
These mice developed chronic diarrhea, rapidly lost weight (Fig-
ure 3C), and became moribund, requiring humane euthanasia
within 21 days. At necropsy they uniformly showed small intes-
tine dilation and a dilated, fluid-filled cecum (Figure 3D). Tissue
architecture was overtly preserved in Cdx2fV/fV;Villin-CreER(T2)
intestines (Figures 3A and 3E). However, alkaline phosphatase
activity was notably reduced along a proximal-distal gradient
in mutant small bowel compared to tamoxifen-treated sibling
controls (Figure 3F), indicating enterocyte immaturity; enzyme
activity was lowest in the ileum, where Cdx2 levels are the
highest in wild-type mice (Silberg et al., 2000). The numbers of
periodic acid Schiff-stained goblet (increased 2.1%) (Figure 3G),
lysozyme+ Paneth (unchanged, Figure 3H) and ChromograninA+
endocrine cells (decreased by 40%, p = 0.0895, Figure 3I) were
altered subtly or not at all.
Developme
Although cell state-specific profiles in Caco-2 cells revealed
distinct CDX2-occupied sites in proliferating and mature cells
(Figure 2A), the defects in adult Cdx2fV/fV;Villin-CreER(T2) intes-
tines seemed confined to villus enterocytes. Crypt progenitors
were also overtly normal and measures of cell proliferation,
expression of Ki67 or Proliferating Cell Nuclear Antigen (Pcna),
were intact (Figure 3J). Because Cdx1, a homologous factor
normally expressed in crypt progenitors (Silberg et al., 2000;
Subramanian et al., 1998) and present in tamoxifen-exposed
mutant intestines (Figure 3B), might compensate for Cdx2 loss
in dividing cells, we crossedmice carrying the conditionalCdx2fV
allele with Cdx1�/� mice, which have skeletal but no intestinal
defects (Subramanian et al., 1995). Tamoxifen-treated
Cdx1�/�;Cdx2fV/fV;Villin-CreER(T2) mice became markedly sicker
thanmice lacking onlyCdx2 and survived fewer than 8 days after
the first dose of hormone. Villi were stunted compared to single
mutant littermates and the proliferation markers Ki67 and Pcna
were expressed in significantly fewer crypt cells (Figure 3J),
revealing a redundant requirement for Cdx proteins in adult gut
epithelial cell proliferation.
Consistent with the histologic analysis, mRNA profiling of
isolated Cdx2fV/fV;Villin-CreER(T2) jejunal epithelium revealed
lower levels of 991 transcripts (dChip analysis [Li and Wong,
2001], p < 0.01) and gene ontology term analysis of affected
genes pointed overwhelmingly to mature enterocyte functions,
including solute transport and lipid and organic acid metabolism
(Figure 4A). Death from starvation and diarrhea in the face of
overtly intact intestinal villus structure is best explained by
malabsorption. Indeed, enterocyte products required for terminal
digestion and nutrient absorption were prominent among tran-
scripts that drop after tamoxifen treatment (Table S3). Represen-
tative examples such as Dpp4, Lipe, and Abca1 showed lower
expression throughout the small intestine (Figure 4B). Thus, in
agreement with the functions suggested by CDX2 occupancy in
differentiated Caco-2 cells (Figure 2E), Cdx2 is necessary for
survival of adult mice and its absence profoundly affects gene
expression in mature enterocytes. Moreover, genes affected by
Cdx2 loss in mice are enriched in CDX2 occupancy near their
human orthologs in differentiated Caco-2 cells, as shown in
a representative example (Figure 4C) and whole-genome anal-
ysis (Figure 4D). These data further justify the use of Caco-2 cells
to study gut epithelial differentiation and indicate conservation of
Cdx2 function across species.
Cdx2 Is Required for the Chromatin ConfigurationAssociated with Active EnhancersThe in vivo requirement for Cdx2 in differentiated and prolifer-
ating cells provides a strong functional correlate for the distinc-
tive site occupancy in different cell states. To investigate Cdx2
requirements in gene regulation, we examined its role in chro-
matin structure. We and others define active enhancers as distal
chromatin elements carrying two strongly positioned, H3K4Me2-
marked nucleosomes around a central region with destabilized
or absent nucleosomes (Figure 1B). This designation facilitated
genome-wide mapping of condition-sensitive epigenomic
marks and triggered elucidation of CDX2 requirements in vivo.
To determine if Cdx2 is necessary for the active chromatin
configuration in differentiated mouse intestinal epithelium, we
studied the consequence of its absence in tamoxifen-treated
ntal Cell 19, 713–726, November 16, 2010 ª2010 Elsevier Inc. 717
Sibling Control
+Cdx2
fV/fV ; Cre Sibling Control
CD
X2
Imm
un
ost
ain
Cdx2 Sis IsxCdx1
Actin
0.0
0.5
1.0
1.5
2.0
2.5
Rela
tive
Tra
nscr
ipt
Leve
lsKO
/con
trol
s
+Cdx2
fV/fV ; Cre
-5 0 5 10 1570
80
90
100
110
120
KO
Control
Days after Tamoxifen induction
% S
tart
ing
bod
ywei
gh
t
+Cdx2
fV/fV ; CreCdx1 ;
-/- Cdx2
fV/fV Cdx1 ;
-/-
PCN
A I
mm
un
ost
ain
+Cdx2
fV/fV ; CreCdx1 ;
-/- +Cdx2
fV/fV ; CreCdx1 ;
+/+
Ki6
7 Im
mu
no
stai
n
0.0
0.2
0.4
0.6
0.8
1.0
Frac
tion
of K
i67
cry
pt
cells
+C
dx2
fV/f
V ; C
reSi
blin
g C
on
tro
lDuodenum Jejunum Ileum
+Cdx2
fV/fV ; CreSibling Control
Sibling Control+
Cdx2 fV/fV
; Cre
+Cdx2
fV/fV ; CreSibling Control
+Cdx2
fV/fV ; CreSibling Control
Lyso
zym
e Im
mu
no
stai
n
Ch
rg A
Im
mu
no
stai
n
Peri
od
ic a
cid
-Sch
iff
+
SiblingControls Cdx2
fV/fV
+ Cre
Cdx2 fV/fV
Cdx1 -/-
+ Cre
A B C
D E F
G H I
J
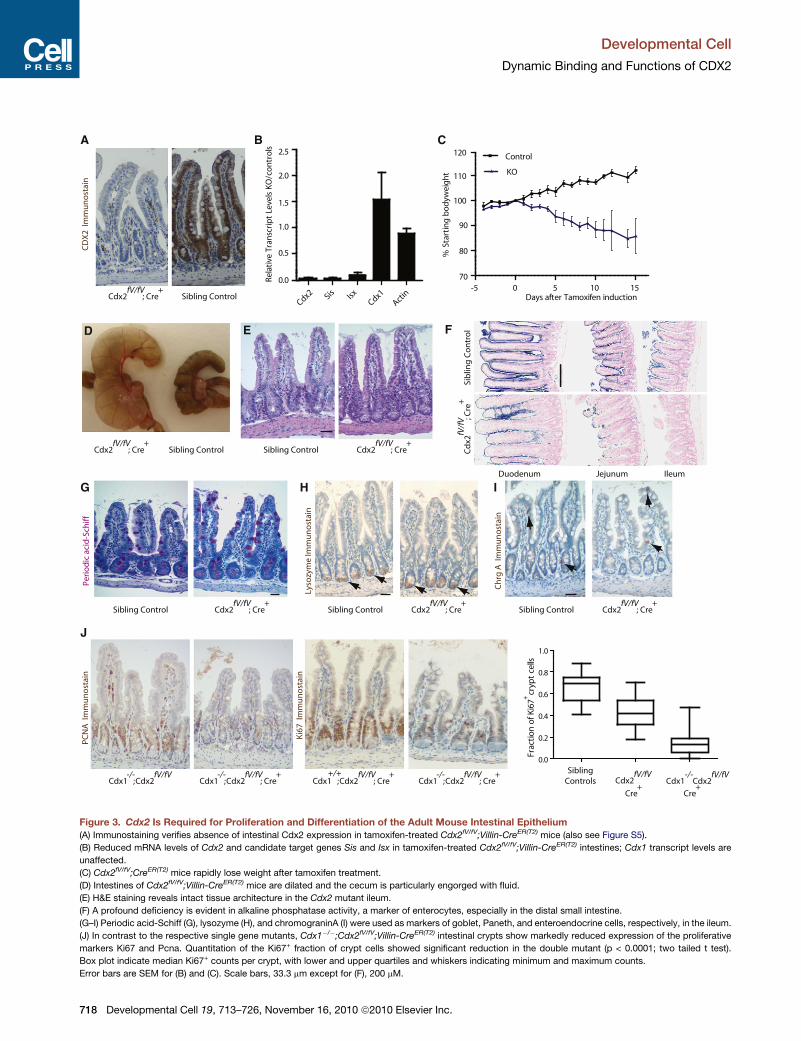
Figure 3. Cdx2 Is Required for Proliferation and Differentiation of the Adult Mouse Intestinal Epithelium
(A) Immunostaining verifies absence of intestinal Cdx2 expression in tamoxifen-treated Cdx2fV/fV;Villin-CreER(T2) mice (also see Figure S5).
(B) Reduced mRNA levels of Cdx2 and candidate target genes Sis and Isx in tamoxifen-treated Cdx2fV/fV;Villin-CreER(T2) intestines; Cdx1 transcript levels are
unaffected.
(C) Cdx2fV/fV;CreER(T2) mice rapidly lose weight after tamoxifen treatment.
(D) Intestines of Cdx2fV/fV;Villin-CreER(T2) mice are dilated and the cecum is particularly engorged with fluid.
(E) H&E staining reveals intact tissue architecture in the Cdx2 mutant ileum.
(F) A profound deficiency is evident in alkaline phosphatase activity, a marker of enterocytes, especially in the distal small intestine.
(G–I) Periodic acid-Schiff (G), lysozyme (H), and chromograninA (I) were used as markers of goblet, Paneth, and enteroendocrine cells, respectively, in the ileum.
(J) In contrast to the respective single gene mutants, Cdx1�/�;Cdx2fV/fV;Villin-CreER(T2) intestinal crypts show markedly reduced expression of the proliferative
markers Ki67 and Pcna. Quantitation of the Ki67+ fraction of crypt cells showed significant reduction in the double mutant (p < 0.0001; two tailed t test).
Box plot indicate median Ki67+ counts per crypt, with lower and upper quartiles and whiskers indicating minimum and maximum counts.
Error bars are SEM for (B) and (C). Scale bars, 33.3 mm except for (F), 200 mM.
Developmental Cell
Dynamic Binding and Functions of CDX2
718 Developmental Cell 19, 713–726, November 16, 2010 ª2010 Elsevier Inc.

Developmental Cell
Dynamic Binding and Functions of CDX2
Cdx2fV/fV;Villin-CreER(T2) mouse villi. We used MNase digestion
followed by quantitative real-time PCR to interrogate CDX2-
bound regions located near genes that are dysregulated in the
mutant mice. We designed oligonucleotide primers to detect
nucleosome-protected DNA at representative CDX2-binding
sites near differentiation-associated genes and both flanking
nucleosomes. Villus cells isolated from tamoxifen-treated sibling
control mice gave the pattern predicted for active nucleosome
positioning at all nine tested regions (Figure 4E and data not
shown). This active nucleosome signature was not apparent at
five of the nine regions in Cdx2-depleted villus cells, which
showed relatively higher MNase sensitivity at flanking nucleo-
somes and greater protection in the center. This labile, Cdx2-
dependent pattern most likely reflects displacement of a center
nucleosome when Cdx2 is available and its reappearance when
Cdx2 is absent. Our results thus indicate that Cdx2 is necessary
to produce or maintain key chromatin modifications at loci asso-
ciated with mature intestinal epithelium, an activity that may
account for its control over a large number of genes required
for intestinal function.
CDX2 Partners with Different Transcription Factorsin Different Cell StatesThe demonstration of distinct CDX2 binding sites and functions
in intestinal progenitors and mature cells suggested the possi-
bility of distinct classes of regulatory cis-elements. To address
the particular possibility of condition-specific partnership with
other TFs, we searched CDX2-occupied regions in the two
different cell states for other consensus sequence motifs. At
early CDX2-occupied regions, the SeqPos motif analysis tool
(Lupien et al., 2008) detected significant overrepresentation of
GATA binding sites (Figure 5A); thus, in dividing cells GATA
sequences preferentially abound not only in chromatin with
an active enhancer configuration (Figure 1E) but also very close
to CDX2-occupied sites. In contrast, CDX2-occupied regions
specific to differentiated cells showed notable enrichment of
a canonical HNF4A motif, the same sequence that is enriched
among enhancers activated in mature Caco-2 cells (Figure 1F)
but not among early CDX2 sites (Figure 5A). Adding credence
to these results, the FOXA motif, matching a factor previously
implicated in regulating endoderm-derived tissues (Sekiya
et al., 2009; Zaret, 1999), was overrepresented at CDX2 sites
in both dividing and differentiated cells, whereas Wnt-respon-
sive TCF/LEF motifs, associated with intestinal cell proliferation
(Clevers, 2006), were enriched selectively at early CDX2 sites
(Verzi et al., 2010). Mirroring the sequence motif enrichments,
GATA6 mRNA levels decline with Caco-2 cell differentiation,
as do those of the proliferation marker MYC; as noted previ-
ously (Soutoglou and Talianidis, 2002), HNF4A transcripts
and the representative differentiation marker CDH17 increase
markedly over the same period (Figure 5B). Thus, CDX2 may
partner with specific TFs in different cellular states, in partic-
ular, with a GATA protein early on and with HNF4A in differen-
tiated cells.
To test this possibility, we conducted ChIP-seq analysis for
GATA6 and HNF4A in mature and proliferating Caco-2 cells. In
agreement with the motif search results, we identified 10,594
GATA6 binding sites (p % 10�10) in dividing cells and fewer
than 500 sites in differentiated cells (Figure 5C). Conversely,
Developme
HNF4A bound more than twice as many sites in mature cells
than in the proliferative phase (Figure 5D) (28,187 versus
12,119 sites, p % 10�10). Regions occupied by GATA6 and
HNF4A were highly conserved across species (Figure S6) and
showed substantial enrichment of the expected sequence
motifs (Figures 5C and 5D). Because CDX2 binding to DNA in
replicating and mature Caco-2 cells correlates with active chro-
matin in the respective cell states (Figure 2C), we asked if binding
of these candidate partners is also associatedwith the chromatin
state. Indeed, GATA6 preferentially occupies sites that carry the
active-enhancer mark in proliferating but not in differentiated
cells, whereas HNF4A binding shows a marked preference for
chromatin that is selectively active in mature cells (Figure 5E).
Thus, although GATA6 occupancy is more state-selective than
HNF4A binding, histone H3 modifications are tightly coupled to
experimentally determined binding of all three proteins and our
results identify putative coregulatory complexes for CDX2
function. Corroborating the existence of such complexes, immu-
noprecipitation of CDX2 from Caco-2 nuclear extracts revealed
association with GATA6 and HNF4A (Figure 5F). These associa-
tions were not intrinsically cell state-specific, probably reflecting
interactions at constitutively occupied regions (represented in
the intersection set in Figure 2A).
Importantly, in analysis of empirical binding, CDX2-binding
sites specific to dividing cells were more likely to be identified
as GATA6-binding sites in ChIP-seq on dividing cells, whereas
CDX2-binding sites in differentiated cells were more likely to
be identified as HNF4A binding sites in ChIP-seq on differenti-
ated cells. Individual examples of this duality are illustrated in
Figure 6A and Figure S7. Furthermore, CDX2 and its condition-
specific partners typically occupy DNA within at most a few
hundred base pairs of each other (Figure 6B), suggesting they
target the same regulatory elements. These relationships are
reflected well in heat maps for genome-wide binding of each
factor in relation to CDX2 occupancy (Figure 6C). These data
collectively indicate that CDX2 interacts with intestinal DNA in
state-specific pairings with GATA6 and HNF4A at regions of
differentially modified chromatin.
DISCUSSION
Progenitor cells and their mature progeny elicit substantially
different properties from genomes that are usually identical.
Analysis of gene knockouts in vivo and lineage-specific cis-
elements in vitro support the idea that key regulatory TFs partic-
ipate materially in differentiation, using mechanisms that are
diverse and incompletely understood. Our identification of the
CDX2 recognition motif at enhancers active in differentiated
Caco-2 cells prompted detailed investigation of a TF whose
highly restricted tissue expression, activity at intestine-specific
gene promoters in vitro, and embryonic requirement encompass
the properties of a ‘‘master regulator’’ (Beck, 2004; Gao et al.,
2009). Findings in Cdx2 null mice support this designation in
the adult intestine and reveal its requirement for cellular func-
tions, gene expression, and active enhancer chromatin in
distinct states. We also present evidence for dynamic CDX2
associations in a regenerative tissue, including labile interactions
with chromatin and other TFs that correlate strongly with gene
expression in dividing and mature cells (Figure 7). The sum of
ntal Cell 19, 713–726, November 16, 2010 ª2010 Elsevier Inc. 719

left rightcenter
L C R
C ontrol
K O
L C R
Rela
tive
MN
ase
Prot
ecti
on
left rightcenter
L C R
Sema6a (3.39x )Isx (60x )Sis (106x )
0
2
4
6
8
10
0
2
4
6
8
10
0
5
10
15
0
2
4
6
8
10
0
5
10
15
20
0
5
10
15
20
0
2
4
6
8
0
2
4
6
8
Synpo (2.68x )
Rela
tive
MN
ase
Prot
ecti
on
L C R L C R L C R
0
2
3
4
5
1
0
2
3
4
5
1
L C R
NR3C1 (1.3x )
CDX2 Binding atCorresponding Human Genes
Gene Expressionin Cdx2 knockout
Reduced Transcripts Unchanged
-0.5 0
2.40.5 1
More Binding Less Binding
DPP4
0
60
0
60
chr2:162,570kb -162,640kb
Ch
IP-s
eq T
ag C
ou
nt
CDX2 ChIP proliferating
CDX2 ChIP differentiated
6 4 2 0
lipid metabolic process
cation transport
localization
organic acid metabolism
carboxylic acid metabolism
sodium ion transport
-log p-value10
Rela
tive
Tra
nscr
ipt
Leve
ls
Duodenum Jejunum IleumA B
C
E
D
Figure 4. Cdx2 Is Required for Active Chromatin Structure In Vivo
(A) Gene Ontology terms associated with mature intestinal functions are notably enriched among transcripts reduced in Cdx2fV/fV;Villin-CreER(T2)
intestinal mucosa.
(B and C) (B) Examples of terminal digestive enzyme transcripts reduced in Cdx2 null duodenum, jejunum, and ileum and (C) a representative example of binding
data from Caco-2 cells showing differentiated cell-specific CDX2 occupancy (arrow).
(D) Top: Transcripts reduced or unchanged in Cdx2fV/fV;Villin-CreER(T2) mice were detected in triplicate samples and grouped into bins of 100 by a ratio relative
to controls (�0.5 to 0). Bottom: Differentiated cell-specific CDX2 binding frequency within 100 kb of the corresponding orthologs in Caco-2 cells, indicated by
intensity of yellow shading (a range of 0.5–2.4, similar to Figure 2D). Binding is observed more frequently near loci with reduced expression, suggesting direct
regulation of many targets and interspecies conservation.
(E) To determine the consequence of Cdx2 deletion on chromatin structure, oligonucleotides were designed to query the left, center, and right nucleosomes
by PCR in MNase protection assays at nine CDX2-bound putative enhancers in control and tamoxifen-treated Cdx2fV/fV;Villin-CreER(T2) (KO) adult mice.
MNase-protected DNA is shown relative to the central nucleosome at each region. In villi depleted of Cdx2, MNase protection was relatively enhanced at
center nucleosomes, consistent with reappearance of nucleosomes and loss of active enhancer chromatin. Five of the nine tested regions gave this pattern;
Developmental Cell
Dynamic Binding and Functions of CDX2
720 Developmental Cell 19, 713–726, November 16, 2010 ª2010 Elsevier Inc.

Developmental Cell
Dynamic Binding and Functions of CDX2
these results provides a comprehensive view of the actions and
mechanisms of a critical lineage-specific TF.
Dual activity in progenitor and differentiated cells is a feature
of several lineage-restricted TFs. For example, Pu.1 functions
in blood progenitor commitment and proliferation as well as
terminal macrophage differentiation (DeKoter et al., 1998),
much as MITF does in melanocyte proliferation, survival, and
maturation (McGill et al., 2002). In development, the worm
FoxA homolog PHA4 functions throughout pharynx formation,
as do Pax6 and its homologs in the metazoan eye (Ashery-Pa-
dan and Gruss, 2001). Even in the face of such examples, it is
unclear if these factors directly control tissue-specific genes
throughout a cell’s ontogeny, if their genome associations are
stable across cellular transitions, and if Cdx20s distinct activities
in dividing and differentiated cells reflect a general property of
lineage-determining TFs. The muscle regulator MyoD, for
example, functions in both myoblast progenitors and mature
myotubes, and its binding to DNA was recently reported to
vary little during differentiation (Cao et al., 2010). In contrast,
redistribution of CDX2 during intestinal cell maturation exposes
diversity among mechanisms of key TFs. Investigation of other
regulators, ideally coupled with delineation of chromatin modifi-
cations, will resolve whether their associations with DNA are
largely invariant, as reported for MyoD, or dynamic, as we
observe with CDX2.
In C. elegans pharynx development, PHA4 controls early and
late genes by binding unique target sites with different affinities.
Early genes contain high-affinity sites and bind first; late targets
carry sites with distinct sequences and lower affinity, and
engage only after PHA4 levels increase late in development
(Gaudet and Mango, 2002). CDX2 levels change little during
intestinal differentiation and the consensus CDX2 motifs we
identified in different conditions are almost identical (Figure S4),
indicating a limited role for primary DNA sequence or TF
concentrations in directing occupancy. Hence, posttranslational
modifications, alternative partners, chromatin structure, or a
combination of these factors, likely underlie CDX2’s cell state-
specific complexes. Known posttranslational alterations of
CDX2 do not affect DNA affinity in vitro (Gross et al., 2005; Rings
et al., 2001) but could in principle affect alternative complexes.
Biochemical analysis of modifications on CDX2 and its partner
proteins might advance understanding of the mechanisms
underlying nucleosome lability at target enhancers. In identifying
GATA6 and HNF4A as state-specific CDX2 partners at differen-
tially modified regions of chromatin, we take an important step
toward characterizing tissue-restricted TFs that produce or
interact with altered chromatin states to enable intestinal cell
differentiation. Future work might determine if the factors are
codependent or restructure chromatin in an ordered hierarchy;
understanding these mechanisms will help define the networks
that control intestinal cell transitions (Davidson and Levine,
2008). Although findings in mutant mice corroborate our conclu-
sions, the bulk of the present analysis was conducted in a tumor
cell line that replicates the distinction between progenitor and
differentiated states only partially. Primary intestinal crypt and
four examples are shown. Results are depicted schematically on the right, togethe
in KO mice. Reductions in transcript levels for each gene in the Cdx2-depleted t
Developme
villus cells would provide a physiologic model to test these
ideas.
Studies in cancer cell lines paradoxically implicate CDX2 as
both an oncogene and a tumor suppressor (Aoki et al., 2003;
Guo et al., 2004); context-dependent CDX2 occupancy and
function may account for distinct roles in cell proliferation and
differentiation and help explain the discrepancy. Contextual
genome occupancy and cooperation with other TFs might
also underlie CDX2 requirements in embryonic axial patterning
and trophectoderm formation. Indeed, CDX2 binding in the
corresponding tissues suggests remarkable diversity in target
loci (data not shown), underscoring the idea that TF activities
are strongly influenced by cellular context. Another TF with
many target genes, PPARG, was recently shown to utilize
different binding sites and partners in two cell types, adipocytes
and macrophages (Lefterova et al., 2010).
The continually renewing gut epithelium, a frequent target
of malignant transformation, is an ideal model system to study
transcriptional mechanisms of differentiation. Our integrated
approach toward genome-wide chromatin analysis, TF binding,
and mRNA expression can also be extended to uncover mecha-
nisms of lineage-specific gene regulation in other tissues.
EXPERIMENTAL PROCEDURES
Nucleosome-Resolution ChIP and Identification
of Mononucleosomes
Cells were collected from Caco-2 cultures or mouse intestinal villi and
resuspended in a digestion buffer (50 mM Tris-HCl [pH 7.6], 1 mM CaCl2,
0.2% Triton X-100, 5 mM Na butyrate, complete protease inhibitors) and
treated with 0.2 U micrococcal nuclease (MNase, Sigma Aldrich) for 8 min at
37�C. The reaction was terminated by adding 5 mM EDTA in 10 mM Tris
(pH 7.6), and samples were dialyzed in chromatin RIPA buffer (10 mM Tris
[pH 7.6], 1 mM EDTA, 0.1% SDS, 0.1% Na deoxycholate, 1% Triton X-100)
before overnight IP at 4�C with Histone H3K27Ac (Abcam ab4729) or
H3K4Me2 (Millipore 07-030) antibodies. IPmaterial was subsequently handled
as described below for conventional ChIP of sonicated genomic DNA. Mono-
nucleosomes carrying H3K4Me2 or H3K27Ac marks were identified using
Nucleosome Positioning from Sequencing (NPS) with default parameters
(Zhang et al., 2008b), as described (Supplemental Experimental Procedures).
Detection of State-Specific Open Chromatin Structures
and Identification of Transcription Factor Motifs
NPS was used to identify mononucleosomes with H3K4Me2. Two adjacent
nucleosomes were declared a pair if the distance between their center
locations was between 250 and 400 nucleotides. For each nucleosome pair,
relative depletion of a nucleosome in the internucleosomal region in one state
against the other was estimated using the Nucleosome Stability-Destability
(NSD) scoring scheme defined previously (He et al., 2010). In this context,
the NSD score of a nucleosome pair indicates the degree of differential chro-
matin structure between proliferating andmature intestinal cells by quantifying
the relative change in nucleosome signal between cell states. Thus, nucleo-
some pairs with larger NSD scores can be interpreted to represent genomic
regions more open to TF binding in one cell state compared to static regions
(i.e., regions with NSD scores �0). Conversely, negative NSD scores corre-
spond to open chromatin structure in the other state (Table S1). A hierarchical
mixture model was used to search for DNA motifs enriched at the center of
nucleosome pairs (the region of depleted signal corresponding to the middle
nucleosome). Enrichment of each motif represented in the TRANSFAC data-
base was weighed by the NSD score distribution of other regions with similar
r with one example where nucleosome protection was not significantly affected
issue are indicated. All error bars are SEM.
ntal Cell 19, 713–726, November 16, 2010 ª2010 Elsevier Inc. 721

GATA
TCF/LEF
FOXA
HNF4Ap< 2.9e - 4.6e-5 -33
p< 2.3e - 4.7e-3 -5
p< 9.7e - 3.1e-3 -6
p< 1.7e - 2.0e-26 -141
p< 1.9e - 1.2e-9 -91
p< 4.5e - 1.2e-55 -130
FOXA
AP-1
Motifs enriched near Proliferation -Specific CDX2 sites
Motifs enriched nearDifferentiation-specific CDX2 sites
GATA6ChIP-seq
Differentiated Proliferating
HNF4AChIP-seq
Proliferating Differentiated
CDX2
HNF4A
CDH17
GATA6M
YC0
2
4
6
8 P roliferating
D ifferentiated
Rela
tive
tra
nscr
ipt
leve
ls
Bit
sB
its
Bit
s
Bit
sB
its
Bit
s
0.8
1.0
1.2
1.4
HNF4 proliferatingHNF4 differentiated
0.6
0.8
1.0
1.2
1.4
1.6
No
rmal
ized
GA
TA6
Bin
din
g
GATA6 proliferatingGATA6 differentiated
NSD score (750 paired nucleosomes/point)
Proliferating-activeChromatin
StaticChromatin
Differentiated-activeChromatin
No
rmal
ized
HN
F4A
Bin
din
g
HNF4A
CDX2
1% I
NPU
TIgG IP IgG IP
Proliferating Mature
IP Ab IB Ab
GATA6
GATA-6
HNF4A
CDX2
CDX2
CDX2
CDX2
F
A E
B
C
D
Figure 5. Differential Occupancy of Proliferating and Differentiated Intestinal Cell Genomes by GATA6 and HNF4A
(A) DNA motif analysis at condition-specific CDX2-binding regions shows, in addition to CDX2 motifs, substantial enrichment of GATA motifs in proliferating (left)
and of HNF4A motifs in differentiated cells (right).
(B) Over the course of Caco-2 differentiation,HNF4A transcript levels increase andGATA6 levels decrease; knownmarkers of maturation (CDH17) or proliferation
(MYC) increase or decrease, respectively, as expected. Error bars are SEM.
(C and D) ChIP-seq for GATA6 and HNF4A in proliferating (blue) and differentiated (red) cells reveals differences in preferred binding contexts. Venn diagrams
indicate the number of sites bound uniquely in proliferating or differentiated cells (p < 1e-10). HNF4A binding sites are more numerous later in differentiation,
whereas GATA6 binds predominantly early in proliferating cells. For each occupancy dataset, the most enriched de novo binding motif is indicated (all within
the statistical limit of p < 1e-30) and each is similar to empirically defined TRANSFAC motifs (as shown in Figure 3A). Identified binding regions were highly
conserved and mainly found far from promoters (Figure S6).
(E) As in Figure 2C, TF occupancy at regions of differentially active chromatin is compared to binding frequency at static chromatin regions. Top, GATA6 binding is
better associated with the active H3K4Me2 pattern in proliferating than in differentiated cells, whereas HNF4A occupancy (bottom) correlates better with active
H3K4Me2 in differentiated cells.
(F) GATA6 and HNF4A coimmunoprecipitate with CDX2, but not with IgG controls, indicating their presence in CDX2 complexes.
Developmental Cell
Dynamic Binding and Functions of CDX2
722 Developmental Cell 19, 713–726, November 16, 2010 ª2010 Elsevier Inc.
Diff
.
P
rolif
.H
NF4
AD
iff.
Pro
lif.
GAT
A6
GATA6 ChIP
CDX2 ChIP
HNF4A ChIP
Proliferating
Differentiated
Proliferating
Differentiated
Proliferating
Differentiated
Differentiation-specificCDX2 sites
Proliferation-specificCDX2 sites
Diff
.
P
rolif
.C
DX
2
-4 12
Diff
.
P
rolif
.H
3K4m
e2
chr10: 29,014,000-29,020,000 chr10: 116,246,000-116,252,000
Proliferation-specific CDX2 site Differentiation-specific CDX2 site
020
4060
8010
0
Distance between binding sites (bp)
% O
verl
app
ing
sit
es
70.5%
29.5%
65%
35%
OverlapNon−overlap
22.5%
77.5%
92.5%
7.5%
0 500 1000 1500 2000
CDX2 prolif and GATA6 prolifCDX2 prolif and HNF4A diffCDX2 diff and GATA6 prolifCDX2 diff and HNFA diff
29.5%
A
B
C
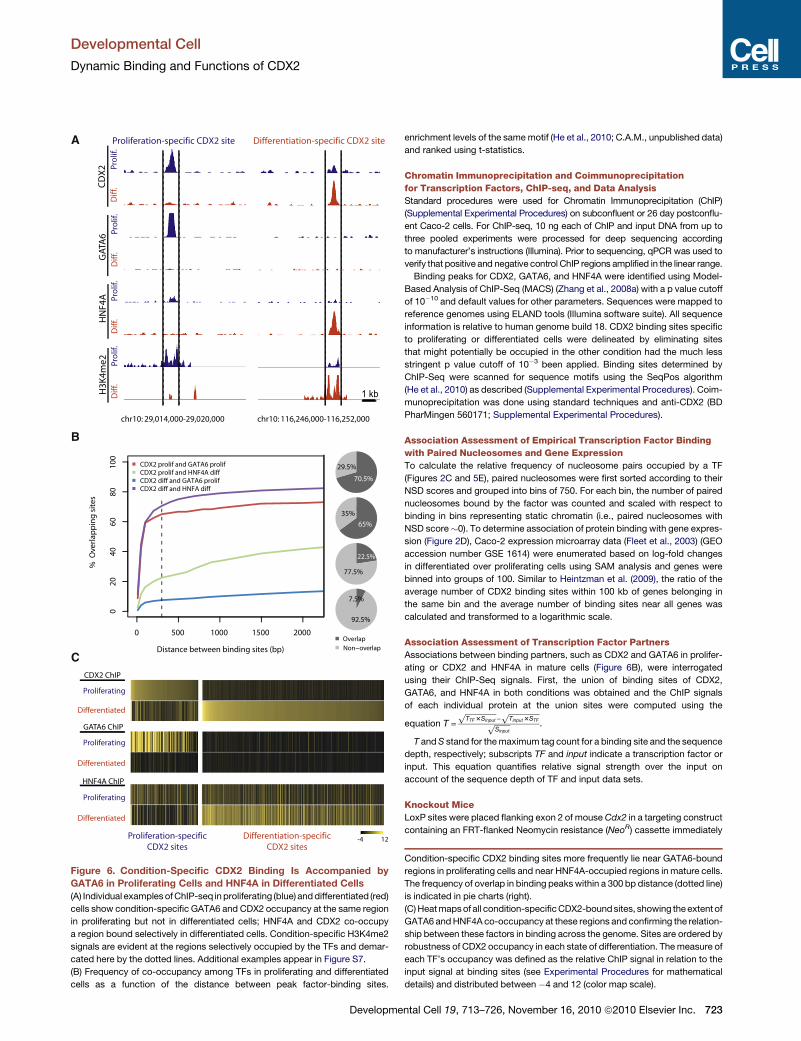
Figure 6. Condition-Specific CDX2 Binding Is Accompanied by
GATA6 in Proliferating Cells and HNF4A in Differentiated Cells
(A) Individual examples ofChIP-seq inproliferating (blue) anddifferentiated (red)
cells show condition-specific GATA6 and CDX2 occupancy at the same region
in proliferating but not in differentiated cells; HNF4A and CDX2 co-occupy
a region bound selectively in differentiated cells. Condition-specific H3K4me2
signals are evident at the regions selectively occupied by the TFs and demar-
cated here by the dotted lines. Additional examples appear in Figure S7.
(B) Frequency of co-occupancy among TFs in proliferating and differentiated
cells as a function of the distance between peak factor-binding sites.
Developmental Cell
Dynamic Binding and Functions of CDX2
Developme
enrichment levels of the samemotif (He et al., 2010; C.A.M., unpublished data)
and ranked using t-statistics.
Chromatin Immunoprecipitation and Coimmunoprecipitation
for Transcription Factors, ChIP-seq, and Data Analysis
Standard procedures were used for Chromatin Immunoprecipitation (ChIP)
(Supplemental Experimental Procedures) on subconfluent or 26 day postconflu-
ent Caco-2 cells. For ChIP-seq, 10 ng each of ChIP and input DNA from up to
three pooled experiments were processed for deep sequencing according
to manufacturer’s instructions (Illumina). Prior to sequencing, qPCR was used to
verify that positive and negative control ChIP regions amplified in the linear range.
Binding peaks for CDX2, GATA6, and HNF4A were identified using Model-
Based Analysis of ChIP-Seq (MACS) (Zhang et al., 2008a) with a p value cutoff
of 10�10 and default values for other parameters. Sequences were mapped to
reference genomes using ELAND tools (Illumina software suite). All sequence
information is relative to human genome build 18. CDX2 binding sites specific
to proliferating or differentiated cells were delineated by eliminating sites
that might potentially be occupied in the other condition had the much less
stringent p value cutoff of 10�3 been applied. Binding sites determined by
ChIP-Seq were scanned for sequence motifs using the SeqPos algorithm
(He et al., 2010) as described (Supplemental Experimental Procedures). Coim-
munoprecipitation was done using standard techniques and anti-CDX2 (BD
PharMingen 560171; Supplemental Experimental Procedures).
Association Assessment of Empirical Transcription Factor Binding
with Paired Nucleosomes and Gene Expression
To calculate the relative frequency of nucleosome pairs occupied by a TF
(Figures 2C and 5E), paired nucleosomes were first sorted according to their
NSD scores and grouped into bins of 750. For each bin, the number of paired
nucleosomes bound by the factor was counted and scaled with respect to
binding in bins representing static chromatin (i.e., paired nucleosomes with
NSD score�0). To determine association of protein binding with gene expres-
sion (Figure 2D), Caco-2 expression microarray data (Fleet et al., 2003) (GEO
accession number GSE 1614) were enumerated based on log-fold changes
in differentiated over proliferating cells using SAM analysis and genes were
binned into groups of 100. Similar to Heintzman et al. (2009), the ratio of the
average number of CDX2 binding sites within 100 kb of genes belonging in
the same bin and the average number of binding sites near all genes was
calculated and transformed to a logarithmic scale.
Association Assessment of Transcription Factor Partners
Associations between binding partners, such as CDX2 and GATA6 in prolifer-
ating or CDX2 and HNF4A in mature cells (Figure 6B), were interrogated
using their ChIP-Seq signals. First, the union of binding sites of CDX2,
GATA6, and HNF4A in both conditions was obtained and the ChIP signals
of each individual protein at the union sites were computed using the
equation T =
ffiffiffiffiffiffiffiffiffiffiffiffiffiffiffiffi
TTF3Sinput
p�
ffiffiffiffiffiffiffiffiffiffiffiffiffiffiffiffi
Tinput3STF
pffiffiffiffiffiffiffiffi
Sinput
p .
T andS stand for themaximum tag count for a binding site and the sequence
depth, respectively; subscripts TF and input indicate a transcription factor or
input. This equation quantifies relative signal strength over the input on
account of the sequence depth of TF and input data sets.
Knockout Mice
LoxP sites were placed flanking exon 2 of mouse Cdx2 in a targeting construct
containing an FRT-flanked Neomycin resistance (NeoR) cassette immediately
Condition-specific CDX2 binding sites more frequently lie near GATA6-bound
regions in proliferating cells and near HNF4A-occupied regions in mature cells.
The frequency of overlap in binding peakswithin a 300 bp distance (dotted line)
is indicated in pie charts (right).
(C)Heatmapsof all condition-specificCDX2-boundsites, showing theextent of
GATA6 andHNF4A co-occupancy at these regions and confirming the relation-
ship between these factors in binding across the genome. Sites are ordered by
robustness of CDX2 occupancy in each state of differentiation. Themeasure of
each TF’s occupancy was defined as the relative ChIP signal in relation to the
input signal at binding sites (see Experimental Procedures for mathematical
details) and distributed between �4 and 12 (color map scale).
ntal Cell 19, 713–726, November 16, 2010 ª2010 Elsevier Inc. 723
Early/Proliferating Cell Late/Differentiated Cell
CDX2GATA6 Early/Proliferation Gene
x
x
Late/Differentiation GeneCH3CH3
CH3 CH3
CH3 CH3CH3
CH3 CH3 CH3
CDX2
HNF4
Early/Proliferation Gene
Late/Differentiation Gene
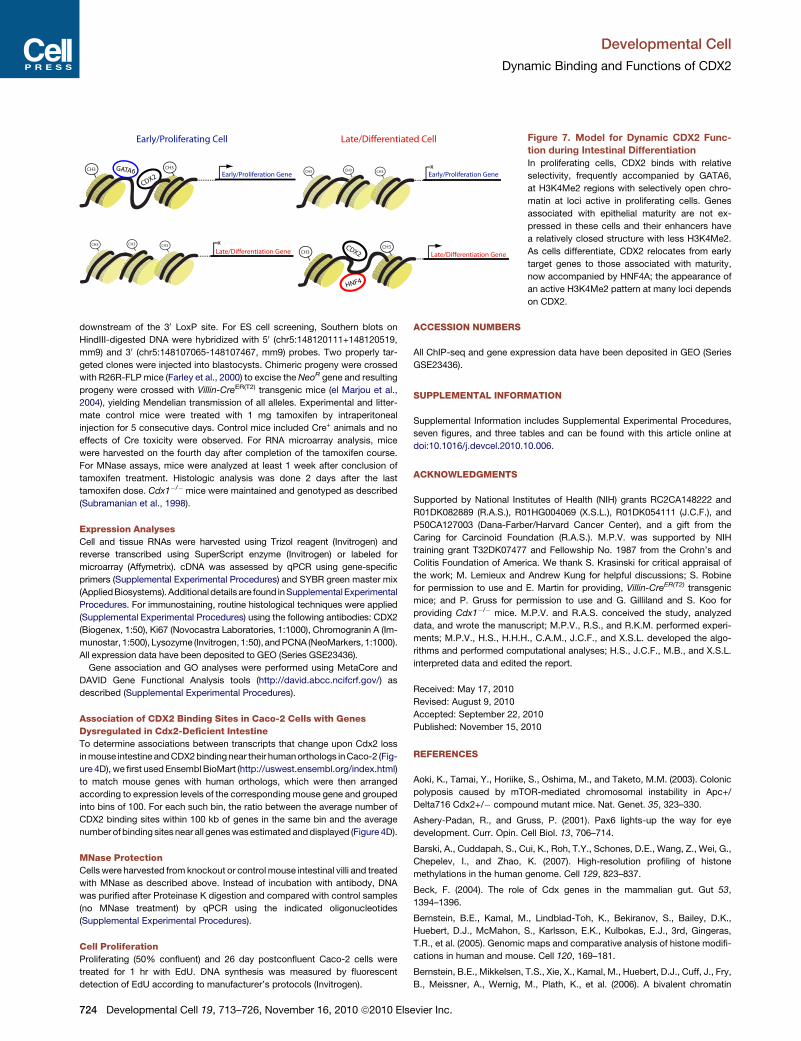
Figure 7. Model for Dynamic CDX2 Func-
tion during Intestinal Differentiation
In proliferating cells, CDX2 binds with relative
selectivity, frequently accompanied by GATA6,
at H3K4Me2 regions with selectively open chro-
matin at loci active in proliferating cells. Genes
associated with epithelial maturity are not ex-
pressed in these cells and their enhancers have
a relatively closed structure with less H3K4Me2.
As cells differentiate, CDX2 relocates from early
target genes to those associated with maturity,
now accompanied by HNF4A; the appearance of
an active H3K4Me2 pattern at many loci depends
on CDX2.
Developmental Cell
Dynamic Binding and Functions of CDX2
downstream of the 30 LoxP site. For ES cell screening, Southern blots on
HindIII-digested DNA were hybridized with 50 (chr5:148120111+148120519,mm9) and 30 (chr5:148107065-148107467, mm9) probes. Two properly tar-
geted clones were injected into blastocysts. Chimeric progeny were crossed
with R26R-FLP mice (Farley et al., 2000) to excise theNeoR gene and resulting
progeny were crossed with Villin-CreER(T2) transgenic mice (el Marjou et al.,
2004), yielding Mendelian transmission of all alleles. Experimental and litter-
mate control mice were treated with 1 mg tamoxifen by intraperitoneal
injection for 5 consecutive days. Control mice included Cre+ animals and no
effects of Cre toxicity were observed. For RNA microarray analysis, mice
were harvested on the fourth day after completion of the tamoxifen course.
For MNase assays, mice were analyzed at least 1 week after conclusion of
tamoxifen treatment. Histologic analysis was done 2 days after the last
tamoxifen dose. Cdx1�/� mice were maintained and genotyped as described
(Subramanian et al., 1998).
Expression Analyses
Cell and tissue RNAs were harvested using Trizol reagent (Invitrogen) and
reverse transcribed using SuperScript enzyme (Invitrogen) or labeled for
microarray (Affymetrix). cDNA was assessed by qPCR using gene-specific
primers (Supplemental Experimental Procedures) and SYBR green master mix
(AppliedBiosystems). Additionaldetails are found inSupplemental Experimental
Procedures. For immunostaining, routine histological techniques were applied
(Supplemental Experimental Procedures) using the following antibodies: CDX2
(Biogenex, 1:50), Ki67 (Novocastra Laboratories, 1:1000), Chromogranin A (Im-
munostar, 1:500), Lysozyme (Invitrogen, 1:50), andPCNA (NeoMarkers, 1:1000).
All expression data have been deposited to GEO (Series GSE23436).
Gene association and GO analyses were performed using MetaCore and
DAVID Gene Functional Analysis tools (http://david.abcc.ncifcrf.gov/) as
described (Supplemental Experimental Procedures).
Association of CDX2 Binding Sites in Caco-2 Cells with Genes
Dysregulated in Cdx2-Deficient Intestine
To determine associations between transcripts that change upon Cdx2 loss
inmouse intestine andCDX2bindingnear their humanorthologs inCaco-2 (Fig-
ure 4D), we first usedEnsembl BioMart (http://uswest.ensembl.org/index.html)
to match mouse genes with human orthologs, which were then arranged
according to expression levels of the corresponding mouse gene and grouped
into bins of 100. For each such bin, the ratio between the average number of
CDX2 binding sites within 100 kb of genes in the same bin and the average
number of binding sites near all geneswasestimated anddisplayed (Figure 4D).
MNase Protection
Cells were harvested from knockout or controlmouse intestinal villi and treated
with MNase as described above. Instead of incubation with antibody, DNA
was purified after Proteinase K digestion and compared with control samples
(no MNase treatment) by qPCR using the indicated oligonucleotides
(Supplemental Experimental Procedures).
Cell Proliferation
Proliferating (50% confluent) and 26 day postconfluent Caco-2 cells were
treated for 1 hr with EdU. DNA synthesis was measured by fluorescent
detection of EdU according to manufacturer’s protocols (Invitrogen).
724 Developmental Cell 19, 713–726, November 16, 2010 ª2010 Els
ACCESSION NUMBERS
All ChIP-seq and gene expression data have been deposited in GEO (Series
GSE23436).
SUPPLEMENTAL INFORMATION
Supplemental Information includes Supplemental Experimental Procedures,
seven figures, and three tables and can be found with this article online at
doi:10.1016/j.devcel.2010.10.006.
ACKNOWLEDGMENTS
Supported by National Institutes of Health (NIH) grants RC2CA148222 and
R01DK082889 (R.A.S.), R01HG004069 (X.S.L.), R01DK054111 (J.C.F.), and
P50CA127003 (Dana-Farber/Harvard Cancer Center), and a gift from the
Caring for Carcinoid Foundation (R.A.S.). M.P.V. was supported by NIH
training grant T32DK07477 and Fellowship No. 1987 from the Crohn’s and
Colitis Foundation of America. We thank S. Krasinski for critical appraisal of
the work; M. Lemieux and Andrew Kung for helpful discussions; S. Robine
for permission to use and E. Martin for providing, Villin-CreER(T2) transgenic
mice; and P. Gruss for permission to use and G. Gilliland and S. Koo for
providing Cdx1�/� mice. M.P.V. and R.A.S. conceived the study, analyzed
data, and wrote the manuscript; M.P.V., R.S., and R.K.M. performed experi-
ments; M.P.V., H.S., H.H.H., C.A.M., J.C.F., and X.S.L. developed the algo-
rithms and performed computational analyses; H.S., J.C.F., M.B., and X.S.L.
interpreted data and edited the report.
Received: May 17, 2010
Revised: August 9, 2010
Accepted: September 22, 2010
Published: November 15, 2010
REFERENCES
Aoki, K., Tamai, Y., Horiike, S., Oshima, M., and Taketo, M.M. (2003). Colonic
polyposis caused by mTOR-mediated chromosomal instability in Apc+/
Delta716 Cdx2+/� compound mutant mice. Nat. Genet. 35, 323–330.
Ashery-Padan, R., and Gruss, P. (2001). Pax6 lights-up the way for eye
development. Curr. Opin. Cell Biol. 13, 706–714.
Barski, A., Cuddapah, S., Cui, K., Roh, T.Y., Schones, D.E., Wang, Z., Wei, G.,
Chepelev, I., and Zhao, K. (2007). High-resolution profiling of histone
methylations in the human genome. Cell 129, 823–837.
Beck, F. (2004). The role of Cdx genes in the mammalian gut. Gut 53,
1394–1396.
Bernstein, B.E., Kamal, M., Lindblad-Toh, K., Bekiranov, S., Bailey, D.K.,
Huebert, D.J., McMahon, S., Karlsson, E.K., Kulbokas, E.J., 3rd, Gingeras,
T.R., et al. (2005). Genomic maps and comparative analysis of histone modifi-
cations in human and mouse. Cell 120, 169–181.
Bernstein, B.E., Mikkelsen, T.S., Xie, X., Kamal, M., Huebert, D.J., Cuff, J., Fry,
B., Meissner, A., Wernig, M., Plath, K., et al. (2006). A bivalent chromatin
evier Inc.
Developmental Cell
Dynamic Binding and Functions of CDX2
structure marks key developmental genes in embryonic stem cells. Cell 125,
315–326.
Cao, Y., Yao, Z., Sarkar, D., Lawrence, M., Sanchez, G.J., Parker, M.H.,
MacQuarrie, K.L., Davison, J., Morgan, M.T., Ruzzo, W.L., et al. (2010).
Genome-wide MyoD binding in skeletal muscle cells: a potential for broad
cellular reprogramming. Dev. Cell 18, 662–674.
Carroll, J.S., Meyer, C.A., Song, J., Li, W., Geistlinger, T.R., Eeckhoute, J.,
Brodsky, A.S., Keeton, E.K., Fertuck, K.C., Hall, G.F., et al. (2006). Genome-
wide analysis of estrogen receptor binding sites. Nat. Genet. 38, 1289–1297.
Chawengsaksophak, K., James, R., Hammond, V.E., Kontgen, F., andBeck, F.
(1997). Homeosis and intestinal tumours in Cdx2 mutant mice. Nature 386,
84–87.
Choi, M.Y., Romer, A.I., Hu, M., Lepourcelet, M., Mechoor, A., Yesilaltay, A.,
Krieger, M., Gray, P.A., and Shivdasani, R.A. (2006). A dynamic expression
survey identifies transcription factors relevant in mouse digestive tract
development. Development 133, 4119–4129.
Clevers, H. (2006). Wnt/beta-catenin signaling in development and disease.
Cell 127, 469–480.
D’Angelo, A., Bluteau, O., Garcia-Gonzalez, M.A., Gresh, L., Doyen, A.,
Garbay, S., Robine, S., and Pontoglio, M. (2010). Hepatocyte nuclear factor
1alpha and beta control terminal differentiation and cell fate commitment in
the gut epithelium. Development 137, 1573–1582.
Davidson, E.H., and Levine, M.S. (2008). Properties of developmental gene
regulatory networks. Proc. Natl. Acad. Sci. USA 105, 20063–20066.
DeKoter, R.P.,Walsh, J.C., and Singh, H. (1998). PU.1 regulates both cytokine-
dependent proliferation and differentiation of granulocyte/macrophage
progenitors. EMBO J. 17, 4456–4468.
el Marjou, F., Janssen, K.P., Chang, B.H., Li, M., Hindie, V., Chan, L., Louvard,
D., Chambon, P., Metzger, D., and Robine, S. (2004). Tissue-specific and
inducible Cre-mediated recombination in the gut epithelium. Genesis 39,
186–193.
Fang, R., Santiago, N.A., Olds, L.C., and Sibley, E. (2000). The homeodomain
protein Cdx2 regulates lactase gene promoter activity during enterocyte
differentiation. Gastroenterology 118, 115–127.
Farley, F.W., Soriano, P., Steffen, L.S., and Dymecki, S.M. (2000). Widespread
recombinase expression using FLPeR (flipper) mice. Genesis 28, 106–110.
Fleet, J.C., Wang, L., Vitek, O., Craig, B.A., and Edenberg, H.J. (2003). Gene
expression profiling of Caco-2 BBe cells suggests a role for specific signaling
pathways during intestinal differentiation. Physiol. Genomics 13, 57–68.
Gao, N., White, P., and Kaestner, K.H. (2009). Establishment of intestinal
identity and epithelial-mesenchymal signaling by Cdx2. Dev. Cell 16, 588–599.
Gaudet, J., and Mango, S.E. (2002). Regulation of organogenesis by the
Caenorhabditis elegans FoxA protein PHA-4. Science 295, 821–825.
Grainger, S., Savory, J.G., and Lohnes, D. (2010). Cdx2 regulates patterning of
the intestinal epithelium. Dev. Biol.. in press.
Gross, I., Lhermitte, B., Domon-Dell, C., Duluc, I., Martin, E., Gaiddon, C.,
Kedinger, M., and Freund, J.N. (2005). Phosphorylation of the homeotic tumor
suppressor Cdx2 mediates its ubiquitin-dependent proteasome degradation.
Oncogene 24, 7955–7963.
Guo, R.J., Suh, E.R., and Lynch, J.P. (2004). The role of Cdx proteins in
intestinal development and cancer. Cancer Biol. Ther. 3, 593–601.
Halbleib, J.M., Saaf, A.M., Brown, P.O., and Nelson, W.J. (2007). Transcrip-
tional modulation of genes encoding structural characteristics of differenti-
ating enterocytes during development of a polarized epithelium in vitro. Mol.
Biol. Cell 18, 4261–4278.
He, H.H., Meyer, C.A., Shin, H., Bailey, S., Wei, G., Wang, Q., Zhany, Y., Xu, K.,
Ni, M., Lupien, M., et al. (2010). Positioned nucleosomes flanking a labile
nucleosome characterize transcriptional enhancers. Nat. Genet. 42, 343–347.
Heintzman, N.D., Stuart, R.K., Hon, G., Fu, Y., Ching, C.W., Hawkins, R.D.,
Barrera, L.O., Van Calcar, S., Qu, C., Ching, K.A., et al. (2007). Distinct and
predictive chromatin signatures of transcriptional promoters and enhancers
in the human genome. Nat. Genet. 39, 311–318.
Developme
Heintzman, N.D., Hon, G.C., Hawkins, R.D., Kheradpour, P., Stark, A., Harp,
L.F., Ye, Z., Lee, L.K., Stuart, R.K., Ching, C.W., et al. (2009). Histone
modifications at human enhancers reflect global cell-type-specific gene
expression. Nature 459, 108–112.
Hinoi, T., Lucas, P.C., Kuick, R., Hanash, S., Cho, K.R., and Fearon, E.R.
(2002). CDX2 regulates liver intestine-cadherin expression in normal and
malignant colon epithelium and intestinal metaplasia. Gastroenterology 123,
1565–1577.
James, R., Erler, T., and Kazenwadel, J. (1994). Structure of the murine
homeobox gene cdx-2. Expression in embryonic and adult intestinal epithe-
lium. J. Biol. Chem. 269, 15229–15237.
Jin, C., Zang, C.,Wei, G., Cui, K., Peng,W., Zhao, K., and Felsenfeld, G. (2009).
H3.3/H2A.Z double variant-containing nucleosomes mark ‘‘nucleosome-free
regions’’ of active promoters and other regulatory regions. Nat. Genet. 41,
941–945.
Lefterova, M.I., Steger, D.J., Zhuo, D., Qatanani, M., Mullican, S.E., Tuteja, G.,
Manduchi, E., Grant, G.R., and Lazar, M.A. (2010). Cell-specific determinants
of peroxisome proliferator-activated receptor gamma function in adipocytes
and macrophages. Mol. Cell. Biol. 30, 2078–2089.
Li, C., andWong,W.H. (2001). Model-based analysis of oligonucleotide arrays:
expression index computation and outlier detection. Proc. Natl. Acad. Sci.
USA 98, 31–36.
Liu, T., Zhang, X., So, C.K., Wang, S., Wang, P., Yan, L., Myers, R., Chen, Z.,
Patterson, A.P., Yang, C.S., and Chen, X. (2007). Regulation of Cdx2 expres-
sion by promoter methylation, and effects of Cdx2 transfection onmorphology
and gene expression of human esophageal epithelial cells. Carcinogenesis 28,
488–496.
Lupien, M., Eeckhoute, J., Meyer, C.A., Wang, Q., Zhang, Y., Li, W., Carroll,
J.S., Liu, X.S., and Brown, M. (2008). FoxA1 translates epigenetic signatures
into enhancer-driven lineage-specific transcription. Cell 132, 958–970.
McGill, G.G., Horstmann, M., Widlund, H.R., Du, J., Motyckova, G., Nishimura,
E.K., Lin, Y.L., Ramaswamy, S., Avery, W., Ding, H.F., et al. (2002). Bcl2
regulation by the melanocyte master regulator Mitf modulates lineage survival
and melanoma cell viability. Cell 109, 707–718.
Molkentin, J.D., and Olson, E.N. (1996). Defining the regulatory networks for
muscle development. Curr. Opin. Genet. Dev. 6, 445–453.
Mouchel, N., Henstra, S.A., McCarthy, V.A., Williams, S.H., Phylactides, M.,
and Harris, A. (2004). HNF1alpha is involved in tissue-specific regulation of
CFTR gene expression. Biochem. J. 378, 909–918.
Niwa, H., Toyooka, Y., Shimosato, D., Strumpf, D., Takahashi, K., Yagi, R., and
Rossant, J. (2005). Interaction between Oct3/4 and Cdx2 determines
trophectoderm differentiation. Cell 123, 917–929.
Pokholok, D.K., Harbison, C.T., Levine, S., Cole, M., Hannett, N.M., Lee, T.I.,
Bell, G.W., Walker, K., Rolfe, P.A., Herbolsheimer, E., et al. (2005). Genome-
wide map of nucleosome acetylation and methylation in yeast. Cell 122,
517–527.
Potten, C.S. (1998). Stem cells in gastrointestinal epithelium: numbers,
characteristics and death. Philos. Trans. R. Soc. Lond. B Biol. Sci. 353,
821–830.
Rings, E.H., Boudreau, F., Taylor, J.K., Moffett, J., Suh, E.R., and Traber, P.G.
(2001). Phosphorylation of the serine 60 residue within the Cdx2 activation
domain mediates its transactivation capacity. Gastroenterology 121, 1437–
1450.
Saaf, A.M., Halbleib, J.M., Chen, X., Yuen, S.T., Leung, S.Y., Nelson,W.J., and
Brown, P.O. (2007). Parallels between global transcriptional programs of
polarizing Caco-2 intestinal epithelial cells in vitro and gene expression
programs in normal colon and colon cancer. Mol. Biol. Cell 18, 4245–4260.
Sekiya, T., Muthurajan, U.M., Luger, K., Tulin, A.V., and Zaret, K.S. (2009).
Nucleosome-binding affinity as a primary determinant of the nuclear mobility
of the pioneer transcription factor FoxA. Genes Dev. 23, 804–809.
Silberg, D.G., Swain, G.P., Suh, E.R., and Traber, P.G. (2000). Cdx1 and cdx2
expression during intestinal development. Gastroenterology 119, 961–971.
Silberg, D.G., Sullivan, J., Kang, E., Swain, G.P., Moffett, J., Sund, N.J.,
Sackett, S.D., and Kaestner, K.H. (2002). Cdx2 ectopic expression induces
ntal Cell 19, 713–726, November 16, 2010 ª2010 Elsevier Inc. 725

Developmental Cell
Dynamic Binding and Functions of CDX2
gastric intestinal metaplasia in transgenic mice. Gastroenterology 122,
689–696.
Soutoglou, E., and Talianidis, I. (2002). Coordination of PIC assembly and
chromatin remodeling during differentiation-induced gene activation. Science
295, 1901–1904.
Stegmann, A., Hansen, M., Wang, Y., Larsen, J.B., Lund, L.R., Ritie, L.,
Nicholson, J.K., Quistorff, B., Simon-Assmann, P., Troelsen, J.T., and Olsen,
J. (2006). Metabolome, transcriptome, and bioinformatic cis-element analyses
point to HNF-4 as a central regulator of gene expression during enterocyte
differentiation. Physiol. Genomics 27, 141–155.
Struhl, K. (1999). Fundamentally different logic of gene regulation in eukaryotes
and prokaryotes. Cell 98, 1–4.
Subramanian, V., Meyer, B.I., and Gruss, P. (1995). Disruption of the murine
homeobox gene Cdx1 affects axial skeletal identities by altering the meso-
dermal expression domains of Hox genes. Cell 83, 641–653.
Subramanian, V., Meyer, B., and Evans, G.S. (1998). The murine Cdx1 gene
product localises to the proliferative compartment in the developing and
regenerating intestinal epithelium. Differentiation 64, 11–18.
Traber, P.G., and Silberg, D.G. (1996). Intestine-specific gene transcription.
Annu. Rev. Physiol. 58, 275–297.
726 Developmental Cell 19, 713–726, November 16, 2010 ª2010 Els
Tremblay, E., Auclair, J., Delvin, E., Levy, E., Menard, D., Pshezhetsky, A.V.,
Rivard, N., Seidman, E.G., Sinnett, D., Vachon, P.H., and Beaulieu, J.F.
(2006). Gene expression profiles of normal proliferating and differentiating
human intestinal epithelial cells: a comparison with the Caco-2 cell model. J.
Cell. Biochem. 99, 1175–1186.
van de Wetering, M., Sancho, E., Verweij, C., de Lau, W., Oving, I., Hurlstone,
A., van der Horn, K., Batlle, E., Coudreuse, D., Haramis, A.P., et al. (2002). The
beta-catenin/TCF-4 complex imposes a crypt progenitor phenotype on
colorectal cancer cells. Cell 111, 241–250.
Verzi, M.P., Hatzis, P., Sulahian, R., Philips, J., Schuijers, J., Shin, H., Freed, E.,
Lynch, J.P., Dang, D.T., Brown, M., et al. (2010). TCF4 and CDX2, major tran-
scription factors for intestinal function, converge on the same cis-regulatory
regions. Proc. Natl. Acad. Sci. USA 107, 15157–15162.
Zaret, K. (1999). Developmental competence of the gut endoderm: genetic
potentiation by GATA and HNF3/fork head proteins. Dev. Biol. 209, 1–10.
Zhang, Y., Liu, T., Meyer, C.A., Eeckhoute, J., Johnson, D.S., Bernstein, B.E.,
Nussbaum, C., Myers, R.M., Brown, M., Li, W., and Liu, X.S. (2008a).
Model-based analysis of ChIP-Seq (MACS). Genome Biol. 9, R137.
Zhang, Y., Shin, H., Song, J.S., Lei, Y., and Liu, X.S. (2008b). Identifying
positioned nucleosomes with epigenetic marks in human from ChIP-Seq.
BMC Genomics 9, 537.
evier Inc.