development of wood flour- recycled … · development of wood flour-recycled polymer composite...
TRANSCRIPT

DEVELOPMENT OF WOOD FLOUR-RECYCLED POLYMER COMPOSITE PANELS AS BUILDING MATERIALS
A thesis submitted in fulfilment of the requirements for the Degree of
Doctor of Philosophy
in
Chemical and Process Engineering in the University of Canterbury
by
Kamal Babu Adhikary
UNIVERSITY OF CANTERBURY
2008

i
ABSTRACT Wood plastic composites (WPCs) were made using matrices of recycled high-density polyethylene (rHDPE) and polypropylene (rPP) with sawdust (Pinus radiata) as filler. Corresponding WPCs were also made using virgin plastics (HDPE and PP) for comparison with the recycled plastic based composites. WPCs were made through melt compounding and hot-press moulding with varying formulations based on the plastic type (HDPE and PP), plastic form (recycled and virgin), wood flour content and addition of coupling agent. The dimensional stability and mechanical properties of WPCs were investigated. Durability performances of these WPCs were studied separately, by exposing to accelerated freeze-thaw (FT) cycles and ultraviolet (UV) radiation. The property degradation and colour changes of the weathered composites were also examined. Dimensional stability and flexural properties of WPCs were further investigated by incorporation of nanoclays in the composite formulation. To understand the changes in WPCs stability and durability performance, microstructure and thermal properties of the composites were examined. Two mathematical models were developed in this work, one model to simulate the moisture movement through the composites in long-term water immersion and the other model to predict the temperature profile in the composites during hot-press moulding. Both rHDPE and rPP matrix based composites exhibited excellent dimensional stability and mechanical properties, which were comparable to those made from virgin plastics. Incorporation of maleated polypropylene (MAPP) coupling agent in composite formulation improved the stability and the mechanical properties. The incorporation of 3 wt. % MAPP coupling agent to WPCs showed an increase in tensile strength by 60% and 35 %, respectively, for the rHDPE based and rPP based composites with 50 wt. % wood flour. Scanning electron microscopy (SEM) images of the fractured surfaces of WPCs confirmed that the MAPP coupling improved the interfacial bonding between the plastic and the wood filler for both series of composites. Long-term water immersion tests showed that the water transport mechanism within the WPCs follows the kinetics of Fickian diffusion.

ii
Dimensional stability and flexural properties of the WPC were degraded after 12 accelerated FT cycles as well as 2000 h of UV weathering for both recycled and virgin HDPE and PP based composites. However, the MAPP coupled composites had improved stability and flexural property degradation. The surface of the weathered composites experienced a colour change, which increased with the exposure time. The MAPP coupled composites exhibited less colour change as compared to non-coupled composites. Regarding the effect of the plastic type, the PP based composites experienced higher colour change than those based on HDPE. With weathering exposure, flexural strength and stiffness of the WPCs were decreased, but elongation at break was increased regardless of plastic type and wood flour content. MAPP coupled rPP and rHDPE based UV weathered WPCs lowered the degradation of stiffness by 50% and 75%, respectively compared to non-coupled WPCs. SEM images of the fractured surfaces of FT and UV weathered WPCs confirmed a decrease in the interfacial bonding between the wood flour and matrix. Thermal properties of weathered composites changed with weathering, but the extent of the changes depended on WPCs formulation and matrix type. From the experimental studies on nanoclay-filled rHDPE composites, it is found that stability, flexural properties of WPCs could be improved with an appropriate combination of coupling agent, and nanoclay contents processed by melt blending. Incorporation of 1-5 wt. % nanoclay in the maleated polyethylene (MAPE) coupled wood plastic composite improved the dimensional stability and flexural properties. The thermal properties changed with the addition of nanoclay and MAPE in WPCs. In this work, a hot press-moulding model was proposed based on the one-dimensional transient heat conduction to predict the temperature profile of WPCs during hot pressing cycle. The results from this work clearly show that rHDPE and rPP can be successfully used to produce stable and strong WPCs, which properties and performances are similar to or comparable to composites made of wood and virgin plastics. Therefore, WPCs based on recycled PP and HDPE matrix could have potential to use as construction materials.

iii
ACKNOWLEDGEMENTS
The author would like to express his foremost gratitude and sincere appreciation to his senior supervisor Associate Professor Shusheng Pang, and associate supervisor Dr. Mark P. Staiger. Their invaluable support, guidance and encouragement throughout the research period are the impetus behind the successful completion of this work on time. The author is equally thankful to the committee members Prof. Conan Fee, Senior Lecturer Dr. Kim Pickering and Senior Lecturer Dr. Bronwyn Fox for their comments and suggestions. The author also thanks the Department of Chemical and Process Engineering and Department of Mechanical Engineering, University of Canterbury, for the technical supports, SCION and AgResearch (New Zealand) for helping with composite panels manufacturing, NZ Plastics Recycling Limited and Canterbury Landscape Supplies (Christchurch) for providing raw materials. I would like to thanks all the academic staff, technical staff and colleagues at Department of Chemical and Process Engineering for their immeasurable assistance during my research work.
The author is also immensely grateful to the Government of New Zealand for providing NZAID postgraduate scholarship to pursue the doctoral degree at the University of Canterbury. Financial support from the New Zealand Foundation for Research, Science and Technology (FRST) for the experiment is also appreciated. A heartfelt gratitude is extended to the Nepalese friends in Christchurch for their encouraging support and inspiration during my stay here. Finally, the author would like to give my respect to my parents, brother, parents-in-law, and brother-in-law for their support and encouragement in all his endeavours. The author expresses his deepest gratitude to his wife Rita, son Prakhar and daughter Pranjali, whose constant love, patience, support and understanding helped me to complete the study to whom the author dedicates this dissertation.

iv
TABLE OF CONTENTS
Abstract i Acknowledgement iii Table of Contents iv List of Figures x List of Tables xv CHAPTER 1: INTRODUCTION 1 1.1 Introduction 1 1.2 Objectives 4 1.3 Literature review 6 1.3.1 General background 6 1.3.2 Applications of WPCs 6 1.3.2.1 Building products 6 1.3.2.2 Infrastructures 7 1.3.2.3 Transportations 7 1.3.3 Wood fillers in the WPCs 7 1.3.3.1 Chemical composition of wood 8 1.3.3.2 Waste wood for reinforcing filler 10 1.3.4 Polymers in WPCs 10 1.3.5 Plastics in municipal solid waste 12 1.3.6 Recycled thermoplastics in WPCs 13 1.3.7 Improvement of interfacial bonding in WPCs 13 1.3.8 WPCs manufacturing 15 1.4 References 16 CHAPTER 2: EXPERIMENT 23 2.1 Introduction 23 2.2 Materials 24 2.2.1 Wood filler 24 2.2.2 Thermoplastic polymer 24
v
2.3 Composite preparation 25 2.3.1 Mixing and compounding of the wood flour and the plastics 25 2.3.2 Compression moulding of the composite panels 26 2.3.3 In-situ temperature measurement during pressing cycles 27 2.4 Testing of the composite samples and the result analysis 31 2.4.1 Dimensional stability tests 31 2.4.2 Mechanical properties 31 2.4.2.1 Tensile properties 31 2.4.2.2 Flexural properties 32 2.4.3 Scanning electron microscopy (SEM) 33 2.4.4 Accelerated weathering tests 33 2.4.4.1 Accelerated freeze-thaw cycles 35 2.4.4.2 Accelerated UV-exposure 35 2.4.5 Colour measurement 36 2.4.6 Differential scanning calorimetry (DSC) 36 2.4.7 Statistical analysis 37 2.5 Specimen preparation 37 2.6 References 38
CHAPTER 3: PERFORMANCE OF RECYCLED AND VIRGIN HIGH DENSITY
POLYETHYLENE AND SAWDUST COMPOSITES 40 Abstract 40 3.1 Introduction 40 3.2 Experimental 41 3.3 Results and discussion 42 3.3.1 Moisture absorption and thickness swelling 42 3.3.2 Mechanical properties 45 3.3.2.1 Tensile properties 45 3.3.2.2 Flexural properties 48 3.3.4 Microstructure characterization 51 3.4 Conclusions 53 3.5 References 54

vi
CHAPTER 4: PERFORMANCE OF RECYCLED AND VIRGIN POLYPROPYLENE AND SAWDUST COMPOSITES 56 Abstract 56 4.1 Introduction 56 4.2 Experimental 58 4.3 Results and discussion 59 4.3.1 Water absorption and thickness swelling 59 4.3.2 Tensile and flexural properties 62 4.4.3 Microstructure characterization 65 4.5 Conclusions 67 4.6 References 68 CHAPTER 5: LONG-TERM MOISTURE ABSORPTION AND THICKNESS SWELLING BEHAVIOUR OF RECYCLED THERMOPLASTICS REINFORCED WITH PINUS RADIATA SAWDUST 71 Abstract 71 5.1 Introduction 71 5.2 Theoretical approach 72 5.2.1 Mechanisms of water transport 72 5.2.2 Diffusivity determination 73 5.2.3 Prediction of thickness swelling 74 5.3 Experimental 75 5. 4 Results and discussion 75 5.4.1 Long-term water absorption behaviour 75 5.4. 2 Long-term thickness swelling behaviour 82 5.5 Conclusions 87 5.6 References 90 CHAPTER 6: EFFECTS OF ACCELERATED FREEZE-THAW CYCLING ON PHYSICAL AND
MECHANICAL PROPERTIES OF WOOD FLOUR-RECYCLED PLASTICS COMPOSITES 92 Abstract 92

vii
6.1 Introduction 92 6.2 Experimental 94 6.3 Results and discussion 96 6.3.1 Colour analysis 96 6.3.2 Water absorption and thickness swelling 97 6.3.3 Flexural properties 100 6.3.4 Microstructure characterization 102 6.3.5 Thermal properties 105 6.4. Conclusions 110 6.5 References 111 CHAPTER 7: ACCELERATED ULTRAVIOLET WEATHERING OF RECYCLED
POLYPROPYLENE-SAWDUST COMPOSITES 114 Abstract 114 7.1 Introduction 114 7.2 Experimental 116 7.3 Results and discussion 117 7.3.1 Water absorption and thickness swelling 117 7.3.2 Colour analysis 120 7.3.3 Flexural properties 124 7.3.4 Microstructure characterization 126 7.3.5 Thermal properties 128 7.3.5.1 Melting enthalpy and temperature 128 7.3.5.2 Crystallization temperature and crystallinity 130 7.4 Conclusions 131 7.5 References 134 CHAPTER 8: ACCELERATED ULTRAVIOLET WEATHERING OF RECYCLED HIGH
DENSITY POLYETHYLENE-SAWDUST COMPOSITES 137 Abstract 137 8.1 Introduction 137 8.2 Experimental 139

viii
8.3 Results and discussion 141 8.3.1 Colour analysis 141 8.3.2 Water absorption and thickness swelling 144 8.3.3 Flexural properties 148 8.3.4 Microstructure characterization 153 3.3.5 Thermal properties 155 3.3.5.1 Melting enthalpy and temperature 155 3.3.5.2 Crystallization temperature and crystallinity 157 8.4 Conclusions 158 8.5 References 161 CHAPTER 9: DIMENSIONAL STABILITY, MECHANICAL AND THERMAL PROPERTIES OF NANOCLAY BASED WOOD FLOUR-RECYCLED HDPE NANOCOMPOSITES 164 Abstract 164 9.1 Introduction 164 9.2 Experimental 166 9.2.1 Materials 166 9.2.2 Preparation of HDPE/wood flour/nanoclay nanocomposites 167 9.2.2.1 Direct dry blending method 168 9.2.2.2 Melt blending method 168 9.2.2.3 Nanocomposite preparation 170 9.2.3 Testing and analysis 170 9.3 Results and discussion 170 9.3.1. Dimensional stability 170 9.3.2 Flexural properties 174 9.3.3. Microstructures characterization 179 9.3.4 Thermal properties 182 9.3.4.1 Melting enthalpy and temperature 182 9.3.4.2 Crystallization 184 9.4 Conclusions 185 9.5 References 187

ix
CHAPTER 10: NUMERICAL SIMULATION FOR THE TEMPERATURE DISTRIBUTION
DURING THE HOT PRESS MOULDING OF THE WOOD PLASTICS COMPOSITES 190 Abstract 190 10.1 Introduction 190 10. 2 Experimental 191 10. 3 Theoretical modelling of the temperature profile 192 10.3.1 Governing equations for transient heat conduction 192 10.3.2 Thermo-physical properties 193 10.3.2.1 Density of composite 193 10.3.2.2 Heat capacity of composite 194 10.3.2.3 Thermal conductivity of composite 194 10.4 Finite difference method for solving the heat equation 195 10.5 Initial and boundary conditions 196 10.6 Numerical simulation 198 10.7 Results and discussion 198 10.8 Conclusions 201 10.9 References 202
CHAPTER 11: CONCLUSIONS AND RECOMMENDATIONS 204
11.1 Conclusions 204 11.1.1 Performance of WPCs based on recycled PP and HDPE 205 11.1.2 Long-term water absorption behaviour 206 11.1.3 Freeze thaw durability performance of WPCs 206 11.1.4 UV durability of WPCs 208 11.1.5 Performance of nanoclay incorporated WPCs 209 11.1.6 Numerical simulation of hot pressing of WPCs 210 11.2 Recommendations for future work 211 Appendix 1: List of publications 212
x
LIST OF FIGURES
Fig. 1.1. Segment of a cellulose molecule linear and unbranched structure ……………9 Fig. 1.2. Modification mechanisms for esterification reaction between wood particles and maleated polyolefin’s: (a) monoester; (b) diester formation……15 Fig. 2.1. Size distribution of the radiata pine wood flour………………………………25 Fig. 2.2. Twin-screw extruder setup showing different extruding zones and feeding hoppers………………………………….…………………………………….27 Fig. 2.3. Schematic flow diagram of the wood plastic composite manufacturing Process………………………………………………...……………………....30 Fig. 2.4. Experimental setup used for the in-situ temperature measurement by using K-type thermocouples………………………………………….....…….30 Fig. 2.5. Experimental setup used for the flexural properties tests by using the Material Testing System…….………………………………………….....34 Fig. 2.6. Experimental setup used for the accelerated UV weathering by using the black panel UV box………………..………..………………………34 Fig. 3.1. Stress-strain curves of the wood flour-HDPE composites obtained in tensile tests………..…………………………………………………..…….48 Fig. 3.2. Load-displacement curves of the entirely HDPE and wood flour -HDPE composites…………..…………………………………………..……49 Fig. 3.3. SEM images (100×) of fractured surface of (a) rHDPE70W30, (b) vHDPE50W50 composite samples……………………….…………….....52 Fig. 3.4. SEM images (100×) of fractured surface of (a) rHDPE50W50, (b) rHDPE47W50CA3 composite samples……………….…...……………..52 Fig. 4.1 Water absorption by the PP based composites after 2 and 24 h water immersion……………………………………………………………….60 Fig. 4.2 Thickness swelling by the PP based composites after 2 and 24 h water immersion…………………………….…………………………………61 Fig. 4.3. Load displacement curves for the entirely PP and wood flour- PP composites………...……………………………………………………….64 Fig. 4.4. SEM images (×200) of fractured surface of (a) vPP50W50, (b) rPP50W50…66

xi
Fig. 4.5. SEM images (×200) of fractured surface of (a) r PP47W50CA3, (b) rPP45W50CA5………………………………..………………………………66 Fig. 5.1. Long term water absorption behaviour for wood flour-HDPE composites…..77 Fig. 5.2. Long term water absorption behaviour for wood flour-PP composites……....79 Fig. 5.3. Plot of log (Mt/Mm) versus log (t) for wood flour-HDPP composites…….…..80 Fig. 5.4. Plot of log (Mt/Mm) versus log (t) for wood flour-PP composites…………….81 Fig. 5.5. Thickness swelling versus water immersion time for wood flour- HDPE composites…………………………………………..…………….…..84 Fig. 5.6. Thickness swelling versus water immersion time for wood flour-PP composites………………………..……..……………………………………84 Fig. 5.7. Thickness swelling model fit for wood flour-PP composites………...………85 Fig. 5.8. Thickness swelling model fit for wood flour-HDPE composites…………….85 Fig. 5.9. Swelling rate versus density of wood flour/ thermoplastics composites……..88 Fig. 5.10. Swelling rate versus standard error for wood flour/thermoplastics composites……………………...…………………..………………………..88 Fig. 5.11. Equilibrium moisture content versus equilibrium thickness swelling for the wood flour/thermoplastics composites………………………………89 Fig. 6.1. Water absorption for the control and the FT weathered composites after 2 h water immersion……….……………………………………………98 Fig. 6.2 Water absorption for the control and the FT weathered composites after 24 h water immersion…………………...………………………………..98 Fig. 6.3. Moisture content changes of the composites through the FT cycles………….99 Fig. 6.4. Thickness swelling for the control and the FT weathered composites after 24 h water immersion…………..……………..…………………………99 Fig. 6.5. SEM images (×100) of rHDPE based composites with 50 wt. % wood flour content (a) control sample, (b) FT weathered sample……….......103 Fig. 6.6. SEM images (×100) of vHDPE based composites with 50 wt. % wood flour content (a) control sample, (b) FT weathered sample……….…..103 Fig. 6.7. SEM images (×100) of rPP based composites with 50 wt. % wood flour content (a) control, (b) FT weathered sample………….………….…...104 Fig. 6.8. SEM images (×100) of rPP based composites with 50 wt. % wood flour content and 5 wt.% MAPP (a) control, (b) FT weathered sample…….104
xii
Fig. 6.9. DSC second heating curves for the control and the FT cycled wood flour-PP composites…………………….…………………………………...106 Fig. 6.10. DSC second heating curves for the control and the FT cycled wood flour-HDPE composites…………………………………………………….106 Fig. 6.11. DSC cooling curves for the control and the FT cycled wood flour-PP composites………………………………………………………………….107 Fig. 7.1. Overall colour changes (∆E) of the composites at various UV exposure times……………………………………………………………….122 Fig. 7.2. Optical micrographs (×10) of wood flour-PP composites before and after 2000 h exposure to UV radiation, (a) vPP50W50, (b) rPP50W50, (c) rPP45W50CA3 samples……………………………….………………….123 Fig. 7.3. SEM images (×200) of neat rPP (a) control, and (b) weathered samples..….126 Fig. 7.4. SEM images (×200) of PP based composites with 50 wt. % wood flour, (a) control sample based on vPP, (b) weathered sample based on vPP, (c) control sample based on rPP, and (d) weathered sample based on rPP………….…..127 Fig. 7.5. SEM micrographs (×200) of composite of rPP45W50CA5, (a) control, (b) weathered sample…………………….………………………………..…128 Fig. 7.6. DSC second heating curves for control and UV-weathered wood flour- PP composites……………………...…..…………………………………….129 Fig. 7.7. DSC cooling curves for control and UV-weathered wood flour- PP composites……………..………….………………………….…………..129 Fig. 8.1. Overall colour changes (∆E) of the composites at various UV exposure times………………..………………………………………….…..142 Fig. 8.2. Optical micrographs (×10) of control and weathered composites (2000 h), (a)rHDPE100, (b) vHDPE50W50, (c) rHDPE50W50, and (d) rHDPE45W50CA5 samples………………………..……………….……143 Fig. 8.3. Water absorption for the control and the UV weathered composites after 2 h water immersion…………..………………………………………..145 Fig. 8.4. Water absorption for the control and the UV weathered composites after 24 h water immersion……...…………..……………………..………..145 Fig. 8.5. Changes in water absorption of the UV weathered composites after 2 h and 24 h water immersion…………..………….…………………..146

xiii
Fig. 8.6. Thickness swelling for the control and the weathered composites after 2 h water immersion………..…………………………….…………….146 Fig. 8.7. Thickness swelling for the control and the weathered composites after 24 h water immersion………..……...………………………………….147 Fig. 8.8. Flexural strength of the control and the UV weathered composites….……..149 Fig. 8.9. Young’s modulus of the control and the UV weathered composites………..149 Fig. 8.10. Yield stress of the control and the UV weathered composites……..……....150 Fig. 8.11. Elongation at break for the control and the UV weathered composites……150 Fig. 8.12. SEM images (×500) of rHDPE based composites, (a) control sample with 30 wt.% wood flour, (b) weathered sample with 30 wt.% wood flour, (c) control sample with 40 wt.% wood flour, (d) weathered sample with 40 wt.% wood flour……………………….…………………………...…..152 Fig. 8.13. SEM images (×500) of HDPE based composites with 50 wt. % wood flour, (a) control sample based on vHDPE, (b) weathered sample based on vHDPE, (c) control sample based on rHDPE, (d) weathered sample based on rHDPE ...............................................................................153 Fig. 8.14. SEM images (×500) of rHDPE based composites with 50 wt. % wood flour and 5 wt. % MAPP, (a) control, (b) weathered sample………..154 Fig. 8.15. DSC second heating curves for the control and the UV weathered composites………………...…………………….……………………….….156 Fig. 8.16. DSC cooling curves for the control and the UV weathered composites.…..156 Fig. 9.1. Chemical structure of Cloisite-20A and 15A………………………….…….167 Fig. 9.2. Water absorption of the rHDPE based nanocomposites in water immersion……………...……………………………………….……..171 Fig. 9.3. Thickness swelling of the rHDPE based nanocomposites in water immersion…………….………………………………….……………172 Fig. 9.4. Flexural strength and Young’s Modulus of elasticity of the rHDPE based nanocomposites as functions of nanoclay content and processing methods………………………………………………………………..…..…177 Fig.9.5. SEM images of surface of the rHDPE based nanocomposites (a) mPE4 and (b) dPE7 samples, where white spots are the nanoclay particles………...180 Fig.9.6. SEM images of surface of the rHDPE based nanocomposites (a) dPE8
xiv
and (b) mPE8 samples, where white spots are the nanoclay particles…….....180 Fig.9.7. SEM images of fractured surface of the rHDPE based nanocomposites (a) dPE6 and (b) dPE7 samples………………………………………………181 Fig.9.8. SEM images of fractured surface of the rHDPE based nanocomposites (a) dPE8 and (b) mPE8 samples……………………………..……………….181 Fig. 9.9. DSC second heating curves for the rHDPE based nanocomposites…...……183 Fig. 9.10. DSC cooling curves for the rHDPE based nanocomposites…..……….…..183 Fig. 10.1. Schematic diagram of the experimental setup for the measurement of core temperature of the wood plastic composites…………………..……192 Fig.10.2. Mesh on a semi-infinite strip used for solution to the one dimensional heat equation………………………………..…………………195 Fig.10.3. Comparison of the experimental and the predicted core temperature for the PP based composites……………………..…………………….……200 Fig.10.4. Comparison of the experimental and the predicted core temperature for the HDPE based composites…………………………....……………….200

xv
LIST OF TABLES Table 2.1 Chemical composition of radiata pine wood………………………...………26 Table 2.2 Physical and mechanical properties of the thermoplastics used in the study…………......…….………….…………………...…….…..26 Table 2.3 Operation conditions of the extrusion compounding of the HDPE and PP series composites………….…………………………………………………28 Table 2.4 WPCs formulations for the HDPE and PP series composites……………….29 Table 2.5 Details of the test standards and specimens used in each test.………………38 Table 3.1 Water absorption and thickness swelling of the wood flour -HDPE composites…………………………………………………………..42 Table 3.2 Tensile and flexural properties of wood flour-HDPE composites………..…46 Table 4.1 Tensile and flexural properties of the wood flour-PP composites…………..62 Table 5.1 WPCs formulation selected for dimensional stability test………….……….76 Table 5.2 Diffusion case selection parameters………………………………...………82 Table 5.3 Diffusivity and permeability of wood flour/ thermoplastic composites…………………………………………..………………………83 Table 5.4 Measured TS and predicted swelling rate parameter for wood flour/ thermoplastic composites…….…………...………………………………..87 Table 6.1 WPCs formulation selected for the accelerated FT weathering test………..95 Table 6.2 Changes in colour coordinates of the composites after the accelerated FT weathering…………………………………..…………………………..97 Table 6.3 Flexural properties of the control and the FT weathered composites...........101 Table 6.4 Thermal properties of the control and the FT weathered wood-plastic composites…………………....……………………………………………108 Table 7.1 WPCs formulation used for UV weathering tests for wood flour-PP composites (percent by weight)………………………………………….....117 Table 7.2 Water absorption and thickness swelling of control and UV weathered composites…………………………..…………………….…….118 Table 7.3 Changes in colour coordinates for the composites at various UV exposure times……………………..……………………………...…….…121

xvi
Table 7.4 Flexural properties of control and UV weathered composites………….….124 Table 7.4 Thermal properties control and UV weathered composites through DSC analysis……………………………………………………………….133 Table 8.1 Formulations of wood flour-HDPE composite used for the UV weathering tests………………...…………………...……………………..140 Table 8.2 Change in colour coordinates of the composites after the accelerated UV weathering…………………………………………...……142 Table 8.3 Thermal properties of the control and the UV weathered wood flour-HDPE composites…………………………..………………...…….160 Table 9.1 Extruding parameters for the rHDPE/wood flour/ nanoclay nanocomposite……………………………………………….…..168 Table 9.2 Formulations studied for the rHDPE/wood flour/nanoclay nanocomposites (% by weight)…………………………….………………169 Table 9.3 Flexural properties of the rHDPE based nanocomposites……………...…..175 Table 9.4 Thermal properties of the rHDPE based nanocomposites………………….184

1
CHAPTER 1 INTRODUCTION
1.1 Introduction Wood-plastic composites (WPCs) are emerging as one of the dynamic growth materials in the building industry. WPC is manufactured by dispersing wood particles into molten plastic with coupling agent or additives to form composite material through various techniques of processing such as extrusion, compression or injection moulding. It was first made commercially from phenol-formaldehyde and wood flour that was used for Rolls-Royce gearshift knob in 1916, and it was reborn as a modern concept in Italy in the 1970s, and popularized in North America in early 1990s [1]. Wood-thermoset composites date back to early 1900s; however, thermoplastic polymers in WPC is a relatively new innovation. In 1983, an American Woodstock company (Lear Corporation in Sheboygan, WI) began producing automotive interior substrates by using extrusion technology from the mixture of polypropylene (PP) and wood flour [2]. Since then production and markets demand for the WPCs have been growing rapidly worldwide. The share in North American decking market has grown considerably, from 2% in 1997 to an estimated 18 % in 2005, with total sales of US$3.9 billion in 2005 for residential, industrial deck-boards and railing market in USA [3]. It is expected to increase to about 500 million to 1 billion pounds over the next five years in the UK and other European markets [4]. Currently WPCs are mainly used for building products like decking, fencing, siding, garden furniture, exterior windows and doors [3, 4], although other applications can also be found in marine structures, railroad crossties, automobile parts and highway structures such as highway signs, guardrail posts, and fence posts [5]. WPCs possess many advantages over the raw materials of polymers and wood filler. WPC had better dimensional stability and durability against bio-deterioration as compared to wood. In addition, WPC also reduce the machine wear and tear of processing equipment, and lower the product cost against inorganic fillers when waste streams such as sawdust are used [4]. As compared to the polymers, WPC had higher mechanical properties, thermal stability, and more resistance to the ultraviolet light and degradation [4].
2
With growing production and consumption, plastics worldwide is currently resulting in a significant contribution to the municipal solid waste [6]. In US, waste plastics accounts for 11.8% of the 246 million tonnes of municipal solid waste generated in 2005 [7]. Attempts have been made to reuse these waste plastics in order to reduce the environmental impact and consumption of the virgin plastics. During 2004, plastics recovery was about 8.25 million tonnes (39% of total plastics consumed) in Western Europe [8], 35,000 tonnes in New Zealand which was 13.48% of the total imported virgin plastics [9] while US recycled only about 5.7% of the plastics generated in 2005 [7]. In UK, approximately 500,000 tonnes of waste plastics (from 2.8 million tonnes of waste plastics) are recycled each year [4]. The key factor for increasing of waste plastic recycling is to find suitable products with desired properties. Past studies have demonstrated that the recycled plastics possessed similar mechanical properties but are much cheaper than their virgin form. It has been reported that the mechanical properties of recycled high density polyethylene (rHDPE) from the post-consumer milk bottles were not largely different from those of virgin resin and thus could be used for different applications [10]. However, the pellets and flakes of rHDPE are 31-34% less expensive than the virgin HDPE (vHDPE) [11]. Therefore, if the recycled plastics are used for the production of WPCs without compromising the required properties, WPC products will have cost-competitive advantage in the markets. Similarly, large amount of wood waste generated at different stages in the wood processing is mainly destined for landfill. During 2002, approximately 63 million metric tonnes of wood waste (26.8 million metric tonnes in municipal solid waste) was generated in the US [12]. In the UK, about 0.8 million tonnes of waste wood are recycled every year although 5 to 7.5 million tonnes of waste wood are produced [4]. It was reported that waste wood in the form of wood flour, fibres or pulp are suitable as a filler for polyolefin’s matrix composites [13, 14]. Pinus radiata wood fibres possessed physical and mechanical properties suitable to the reinforcement of plastics [15]. Hence increased usage of the recycled plastics and the waste wood for WPCs offers the prospect of lessening waste disposal problems and lowering production costs.
3
Virgin thermoplastics such as HDPE and polypropylene (PP) are widely used for WPCs, and significant number of papers are available for their mechanical properties, dimensional stability, interface adhesion and durability [16-22]. However, published reports on recycled HDPE and PP based WPCs are rather limited [23-27]. Most of the studies were focused on the use of a single type/or grade of plastic from the waste stream, or simulated recycled plastic, or mixing of recycled plastic with virgin plastic for use in WPCs. Despite several advantages of using wood filler over inorganic fillers for polymer composite, higher moisture susceptibility of the wood is the main concern for the overall performance of WPCs. Increased moisture content in the composites reduces mechanical properties, dimensional stability, and tends to lead to biodegradation [28]. However, use of coupling agents such as functionalised polyolefins has shown to be capable of improving the water resistant and mechanical properties through improved compatibility between the hydrophilic wood filler and hydrophobic polymer matrix [17, 29-31]. Several studies were conducted to examine the effect of moisture content on mechanical properties and stability of the natural fibre and thermoplastics composites [28, 32, 33]. In these studies, moisture absorption rate was described by diffusion theory [34-37]. However, these studies were only for virgin plastics and it is not known if these results are applicable to recycled thermoplastic-based composites. As dimensional stability of the WPC is the important property in exterior applications, understanding and quantification of the moisture absorption and dimensional changes of WPC is focused on the on-going research. Due to the uncertainties regarding WPC stability in exterior conditions, their use is mostly limited to non-structural interior applications. Exposure to varying ambient conditions such as humidity, temperature and sunlight alters the chemical and physical properties of WPCs. Past studies have shown that changes in ambient humidity and temperatures may have an adverse effect on physical and mechanical properties of the WPCs [38-41]. The processing method can also affect the moisture absorption and extruded WPCs tend to absorb greater moisture than compression or injection moulded products [42]. In addition to stability, durability is also an important property of WPC

4
for the exterior applications and this is gaining more attention recently. Durability of the WPC made from virgin thermoplastics with organic fillers (such as wood, natural fibres and rice hull) exposed to biological organisms [43, 44] and ultraviolet radiation (UV) [45-48] have been investigated. There are limited reports available for the freeze-thaw durability of WPCs made from virgin thermoplastic and wood or natural fibres [49-51]. Currently, freeze-thaw and UV durability of WPCs made from recycled thermoplastics and wood flour is not known. If WPCs are to be used in different environmental conditions, it is essential to investigate the product stability, durability, and influences of the material composition, processing methods and environmental conditions. In conclusion, stability and durability performance of WPCs based on post-consumer thermoplastic are not fully understood and the affecting factors are not known, leaving open research opportunities for the optimisation of formulation and processing. WPCs performance can be optimized by investigating a wide range of composite formulations and processing techniques. Considering the potentials for applications and resource availability, PP and HDPE were chosen as the raw materials to produce the WPCs with wood flour through the compression moulding. Dimensional stability, durability, mechanical and thermal properties need to be investigated. Influence of polymer type and form (virgin and recycled), coupling agents and additives were also examined. 1.2 Objectives The overall objective of this study is to develop and investigate the performance of WPCs product made of post-consumer recycled plastics and sawdust with focus on stability and durability with various composite formulations. The performances of WPCs made from the recycled plastics are compared with those made of virgin plastics for the same composite formulations. In order to achieve the overall objective, specific targets are defined as follows:
1. Identify post-consumer plastics that are suitable for wood-plastic composites. 2. Prepare formulations of WPCs from extensive literature review and produce
WPC panels using compression moulding based on the defined formulations with variables of wood content, plastics type and form, and coupling agent.

5
3. Investigate dimensional stability, thermal properties, mechanical properties and morphological properties of WPCs made from both recycled and virgin high-density polyethylene (HDPE) and polypropylene (PP) with the wood flour.
4. Analyse fundamental wood flour-plastic adhesion and interface phenomenon in WPC panels by the scanning electron microscopy.
5. Investigate the long-term water absorption and thickness swelling behaviour of WPCs by water immersion.
6. Investigate the durability performance by exposing WPCs to accelerated freeze-thaw cycles, and UV radiation with water spray in order to simulate the outdoor environmental conditions.
7. Investigate the dimensional stability, flexural and thermal properties of WPCs with incorporation of nanoclays in the composite formulation to enhance these properties.
8. Simulate the temperature profiles during the hot pressing cycles of WPC manufacturing process.
6
1.3 Literature review 1.3.1 General background
Composite is a material formed with two or more components, combined as a macroscopic structural unit with one component as continuous matrix, and other as fillers or reinforcements. Normally, the matrix is the material that holds the reinforcements together and has lower strength than the reinforcements. In the plastic based composites, the polymers, either thermoplastics or thermoset, act as a matrix and fibres of wood or other natural fibres are fillers. The reinforcing fibres are the main load-carrying component in the composites. It provides high strength and stiffness as well as resistance to bending and breaking under the applied stress. Interface bonding between the fillers and the matrix is the key to transfer the stress from the matrix into the fillers across the interface. The interface adhesion between the polymer matrix and wood fillers can be improved using coupling agents. The coupling agents will form a bond between the fibres and the matrix through the improved compatibility (wettability) and developing a mechanical or chemical bonding (details given in 1.3.7). To achieve the required properties of the composites, properties of both the fibres and the matrix are important although the extent of the influence of the fibres and the matrix may vary depending on the required properties of the composite. The tensile strength of short fiber composite is more sensitive to polymer matrix properties, whereas elastic modulus is more strongly dependent on the fibre properties [52]. As WPC contained a low-density plastic matrix reinforced with stiff wood fibres, polymer matrix is stretched more under the same stress as to the fibres due to lower modulus than the fibres. Therefore, stiffness of the matrix has impact that is more significant on the overall stiffness of the composite and the stiffness of the composite is more sensitive to the properties of the matrix than the fillers.
1.3.2 Applications of WPCs 1.3.2.1 Building products The building products are the largest market for WPCs [4] which include decking, fencing, garden furniture, exterior windows and doors etc. As compared to solid wood, WPCs have advantages of lower maintenance, higher durability, and more resistance to
7
warping and splintering. Since WPCs usually have lower mechanical properties than solid wood, it is not suitable for applications where strength and stiffness are critical. 1.3.2.2 Infrastructures Marine use and railroad crossties are major applications of WPCs in infrastructure sector. As WPCs do not contain toxic preservatives such as chromated copper arsenate (CCA) that may leak into seawater and cause environmental problems, the WPCs can replace the preservative-treated lumber for marine use. This has great potential because high quality wood is becoming less and less available because of restriction on the logging of native species and tropical hardwood. Also the WPC use for railroad crossties appear to be suitable due to the stable and durable properties under tough conditions [4]. 1.3.2.3 Transportation Automotive and highway applications of the WPCs are also found in the transport sector where the WPCs are used as substrates for interior of door panels, roof headliners, seat backs, spare tone covers, and trunk-liners in automobiles. Vinyl, carpeting and other coverings are applied later to cover the substrates [4, 5]. Highway applications include the highway signs, noise barrier, guardrail posts, and fence posts. 1.3.3 Wood filler in WPCs Wood has been used as reinforcing filler in thermoset polymer for decades, however, its use in thermoplastics is a relatively new spurred by improvement in processing technology and development of coupling agents. Use of wood as the filler in WPCs has advantages such as low-cost, renewable, biodegradability, low specific gravity, and low abrasion to equipment as compared with inorganic fillers (e.g. glass fibres and clay). Commonly used wood species for WPCs manufacturing are pine, maple and oak, although other species can also be used. As the physical, chemical and micro-structural properties of wood species depends on the type of species such as for softwood and hardwood. Hence selection of wood species for the use in WPCs could have a significant influence on the microstructure and properties of WPCs [25]. The wood may have the forms of sawmill chips, sawdust, wood flour, wood fibres, wood powder, or

8
pulp are available for WPCs production [53]. However, for the plastic based composites, the wood should be grounded to fine flour or refined to fibres. When wood flour is used, the wood flour reinforcement to the plastic is not through individual fibres but through particulates consisting of broken fibre bundles of wood. Maiti and Singh [13] examined influence of wood flour size that was compounded with HDPE followed by extrusion moulding. They found that the extruded samples displayed an increasing Young’s modulus with the wood flour particle size in the range of 180-425µm. Tajvidi et al. [54] studied extruded composite made from Reed flour-PP with particle sizes ranged from 20-40 mesh to smaller than 100 mesh sizes. It was reported that lowest water absorption and thickness was found with smallest particle size. Stark NM et al. [55] had reported the composites made from wood flour-PP with various sizes of wood particles (35, 70, 120, and 235 mesh) showed that aspect ratio, not particle size, had the greatest effect on strength and stiffness. However in case of wood fiber, the tensile strength and Young’s modulus was found to decrease and failure strain increased with decreasing of average fiber length in composites with the aspect ratio of wood fiber calculated to be between 16 and 26. This higher aspect ratio enhanced stress transfer from the matrix to the fiber. The use of wood fiber had little effect on impact energy. Most commercially manufactured wood flours used as fillers in thermoplastics are less than 0.425mm (40 mesh size), which has the aspect ratio of 3.4 [56]. Very fine wood flours can cost more and increase melt viscosity more than coarser wood flours, but composites made with them typically have more uniform appearance and a smoother finish. If ground too finely, fiber bundles become wood dust, fragments that no longer resemble fibers or fiber bundles. 1.3.3.1 Chemical composition of wood Wood is classified as a lignocellulosic material and made up of three major chemical constituents (cellulose: 45-50%, hemi-cellulose: 20-25%, and lignin: 20-30%) and other minor constituents (ash: 0-0.5% and extractives: 1-10%) [57, 58]. The chemical composition of wood varies between wood species. The major constituents of wood are briefly explained below.

9
Cellulose Cellulose is the most abundant and the main structural component of wood. The cellulose molecule is long, straight linear chain of homo-polymer consisting of three elements namely carbon, hydrogen, and oxygen, which are organised into anhydro d- glucopyranose linked via β1, 4 glycosidic bonds (Fig. 1.1). It is a highly crystalline, linear polymer of anhydroglucose units with a degree of polymerization of around 10,000. It is the main component providing the wood strength and structural stability. Cellulose is typically 60-90% crystalline by weight. The arrangement of molecular cellulose is due largely to the surface hydroxyl groups. A high portion of cellulose is crystalline, held together by intermolecular hydrogen bonding. The hydroxyl groups can be between glucose units in the same molecule (intra-molecular) or between two adjacent molecules (intermolecular linkages). The hydroxyl groups on cellulose are largely responsible for its reactive nature. The cellulose is hygroscopic because it consists of polar molecules and easily undergoes hydrogen bonding [57]. Water absorption by cellulose depends on the number of free hydroxyl groups, not those linked with each other. The water molecules cannot enter the crystalline region but can reside in the amorphous regions.
Fig. 1.1. Segment of a cellulose molecule showing linear and unbranched structure [59] Hemicelluloses Hemicelluloses consist of a collection of polysaccharide with lower degree of polymerization than cellulose. Its structure is similar to that of the cellulose in the way that the hemicelluloses are arranged in 5 or 6 carbon sugars in chains. However, chains are relatively short and less regular compared to the cellulose, therefore, the

10
hemicelluloses are soluble or easily degraded. The degree of polymerization is only tens or hundreds of repeating units. Lignin Lignin is a binding agent that holds cellulose fibres together. This is a brittle and relatively inert material acting as both bonding and stiffening agent. Diffusion of lignin into the fibre wall increases the stiffness of the wood cell and allows for stress transfer between matrix and fillers in the WPCs. It is comprised of carbon, hydrogen and oxygen. Lignin is not as active as cellulose due to low occurrence of hydroxyl sites. 1.3.3.2 Waste wood for reinforcing filler The large amount of wood waste is generated at different stages in the wood processing and a proportion of this waste is mainly destined for landfill although major part of the wood processing waste used for energy. About 1,038,996 m3 round wood equivalents of wood chip residuals (wood off-cuts, slab wood, planer shavings and sawdust) was produced by New Zealand forest industry in 2002, which are mostly from radiata pine forest [60]. The use of waste wood in WPCs helps to offset these disposal costs. The waste wood in the form of sawdust, fibres or pulp are suitable filler for polyolefin’s matrix composites [13, 14]. The Pinus radiata fibre possesses physical and mechanical properties suited to the reinforcement of plastics [15]. According to Lightsey et al. [61] there was little difference in tensile modulus of composites made either from wood flour or pulp mill wood residue with HDPE matrix. Wood particles for the use in WPCs need to be dried to 0-2% moisture content to process adequately with thermoplastic polymers. Due to the thermal stability of wood under temperature of 200ºC, most common thermoplastics (PE, PP, PS, and PVC) are easily processed with wood below this thermal decomposition temperature [5]. 1.3.4 Polymers in WPCs In the production of WPCs, both thermoplastics and thermoset plastics can be used. Thermoplastics are based on linear or slightly branched polymers in which the molecular chains flow over each other. This type of plastics is in solid form at ambient temperature and becomes deformable at elevated temperatures, and the process of

11
hardening at low temperatures and softening at high temperatures is reversible. It can go through a number of melting-freezing cycles without appreciable chemical changes, which makes it suitable for recycling [62]. On the other hand, thermosets are network polymers formed by cross-linking reactions and cannot be re-melted. Thermoset resins such as phenolics and epoxies are generally used in structures that require higher mechanical properties or integrity at higher temperatures. Polyethylene (PE) is one of the thermoplastic polymers consisting of long chains of the monomer ethylene (CH2=CH2), and is produced through polymerization of ethane, and contains small proportions of additives. There are two major categories in PE: high-density polyethylene (HDPE) and low-density polyethylene (LDPE). HDPE has a density of greater than or equal to 0.941 g/cm3 and low degree of branching and thus demonstrates strong intermolecular strength. It exhibits greater rigidity and physical strength and has a higher melting point (130-135 oC) than the LDPE, but the HDPE has lower resistance to stress cracking. The HDPE is commonly used as containers and packaging such as milk jugs, detergent bottles, garbage containers and water pipes. The mechanical properties of PE depend strongly on variables such as the extent and type of branching, the crystal structure and the molecular weight. Polypropylene (C3H6)x (PP) is also one of the thermoplastics with a semi-crystalline polymer structure similar to PE and is produced through polymerization of propylene gas. PP has an excellent resistance to stress, low specific gravity, and good mechanical properties such as excellent impact strength. It has a melting point of 160-165 oC, and has low density (0.85 g/cm3 with amorphous, 0.95 g/cm3 with crystalline) and higher stiffness and strength than HDPE. It is used in a wide range of applications, including food packaging, plastic parts and reusable containers of various types. There are three different types of PP: homopolymer, random copolymer and impact or block copolymer. The comonomer used is typically ethylene. Ethylene-propylene rubber added to PP homopolymer increases its low impact strength at low temperatures. Randomly polymerized ethylene monomer added to PP homopolymer decreases the polymer crystallinity and makes the polymer more transparent. Impact copolymer PP is

12
expensive than homopolymer polypropylene. Random copolymer PP is more expensive than the impact copolymer PP. The melt flow rate (MFR) or melt flow index (MFI) is an indicator of thermoplastic molecular weight. It is used to determine how easily the melted raw material will flow during processing. Higher MFR plastics fill the plastic mould more easily during the injection or blow moulding production process. As the MFI increases, however, some physical properties, like impact strength will decrease. Thermoplastics are commonly used as matrix materials for wood or other natural fibre composites. The thermoplastics in these composites should have a processing temperature less than the thermal degradation temperature of wood (~200oC). Due to the limited thermal stability of wood, thermoplastics that meet this requirements include LDPE, HDPE, PP, PS and PVC, which are suitable for use in WPCs in both virgin and recycled form [4, 5]. Although PVC was the first thermoplastic commercially used in WPC manufacturing [2], PE is now the most commonly used type followed by PP for WPCs among the entire thermoplastics [4]. The WPCs made from PE are widely used for exterior building components such as decking, fencing, and infrastructure, while PP composites are mainly for transportation applications. 1.3.5 Plastics in municipal solid waste Growing production and consumption of plastics worldwide has resulted in significant contribution to municipal solid waste as described in the first section of this chapter (Section 1.1). Rrecycling of the waste plastics has benefits of minimising solid waste disposal problem, reducing the virgin plastics consumption and lowering the production costs. A number of reclamation techniques have been developed to obtain well sorted plastics that can be used or substitute for the virgin plastics in many applications [62]. Past studies shown that the recycled plastics possess similar mechanical properties and are cheaper than in the virgin form. Pattanakul et al. [10] found that the mechanical properties of recycled HDPE from the post-consumer milk bottles were not largely different from those of virgin resin. Recycled HDPE pellets and flakes are 31-34% less expensive than the virgin HDPE [11]. About 40% of all recycled plastics products were

13
used in distribution products such as film and bags, and ~30% were used in building applications such as pipes, windows and tiles in Western Europe [8]. There is a greater potential to use recycled plastics to produce WPC products in low cost without reduced properties. 1.3.6 Recycled thermoplastic in WPCs In a similar way as for the virgin plastics, any recycled plastics that can melt and be processed below the degradation point of wood can be used for manufacturing WPCs [63]. However, limited studies were conducted to evaluate the performance of the WPCs made from recycled HDPE [23, 25, 27, 64-66] and PP [26, 67] with wood flour. Kamdem et al. [23] studied the properties of compression moulded composites made from the rHDPE and wood flour. Selke et al. [25] and Yam et al. [65] studied the rHDPE (simulated milk gallon) and wood fibre composites using extrusion moulding. Li et al. [66] studied compression moulded composites based on a combination of virgin HDPE and
recycled HDPE with waste pine wood flakes. The mechanical properties of the compression-moulded composites made from sawdust and virgin PP and recycled PP was studied by Najafi et al. [26] who reported that the composites containing PP (25% each of virgin and recycled) were exhibited statistically similar mechanical properties to those of composites made from virgin plastics. Li et al. [67] examined the impact strength for the composite made from pine sawdust and recycled PP with coupling agent Epolene E-43. Sellers et al. [64] studied the WPC panels using recycled PE or polystyrene (PS) and pine wood fibres at a ratio of 50:50 through high pressure pressing moulding. They reported that the products had good mechanical properties suitable for construction materials. A study by Jayaraman et al. [27] showed that the tensile strengths of WPCs made from wood fibres (pine) and recycled HDPE are about 25% higher than those of the entirely virgin HDPE panel. 1.3.7 Improvement of interfacial bonding in WPCs The processing and desired properties of WPCs can be improved by using additives such as lubricants, coupling agents, antioxidants, UV-absorbers and antimicrobial agents among others [31]. WPCs properties depends on many factors including the species and forms of the wood filler, types and forms of polymer matrix, compatibility

14
and chemical bonding of the wood fillers and polymer matrix, and processing methods used. The mechanical properties of WPCs depended on the interfacial bonding between the wood fillers and polymer matrix [68]. Therefore, the interface bonding between the wood filler and polymer matrix has to be strong enough to transfer stress from the polymer matrix to wood fillers. However, interface between the wood filler and polymer matrix is weak due to the incompatibility between the hydrophobic wood filler and the hydrophilic polymer matrix. In this case, addition of coupling agent is necessary to improve the compatibility and interfacial bonding between the wood filler and polymer matrix [31, 69]. Functionalised polyolefin’s coupling agents with maleic anhydride grafted polymer (LLDPgMA, HDPEgMA, HDPEgAA, and PPgMA) has been using in WPCs to improve the compatibility and bonding between hydrophilic wood filler and hydrophobic polymer matrix [30]. The maleated polypropylene (MAPP) and maleated polyethylene (MAPE) are more commonly used in WPCs and highly regarded as the effective coupling agents [30, 68, 70, 71]. These coupling agents improved the overall performance of the WPCs through the improved compatibility (wettability) and chemical bonding between the wood filler and polymer matrix. The coupling agents acting as hydrophobic wetting agents, which displace the water and air to give a more stable and uniform dispersion of particles. The melt viscosity, which increases with the filler loadings is lowered when coupling agents used in the processing. Furthermore, wood dispersion and wettability in plastic matrix can be improved by the wetting agents (lubricants) such as metallic stearates, fatty acids, and paraffin wax [72]. The wetting agents forms protective layers around the filler thereby improved the dispersion. It also promotes bonding by allowing the polymer melt to wet the solid surface more efficiently. The essential difference between a wetting agent and a coupling agent is that coupling agent forms a chemical bond with the solid inclusion whereas a lubricant does not. In addition, the coupling agent improved the bonding between hydrophilic wood fibre and hydrophobic polymer matrices by forming bridges of chemical bonds between the fibre and the matrix. Fundamentals on the influence of the coupling agents have been investigated and it is widely believed that the functionalized polyolefin coupling agents in WPCs formulation improved interface bonding between the polymer and wood flour through the esterification mechanism [59, 73]. Such improvement is due to the formation of ester bonds between the anhydride moieties of coupling agents entered
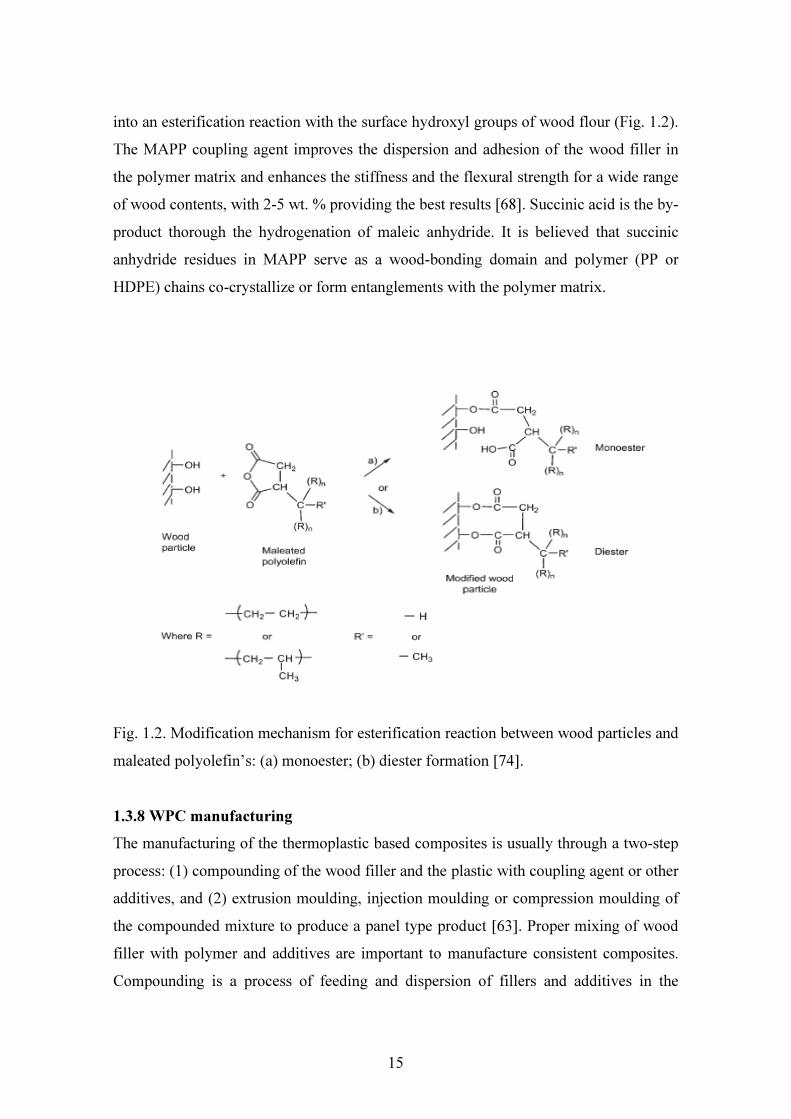
15
into an esterification reaction with the surface hydroxyl groups of wood flour (Fig. 1.2). The MAPP coupling agent improves the dispersion and adhesion of the wood filler in the polymer matrix and enhances the stiffness and the flexural strength for a wide range of wood contents, with 2-5 wt. % providing the best results [68]. Succinic acid is the by-product thorough the hydrogenation of maleic anhydride. It is believed that succinic anhydride residues in MAPP serve as a wood-bonding domain and polymer (PP or HDPE) chains co-crystallize or form entanglements with the polymer matrix.
Fig. 1.2. Modification mechanism for esterification reaction between wood particles and maleated polyolefin’s: (a) monoester; (b) diester formation [74]. 1.3.8 WPC manufacturing The manufacturing of the thermoplastic based composites is usually through a two-step process: (1) compounding of the wood filler and the plastic with coupling agent or other additives, and (2) extrusion moulding, injection moulding or compression moulding of the compounded mixture to produce a panel type product [63]. Proper mixing of wood filler with polymer and additives are important to manufacture consistent composites. Compounding is a process of feeding and dispersion of fillers and additives in the

16
molten polymer either using batch or continuous mixtures. The compounding process produces compounded wood plastic pallets with coupling agent or other additives, and the compounding process directly affects the properties of the resultant composite [75, 76]. An appropriate compounding time, mixing temperature and moderate intensity of the mixing improve the compounding quality and the composite properties. The compounding step also reduces the time for extrusion moulding thus reducing the possibility of wood degradation in the moulding. Furthermore, moisture is removed from the wood during compounding, which also improves the quality of final product. Compounding can be carried out in specially designed equipment such as Gelimat mixture, single or twin screw extruder. Mixing of wood filler and plastic can be done in different way depending on the type of equipment, such as pre-drying of the wood and pre-mixing with polymer/or additives, or pre-drying and split feeding the material into an extruder [58]. The compounded materials can be immediately shaped into product (in extrusion moulding and injection moulding) or formed into pellets for future press moulding. Extrusion, injection and compression mouldings are common processing methods for WPCs manufacturing. The processing methods and operation conditions influence the morphology of the composites and their properties. In large scale production, the WPCs can be produced with flat platen pressing through initial fast press closing, lateral confinement and final cooling under pressure [77]. The previous studies show that the hot platen press system is suitable for producing flat and curved composite panels using thermoplastic and wood filler. 1.4 References [1] Pritchard G. Second-generation wood composites: the US shows Europe the way,
Reinforced Plastics. 2005;49(6):34-35. [2] Schut JH. For compounding, sheet and profile: wood is good. Plastics Technology
1999;45(3):46-52. [3] Smith PM, Wolcott MP. Opportunities for wood/natural fiber-plastic composites in
residential and industrial applications. Forest Products Journal 2006;56(3). [4] Optimat Ltd. and MERL Ltd. Wood plastic composites study - technology and UK
market opportunities. The Waste and Resources Action Programme 2003:1-100.

17
[5] Youngquist JA, Myers GE, Muehl JH, Krzysik AM, Clemens CM, and Padella F. Composites from recycled wood and plastics: a project summary: US- Environment Protection Agency; 1994.
[6] Hannequart J-P, editor. Good practice guide on waste plastics recycling: A guide by and for local and regional authorities: Association of Cities and Regions for Recycling (ACRR), Belgium, 2004.
[7] USEPA. Municipal Solid Waste in the United States: 2005 Facts and Figures In, U.S. EPA, Municipal and Industrial Solid Waste Division, Washington, 2006.
[8] Plastics Europe. Plastics in Europe: an analysis of plastics consumption and recovery in Europe: Association of Plastics Manufacturers; 2004.
[9] Plastics New Zealand. Sustainable End-of-Life Options for Plastics in New Zealand: Plastics New Zealand; 2005.
[10] Panthapulakkal S, Law S, Sain M. Properties of recycled high-density polyethylene from milk bottles. Journal of Applied Polymer Science 1991;43(11):2147-50.
[11] Powell J. Plastics Recycling Update: Resource Recycling, Portland, OR. 1999. [12] Falk RH, Mckeever DB. Recovering wood for reuse and recycling, a United States
perspective. European COST E31 Conference Management of Recovered Wood Recycling Bioenergy and other Options. University studio press 2004. 29-39.
[13] Maiti SN, Singh K. Influence of wood flour on the mechanical properties of polyethylene. Journal of Applied Polymer Science 1986;32(3):4285-89.
[14] Woodhams RT, Thomas G, Rodgers DK. Wood fibers as reinforcing fillers for polyolefins. Polymer Engineering & Science 1984;24(15):1166-71.
[15] Miller NA, Stirling CD, Langford VSM. Pinus radiata fibre/ thermoplastic composite materials. In: Proceedings of the Second Pacific Rim Bio-based Composite Symposium; 1994; Vancouver, Canada; 1994. 47–54.
[16] Raj RG, Kokta BV. Reinforcing high density polyethylene with cellulosic fibers. I: The effect of additives on fiber dispersion and mechanical properties. Polymer Engineering and Science 1991;31(18):1358-62.
[17] Lu JZ, Wu Q, Negulescu II. Wood-fiber/high-density-polyethylene composites: coupling agent performance. Journal of Applied Polymer Science 2005;96:93-102.
[18] Razi PS, Raman A, Portier R. Studies on mechanical properties of wood-polymer composites. Journal of Composite Materials 1997;31(23):2391-401.

18
[19] Stark NM, Matuana LM. Surface chemistry and mechanical property changes of wood-flour/high- density-polyethylene composites after accelerated weathering. Journal of Applied Polymer Science 2004 94(6 ):2263-73.
[20] Stark NM. Influence of moisture absorption on mechanical properties of wood flour–polypropylene composites. Journal of Thermoplastics Composites Materials 2001;14:421-32.
[21] Stark NM, Matuana ML. Ultraviolet weathering of photostabilised wood-flour filled high-density polyethylene composites. Journal of Applied Polymer Science 2003;90:2609-17.
[22] Rangaraj SV, Smith LV. Effects of moisture on the durability of a wood/thermoplastic composite. Journal of Thermoplastic Composite Materials 2000;13(2):140-61.
[23] Kamdem DP, Jiang H, Cui W, Freed J, Matuana LM. Properties of wood plastic composites made of recycled HDPE and wood flour from CCA-treated wood removed from service. Composites Part A: Applied Sciences and Manufacturing 2004;35.
[24] Yam KL, Gogoi BK, Christopher CL, Selke SE. Composites from compounding wood fibers with recycled high density polyethylene. Polymer Engineering & Science 1990;30(11):693-99.
[25] Selke SE, Wichman I. Wood fibre/polyolefin composites. Composites Part A: Applied Sciences and Manufacturing 2004;35:321-26.
[26] Saeed KN, Elham HM Tajvidi. Mechanical properties of composites from sawdust and recycled plastics. Journal of Applied Polymer Science 2006;100(5):3641-45.
[27] Jayaraman K, Bhattacharya D. Mechanical performance of wood fibre–waste plastic composite materials. Resources, Conservation and Recycling 2004;41(4):307-19.
[28] Lin Q, Zhou X, Dai G. Effect of hydrothermal environment on moisture absorption and mechanical properties of wood flour–filled polypropylene composites. Journal of Applied Polymer Science 2002;85:2824–32
[29] Keener TJ, Stuart RK, Brown TK. Maleated coupling agents for natural fibre composites. Composites Part A: Applied Science and Manufacturing 2004;35:357-62.
19
[30] Wang Y, Yeh FC, Lai SM, Chan HC, Shen HF. Effectiveness of functionalized polyolefin as compatibilizers for polyethylene/wood flour composites. Polymer Engineering and Science 2003;43(4):933-45.
[31] Jayamol G, Sreekala MS, and Thomas S. A review of interface modification and characterization of natural fibre reinforced plastics composites. Polymer Engineering and Science 2001;41(9).
[32] Mishra S, Naik JB. Absorption of water at ambient temperature and steam in wood-polymer composites prepared from agrowaste and polystyrene. Journal of Applied Polymer Science 1998;68(4):681-86.
[33] Wang W, Morrell JJ. Water sorption characteristics of two wood-plastic composites. Forest Products Journal 2004;54(12):209-12.
[34] Marcovich NE, Reboredo MM, Aranguren MI. Moisture diffusion in polyester-wood flour composites. Polymer 1999;40(26):7313-20.
[35] Espert A, Francisco V, Sigbritt K. Comparison of water absorption in natural cellulosic fibres from wood and one-year crops in polypropylene composites and its influence on their mechanical properties. Composites Part A: Applied Science and Manufacturing 2004;35(11):1267-76.
[36] Gupta KM, Pawar SJ. A nonlinear diffusion model incorporating edge and surface texture effects to predict absorption behaviour of composites. Materials Science and Engineering A 2005;412(1-2):78-82.
[37] Wang W, Sain M, Cooper PA. Study of moisture absorption in natural fiber plastic composites. Composites Science and Technology 2006;66(3-4):379-86.
[38] Marcovich NE, Reboredo MM, Aranguren MI. Dependence of the mechanical properties of wood flour-polymer composites on the moisture content. Journal of Applied Polymer Science 1998;68:2069-76.
[39] Sombatsompop M and Chaochanchaikul K. Effect of moisture content on mechanical properties, thermal and structural stability and extrudate texture of PVC/wood sawdust composites. Polymer International 2004;53:1210-18.
[40] Wang W, Morrell JJ. Effects of moisture and temperature cycling on material properties of a wood/plastic composites. Forest Products Journal 2005;55(10):81-83.

20
[41] Xue Y, Veazie DR, Glinsey C, Horstemeyer MF, Rowel RM. Environmental effects on the mechanical and thermomechanical properties of aspen fiber-polypropylene composites. Composites Part B: Engineering 2007;38:152-58.
[42] Clemons CM, Ibach RE. Effects of processing method and moisture history on laboratory fungal resistance of wood-HDPE composites. Forest Products Journal 2004;54(4):50-57.
[43] Schauwecker C, Morrell JJ, McDonald AG, Fabiyi JS. Degradation of a wood-plastic composite exposed under tropical conditions. Forest Products Journal 2006;56(11/12):123-29.
[44] Verhey SA, Laks PE. Wood particle size affects the decay resistance of woodfiber/thermoplastic composites. Forest Products Journal 2002;52(11/12):78-81.
[45] Matuana LM, Kamdem DP, Zhang J. Photoaging and stabilization of rigid PVC/wood-fiber composites. Journal of Applied Polymer Science 2001;80:1943-50.
[46] Stark NM, Matauna LM. Influence of photostabilizers on wood flour-HDPE composites exposed to xenon-arc radiation with and without water spray. Polymer Degradation and Stability 2006;91:3048-56.
[47] Lundin T, Cramer SM, Falk RH, and Felton C. Accelerated weathering of natural fibre-filled polyethylene composites. Journal of Materials in Civil Engineering 2004;16(6):547-55.
[48] Li R. Environmental degradation of wood-HDPE composite. Polymer Degradation and Stability 2000;70:135-45.
[49] Pilarski JM, Matauna LM. Durability of wood flour-plastic composites exposed to accelerated freeze-thaw cycling. II. High density polyethylene matrix. Journal of Applied Polymer Science 2006;100:35-39.
[50] Pilarski JM, Matauna LM. Durability of wood flour-plastic composites exposed to accelerated freeze-thaw cycling. Part I. Rigid PVC matrix. Journal of Vinyl & Additive Technology 2005;11:1-8.
[51] Panthapulakkal S, Law S, Sain M. Effect of water absorption, freezing and thawing, and photo-ageing on flexural properties of extruded HDPE/rice husk composites. Journal of Applied Polymer Science 2006;100:3619-25.
[52] Sahab DN, Jog JP. Natural fibre polymer composites: A review. Advanced polymer technology 1999;18(4).

21
[53] Bledzki K, Reihmane S, Gassan J. Thermoplastics reinforced with wood fillers: a literature review. Polymer-Plastics Technology and Engineering 1998;37(4):451-68.
[54] Tajvidi M, Azad A. Effect of particle size, fiber content and compatibilizer on the long-term water absorption and thickness swelling behaviour of reed flour/polypropylene composites. Journal of Reinforced Plastics & Composites 2008; doi: 10.1177/ 0731684408091954.
[55] Stark NM, Rowlands R. Effects of wood fiber characteristics on mechanical properties of wood/polypropylene composites. Wood and Fiber Science 2003; 35(2):167-74.
[56] Xanthos M, editor. Functional fillers for plastics: WILEY-VCH Verlag GmbH & Co KGaA, 2005.
[57] Jiang H, Kamdem DP. Development of Poly (vinyl chloride)/wood composites: a literature review. Journal of Vinyl and Additive Technology 2004;10(2).
[58] Kininmonth JA. and Whitehouse LJ. Properties and Uses of New Zealand Radiata Pine: Forest Research Institute, Rotorua, 1991.
[59] Stokke DD, Gardner DJ. Fundamental aspects of wood as a component of thermoplastic composites. Journal of Vinyl & Additive Technology 2003;9:96-104.
[60] Kazayawoko M, Balatinecz JJ, Woodhams RT. Diffuse reflectance Fourier transform infrared spectra of wood fibers treated with maleated polypropylenes. Journal of Applied Polymer Science 1997;66(6):1163-73.
[61] Statistics New Zealand. Physical Flow Account for Forestry Resources in New Zealand 1995 – 2000; 2002.
[62] Lightsey GR, Short PH, Sinha VKK. Low cost polyolefin composites containing pulp mill wood residue. Polymer Engineering & Science 1977;17(5):305-10.
[63] Mantia FL, editor. Hand book of plastics recycling: Rapra Technology, UK, 2002. [64] Clemons C. Wood-plastics composites in the United States: The interfacing of two
industries. Forest Product Journal 2002;52(6). [65] Sellers T Jr., Miller GD Jr., and Katabian M. Recycled thermoplastics reinforced
with renewable lignocellulosic materials. Forest Product Journal 2000;50(5):24-28. [66] Yam KL, Gogai BK, Lai CC, Selke SE. Composites from compounding wood
fibers with recycled high density polyethylene. Polymer Engineering & Science 1990;30(11):693-99.

22
[67] Rongzhi Li, Lin Y, Wing Y. Effect of polyethylene particle geometry on mechanical properties of compression moulded wood-polyethylene composites. Plastics, Rubber and Composites Processing and Applications 1997 26(8):368-71.
[68] Li TQ, NG CN, Li RKY. Impact behavior of sawdust/recycled-PP composites. Journal of Applied Polymer Science 2001;81:1420-28.
[69] Raj RG, Kokta BV. Reinforcing high density polyethylene with cellulosic fibers. I: The effect of additives on fiber dispersion and mechanical properties. Polymer Engineering & Science 1991;31(18):1358-62.
[70] Jacob M, Joseph S, Pothan LA, and Thomas S. A study of advances in characterization of interfaces and fiber surfaces in lignocellulosic fiber-reinforced composites. Composite Interfaces 2005;12(1-2):95-124.
[71] Gauthier R, Joly C, Coupas AC, Gauthier H, and Escoubes M. Interfaces in polyolefin/cellulosic fiber composites: Chemical coupling, morphology, correlation with adhesion and aging in moisture. Polymer Composites 1998;19(3):287-300.
[72] Keener T and Brown T. EpoleneTM maleated polyethylene coupling agents. In: Proceedings of seventh international conference on wood-fibre-plastic composites; 2002; Wisconsin, USA.; 2002.
[73] Matuana LM, Balatinecz JJ, Sodhi RNS, Park CB. Surface characterization of esterified cellulosic fibers by XPS and FTIR spectroscopy. Wood Science and Technology 2001;35(3):191-201.
[74] Carlborn K, Matuana LM. Composite materials manufactured from wood particles modified through a reactive extrusion process. Polymer Composites 2005;26:534–41.
[75] Bledzki AK, Letman M, Viksne A, Rence L. A comparison of compounding processes and wood type for wood fiber-PP composites. Composites Part A: Applied Science and Manufacturing 2005;36:789-97.
[76] Park B-D, Balatinecz JJ. A comparison of compounding processes for wood-fiber/thermoplastic composites. Polymer Composites 1997;18(3):425-31.
[77] Wolcott MP. Formulation and process development of flat-pressed wood-polyethylene composites. Forest Product Journal 2003;53(9).
23
CHAPTER 2 EXPERIMENT
2.1 Introduction Wood-plastic composite (WPC) has emerged as a dynamic growth material in residential and industrial applications [1]. However, these applications are confined mostly in interior non-structural purposes like automotive, furniture, or building industry although exterior wood market is the main target for WPC. The mechanical properties of WPC may not sufficient for heavy loading structure applications; hence, there has been an increasing interest in using WPC material for applications where the stability and durability are important. WPC is manufactured by dispersing wood particles into molten plastic with some additives to form composites through processing technologies such as extrusion, compression, and injection moulding. The polymer matrix, natural/or wood fibre reinforcements, and additive interfaces are the major components of WPC. Most commonly used thermoplastics for the manufacturing of WPC are polyethylene (PE), polypropylene (PP), polystyrene (PS) and poly (vinyl) chloride (PVC) in their virgin as well as recycled form [2]. These thermoplastics have a low melting point allowing them thoroughly mixing with wood flour without thermally degrading the wood fillers. Although PVC was the first thermoplastics used commercially in WPC manufacturing [3], PE is the most commonly used and followed by the PP among these entire thermoplastics for WPCs [4]. Hence, high-density polyethylene (HDPE) and PP thermoplastics were selected for this study based on their consumption pattern, availability in refuge, recyclability and use potential. Considerations have also been made for selecting and developing thermoplastics that are flexible for a variety of manufacturing process. These two plastics are low in cost and readily available in the recycling systems. Sawdust (pinus radiata) was selected as wood filler. The thermoplastics and wood flour (sawdust) used in this study were mainly originated from post-consumer recycling sources. In addition, virgin thermoplastics (HDPE and PP) were used in some composite formulation for the comparative studies.

24
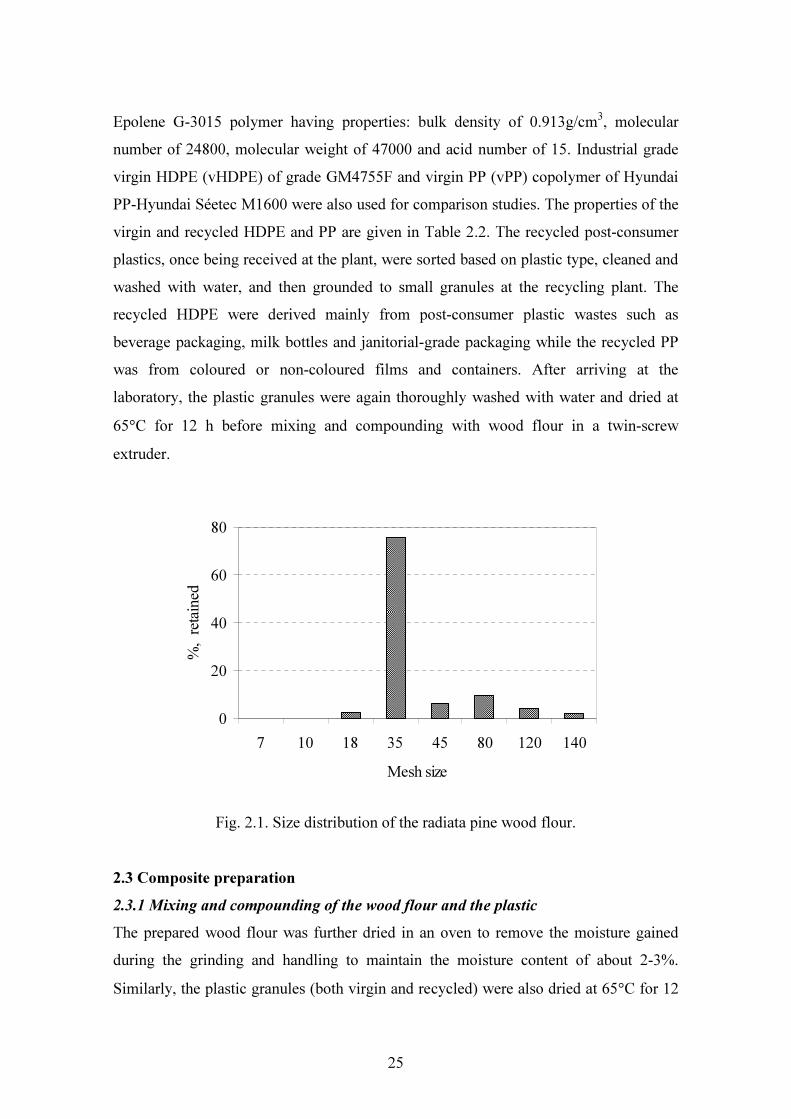
In this study, several formulations of wood-flour and thermoplastic in both virgin and recycled forms were proposed and the composite samples were made through extrusion compounding followed by compression moulding in a hot press. These composite panels were tested to quantify the material performance according to the standard methods outlined in American Standard Testing and Materials (ASTM). Durability performance of these composites was studied by exposing a matched set of specimens to different accelerated weathering process as outlined in the ASTM standards. For the comparative study, a number of WPC samples were made of virgin HDPE and PP plastics using similar formulations to its recycled counterparts. The mechanical properties, dimensional stability and interface bonding properties were assessed based on the composite formulations. In addition to these properties, aesthetic and thermal properties of weathered composites were assessed in order to quantify the effect on service performance due to degradation. As described in Section 2.4, all experimental tests were conducted in accordance with ASTM standard tests as outlined within the corresponding subsections. 2.2 Materials 2.2.1 Wood filler Sawdust of softwood radiata pine (Pinus radiata) was collected from a local company (Canterbury Landscape Supplies Private Ltd., Christchurch). The fresh sawdust received was dried at 103°C for 24 h to a moisture content of about 2-3% and then grounded to finer flour by using a plate grinder. The sieve analysis found that most of the wood particles remained in the 35-45 mesh sizes with corresponding particle diameter ranging between 0.18 and 0.5 mm. Fig. 2.1 shows the wood flour size distribution obtained from the sieve analysis. Typical chemical composition of the radiata pine wood is given in Table 2.1 [5]. 2.2.2 Thermoplastic polymer Both virgin and recycled post-consumer thermoplastics of HDPE and PP were used in this study. The recycled HDPE (rHDPE) and recycled PP (rPP) granules were procured from local plastic recycling plant (New Zealand Plastics Recycling Ltd., Kaipoi, New Zealand). The coupling agent used was maleated polypropylene (MAPP) of grade
25
Epolene G-3015 polymer having properties: bulk density of 0.913g/cm3, molecular number of 24800, molecular weight of 47000 and acid number of 15. Industrial grade virgin HDPE (vHDPE) of grade GM4755F and virgin PP (vPP) copolymer of Hyundai PP-Hyundai Séetec M1600 were also used for comparison studies. The properties of the virgin and recycled HDPE and PP are given in Table 2.2. The recycled post-consumer plastics, once being received at the plant, were sorted based on plastic type, cleaned and washed with water, and then grounded to small granules at the recycling plant. The recycled HDPE were derived mainly from post-consumer plastic wastes such as beverage packaging, milk bottles and janitorial-grade packaging while the recycled PP was from coloured or non-coloured films and containers. After arriving at the laboratory, the plastic granules were again thoroughly washed with water and dried at 65°C for 12 h before mixing and compounding with wood flour in a twin-screw extruder.
0
20
40
60
80
7 10 18 35 45 80 120 140Mesh size
%, re
taine
d
Fig. 2.1. Size distribution of the radiata pine wood flour.
2.3 Composite preparation 2.3.1 Mixing and compounding of the wood flour and the plastic The prepared wood flour was further dried in an oven to remove the moisture gained during the grinding and handling to maintain the moisture content of about 2-3%. Similarly, the plastic granules (both virgin and recycled) were also dried at 65°C for 12

26
h to remove all of the moisture during washing. Then the wood flour was compounded, respectively, with the recycled and the virgin plastic granules (HDPE and PP) in the co-rotating twin-screw extruder (OMC Saronno) which has screw diameter of 19mm, and length and diameter (L/D) ratio of 30. The extruder consisted of four extruding zones (Zone 1, Zone 2, Zone 3, and Zone 4) and a die head as well as different feeding hoppers for wood flour and plastics (Fig. 2.2).
Table 2.1 Chemical composition of radiata pine wood [5]. Wood components Composition (%)* Cellulose 40 Hemi-cellulose and other compounds 31 Lignin 27 Extractives 2 Ash 0.2
*: Based on oven dry mass.
Table 2.2 Physical and mechanical properties of the thermoplastics used in the study. Sl. No. Properties
Virgin HDPE
(GM4755F) Recycled HDPE
Virgin PP (Hyundai M1600)
Recycled PP
1 Density,g/cm3
(ASTMD792) 0.949 - 0.9 -
2 Melt flow index (g/10min, 2.16 kg/190°C)
0.1 0.072 25 21
3 Tensile strength at yield (MPa) 27 26.48
4 Elongation at break (%) 570 - The operation conditions of the extrusion compounding are given in Table 2.3 including extruder barrel temperature at different extruding zones, melt pressure, and screw speed employed for the compounding of both wood flour and plastics (HDPE and PP). The wood flour and the plastic were fed through separate feeders at the extruder. The plastic pellets were firstly fed from the main feeding hopper at the end of the extruder, and then the wood flour was fed through a feeder that is located between Zone 1 and the main

27
feeder of the extruder. The extruded strand coming out from the die head was then passed through a water bath and subsequently palletized. The composite formulations were designed as per the mass proportion in percentage. The plastic composition was varied from 40-100 wt. % while the wood flour varied from 0- 60 wt. % in the composites. In some formulations, coupling agent (MAPP) was added at the proportion of 3 or 5 wt. %. In the text of this chapter and the following chapters, v, r, W and CA will be used to represent virgin, recycled, wood flour and coupling agent and the composition is given by the percentage values (% wt.) in the formulations. In the formulations where the MAPP was added, the plastics mass was reduced correspondingly thus, the total proportion of the plastics and the agent was either 50% (rHDPE47W50CA3 and rHDPE45W50CA5) or 60% (rHDPE57W40CA3). The full formulations used in the experiments are given in Table 2.4.
Fig. 2.2. Twin-screw extruder setup with different extruding zones and feeding hoppers. 2.3.2 Compression moulding of the composite panels Before the panel was made, the compounded pellets were dried at 75°C for 4 h to remove the moisture gained. The pellets were then moulded in an electrically heated platen press by using an aluminium mould coated with a di-butylether releasing agent (Frekote manufactured by Loctite Corporation, Mexico). The target density of the final WPC panel samples was 800-950 kg/m3 varying with the proportion of wood flour and plastics. The platen size of the hot press was 350 mm × 350 mm and clamping force
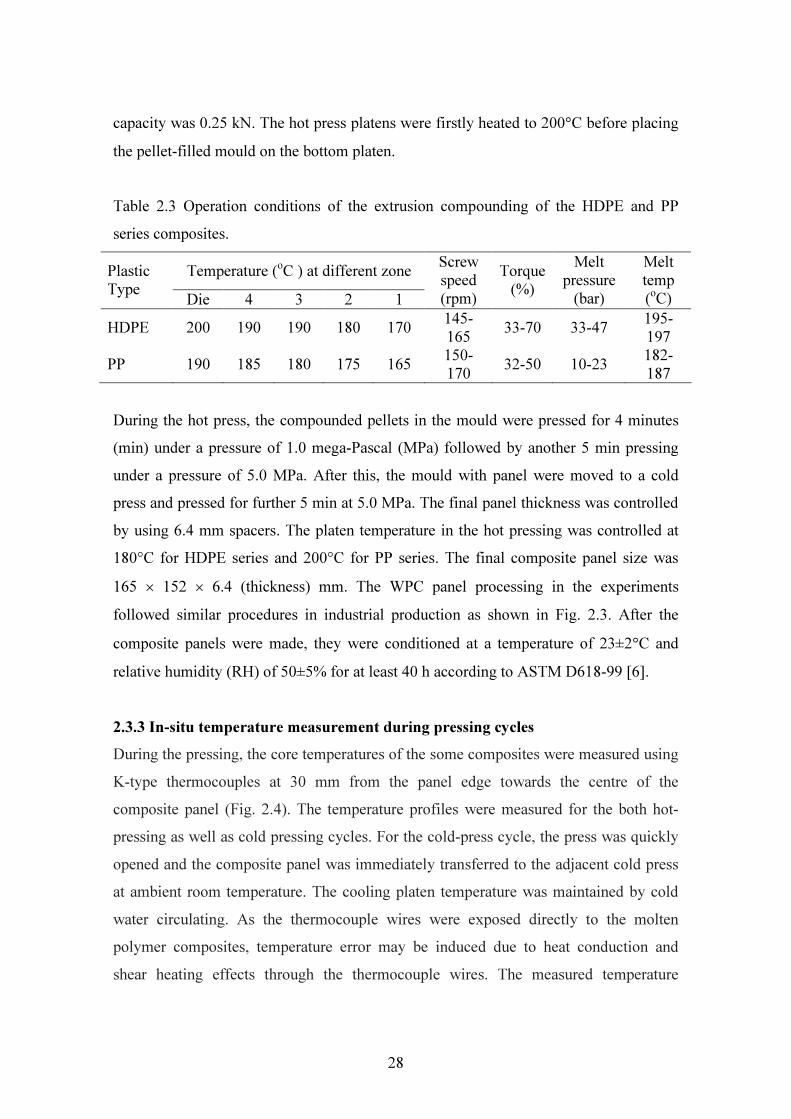
28
capacity was 0.25 kN. The hot press platens were firstly heated to 200°C before placing the pellet-filled mould on the bottom platen. Table 2.3 Operation conditions of the extrusion compounding of the HDPE and PP series composites.
Temperature (oC ) at different zone Plastic Type Die 4 3 2 1
Screw speed (rpm)
Torque (%)
Melt pressure (bar)
Melt temp (oC)
HDPE 200 190 190 180 170 145-165 33-70 33-47 195-
197 PP 190 185 180 175 165 150-
170 32-50 10-23 182-187
During the hot press, the compounded pellets in the mould were pressed for 4 minutes (min) under a pressure of 1.0 mega-Pascal (MPa) followed by another 5 min pressing under a pressure of 5.0 MPa. After this, the mould with panel were moved to a cold press and pressed for further 5 min at 5.0 MPa. The final panel thickness was controlled by using 6.4 mm spacers. The platen temperature in the hot pressing was controlled at 180°C for HDPE series and 200°C for PP series. The final composite panel size was 165 × 152 × 6.4 (thickness) mm. The WPC panel processing in the experiments followed similar procedures in industrial production as shown in Fig. 2.3. After the composite panels were made, they were conditioned at a temperature of 23±2°C and relative humidity (RH) of 50±5% for at least 40 h according to ASTM D618-99 [6]. 2.3.3 In-situ temperature measurement during pressing cycles During the pressing, the core temperatures of the some composites were measured using K-type thermocouples at 30 mm from the panel edge towards the centre of the composite panel (Fig. 2.4). The temperature profiles were measured for the both hot-pressing as well as cold pressing cycles. For the cold-press cycle, the press was quickly opened and the composite panel was immediately transferred to the adjacent cold press at ambient room temperature. The cooling platen temperature was maintained by cold water circulating. As the thermocouple wires were exposed directly to the molten polymer composites, temperature error may be induced due to heat conduction and shear heating effects through the thermocouple wires. The measured temperature
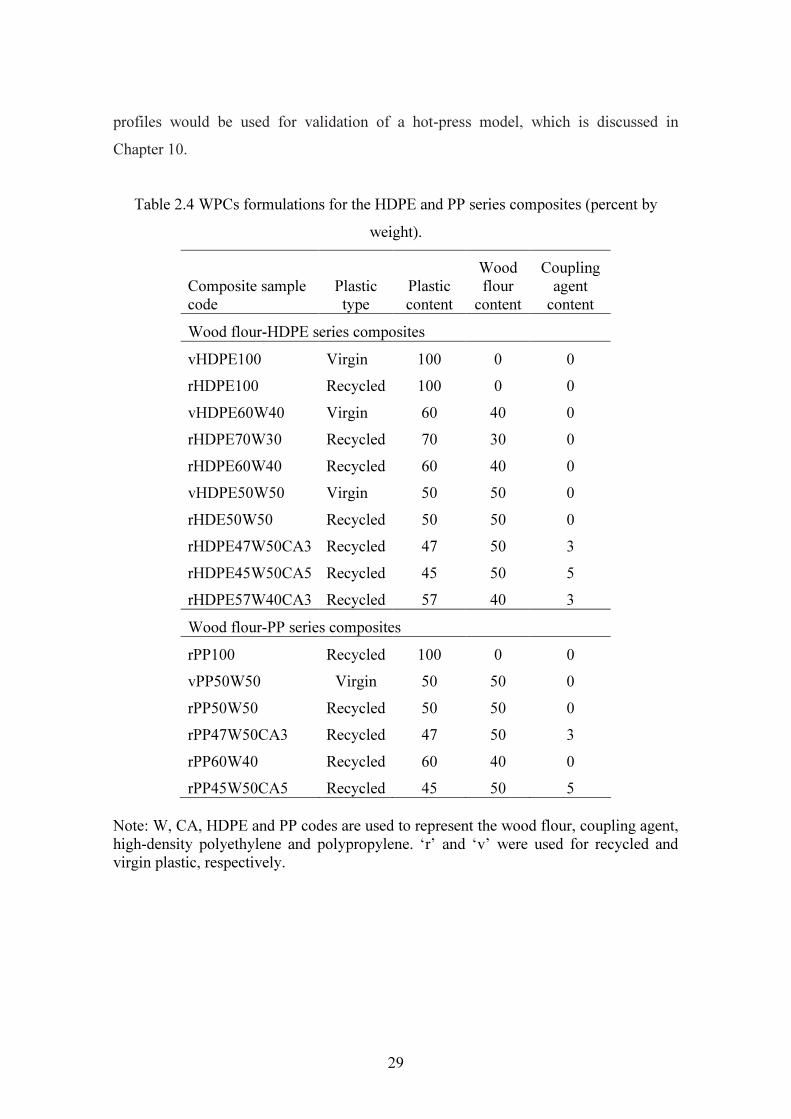
29
profiles would be used for validation of a hot-press model, which is discussed in Chapter 10.
Table 2.4 WPCs formulations for the HDPE and PP series composites (percent by weight).
Composite sample code
Plastic type
Plastic content
Wood flour
content Coupling agent content
Wood flour-HDPE series composites vHDPE100 Virgin 100 0 0 rHDPE100 Recycled 100 0 0 vHDPE60W40 Virgin 60 40 0 rHDPE70W30 Recycled 70 30 0 rHDPE60W40 Recycled 60 40 0 vHDPE50W50 Virgin 50 50 0 rHDE50W50 Recycled 50 50 0 rHDPE47W50CA3 Recycled 47 50 3 rHDPE45W50CA5 Recycled 45 50 5 rHDPE57W40CA3 Recycled 57 40 3 Wood flour-PP series composites rPP100 Recycled 100 0 0 vPP50W50 Virgin 50 50 0 rPP50W50 Recycled 50 50 0 rPP47W50CA3 Recycled 47 50 3 rPP60W40 Recycled 60 40 0 rPP45W50CA5 Recycled 45 50 5
Note: W, CA, HDPE and PP codes are used to represent the wood flour, coupling agent, high-density polyethylene and polypropylene. ‘r’ and ‘v’ were used for recycled and virgin plastic, respectively.

30
Fig. 2.3. Schematic flow diagram of the wood plastic composite manufacturing process.
Fig. 2.4. Experimental setup used for the in-situ temperature measurement by using K-type thermocouples.

31
2.4 Testing of the composite samples and the result analysis 2.4.1 Dimensional stability tests Water absorption and thickness swelling tests were conducted in accordance with ASTM D570-98 [7], in which the specimens were immersed in water for 2 h and 24 h, respectively, at a temperature 23±1°C. The weight gain and thickness increase were measured 20 minutes after the samples were removed from the water. After 24 h water immersion tests, all of the specimens were oven-dried after the test at 105°C for 24 h to obtain the oven-dry mass for the calculation of the panel moisture content (MC) using the following equation:
%100)(×
−=
o
ot
mmmptionWaterabsor (2.1)
Where, mo and mt are the oven-dry mass (kg) and the mass (kg) after time t, in the water immersion test, respectively. Equilibrium moisture content (EMC) of the samples is the moisture content when the daily weight change of the sample was less than 0.01% and thus the equilibrium state was assumed to be reached. Density of the composite was determined based on the oven-dry weight and the volume before the water immersion test. In the water immersion tests, thickness of each composite sample was also measured for determination of the thickness swelling (TS) by using the following equation:
%100)((%) ×−
=o
ot
hhhTS (2.2)
In which ho and ht are the panel thickness (mm) before and after the water immersion, respectively. 2.4.2 Mechanical properties 2.4.2.1 Tensile properties Type-I tensile bar specimens with dimensions of 165mm × 19mm × 6.4mm (thickness) were cut and machined from the hot pressed composite panels. The tensile tests were performed in accordance with ASTM D638-99 [8] using a standard Material Testing System (MTS-810 load frame with 5 kN load cell) at a crosshead speed of 5 mm/min.
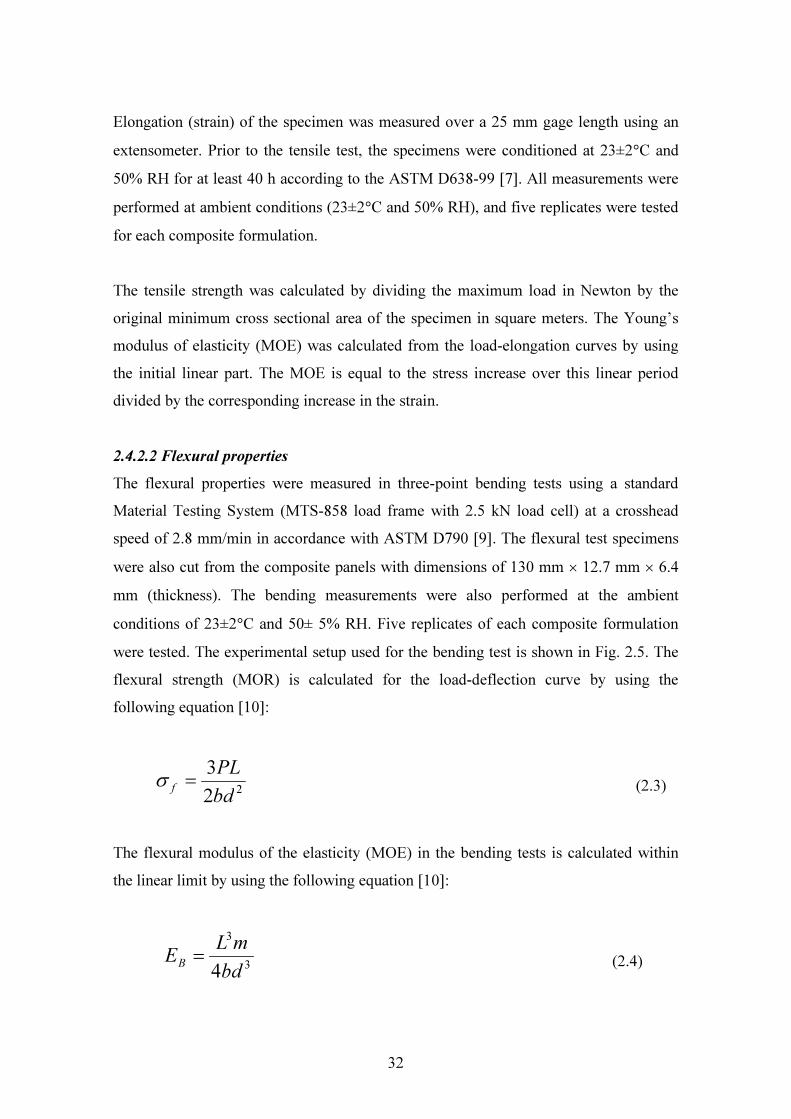
32
Elongation (strain) of the specimen was measured over a 25 mm gage length using an extensometer. Prior to the tensile test, the specimens were conditioned at 23±2°C and 50% RH for at least 40 h according to the ASTM D638-99 [7]. All measurements were performed at ambient conditions (23±2°C and 50% RH), and five replicates were tested for each composite formulation. The tensile strength was calculated by dividing the maximum load in Newton by the original minimum cross sectional area of the specimen in square meters. The Young’s modulus of elasticity (MOE) was calculated from the load-elongation curves by using the initial linear part. The MOE is equal to the stress increase over this linear period divided by the corresponding increase in the strain. 2.4.2.2 Flexural properties The flexural properties were measured in three-point bending tests using a standard Material Testing System (MTS-858 load frame with 2.5 kN load cell) at a crosshead speed of 2.8 mm/min in accordance with ASTM D790 [9]. The flexural test specimens were also cut from the composite panels with dimensions of 130 mm × 12.7 mm × 6.4 mm (thickness). The bending measurements were also performed at the ambient conditions of 23±2°C and 50± 5% RH. Five replicates of each composite formulation were tested. The experimental setup used for the bending test is shown in Fig. 2.5. The flexural strength (MOR) is calculated for the load-deflection curve by using the following equation [10]:
223bdPL
f =σ (2.3)
The flexural modulus of the elasticity (MOE) in the bending tests is calculated within the linear limit by using the following equation [10]:
3
3
4bdmLEB = (2.4)
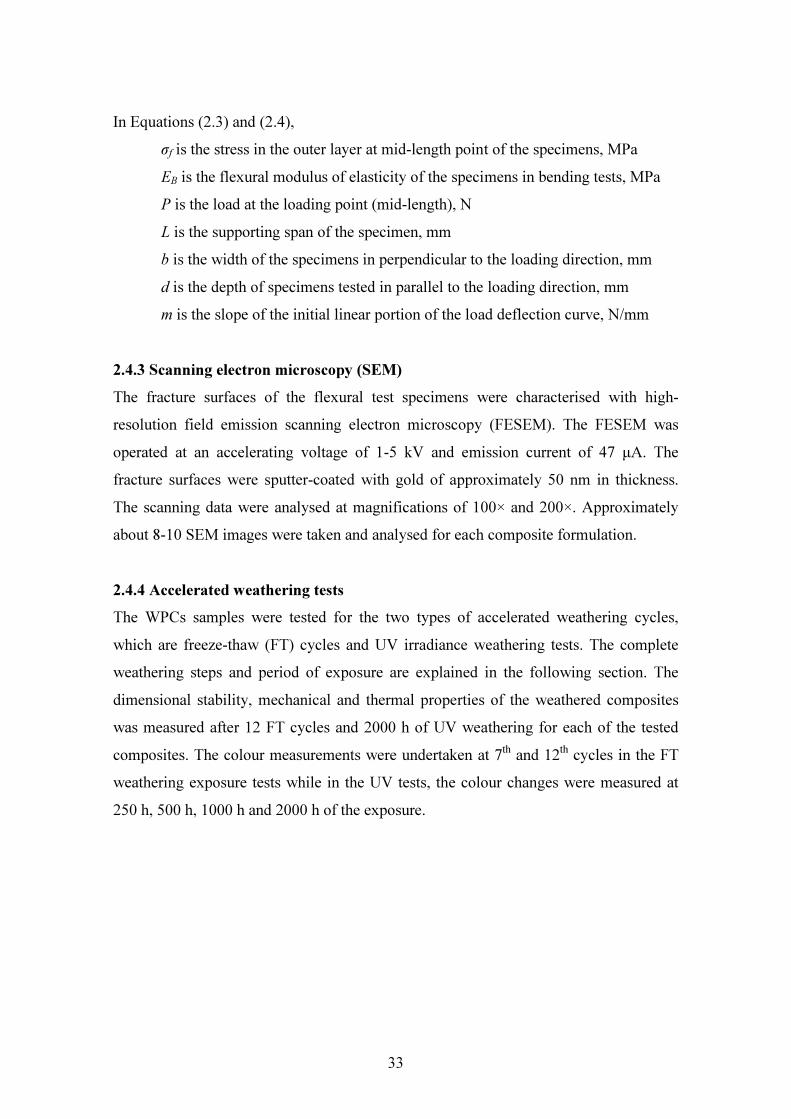
33
In Equations (2.3) and (2.4), σf is the stress in the outer layer at mid-length point of the specimens, MPa EB is the flexural modulus of elasticity of the specimens in bending tests, MPa P is the load at the loading point (mid-length), N L is the supporting span of the specimen, mm
b is the width of the specimens in perpendicular to the loading direction, mm d is the depth of specimens tested in parallel to the loading direction, mm
m is the slope of the initial linear portion of the load deflection curve, N/mm 2.4.3 Scanning electron microscopy (SEM) The fracture surfaces of the flexural test specimens were characterised with high-resolution field emission scanning electron microscopy (FESEM). The FESEM was operated at an accelerating voltage of 1-5 kV and emission current of 47 µA. The fracture surfaces were sputter-coated with gold of approximately 50 nm in thickness. The scanning data were analysed at magnifications of 100× and 200×. Approximately about 8-10 SEM images were taken and analysed for each composite formulation. 2.4.4 Accelerated weathering tests The WPCs samples were tested for the two types of accelerated weathering cycles, which are freeze-thaw (FT) cycles and UV irradiance weathering tests. The complete weathering steps and period of exposure are explained in the following section. The dimensional stability, mechanical and thermal properties of the weathered composites was measured after 12 FT cycles and 2000 h of UV weathering for each of the tested composites. The colour measurements were undertaken at 7th and 12th cycles in the FT weathering exposure tests while in the UV tests, the colour changes were measured at 250 h, 500 h, 1000 h and 2000 h of the exposure.

34
Fig. 2.5. Experimental setup used for the flexural properties tests by using the Material Testing System (MTS-858).
Fig. 2.6. Experimental setup for the accelerated UV weathering by using black panel UV box.
UV Box
Inside UV Box
Timer

35
2.4.4.1 Accelerated freeze-thaw cycles
In the freeze-thaw (FT) tests, the composite samples were exposed to accelerated water immersion and FT cycles in accordance with the ASTM standard (ASTM D6662–01) for polyolefin-based plastic lumber decking boards [11]. One complete FT cycle consisted of 3 stages as follows: (i) Firstly, the samples were water-soaked for one week at a temperature of 21°C
with an accuracy of ±3°C. During the water submersion, each sample was weighed every 24 h until the weight gain was less than 1.0% in the 24 hour period.
(ii) After the water submersion, the samples were frozen for 24 h at the controlled temperature of - 27°C with an accuracy of ±3°C.
(iii) Finally, the samples thawed for 24 hours in a controlled environment (21±3°C and 50± 5% RH) using a humidity chamber.
2.4.4.2 Accelerated ultraviolet light exposure Both the neat PP and composite samples were exposed to Fluorescent ultraviolet (UV) light (UVA-340 Lamp type) according to ASTM D4329-99 [12]. Briefly, a metal holder was used to expose one face of the sample to the UV light source and the WPC samples were repositioned periodically to ensure that all were exposed to the same level of irradiance. The samples were removed for analysis after 250, 500, 1000 and 2000 h of exposure. A single exposure cycle consisted of 5 steps: (a) 12 h of UV light exposure at a black panel temperature of 60 ± 3oC; (b) keeping the sample at room temperature for 3 h; (c) spraying the exposed surface of the sample with water until its surface was saturated; (d) exposing the sample to UV light for 6 h at a black panel temperature of 50±3oC; and (e) keeping the sample at room temperature for 3 h before starting the next cycle. Thus, an exposure time of 2000 h involved 83 exposure cycles based on 24 h per cycle. The total exposure spectral irradiance to the composite was 0.77 Wm-2nm-1 (wavelength = 340 nm) after 2000 h. Fig. 2.6 shows the experimental setup employed for the UV exposure tests for the composites panels.
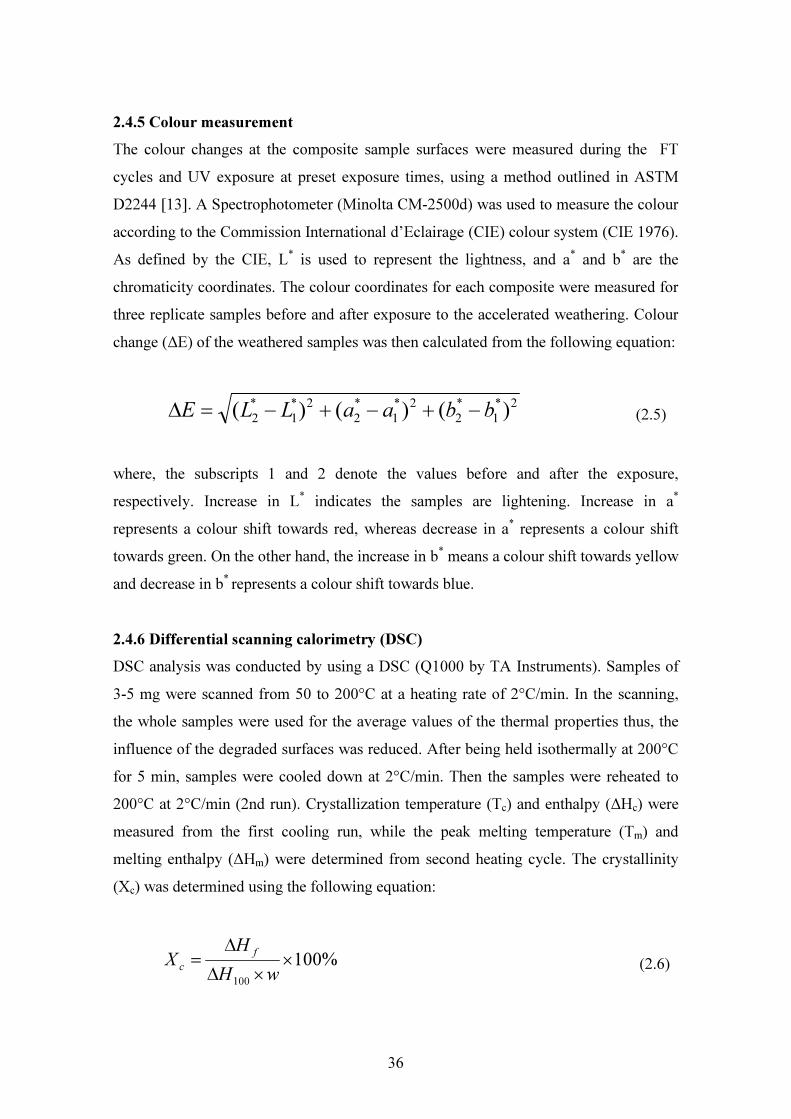
36
2.4.5 Colour measurement The colour changes at the composite sample surfaces were measured during the FT cycles and UV exposure at preset exposure times, using a method outlined in ASTM D2244 [13]. A Spectrophotometer (Minolta CM-2500d) was used to measure the colour according to the Commission International d’Eclairage (CIE) colour system (CIE 1976). As defined by the CIE, L* is used to represent the lightness, and a* and b* are the chromaticity coordinates. The colour coordinates for each composite were measured for three replicate samples before and after exposure to the accelerated weathering. Colour change (∆E) of the weathered samples was then calculated from the following equation:
2*1
*2
2*1
*2
2*1
*2 )()()( bbaaLLE −+−+−=∆ (2.5)
where, the subscripts 1 and 2 denote the values before and after the exposure, respectively. Increase in L* indicates the samples are lightening. Increase in a* represents a colour shift towards red, whereas decrease in a* represents a colour shift towards green. On the other hand, the increase in b* means a colour shift towards yellow and decrease in b* represents a colour shift towards blue. 2.4.6 Differential scanning calorimetry (DSC) DSC analysis was conducted by using a DSC (Q1000 by TA Instruments). Samples of 3-5 mg were scanned from 50 to 200°C at a heating rate of 2°C/min. In the scanning, the whole samples were used for the average values of the thermal properties thus, the influence of the degraded surfaces was reduced. After being held isothermally at 200°C for 5 min, samples were cooled down at 2°C/min. Then the samples were reheated to 200°C at 2°C/min (2nd run). Crystallization temperature (Tc) and enthalpy (∆Hc) were measured from the first cooling run, while the peak melting temperature (Tm) and melting enthalpy (∆Hm) were determined from second heating cycle. The crystallinity (Xc) was determined using the following equation:
%100100
××∆
∆=
wHH
X fc (2.6)

37
where, ∆Hf is the heat of fusion of the neat polymer or composites and ∆Hf100 is the theoretical heat of fusion for a 100% crystalline polymer (∆Hf100=205 J/g for PP and ∆Hf100=293 J/g for HDPE) [14] and w is the mass fraction of thermoplastic in the composite samples. The Tm is the peak temperature of melting thermogram during heating cycle. Melting of polymer is a change from a solid, crystalline state into an amorphous state. The quantity of heat absorbed during the melting is called melting enthalpy. Enthalpy change (∆H) of a specimen, expressed based on initial mass, is calculated from the area bounded by the melting or crystallization curves and the line connecting the onset melting and end temperature. Higher values of crystallinity of the polymer indicate stronger secondary bonding and higher density, higher strength, higher resistance to dissolution and softening by heating. 2.4.7 Statistical analysis For each series of tests, the arithmetic mean of all values were taken and reported as the average value for the particular property in question. The standard deviation was calculated and differences in values between unexposed (control) and exposed composites will be reported for the weathering performance in terms of the percentage of change in reference to the unexposed samples. 2.5 Specimen preparation Specimens were cut from each panel according to the dimensions required as per the respective ASTM standards. As WPC panels were isotropic, no effort was made to cut specimens along a particular direction in width and length although the thickness of the specimens was always the thickness of the composite panel. Each specimen was labelled with the percentage of wood flour, panel number, and specimen number. Table 2.5 indicates the sizes and number of specimens evaluated in this study.
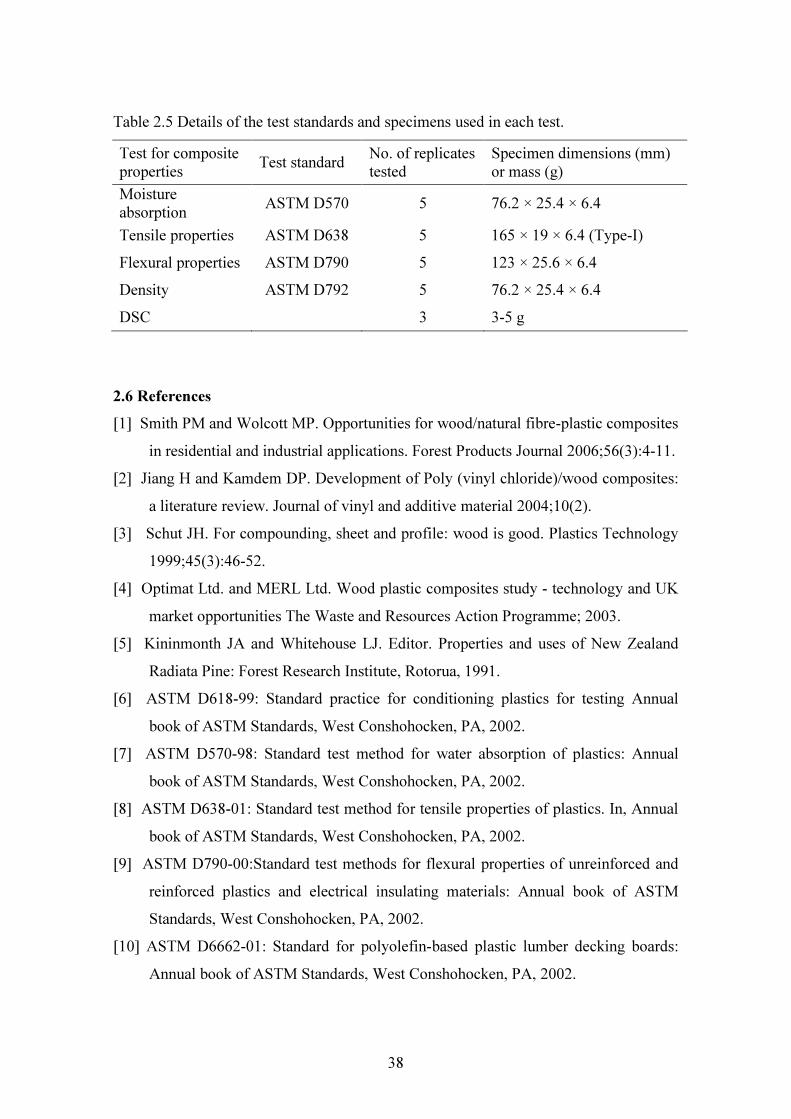
38
Table 2.5 Details of the test standards and specimens used in each test. Test for composite properties Test standard No. of replicates
tested Specimen dimensions (mm) or mass (g)
Moisture absorption ASTM D570 5 76.2 × 25.4 × 6.4 Tensile properties ASTM D638 5 165 × 19 × 6.4 (Type-I) Flexural properties ASTM D790 5 123 × 25.6 × 6.4 Density ASTM D792 5 76.2 × 25.4 × 6.4 DSC 3 3-5 g 2.6 References [1] Smith PM and Wolcott MP. Opportunities for wood/natural fibre-plastic composites
in residential and industrial applications. Forest Products Journal 2006;56(3):4-11. [2] Jiang H and Kamdem DP. Development of Poly (vinyl chloride)/wood composites:
a literature review. Journal of vinyl and additive material 2004;10(2). [3] Schut JH. For compounding, sheet and profile: wood is good. Plastics Technology
1999;45(3):46-52. [4] Optimat Ltd. and MERL Ltd. Wood plastic composites study - technology and UK
market opportunities The Waste and Resources Action Programme; 2003. [5] Kininmonth JA and Whitehouse LJ. Editor. Properties and uses of New Zealand
Radiata Pine: Forest Research Institute, Rotorua, 1991. [6] ASTM D618-99: Standard practice for conditioning plastics for testing Annual
book of ASTM Standards, West Conshohocken, PA, 2002. [7] ASTM D570-98: Standard test method for water absorption of plastics: Annual
book of ASTM Standards, West Conshohocken, PA, 2002. [8] ASTM D638-01: Standard test method for tensile properties of plastics. In, Annual
book of ASTM Standards, West Conshohocken, PA, 2002. [9] ASTM D790-00:Standard test methods for flexural properties of unreinforced and
reinforced plastics and electrical insulating materials: Annual book of ASTM Standards, West Conshohocken, PA, 2002.
[10] ASTM D6662-01: Standard for polyolefin-based plastic lumber decking boards: Annual book of ASTM Standards, West Conshohocken, PA, 2002.

39
[11] ASTM D4329-99: Standard practice for fluorescent UV exposure of plastics: Annual book of ASTM Standards, West Conshohocken, PA, 2002.
[12] ASTM D2244-93: Standard test method for calculation of colour difference from instrumentally measured colour coordinates: Annual book of ASTM Standards, West Conshohocken, PA, 2002.
[13] Ehrenstein GW, Trawiel R. Thermal analysis of plastics: theory and practice: Carl Hanser Verlag, Munich, 2004.

40
CHAPTER 3 PERFORMANCE OF RECYCLED AND VIRGIN HDPE AND
SAWDUST COMPOSITES
Abstract This part of study investigated the stability, mechanical properties and the microstructure of wood-plastic composites (WPCs), which were made through hot pressing using either recycled or virgin HDPE with wood flour (Pinus radiata) as filler. The recycled HDPE (rHDPE) was collected from a local plastics recycling plant and pine sawdust was obtained from a local sawmill. The composite panels made from rHDPE exhibited excellent dimensional stability as compared to those made from virgin HDPE (vHDPE). The tensile and flexural properties of the composites based on rHDPE were found equivalent and followed the similar trend to those based on vHDPE. Adding coupling agent (MAPP) by 3-5 wt. % in the composite formulation significantly improved both stability and mechanical properties. Microstructure analysis of the fractured surfaces of the MAPP coupled composites confirmed the improved interfacial bonding. Dimensional stability and strength properties of the composites can be improved by increasing the plastic content or by addition of coupling agent. 3.1 Introduction There are a number of published studies on the reinforcement of vHDPE with wood fibre with regard to resulting mechanical properties, dimensional stability and interfacial bonding and durability [1-4]. However, studies on WPCs based on rHDPE are very limited. Yam et al. [5] and Selke et al. [6] studied rHDPE (simulated milk gallon) and wood fibre composites using extrusion moulding and reported that the performance of these composites was at least as good as the composites based on virgin plastic. Li et al. [7] studied hot-press moulded composites based on a combination of vHDPE and rHDPE, and pine wood flakes. It was found that the initial particle geometry of HDPE played an important role in the quality of the composites. Kamdem et al. [8] studied the properties of compression-moulded composites made of rHDPE and wood flour from untreated or CCA treated pinewood, respectively. It was observed that composites with particles from recycled
41
CCA treated pine exhibited higher flexural strength compared to composites from untreated pine. Sellers et al. [9] demonstrated that for hot-pressed composites of recycled pine wood fibres and recycled polyethylene, these composites had mechanical properties suitable for construction applications. Youngquist et al. [10] had shown that composites made from demolition wood waste and waste plastics from milk bottles by thermoforming method exhibited a broad range of properties similar to those made of virgin ingredients. Jayaraman et al. [11] studied the performance of melt blending and injection-moulding composites made from Pinus radiata fibres and rHDPE, and found that the tensile strength was 25% higher than those of panel made of entirely using vHDPE. Chen et al. [12] investigated the influence of wood particle size in hot-pressed composites based on construction wood waste and rHDPE, and found that smaller sized wood particles improved water absorption and thickness swelling. Most of the research reported above on wood and rHDPE composites has concentrated on the use of either a single type of plastic from the waste stream, or a simulated mixing of waste plastics or mixing of recycled and virgin plastics. The post-consumer plastics waste stream may contain many different grades, colours and contaminants, leading to varying performance when these plastics are combined with wood fillers (fibres or flour). The impact of post-consumer rHDPE in WPCs is still not fully understood, leaving open research opportunities for the optimisation of the products and processing. This part of study aims to explore the use of Pinus radiata sawdust and post-consumer rHDPE for the production of the wood flour-HDPE composites. The effect of the wood flour loadings and coupling agent addition on dimensional stability, mechanical properties and microstructure was investigated. The test results for the HDPE based composite were presented and discussed in this chapter. 3.2 Experimental The preparation and test procedures of the HDPE based composites are presented in Chapter 2 and WPC formulations are described in Table 2.4. WPC panels were firstly conditioned at 23±2°C and RH of 50± 5% for at least 40 h according to ASTM D618-99 before the tests. In the stability performance tests, the specimens were immersed in water for 2 h and 24 h, respectively, at a temperature 23±1°C. The composite properties

42
investigated include water absorption, thickness swelling, mechanical properties, and microstructures of fractured surfaces. 3.3 Results and discussion 3.3.1 Moisture absorption and thickness swelling Results of the composite density, moisture absorption and thickness swelling are given in Table 3.1. It was found that the density of the composites ranges from 922 kg/m3 for the entirely rHDPE panels to 1042 kg/m3 for the composites with 50 wt. % wood, 47 wt. % rHDPE and 3 wt. % coupling agent (MAPP). The MAPP coupled composites showed the higher density as compared to non-coupled composites. These results are consistent with previous studies with MAPP coupled composites which showed higher density with lower porosity and thus had better dispersion and better interfacial strength as compared to the composites without the coupling agent [3, 4, 13]. Table 3.1 Water absorption and thickness swelling of the wood flour-HDPE composites.
Moisture absorption (%) Thickness swelling (%) Composite sample code
Density, kg/m3 2 h 24 h 2 h 24 h
vHDPE100 930 (61*) 0.03 (0.01) 0.05 (0.02) 0.08 (0.02) 0.13 (0.02) rHDPE100 923 (13) 0.04 (0.01) 0.05 (0.01) 0.18 (0.05) 0.18 (0.05) vHDPE60W40 946 (26) 1.28 (0.12) 2.67 (0.27) 0.5 (0.1) 0.83 (0.2) rHDPE70W30 981 (19) 0.39 (0.06) 0.98 (0.17) 0.24 (0.08) 0.42 (0.35) rHDPE60W40 1000 (21) 0.94 (0.19) 2.15 (0.45) 0.52 (0.14) 1.52 (0.37) vHDPE50W50 938 (24) 2.76 (0.5) 6.84 (1.32) 1.26 (1.14) 2.5 (0.7) rHDPE50W50 1010 (20) 1.7 (0.08) 4.1 (0.25) 0.7 (0.28) 1.85 (0.4) rHDPE47W50CA3 1042 (15) 0.61 (0.12) 1.31 (0.3) 0.27 (0.04) 0.64 (0.2) rHDPE45W50CA5 1029 (25) 0.53 (0.08) 1.18 (0.21) 0.33 (0.14) 0.62 (0.4) rHDPE57W40CA3 997 (22) 0.58 (0.15) 1.24 (0.24) 0.23 (0.17) 0.51 (0.2)
Note *: Values are average of five replicates and values in parentheses are standard deviations. The water absorption increased with increasing wood content in the composites – a trend that is true for both the 2 h and 24 h water immersion tests. However, after 24 h water immersion, the water absorption by the composites was almost doubled as given in Table 3.1. With the increase in wood content, there are more water-residence sites thus more water was absorbed. On the other hand, the composites made with higher plastic content had less water-residence sites and thus lower water absorption. The

43
water absorption of the entirely rHDPE or the entirely vHDPE panels was only 0.03-0.04% after 2 h and 0.05% after 24 h water immersion. For the rHDPE based non-coupled composites, the water absorption with 30 wt. % wood flour content was 0.039% after 2 h immersion and 0.98% after 24 h, while the corresponding values for the composites with 50 wt. % wood flour content were 1.7% and 4.1%, respectively. Interestingly, composites made of rHDPE had lower water absorption compared that of vHDPE at the same wood content. Furthermore, the addition of MAPP coupling agent significantly reduced the water absorption of the composites. The composites with 50 wt. % of wood flour and 3 wt. % MAPP reduced the water absorption from 4.1% to 1.31% for the 24 h immersion tests and this was further reduced to 1.18% by adding 5 wt.% of MAPP in the same composite formulation. It was observed that when the coupling agent was added, the influence of plastic to wood ratio was no longer important in the range of the tests. For example, by adding 3 wt. % of the coupling agent, the water absorption for composites with 40% wood flour was 1.24% at the 24 h immersion compared and this was increased slightly to 1.31% for composites with 50 wt. % of wood flour. Thickness swelling of the wood flour-HDPE composites increased with the water absorption and thus had similar trend to the water absorption regarding the impacts of wood to plastics ratio and coupling agent (Table 3.1). The thickness swelling values for the 2 h water immersion varied from 0.24 to 1.26 %, and these values were increased after 24 h immersion, varied from 0.42 to 2.50 %. Samples made with lower content of wood flour had lower thickness swelling and this is true both for the composites made from vHDPE and those made from rHDPE. However, composites coupled with MAPP showed that thickness swelling could be reduced by approximately 50% for the 2 h water immersion and by over 60% for the 24 h water immersion with wood content remaining the same. In general, the composite made of virgin and recycled plastics had similar dimensional stability properties without adding the coupling agent which is consistent with previous findings by Chen et al. [12]. The impact of wood to plastic ratio on the water absorption and thickness swelling can be explained by the differences in water absorption between wood and plastic. Water

44
absorption in composites is mainly due to the presence of lumens, fine pores and hydrogen bonding sites in the wood flour, the gaps and flaws at the interfaces, and the micro-cracks in the matrix formed during the compounding process [14]. The presence of hydroxyl and other polar groups in various constituents of the wood flour resulted in poor compatibility between the hydrophilic wood flour and the hydrophobic plastic, and thus weakened the interfacial bonding. Therefore, the water absorption increases with increasing the wood content in the composites. Water absorption by cellulose and hemicelluloses depends on the number of free hydroxyl groups thus the amorphous regions are accessible by water. On the other hand, plastic is water repellent and had much lower water sorption capability than wood. With the addition of MAPP (3-5 wt. %) the interface bonding between wood flour and HDPE was improved because the anhydride moieties in MAPP entered into an esterification reaction with the surface hydroxyl groups of wood flour [15]. This lowered the water absorption sites and reduced the water absorption by MAPP coupled composites. The other possible reason for less water absorption by the MAPP coupled composites could be the change in crystallinity (Xc) of WPCs. This was confirmed with the DSC analysis, which showed that the MAPP coupled composites had higher Xc as compared to non-coupled composites (Table 6.4). For example, with the addition of 5 wt. % MAPP in the rHDPE50W50 composite, Xc was increased from 58.4 to 72.8%. As the crystalline regions are impermeable to the penetrant, the water absorption was obviously less in the MAPP coupled composites as compared to non-coupled composites. The recycled HDPE based composites absorbed less water compared with virgin HDPE based composites for the same wood plastic content. The possible reason could be the enhanced dispersion and interfacial bonding due to the presence of chemical impurities and different molecular differences between virgin and recycled plastics. The rHDPE had a lower MFI (0.072) as compared to vHDPE (0. 10g/10 min. 2.16kg/190oC) and thus had higher molecular weight, which helped for better dispersion and bonding. It was found that the Xc of the composites with vHDPE (56.2%) was lower than that of rHDPE (58.4%) (Table 6.4), which suggested that vHDPE absorbed more water as compared to rHDPE. The thickness swelling had the linear relationship with the water absorption and changes attributed due to the similar mechanism as that of water absorption.
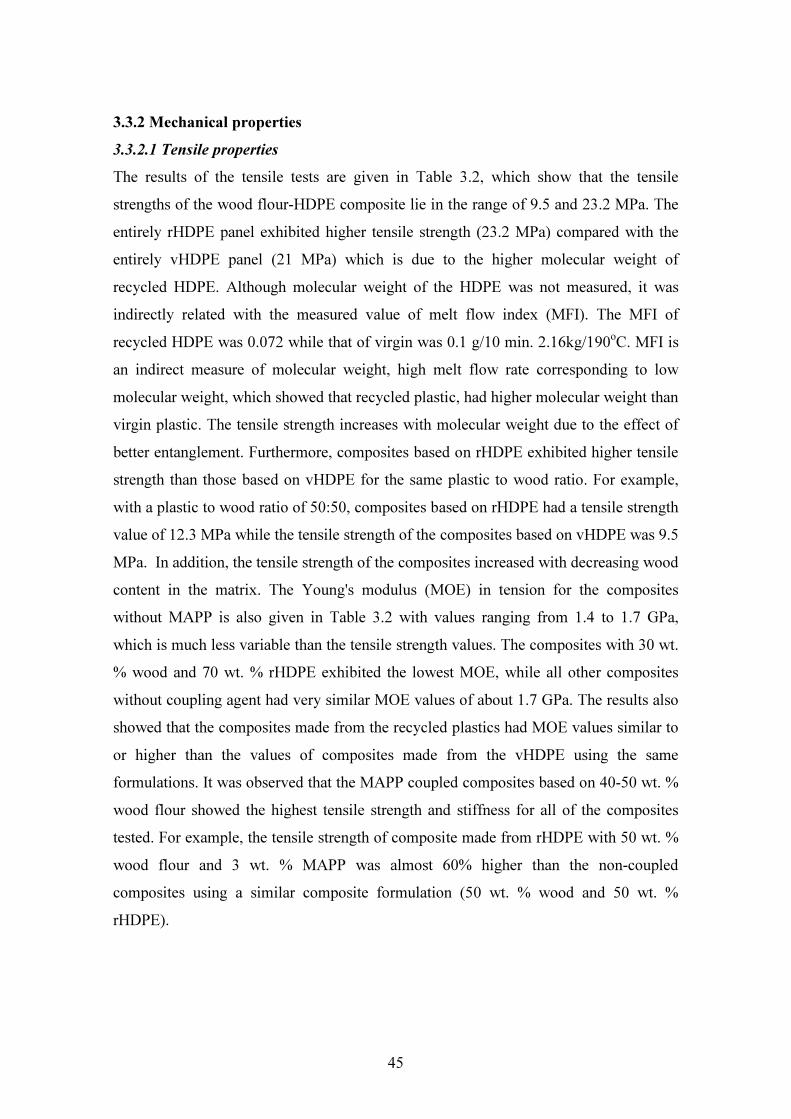
45
3.3.2 Mechanical properties 3.3.2.1 Tensile properties The results of the tensile tests are given in Table 3.2, which show that the tensile strengths of the wood flour-HDPE composite lie in the range of 9.5 and 23.2 MPa. The entirely rHDPE panel exhibited higher tensile strength (23.2 MPa) compared with the entirely vHDPE panel (21 MPa) which is due to the higher molecular weight of recycled HDPE. Although molecular weight of the HDPE was not measured, it was indirectly related with the measured value of melt flow index (MFI). The MFI of recycled HDPE was 0.072 while that of virgin was 0.1 g/10 min. 2.16kg/190oC. MFI is an indirect measure of molecular weight, high melt flow rate corresponding to low molecular weight, which showed that recycled plastic, had higher molecular weight than virgin plastic. The tensile strength increases with molecular weight due to the effect of better entanglement. Furthermore, composites based on rHDPE exhibited higher tensile strength than those based on vHDPE for the same plastic to wood ratio. For example, with a plastic to wood ratio of 50:50, composites based on rHDPE had a tensile strength value of 12.3 MPa while the tensile strength of the composites based on vHDPE was 9.5 MPa. In addition, the tensile strength of the composites increased with decreasing wood content in the matrix. The Young's modulus (MOE) in tension for the composites without MAPP is also given in Table 3.2 with values ranging from 1.4 to 1.7 GPa, which is much less variable than the tensile strength values. The composites with 30 wt. % wood and 70 wt. % rHDPE exhibited the lowest MOE, while all other composites without coupling agent had very similar MOE values of about 1.7 GPa. The results also showed that the composites made from the recycled plastics had MOE values similar to or higher than the values of composites made from the vHDPE using the same formulations. It was observed that the MAPP coupled composites based on 40-50 wt. % wood flour showed the highest tensile strength and stiffness for all of the composites tested. For example, the tensile strength of composite made from rHDPE with 50 wt. % wood flour and 3 wt. % MAPP was almost 60% higher than the non-coupled composites using a similar composite formulation (50 wt. % wood and 50 wt. % rHDPE).

46
Table 3.2 Tensile and flexural properties of the wood flour-HDPE composites. Tensile properties Flexural properties
Composite sample code Strength
(MPa) MOE (GPa)
Yield stress (MPa)
Elongation at break (%)
Strength (MPa)
MOE (GPa)
Yield stress (MPa)
Elongation at break (%)
vHDPE100 21.4 (3.1*) - - - 22.4
(0.8) 0.84 (0.03)
10.2 (0.9) 8.1 (0.5)
rHDPE100 23.2 (0.2) - - - 23.1
(0.5) 0.84 (0.05)
9.2 (0.5) 7.6 (0.2)
vHDPE60W40 11.8 (1.1)
1.64 (0.09)
5.1 (0.6) 1.9 (0.4) 17.9
(0.9) 1.06 (0.05)
8.5 (0.4) 3.9 (0.3)
rHDPE70W30 15.9 (0.8)
1.37 (0.04)
8.5 (0.3) 2.6 (0.8) 24.3
(0.8) 1.29 (0.08)
13.1 (0.7) 4.5 (0.5)
rHDPE60W40 13.7 (0.7)
1.7 (0.1)
6.3 (0.3) 1.7 (0.4) 20
(0.4) 1.13 (0.04)
9.4 (0.2) 3.4 (0.3)
vHDPE50W50 9.5 (0.4)
1.68 (0.07)
5.2 (0.6) 1.1 (0.3) 14.4
(1.5) 1.34 (0.03)
6.2 (0.2) 2.6 (0.3)
rHDPE50W50 12.3 (2.1)
1.7 (0.04)
7.1 (0.7) 1.5 (0.2) 15.6
(1.5) 1.42 (0.04)
6.8 (0.8) 2.2 (0.4)
rHDPE47W50CA3 18.3 (0.4)
2.18 (0.09)
11.9 (0.4) 1.2 (0.1) 25.5
(1.0) 1.88 (0.03)
11.8 (0.5) 2.3 (0.2)
rHDPE45W50CA5 17.5 (2.1)
1.9 (0.05)
11.8 (0.8) 1.1 (0.2) 24.2
(1.8) 1.97 (0.03)
11.2 (0.8) 2.0 (0.3)
rHDPE57W40CA3 19.3 (0.8)
2.35 (0.06)
11.4 (1.2) 1.5 (0.2) 24.9
(1.3) 1.81 (0.04)
10.2 (1) 2.6 (0.1)
Note: The values are the average of five replicate samples. The tensile and flexural Young’s modulus (MOE) is the Young's modulus. Flexural strain is the strain in the outer surface at test specimen mid-span. *: The values in parentheses are standard deviations.
The tensile properties variation of composites based on recycled and virgin HDPE can be explained differently. It was found that composites based on rHDPE exhibited higher tensile strength and modulus than those based on vHDPE for the same plastic to wood ratio This is probably due to the better fiber dispersion within the recycled HDPE matrix by the increased wettability induced from the chemical impurities presents. Although, recycled HDPE had lower MFI than that of virgin HDPE, the better wettability could be possible for rHDPE processing due to chemical impurities during processing. The other possible reason could be the change in Xc of HDPE matrix with the incorporation of wood flour. It was found that with the addition of wood flour in the HDPE matrix, the Xc of the composites reduced for both recycled and virgin HDPE matrix composites (Table 6.4). On the other hand, MAPP coupled composites showed
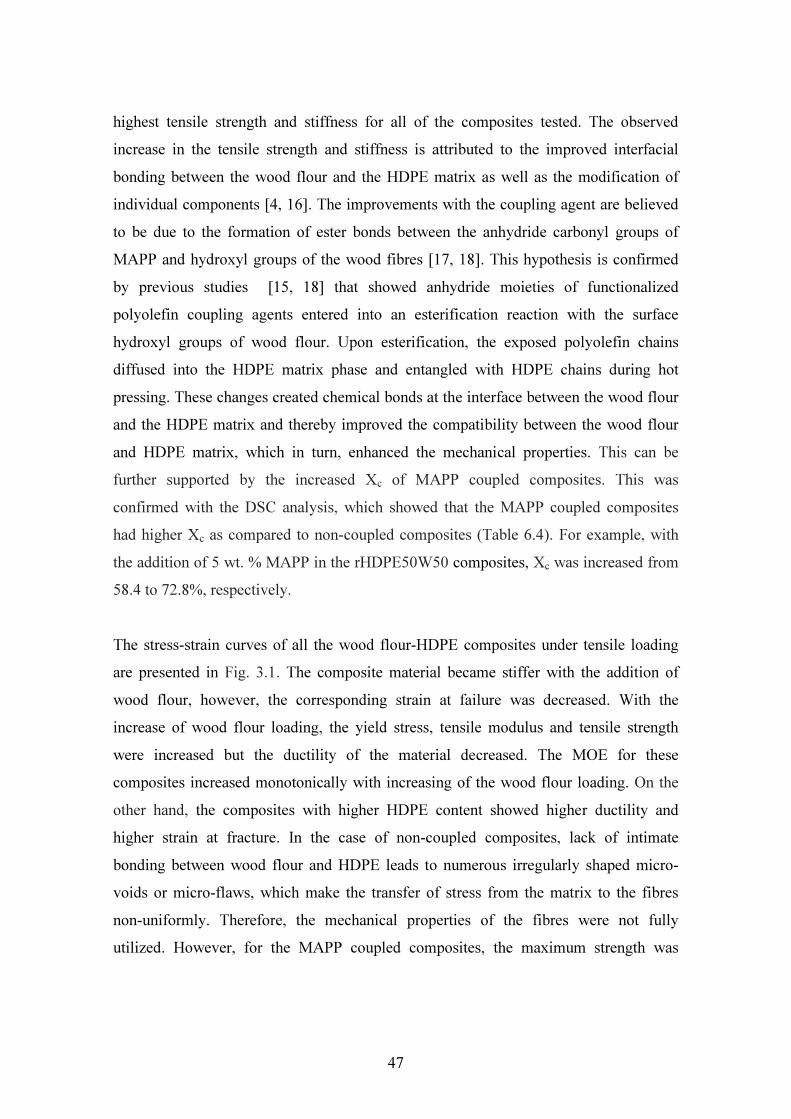
47
highest tensile strength and stiffness for all of the composites tested. The observed increase in the tensile strength and stiffness is attributed to the improved interfacial bonding between the wood flour and the HDPE matrix as well as the modification of individual components [4, 16]. The improvements with the coupling agent are believed to be due to the formation of ester bonds between the anhydride carbonyl groups of MAPP and hydroxyl groups of the wood fibres [17, 18]. This hypothesis is confirmed by previous studies [15, 18] that showed anhydride moieties of functionalized polyolefin coupling agents entered into an esterification reaction with the surface hydroxyl groups of wood flour. Upon esterification, the exposed polyolefin chains diffused into the HDPE matrix phase and entangled with HDPE chains during hot pressing. These changes created chemical bonds at the interface between the wood flour and the HDPE matrix and thereby improved the compatibility between the wood flour and HDPE matrix, which in turn, enhanced the mechanical properties. This can be further supported by the increased Xc of MAPP coupled composites. This was confirmed with the DSC analysis, which showed that the MAPP coupled composites had higher Xc as compared to non-coupled composites (Table 6.4). For example, with the addition of 5 wt. % MAPP in the rHDPE50W50 composites, Xc was increased from 58.4 to 72.8%, respectively. The stress-strain curves of all the wood flour-HDPE composites under tensile loading are presented in Fig. 3.1. The composite material became stiffer with the addition of wood flour, however, the corresponding strain at failure was decreased. With the increase of wood flour loading, the yield stress, tensile modulus and tensile strength were increased but the ductility of the material decreased. The MOE for these composites increased monotonically with increasing of the wood flour loading. On the other hand, the composites with higher HDPE content showed higher ductility and higher strain at fracture. In the case of non-coupled composites, lack of intimate bonding between wood flour and HDPE leads to numerous irregularly shaped micro-voids or micro-flaws, which make the transfer of stress from the matrix to the fibres non-uniformly. Therefore, the mechanical properties of the fibres were not fully utilized. However, for the MAPP coupled composites, the maximum strength was

48
increased but the maximum strain at failure was decreased as compared to the non-coupled composites.
0
10
20
30
0 0.005 0.01 0.015 0.02 0.025 0.03Strain
Stress
(MPa
)
vHDPE60W40 rHDPE70W30rHDPE60W40 vHDPE50W50rHDPE50W50 rHDPE47W50CA3rHDPE45W50CA5 rHDPE57W40CA3
Fig. 3.1. Stress-strain curves of the wood flour-HDPE composites obtained in tensile
tests. 3.3.2.2 Flexural properties The flexural strength and stiffness of the composites were measured using 3-point bending tests are also shown in Table 3.2. The flexural strength exhibited a similar trend to the tensile strength although less variation was observed in flexural strength with different formulations than the tensile strength. The composites based on rHDPE and wood flour had a flexural strength varying from 15.6 to 25.5 MPa whereas those made of vHDPE had the corresponding values ranging from 14.4 to 17.9 MPa. Similarly, the Young’s modulus (MOE) for the rHDPE based composites varied from 1.3 to 1.97 GPa and that of the composites using the vHDPE ranged from 1.06 to 1.34GPa.
The flexural strength and MOE of the rHDPE based composites were slightly higher than those of vHDPE based composites at the same plastic to wood ratio. It was also
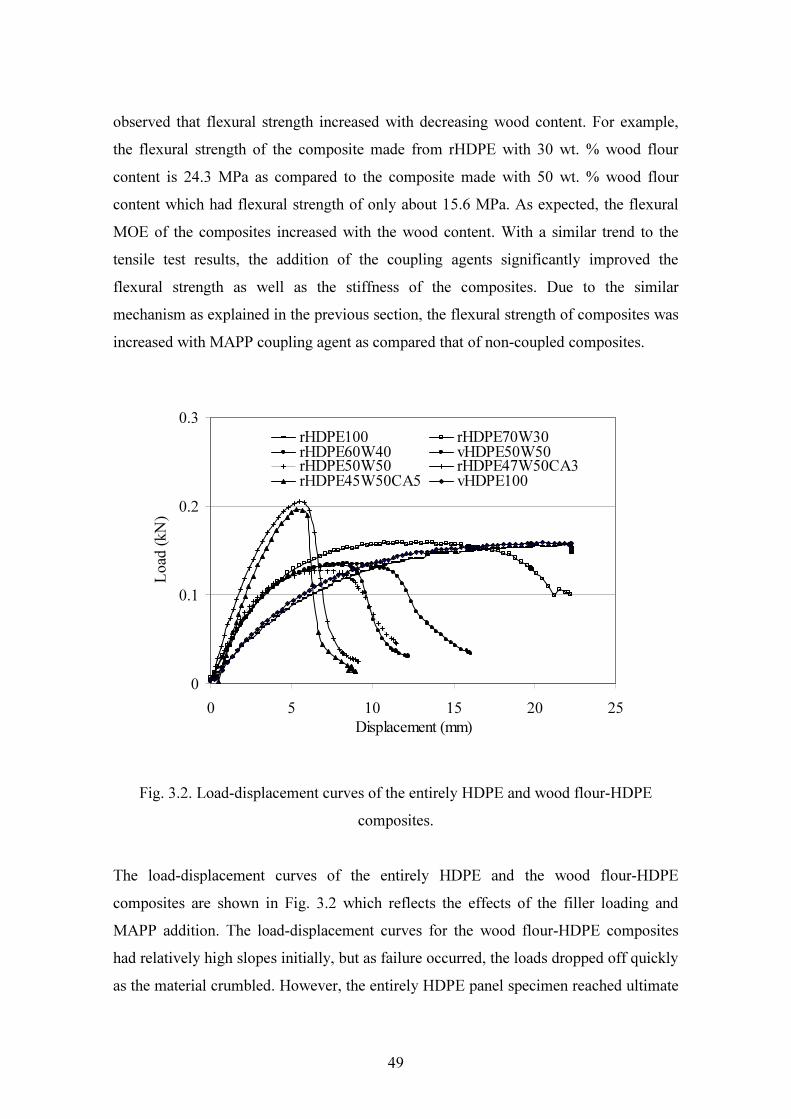
49
observed that flexural strength increased with decreasing wood content. For example, the flexural strength of the composite made from rHDPE with 30 wt. % wood flour content is 24.3 MPa as compared to the composite made with 50 wt. % wood flour content which had flexural strength of only about 15.6 MPa. As expected, the flexural MOE of the composites increased with the wood content. With a similar trend to the tensile test results, the addition of the coupling agents significantly improved the flexural strength as well as the stiffness of the composites. Due to the similar mechanism as explained in the previous section, the flexural strength of composites was increased with MAPP coupling agent as compared that of non-coupled composites.
0
0.1
0.2
0.3
0 5 10 15 20 25Displacement (mm)
Load
(kN)
rHDPE100 rHDPE70W30rHDPE60W40 vHDPE50W50rHDPE50W50 rHDPE47W50CA3rHDPE45W50CA5 vHDPE100
Fig. 3.2. Load-displacement curves of the entirely HDPE and wood flour-HDPE composites.
The load-displacement curves of the entirely HDPE and the wood flour-HDPE composites are shown in Fig. 3.2 which reflects the effects of the filler loading and MAPP addition. The load-displacement curves for the wood flour-HDPE composites had relatively high slopes initially, but as failure occurred, the loads dropped off quickly as the material crumbled. However, the entirely HDPE panel specimen reached ultimate

50
capacity after significant deformation (15 mm in this case), and then the load decreased gradually until the test was concluded, indicating ductile behaviour. The addition of wood flour in the composites increased the stiffness and brittleness, however, reduced the elongation at break. The stress concentration at the fibre ends and poor interface bonding between wood and HDPE matrix have been recognized as the leading causes for the embrittlement. Nevertheless, coupling agent (MAPP) improved interfacial bonding between wood filler and polymer matrix and improved the flexural strength. However, during loading, fractures occurred at the filler locations, and these fracture locations were more brittle than other parts of the matrix. Hence, these composites showed little change in the specimen appearance in the initial stage of loading until the maximum load was reached when the specimen failed suddenly with extensive breakage at the interface between the wood flour and the matrix. The elongation at break of the wood flour-HDPE composites was much lower than that of entirely HDPE panel. This decrease was probably due to the higher degree of brittleness introduced by the incorporation of wood fibres into the HDPE matrix. As in the case of modulus, improvement in the adhesion between fibres and HDPE did not enhance elongation at break. From the experimental results presented, it was found that effect of wood was notable in material properties of the composites. Wood is a lignocellulosic material made up of three major constituents (cellulose: 42-44%, hemicelluloses: 27-28%, and lignin: 24-28%) with some minor constituents (extractives: 3-4%) [14, 19]. The major portion of wood is crystalline cellulose. The aligned fibril structure of cellulose along with strong hydrogen bond has high stiffness thus addition of the wood flour can increase the stiffness of the polymer based composites. Lignin as an amorphous polymer does not greatly contribute to the mechanical properties of wood flour but plays an important role in binding the cellulose fibrils that allows efficient stress transfer to the cellulose molecules. Hence, wood filler increased the stiffness of HDPE without excessively increasing the density. Furthermore, these composites have potential to take up water under humid conditions due to the presence of numerous hydroxyl groups available for interaction with water molecules via hydrogen bonding. The MAPP coupling improved
51
the compatibility between the wood filler and HDPE through esterification and thus reduced the water absorption and improved the stability and mechanical properties.
3.3.4 Microstructure characterization Microstructure of the fractured surface of specimens tested in bending was examined using field emission SEM and the resultant images are shown in Figs. 3.3 and 3.4. SEM image of the bending fractured surface of the wood flour-HDPE composite at a filler loading of 30 wt. % is shown in Fig. 3.3(a) in which numerous cavities and pulled-out fibres can be seen. The presence of these cavities and pulled-out fibres confirms that the interfacial bonding between the filler and the matrix polymer was poor and weak. In addition, localised bunch of fibres and patches of HDPE matrix are seen, which indicates the poor dispersion of fillers within the HDPE matrix. Hence, the fracture surface of the composite with lower filler content appears to be dominated by pullout damage rather than fibres breakage. Figs. 3.3(b) and 3.4(a) show, respectively, the SEM images of fractured surfaces of 50 wt. % wood flour filled composites with vHDPE (Fig. 3.3(b)) and with rHDPE matrices (Fig. 3.4(a)). In these composites, distinct cavities between the matrix and the fibres, indicating poor adhesion. It is also possible to observe the wood fibres being weakly bonded to the matrix and thus being pulled out from the matrix during fracture. Fig. 3.4(a) also shows that part of the wood lumen was filled with plastic that could increase the strength of the composites because of mechanical interlocking. The dispersion of the wood fibres in rHDPE matrix was uniform as compared to vHDPE matrix. This could be the results of increased wettability and coupling with the presence of chemical impurities in the rHDPE. When wood content was increased, the polymer matrix was no longer continuously distributed and many wood fibres were in direct contact with one another, resulting in poor bonding at the interface.

52
Fig. 3.3. SEM images (100×) of fractured surface of (a) rHDPE70W30, (b) vHDPE50W50, composite samples.
Fig. 3.4. SEM images (100×) of fractured surface of (a) rHDPE50W50, (b) rHDPE47W50CA3 composite samples. Fig. 3.4(b) shows the SEM images of fracture surface of the 3 wt. % MAPP coupled composite filled with 50 wt. % wood flour. In this image, no clear gaps can be seen between the wood fibres and the HDPE matrix, indicating the good interface bonding. However, a crack is seen running through the wood fibre, and this could be an indication of stress-transfer from the weaker matrix to the stronger wood fibre. The interfacial bonding between the filler and HDPE matrix was improved due to the esterification mechanism with addition of the coupling agent [16]. In this case, the fracture occurred at the filler itself. This means that the stress was well propagated
a b
a b

53
between the filler and the matrix polymer, resulting in enhanced flexural strength and modulus in response to stress. In addition, the fracture surface shows a very limited amount of torn matrix, suggesting that the composite is more brittle. 3.4 Conclusions In this work, WPCs were made from both recycled and virgin HDPE with Pinus radiata wood flour. Dimensional stability and mechanical properties, and the microstructure of the fracture surfaces were investigated with regards to the coupling agent, wood flour content and plastic type. The stability and mechanical properties are important for the composite utilisation and the microstructure is most useful in understanding the composite performance. From this part of study, the following conclusions were drawn: The wood flour-HDPE composites made with hot-press moulding had low water absorption and thickness swelling. The water absorption and thickness swelling increased with wood flour loading, however, adding MAPP significantly reduced the water absorption and thickness swelling. The composites of 50 wt. % of wood flour with 3-5 wt. % MAPP coupling agent can achieve equivalent stability properties to those of the composites made from only 30 wt. % of wood flour without the coupling agent. The mechanical properties of the composites made from rHDPE were similar to, and comparable trend of composites made from vHDPE. The composites with low wood content (or entirely HDPE panel) and MAPP coupled had better tensile strength than all of the non-coupled composites. However, the composites made with lower wood content without the coupling agent showed lower stiffness. Addition of the MAPP reduced the ductility and elongation at the breaking point. Comparison of the SEM images of the fractured surfaces of wood flour-HDPE composites with and without the MAPP coupling agent confirmed that addition of MAPP improved the interfacial bonding. The results of the present work clearly show that rHDPE and wood sawdust can be successfully used to produce stable and strong WPCs. Dimensional stability and mechanical properties of composites can be achieved by increasing the plastic content or by addition of coupling agents. This work has shown that the composite coupled with
54
MAPP is the most useful as building materials due to their improved stability and mechanical properties. 3.5 References [1] Stark NM and Matauna LM. Surface chemistry and mechanical property changes
of wood-flour/high- density-polyethylene composites after accelerated weathering. Journal of Applied Polymer Science 2004 94(6 ):2263-73.
[2] Razi PS, Raman A, Portier R. Studies on mechanical properties of wood-polymer composites. Journal of Composite Materials 1997;31(23):2391-401.
[3] Raj RG, Kokta BV. Reinforcing high-density polyethylene with cellulosic fibres. I: The effect of additives on fibre dispersion and mechanical properties. Polymer Engineering and Science 1991;31(18):1358-62.
[4] Lu JZ, Wu Q, Negulescu II. Wood-fibre/high density polyethylene composites: coupling agent performance. Journal of Applied Polymer Science 2005;96:93-102.
[5] Yam KL, Gogai BK, Lai CC, Selke SE. Composites from compounding wood fibres with recycled high-density polyethylene. Polymer Engineering and Science 1990; 30(11):693-99.
[6] Selke SE, Wichman I. Wood fibre/polyolefin composites. Composites Part A: Applied Sciences and Manufacturing 2004;35:321-26.
[7] Rongzhi L, Lin Y, Wing Y. Effect of polyethylene particle geometry on mechanical properties of compression moulded wood-polyethylene composites. Plastics, Rubber and Composites Processing and Applications 1997 26(8):368-71.
[8] Kamdem DP, Cui W, Freed J, Matuana LM. Properties of wood plastic composites made of recycled HDPE and wood flour from CCA-treated wood removed from service. Composites Part A: Applied Sciences and Manufacturing 2004;35:347-55.
[9] Sellers Jr T, Miller Jr. GD, Katabian M. Recycled thermoplastics reinforced with renewable lignocellulosic materials. Forest Product Journal 2000;50(5):24-28.
[10] Youngquist JA, Myers GE, Muehl JH, Krzysik AM, Clemens CM, and Padella F. Composites from recycled wood and plastics: a project summary: US- Environment Protection Agency; 1994.

55
[11] Jayaraman K and Bhattacharya D. Mechanical performance of wood fibre–waste plastic composite materials. Resources, Conservation and Recycling 2004;41(4):307-19.
[12] Chen HC, Chen TY, Hsu CH. Effects of wood particle size and mixing ratios of HDPE on the properties of the composites. Holz als Roh- und Werkstoff 2006;64(3):172-77.
[13] Wang Y, Yeh FC, Lai SM, Chan HC, and Shen HF. Effectiveness of functionalized polyolefin as compatibilizers for polyethylene/wood flour composites. Polymer Engineering and Science 2003;43(4):933-45.
[14] Stokke DD and Gardner DJ. Fundamental aspects of wood as a component of thermoplastic composites. . Journal of Vinyl & Additive Technology 2003;9(2):96-104.
[15] Matuana LM, Balatinecz JJ, Sodhi RNS, Park CB. Surface characterization of esterified cellulosic fibres by XPS and FTIR spectroscopy. Wood Science and Technology 2001;35(3):191-201.
[16] Balsuriya PW, Ye L, Mai YW. Mechanical properties of wood flake–polyethylene composites II: Interface modification. Journal of Applied Polymer Science 2002;83:2505-21.
[17] Felix JM, Gatenholm P. Effect of compatibilizing agents on the interfacial strength in cellulose-polypropylene composites. Publication by ACS, Washington DC, USA; 1991:123-24.
[18] Kazayawoko M, Balatinecz JJ, Woodhams RT. Diffuse reflectance fourier transform infrared spectra of wood fibres treated with maleated polypropylenes. Journal of Applied Polymer Science 1997;66(6):1163-73.
[19] Kininmonth JA and Whitehouse LJ. (Editor). Properties and uses of New Zealand radiata pine: Forest Research Institute, Rotorua, 1991.

56
CHAPTER 4 PERFORMANCE OF RECYCLED AND VIRGIN
POLYPROPYLENE AND SAWDUST COMPOSITES Abstract
The performance of wood plastic composite (WPC) made using either recycled polypropylene (rPP) or virgin PP together with wood sawdust (Pinus radiata) was evaluated and compared in terms of dimensional stability, and tensile and flexural properties. It was found that composites made form rPP through hot-press moulding exhibited excellent dimensional stability, which was comparable to those made from virgin PP (vPP). The tensile and flexural properties of the rPP based composites were also equivalent to those based on vPP. Effects of maleated polypropylene (MAPP) as a coupling agent was also investigated in the rPP based composites. Incorporation of 3-5 wt. % MAPP significantly improved the dimensional stability and tensile and flexural strength of the rPP based composites at all wood flour contents. Furthermore, analysis of the fractured surface of MAPP modified composites confirmed improved interfacial adhesion due to enhanced fibre dispersion and wettability resulting from the chemical reaction between maleic anhydride in the MAPP and the hydroxyl groups of wood flour. Dimensional stability and strength properties of the composites can be improved by increasing the plastic content or by addition of coupling agent. 4.1 Introduction The concept of wood-thermoset composites date back to early 1900s, however, the development of thermoplastics based composites has only been growing in recent years [1]. Due to the undesirable stability of wood, thermoplastics such as polyethylene, polypropylene, polystyrene and poly (vinyl) chloride are used as matrix in WPCs [2]. Use of wood filler in these thermoplastics possessed advantages such as lower density, low equipment abrasiveness, low cost, biodegradability and moisture resistance over conventional inorganic fillers [3]. WPCs material is becoming a preferred building material due to its better stability and mechanical properties as compared to wood. In

57
previous studies on WPC product development and commercial manufacturing, virgin thermoplastics have commonly been used, however, use of recycled thermoplastics are attracting greater interests recently [1]. Consequently, increased usage of recycled thermoplastics such as PP and wood waste to manufacture WPCs offers the prospect of lessening waste disposal problems while lowering production costs. A significant number of published papers are available for vPP based wood flour/fibres composites with regard to the resulting mechanical properties and dimensional stability [4-7], interface adhesion [8-10] and durability[11]. The mechanical properties of vPP and pine wood flour composites had improved with MAPP coupling agent and ethylene/propylene/diene terpolymers (EPDM) or maleated styrene–ethylene/butylene–styrene triblock copolymer (SEBS–MA) impact modifiers [8]. Ichazo et al. [4] examined the mechanical, morphological and thermal properties of composites made of vPP and wood flour treated with sodium hydroxide, vinil-tris-(2-metoxietoxi)-silane and MAPP. It was reported that the tensile properties were increased and the interface bonding between plastic and wood filler were improved with all of the treatments studied. According to Stark [5], the increases in tensile and flexural strength, and elastic modulus of the wood flour-PP (40 wt. %) composites were found to correspond with increases in aspect ratio and incorporation of the MAPP in the formulation. Danyadi et al. [10] studied the interfacial adhesion of MAPP coupled compression moulded wood flour-PP composites. It was reported that the MAPP with higher molecular weight and smaller functionality proved to be more advantageous in the improvement of composite strength. Sombatsompop et al. [12] reported that increasing the wood fibre into the PP matrix reduced the overall strength and toughness of the composites, while incorporation of MAPP and higher impact modifier concentration (ethylene-octene copolymer and ethylene methyl acrylate) improved the mechanical properties. Further, mechanical properties of the isostatic-vPP and wood flour composites were also affected by the compounding techniques (two-roll mill, high-speed mixer and twin-screw extruder). Better mechanical strength and lowest values of water absorption was exhibited for composites compounded in extruder [13].

58
On the other hand, studies on the performance and processing of recycled PP based WPCs are very limited [14-18]. Khalil et al. [14] investigated the hot-press moulded rPP and sawdust (0 to 50 wt. %) composites with different wood filler sizes (100, 212, and 300 µm). They reported that the composites with a smaller particle size had higher mechanical properties and lower water absorption. Increase in wood filler content up to 30 wt. % improved the composite mechanical properties but that value decreased dramatically above 30% filler loading. Gosselin et al. [15] studied the morphological properties of injection moulded microcellular foams made from yellow birch wood fibres (0 to 40 wt. %) and recycled HDPE/PP matrix or with the MAPP (0 to 10 wt. %). The mechanical properties of hot-press moulded composites made from sawdust and virgin and/or recycled PP was studied by Najafi et al. [16] who reported that composites containing PP (25% each of virgin and recycled) exhibited higher stiffness and strength than pure virgin plastics. An increase in impact strength of the composites with adding 50wt.% wood filler had been observed for the composite made of pine sawdust and rPP with 5wt.% MAPP (Epolene E-43) coupling agent [17]. Further studies on the WPCs made from rPP and wood fibre [18] had shown that young’s modulus was increased remarkably, and elongation at break and impact strength were decreased with lower wood content (20-40 wt. %). From these studies, it was also found that most of the research into rPP as a matrix for WPCs had concentrated on either the use of a single type of plastic from the waste stream, or mixing of recycled and virgin plastics. The post-consumer plastics may contain many different grades, colours and contaminants, leading to varied performance when combined with wood fillers (fibres or flour) and processed via different methods. Therefore, in this chapter, performance of WPC based on recycled PP and sawdust wood flour was presented. The effect of fibre loadings, polymer form (recycled and virgin) and coupling agent on the dimensional stability, mechanical properties and microstructure of the composites was studied. 4.2 Experimental The details of material preparation and test procedures on the PP series composites panels were presented in Chapter 2. The properties evaluated were similar to those in the HDPE series composites, which included dimensional stability, mechanical properties and the morphology of the fractured surface. The composite samples were

59
conditioned at 23±2°C and RH of 50± 5% for at least 40 h before the test. The composites formulations used in this study are given in Table 2.4 in Chapter 2. 4.3 Results and discussion 4.3.1 Water absorption and thickness swelling The target density of the composite panel was 950 kg/m3, however, the measured density of the composites varied from 891-1040 kg/m3. Dimensional stability of the composites was investigated for both vPP and rPP with and without addition of the MAPP coupling agent. From the experimental results illustrated in Fig.4.1, it was found that the water absorption increased with increasing wood content in the composites – a trend that is true both for 2 h and for 24 h water immersion. It was also found that the water absorption for 2h immersion varied from 0.46 to 1.25%, and after 24 h water immersion, the water absorption increased from 1.17 to 4.6% depending on the composite formulations. In addition, the rPP50W50 (50 wt. % rPP and 50 wt. % wood flour) composite exhibited more water absorption than the rPP60W40 composite (60 wt. % rPP and 40 wt. % wood flour). The water absorption of the entirely rPP or entirely vPP was only 0.03-0.04% after 2 h and 0.05% after 24 h water immersion. The composites made of rPP had lower water absorption compared to those made of vPP given the same wood to PP ratio. It was also noted that the coupling agent (MAPP) can significantly reduced the water absorption. As the rPP may had experienced chain scission beforehand a part of OH- of polymer already consumed by the wood flour, thus having lesser water resident sites. Additionally the fibre dispersion was poor in case of vPP matrix composites. When coupling agent was added, the influence of the plastic to wood ratio was no longer as important as in the composite without the coupling agent. With 3-5 wt. % MAPP, the water absorption at 24 immersions was reduced by about 71 to 79% in the rPP50W50 composite formulation.

60
0.0
2.0
4.0
6.0
r P P1 0 0
v PP 50 W
5 0
r P P5 0 W
5 0
r P P4 7 W
5 0 CA 3
r P P6 0 W
4 0
r P P4 5 W
5 0 CA 5
Wate
r abso
rption
(%) 2 h 24 h
Fig. 4.1. Water absorption by the PP based composites after 2 and 24 h water
immersion. Thickness swelling of the wood-PP composites had similar trend as the water absorption and composites with high water absorption also showed high thickness swelling (Fig. 4.2). From Fig.4.2, the thickness swelling values for the 2 h immersion varied from 0.38 to 1.29%, and these values were increased after 24 h immersion, varying from 0.82 to 2.51% depending on the composite formulation. Samples made with lower content of wood flour had the lowest thickness swelling as for the water absorption. However, MAPP coupled composites showed less thickness swell than composite samples without the coupling agent at the same wood content. In general, the composite made of virgin and recycled PP had similar dimensional stability properties without adding the coupling agent. However, the stability properties of these composites were improved by adding 3-5 wt. % MAPP coupling agent. The impact of wood to plastic ratio on the water absorption and thickness swelling can be explained by water absorption behaviour of wood and plastic. As cellulose fibre is the main component in the wood flour, the absorbed water mostly resides in the regions such as the fibre lumens, the cell wall, and the gaps at the interface between the wood

61
fibre and the polymer matrix [3]. The presence of hydroxyl and other polar groups in various constituents of the wood flour resulted in poor compatibility between hydrophilic wood flour and hydrophobic plastic, which increased the water absorption. With the increase in wood content, there are more water residence sites thus more water was absorbed. With the addition of MAPP (3-5%) the compatibility between wood flour and PP was improved because the anhydride moieties in MAPP entered into an esterification reaction with the surface hydroxyl groups of wood flour [19]. This lowered the water absorption sites and reduced the water absorption in MAPP coupled composites. The other possible reason for less water absorption by the MAPP coupled composites could be the change in crystallinity (Xc) of WPCs. The Xc was increased form 36.9 to 52.6% with 5 wt. % MAPP coupling to rPP50W50 composite (Table 6.4). As the crystalline regions are impermeable to the penetrant, the water absorption was obviously less in the MAPP coupled composites as compared to non-coupled composites. The composites based on rPP based composites absorbed less water compared with vPP based composites for same wood and plastic content. The possible reason could be the enhanced dispersion and interfacial bonding due to the presence of chemical impurities through better surface wetting during processing.
0.0
1.0
2.0
3.0
4.0
r P P1 0 0
v PP 50 W
5 0
r P P5 0 W
5 0
r P P4 7 W
5 0 CA 3
r P P6 0 W
4 0
r P P4 5 W
5 0 CA 5
Thick
ness
swell
ing (%
)
2 h 24 h
Fig. 4.2. Thickness swelling by the PP based composites after 2 and 24 h water
immersion.

62
4.3.2 Tensile and flexural properties The results of the tensile strength and flexural properties of the wood-PP composites are given in Table 4.1. As it can be seen from the table, the tensile strength of the wood-PP composites lied in the range of 13 to 22.9 MPa depending upon composite formulations. The composites based on rPP exhibited higher tensile strengths compared to those based on vPP for 50 wt. % wood flour content. For example, with a plastic to wood ratio of 50:50, composites based on rPP had a tensile strength value of 14.5 MPa while that of composite based on vPP was 13.2 MPa. This is because of higher molecular weight of rPP (MFI: 21g/10 min. 2.16kg/190oC) as compared to vPP (25 g/10 min. 2.16kg/190oC) as MFI is inversely proportional to MFI. The tensile strength increases with molecular weight due to the effect of better entanglement. In addition, the tensile strength of the composite with coupling agent (MAPP) was higher and increased with the MAPP loadings. For example, the tensile strength was increased by 35 and 58 %, respectively, with addition of 3 or 5% MAPP in the 50wt. % wood flour composite formulation. The tensile strength of MAPP coupled composites was comparable and even better than the pure PP sample. Table 4.1 Tensile and flexural properties of the wood flour-PP composites.
Flexural properties Composite specimen code MOR
(MPa) MOE (GPa)
Yield strength (MPa)
Elongation at break (%)
Tensile strength (MPa)
rPP100 31.1 (2.9*) 1.25 (0.02) 17.3 (0.7) 3.70 (0.30) 21.7(1.1) vPP50W50 14.7 (0.7) 1.68 (0.01) 7.9 (0.2) 1.55 (0.13) 13.2 (1.8) rPP50W50 17.4 (0.4) 1.72 (0.02) 9.2 (0.4) 1.86 (0.18) 14.5 (1.4) rPP47W50CA3 34.5 (1.1) 2.07 (0.03) 19.9 (0.3) 2.44 (0.03) 19.6 (1.9) rPP60W40 22.0 (0.6) 1.71 (0.03) 11.1 (1.2) 2.50 (0.20) 13.3 (1.1) rPP45W50CA5 39.6 (1.3) 2.43 (0.03) 21.4 (1.2) 2.53 (0.3) 22.9 (3.4) Note: *values in the parentheses are standard deviation. The values given are the average of five replicate samples. The flexural strength (MOR) and Young’s modulus (MOE) were obtained from 3 points bending tests and values are given in Table 4.1. The flexural MOR exhibited similar trend as the tensile strength. The rPP based composites had a flexural MOR varying

63
from 17.4 to 39.6 MPa whereas vPP based composite had a value of 14.7 MPa at failure. It was also observed that the MOR increases with decreasing wood content. Similarly, the flexural MOE for the rPP composites varied from 1.7 to 2.4 GPA and that of the composite using the vPP HDPE was 1.7GPa. As expected from the rule of mixtures, addition of wood flour into the PP matrix significantly increased MOE of the composites and MOE value increased with the wood content. With a similar trend to the tensile results, the addition of the coupling agents also significantly improved the flexural strength as well as the stiffness of the composites. The MOR of composites made of 50% wood flour increased from 17.4 to 34.5 MPa by adding 3 wt. %, and to 39.6 MPa by adding 5 wt. % MAPP. The flexural MOR and MOE of the composites made from the rPP were slightly higher than those of vPP based composites at the same plastic to wood ratio. The MOE value of rPP based composites was higher as compared to that made from vPP. It was observed that for the non-coupled composite formulations, incorporation of wood flour into the PP matrix did affect the MOR more as compared to MOE. The yield strength of composites followed the similar trend as that of flexural MOR for all composite formulations. The load-displacement curves of the pure PP composites and the wood flour-PP composites are shown in Fig. 4.3, which illustrates the effects of the filler loading and MAPP addition. The load-displacement curves for the PP-wood composites had relatively high slopes initially, but as failure occurred, the loads dropped off quickly as the material crumbled. However, the pure PP specimen reached ultimate capacity after significant deformation (15 mm in this case), and then the load decreased gradually until the test was concluded, indicating ductile behaviour. The addition of wood flour in the composites increased the stiffness and brittleness, however, reduced the elongation at break. The stress concentration at the fibre ends and poor interface bonding between wood and PP matrix have been recognized as the main causes for the embrittlement. Nevertheless, coupling agent (MAPP) improved interfacial bonding between the filler and the matrix and improved the flexural strength. However, during loading, fractures occurred at the filler locations, and these fracture locations were more brittle than other parts of the matrix. Hence, these composites showed little change in the specimen appearance in the initial stage of loading until the maximum load was reached when the

64
specimen failed suddenly with extensive breakage at the interface between the wood flour and the matrix. The elongation at break of the wood flour-PP composites was much lower than that of pure PP panel. This decrease was probably due to the higher degree of brittleness introduced by the incorporation of wood fibres into the PP matrix. As in the case of modulus, improving the adhesion between fibres and PP did not enhance elongation at break.
0
0.1
0.2
0.3
0.4
0 5 10 15 20Displacement (mm)
Load
(kN)
rPP100 vPP50W50rPP50W50 rPP47W50CA3rPP45W50CA5 rPP60W40
Fig. 4.3. Load displacement curves for the entirely PP and wood flour-PP composites.
The tensile and flexural properties variation of composites based on recycled and virgin PP can be explained differently. It was found that composites based on rPP exhibited higher tensile and flexural properties than those based on vPP for the same plastic to wood ratio This is probably due to the better fiber dispersion within the recycled HDPE matrix by the increased surface wettability induced from the chemical impurities presents. Although, rPP had lower MFI than that of vPP, the enhanced wettability may be due to chemical impurities present in the rPP. The MAPP coupled composites showed highest tensile and flexural properties for all of the composites tested. The observed increase in tensile and flexural properties was attributed to the improved interfacial bonding between the wood flour and PP matrix as well as the modification of
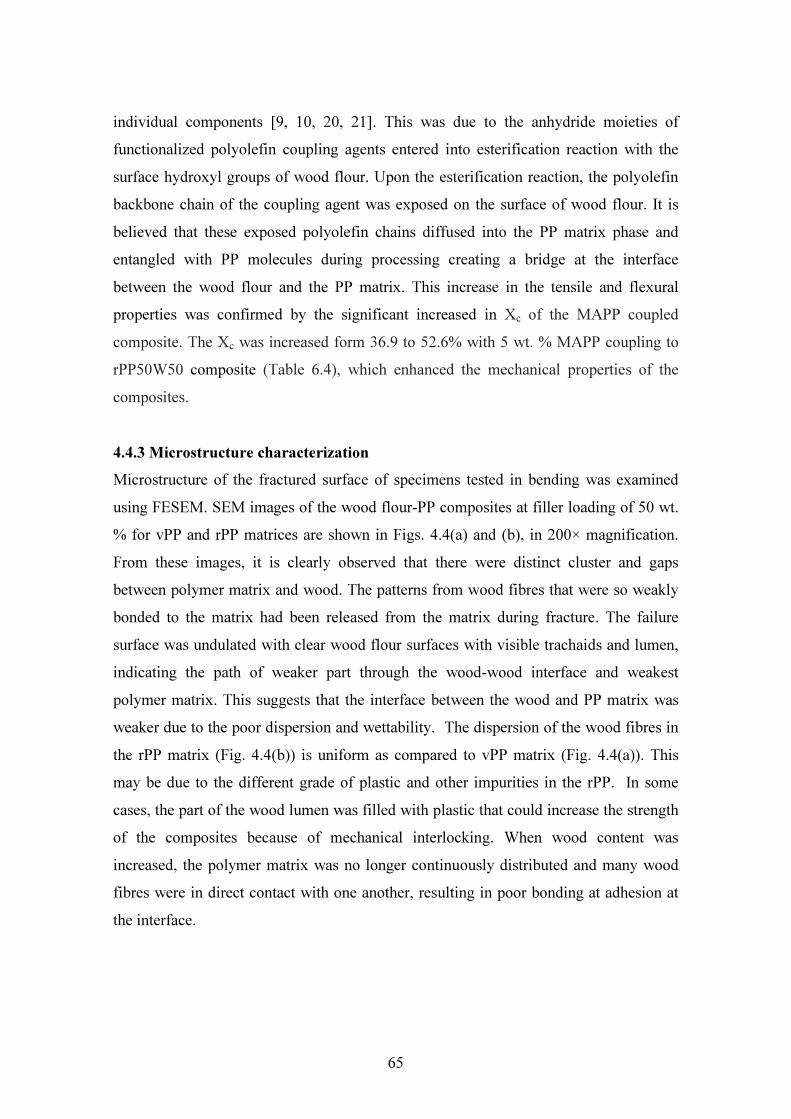
65
individual components [9, 10, 20, 21]. This was due to the anhydride moieties of functionalized polyolefin coupling agents entered into esterification reaction with the surface hydroxyl groups of wood flour. Upon the esterification reaction, the polyolefin backbone chain of the coupling agent was exposed on the surface of wood flour. It is believed that these exposed polyolefin chains diffused into the PP matrix phase and entangled with PP molecules during processing creating a bridge at the interface between the wood flour and the PP matrix. This increase in the tensile and flexural properties was confirmed by the significant increased in Xc of the MAPP coupled composite. The Xc was increased form 36.9 to 52.6% with 5 wt. % MAPP coupling to rPP50W50 composite (Table 6.4), which enhanced the mechanical properties of the composites. 4.4.3 Microstructure characterization Microstructure of the fractured surface of specimens tested in bending was examined using FESEM. SEM images of the wood flour-PP composites at filler loading of 50 wt. % for vPP and rPP matrices are shown in Figs. 4.4(a) and (b), in 200× magnification. From these images, it is clearly observed that there were distinct cluster and gaps between polymer matrix and wood. The patterns from wood fibres that were so weakly bonded to the matrix had been released from the matrix during fracture. The failure surface was undulated with clear wood flour surfaces with visible trachaids and lumen, indicating the path of weaker part through the wood-wood interface and weakest polymer matrix. This suggests that the interface between the wood and PP matrix was weaker due to the poor dispersion and wettability. The dispersion of the wood fibres in the rPP matrix (Fig. 4.4(b)) is uniform as compared to vPP matrix (Fig. 4.4(a)). This may be due to the different grade of plastic and other impurities in the rPP. In some cases, the part of the wood lumen was filled with plastic that could increase the strength of the composites because of mechanical interlocking. When wood content was increased, the polymer matrix was no longer continuously distributed and many wood fibres were in direct contact with one another, resulting in poor bonding at adhesion at the interface.

66
Fig. 4.4. SEM images (×200) of fractured surface of (a) vPP50W50, (b) rPP50W50 Fig. 4.5. SEM images (×200) of fractured surface of (a) r PP47W50CA3, (b) rPP45W50CA5 Figs. 4.5(a) and (b) show SEM images of fracture surface of the 3 and 5 wt. % MAPP incorporated composites filled with 50 wt. % wood flour. SEM image showed that there were no clear gap between wood flours and PP matrix, indicating the good interface bonding. The fracture surface of the composite showed a very limited amount of torn matrix, suggesting that the matrix was more brittle than those composites without MAPP. It was also seen that a crack running through the wood fibre, and this could be an indication of stress-transfer from the matrix to the wood fibres. The interfacial bonding between the filler and the PP matrix was improved due to the esterification mechanism [21], and the fracture occurred at the filler itself. This means that the stress was well propagated between the filler and the matrix polymer, resulting in enhanced
a b
a b
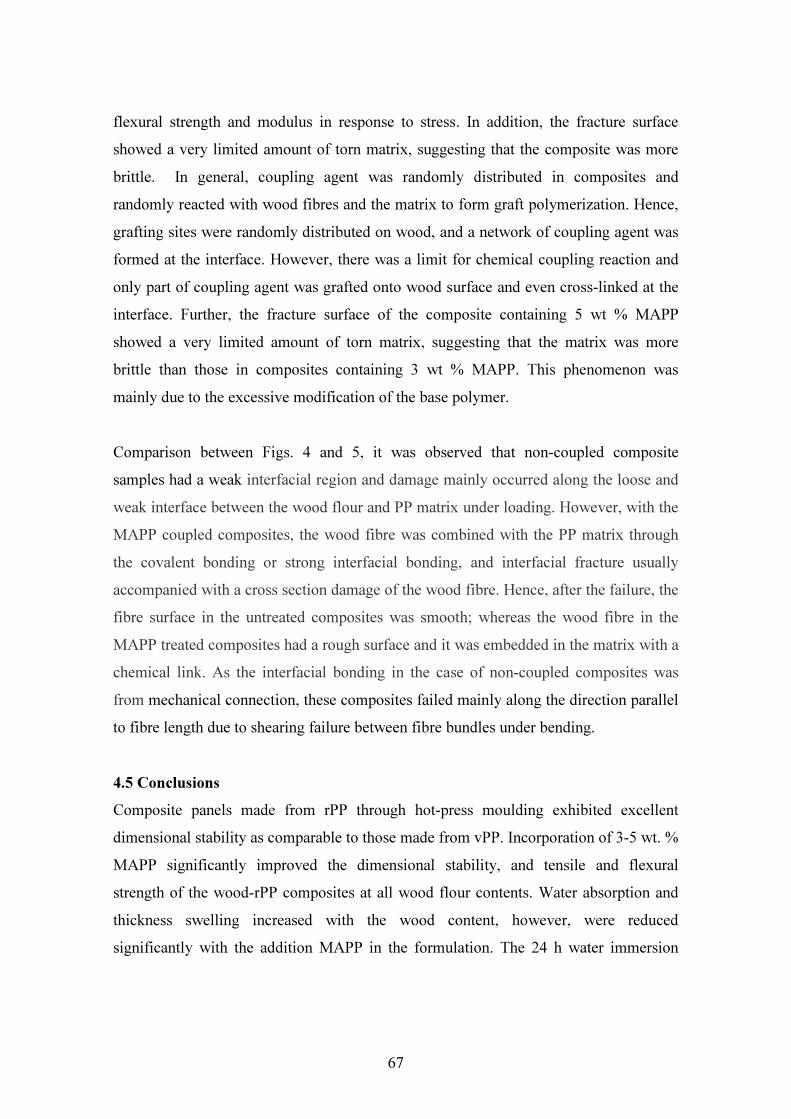
67
flexural strength and modulus in response to stress. In addition, the fracture surface showed a very limited amount of torn matrix, suggesting that the composite was more brittle. In general, coupling agent was randomly distributed in composites and randomly reacted with wood fibres and the matrix to form graft polymerization. Hence, grafting sites were randomly distributed on wood, and a network of coupling agent was formed at the interface. However, there was a limit for chemical coupling reaction and only part of coupling agent was grafted onto wood surface and even cross-linked at the interface. Further, the fracture surface of the composite containing 5 wt % MAPP showed a very limited amount of torn matrix, suggesting that the matrix was more brittle than those in composites containing 3 wt % MAPP. This phenomenon was mainly due to the excessive modification of the base polymer. Comparison between Figs. 4 and 5, it was observed that non-coupled composite samples had a weak interfacial region and damage mainly occurred along the loose and weak interface between the wood flour and PP matrix under loading. However, with the MAPP coupled composites, the wood fibre was combined with the PP matrix through the covalent bonding or strong interfacial bonding, and interfacial fracture usually accompanied with a cross section damage of the wood fibre. Hence, after the failure, the fibre surface in the untreated composites was smooth; whereas the wood fibre in the MAPP treated composites had a rough surface and it was embedded in the matrix with a chemical link. As the interfacial bonding in the case of non-coupled composites was from mechanical connection, these composites failed mainly along the direction parallel to fibre length due to shearing failure between fibre bundles under bending. 4.5 Conclusions Composite panels made from rPP through hot-press moulding exhibited excellent dimensional stability as comparable to those made from vPP. Incorporation of 3-5 wt. % MAPP significantly improved the dimensional stability, and tensile and flexural strength of the wood-rPP composites at all wood flour contents. Water absorption and thickness swelling increased with the wood content, however, were reduced significantly with the addition MAPP in the formulation. The 24 h water immersion
68
absorption was reduced by 79 % in the composite made of 50 wt. % of rPP matrix with an addition of 5 wt. % MAPP in the formulation. Mechanical properties of rPP based composites were similar to and comparable trend that of vPP based composites. The composites with low wood content (or pure PP panel) and coupled with the MAPP had better tensile strength and flexural properties. However, the composites made with lower wood content without the coupling agent showed lower stiffness. The addition of the MAPP reduced the ductility and elongation at the breaking point. Comparison of the SEM images of the fracture surfaces of wood flour-PP composites with and without the coupling agent confirmed that an addition of MAPP improved the interfacial bonding. This was attributed due to the enhanced fibre dispersion and wettability resulting from the chemical reaction between maleic anhydride in the MAPP and the hydroxyl groups of wood flour. The results of the present work clearly show that rPP and wood sawdust can be successfully used to produce stable and strong WPCs. Dimensional stability and mechanical properties of composites can be achieved by increasing the polymer content or by addition of coupling agents. 4.6 References [1] Clemons C. Wood-plastics composites in the United States: The interfacing of two
industries. Forest Product Journal 2002;52(6). [2] Dietrich B. PVC-origin, growth and future. Journal of Vinyl and Additive
Technology 2001;7(4). [3] Stokke DD and Gardner DJ. Fundamental aspects of wood as a component of
thermoplastic composites. Journal of Vinyl & Additive Technology 2003;9(2):96-104.
[4] Ichazo MN, Albano C, Gonzalez J, Perera R, Candal MV. Polypropylene/wood flour composites: treatments and properties. Composite Structures 2001;54:207-14.
[5] Stark NM, Rowlands RE. Effects of wood fibre characteristics on mechanical properties of wood/polypropylene composites. Wood and Fibre Science 2003;35(2):167-74.
69
[6] Nunez AJ, Sturm PC, Kenny JM, Aranguren MI, Marcovich NE, Reboredo MM. Mechanical characterization of polypropylene-wood flour composites. Journal of Applied Polymer Science 2003;88:1420-28.
[7] Salemane MG, Luyt AS. Thermal and mechanical properties of polypropylene-wood powder composites. Journal of Applied Polymer Science 2006;100:4173-80.
[8] Okaman K and Clemons C. Mechanical properties and morphology of impact modified polypropylene wood flour composites. Journal of Applied Polymer Science 1998; 67:1503-13.
[9] Felix JM, Gatenholm P. Effect of compatibilizing agents on the interfacial strength in cellulose-polypropylene composites. Publication by ACS, Washington, USA; 1991. 23-24.
[10] Danyadi L, anecska T, Szabo Z, Nagy G, Moczo J, Pukanszky B. Wood flour filled PP composites: compatibilization and adhesion. Composites Science and Technology 2007; 67:2838–46.
[11] Seldén R, Nyström B, Långström R. UV aging of poly(propylene)/wood-fibre composites. Polymer Composites 2004; 25(5):543-53.
[12] Sombatsompop N. Influence of type and concentration of maleic anhydride grafted polypropylene and impact modifiers on mechanical properties of PP/wood sawdust composites. Journal of Applied Polymer Science 2005;97(2):475-84.
[13] Bledzki AK, Letman M, Iksne A, Rence L. A comparison of compounding processes and wood type for wood fibre—PP composites. Composites: Part A Applied Science and Manufacturing 2005;36:789–97.
[14] Khalil HPSA, Shahnaz SBS, Ratnam MM, Ahmad F and Nik Fuaad NA. Recycle polypropylene (RPP) - wood sawdust composites - Part 1: The effect of different filler size and filler loading on mechanical and water absorption properties. Journal of Reinforced Plastics and Composites 2006;25(12):1291-303.
[15] Gosselin R, Rodrigue D and Riedl B. Injection molding of postconsumer wood–plastic composites II: mechanical properties. Journal of Thermoplastic Composite Materials 2006;19:659-69.
[16] Najafi SK, Hamidinia E, Tajvidi M. Mechanical properties of composites from sawdust and recycled plastics. Journal of Applied Polymer Science 2006;100(5):3641-45.

70
[17] Li TQ, NG CN, Li RKY. Impact behaviour of sawdust/recycled-PP composites. Journal of Applied Polymer Science 2001;81(6):1420-28.
[18] Dintcheva NT, Mantia FP La. Recycling of the light fraction from municipal post-consumer plastics: effect of adding wood fibres. Polymers for Advanced Technologies 1999;10(10):607-14.
19] Matuana LM, Balatinecz JJ, Sodhi RNS, Park CB. Surface characterization of esterified cellulosic fibres by XPS and FTIR spectroscopy. Wood Science and Technology 2001;35(3):191-201.
[20] Rodrigo IP, Cantero G, Arbelaiz A. and Mondragon I. Wood fibre-PP composites: effects of fibre treatments on mechanical behaviour. Proceedings of sixth international conference on wood-fibre-plastic composites May 15-16, 2001; Wisconsin, USA.
[21] Kazayawoko M, Balatinecz JJ, Woodhams RT. Diffuse reflectance Fourier transform infrared spectra of wood fibres treated with maleated polypropylenes. Journal of Applied Polymer Science 1997;66(6):1163-73.

71
CHAPTER 5 LONG-TERM MOISTURE ABSORPTION AND THICKNESS
SWELLING BEHAVIOUR OF RECYCLED THERMOPLASTICS REINFORCED WITH PINUS RADIATA SAWDUST
Abstract
Wood plastic composites (WPCs) were made from Pinus radiata wood flour, and recycled and virgin thermoplastics, mainly high density polyethylene (HDPE) and polypropylene (PP), by using hot-pressing moulding. Long-term water absorption and thickness swelling kinetics of the composites were investigated with water immersion. It was found that the water absorption and thickness swelling increased with wood content and water immersion time before an equilibrium condition was reached. The composites made from the recycled plastics showed comparable results as those made of the virgin plastics. It was found that the water absorption and thickness swelling can be reduced significantly with incorporation of MAPP coupling agent in the composite formulation. Microstructures of the composites were examined to understand the mechanisms for the wood-plastic interaction which affects the water absorption and thickness swelling. Further studies were conducted to model the water diffusion and thickness swelling of the composites. Diffusivity and swelling rate parameters in the models were obtained by fitting the model predictions with the experimental data. 5.1 Introduction Although use of wood filler in plastic composites has several advantages over inorganic fillers, hydrophilic nature of the wood has a negative effect on the overall performance of WPCs [1]. Increased moisture content in the composite reduces their mechanical properties and dimensional stability [2]. However, it was found that incorporation of coupling agents such as functionalised polyolefin can improve the overall properties through enhanced compatibility between the hydrophilic wood filler and the hydrophobic polymer matrix [3-5]. The wood flour is preferred over wood fibre in WPCs in some applications such as the exterior decking and flooring. WPCs products

72
typically contain approximately 50 wt. % wood, although some composites contain much less wood and others contain as much as 70 wt. % [6]. Wood flour content in WPCs mainly depends on WPC product applications, and the processing methods employed. In building applications, dimensional stability of WPCs is critical, especially for outdoor use. To improve the stability, understanding of the water absorption process and impact of the absorbed water on the dimensional change is important [2, 7-10]. Previous studies have applied diffusion theory to quantify the water absorption process in WPCs [11-14]. Most of these studies have mainly focused on natural fibres and virgin thermoplastic matrices for the composite formulations. In this chapter, the characteristics of water sorption kinetics and thickness swelling behaviour in WPCs made from recycled HDPE (rHDPE) and recycled PP (rPP) with pine wood flour was investigated. 5.2 Theoretical approach 5.2.1 Mechanisms of water transport The transport of water through composite materials may theoretically follow different mechanisms depending on factors such as the chemical nature of polymer, dimensions and morphology of the wood filler and polymer-filler interfacial adhesion [15]. In general, the water transport behaviour in polymer matrix composites can be Fickian diffusion, relaxation controlled, and Non-Fickian or anomalous. These three cases of water transport can be distinguished theoretically by the shape of the sorption curve represented by the following equation [16, 17]:
)log()log(log tnkMMm
t +=
(5.1)
Where Mt is the moisture content at specific time (t), Mm is the equilibrium moisture content (EMC), and k and n are constants. The value of coefficient n shows different behaviour between the three cases of water transport: Fickian diffusion (n = 0.5), relaxation (n≥1) and anomalous transport (0.5< n <1.0). The coefficients (n and k) can be determined from the slope and the intercept of Mt/Mm versus t in the log plot which can be drawn from experimental data of moisture absorption with time.

73
5.2.2 Diffusivity determination The most commonly used method in determination of the Fickian mass diffusivity in polymer composites was developed by Shen and Springer [18]. This method assumed one dimensional, unsteady diffusion through the thickness of the composite panel where the flat face is much greater than the thickness as expressed by Equation (5.2). The analytical solution of this equation for a plane sheet with uniform distribution of initial moisture concentration through the thickness can be obtained as expressed by Equation (5.3) which is for the overall moisture gain via both faces of the composite panel for a short period of time [16, 17]:
2
2
zCD
tC
x ∂∂=
∂∂ (5.2)
thDMM x
mt 24π
= (5.3)
Where Mt is the average moisture content over the panel at any time (t), Mm denotes the corresponding EMC after sufficient time when the mass gain is insignificant, Dx denotes diffusivity, and h is the thickness of the composite panel. Equation (5.3) indicates that the mass of the sample increases with time without an upper limit. The surface equilibrium moisture content is in this case the average moisture content when the sample is kept sufficient time in the water immersion. This moisture content may not be the true equilibrium moisture content but is very close to the surface moisture content when the composite is in contact with the water. Therefore, the diffusion equation here was only used to describe the moisture ingress dynamics at the initial stage of the process provided that the sample geometry mimicked an infinitely wide slab. For such cases, one can utilize this equation to determine diffusivity by equating the slope of Equation (5.3) with respect to the root square of the time to the slope determined from experimental data. The resulting closed form solution for the diffusivity from Equation (5.3) with correction for edge effect [13] is given as follows:
22
14
+
+
=
bh
lh
MD
m
x
θπ (5.4)

74
Where θ is the slope of linear portion of Mt versus ht / plot, l is the panel length and b is the panel width. Thus, the moisture absorption of WPCs can be determined by using either Equation (1) or Equation (5.4). However, it should be noted that these two equations are only applicable for a certain period of time from the start of water immersion which can be estimated once the EMC is known. Once the diffusivity (Dx) is known, the permeability (P) and thermodynamic solubility (S) parameters of the composites can be determined. The solubility is the amount of water absorbed per unit mass of the composite at equilibrium while the permeability is defined as the product of the diffusivity and solubility [16]: SDP x ⋅= (5.5) 5.2.3 Prediction of thickness swelling Thickness swelling is an important property that represents the stability performance of the composite. Generally, the swelling rates for polymer matrix composites are low during the initial stages of moisture absorption due to the visco-elasticity of polymer matrix. In addition, any pores or voids that are present after fabrication will help to accommodate some of the swelling of the added wood. Based on these considerations, the thickness swelling of the composite panel has been determined by the following equation as proposed by Shi and Gardner [19]:
−−+=
−∞
∞ 1)(
)(00
tK srehhhhtTS (5.6)
Where ho is the initial composite panel thickness at t = 0, h∞ is the ultimate thickness of the panel at equilibrium and Ksr is the intrinsic relative swelling rate parameter. The value of Ksr in Equation (5.6) depends on how fast the composites swell and achieve the ultimate thickness swelling at equilibrium. The values of Ksr for the composites of both wood-recycled and virgin plastic based composites were determined through non-linear regression curve fitting to the experimental data.

75
5.3 Experimental The experimental variables studied were plastic type (HDPE, PP), plastic form (virgin, recycled), wood flour content and coupling agent content. Based on the plastic form, the composites were divided into two major series (HDPE and PP) to give a range of different formulations as described in Table 5.1. Water absorption and thickness swelling tests were conducted in accordance with ASTM D570-98 [20]. Long-term water immersion tests were conducted at 23±1°C for 63 days. Total five replicates from two different manufactured panels were tested for each composite formulation. The weight and thickness of the specimens were measured periodically until the samples attained equilibrium. For each measurement at preset time, the specimens were firstly taken out of the water and the liquid water attached on the surface was then removed using blotting paper. The moisture absorption was determined as the weight gain over the oven-dry weight of the samples, and calculated using the following expression:
%100)((%) ×−
=o
ot
mmmM (5.7)
Where, m0 and mt denote the oven-dry weight and weight after time t, respectively. The EMC was considered to be attained when the increase in weight per week period as shown by the three consecutive weighing averages less than 1% of total increase in weight. Thickness swelling was assessed by measuring the average thickness of each specimen during the immersion tests (ht) and after oven drying (h0), and then calculated using the following equation:
%100)((%) ×−
=o
ot
hhhTS (5.8)
5. 4 Results and discussion 5.4.1 Long-term water absorption behaviour Long-term water absorption of the composites panels were monitored by full water immersion over a period of 63 days (Fig. 5.1 and Fig. 5.2). Generally, the water

76
absorption increased with the wood filler content and immersion time until equilibrium conditions were reached. During this period, the plastic exhibited negligible water absorption while the wood flour induced significant water absorption. Water absorption was maximum for composites made of wood flour-rHDPE and wood flour-virgin HDPE (vHDPE) with 50 wt. % wood content, having water absorption of 19.5% and 23.5%, respectively, after 1512 h (Fig 5.1). Table 5.1 WPCs formulation selected for dimensional stability test (percent by weight)
Composite sample code
Plastic type
Plastic content (%)
Wood flour (%)
Coupling agent (%)
Wood flour-HDPE composites rHDPE100 Recycled 100 0 0 vHDPE60W40 Virgin 60 40 0 rHDPE70W30 Recycled 70 30 0 rHDPE60W40 Recycled 60 40 0 vHDPE50W50 Virgin 50 50 0 rHDE50W50 Recycled 50 50 0 rHDPE47W50CA3 Recycled 47 50 3 rHDPE45W50CA5 Recycled 45 50 5 rHDPE57W40CA3 Recycled 57 40 3 Wood flour-PP composites rPP100 Recycled 100 0 0 vPP50W50 Virgin 50 50 0 rPP50W50 Recycled 50 50 0 rPP47W50CA3 Recycled 47 50 3 rPP60W40 Recycled 60 40 0 rPP45W50CA5 Recycled 45 50 5
However, at the same wood contents, addition of 3-5 wt. % coupling agent (MAPP) to the composites significantly reduced the water absorption. This was true for the composites using both the virgin plastics and the recycled plastics. For the composites of 50 wt. % wood flour, addition of 3 wt. % coupling agent (rHDPE47W50CA3) reduced the EMC to 7.8% as compared the 19.5% EMC without coupling agent (rHDPE50W50). Similar trends were observed for the wood flour-PP series of
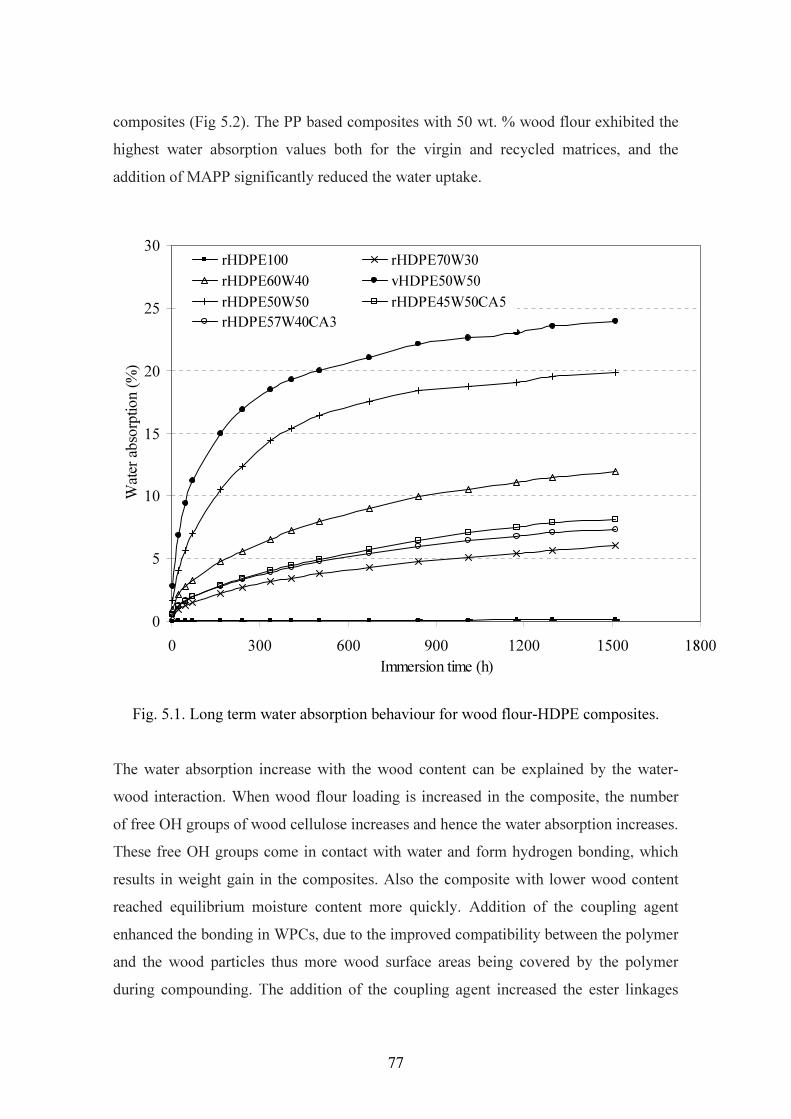
77
composites (Fig 5.2). The PP based composites with 50 wt. % wood flour exhibited the highest water absorption values both for the virgin and recycled matrices, and the addition of MAPP significantly reduced the water uptake.
0
5
10
15
20
25
30
0 300 600 900 1200 1500 1800Immersion time (h)
Wate
r abso
rption
(%)
rHDPE100 rHDPE70W30rHDPE60W40 vHDPE50W50rHDPE50W50 rHDPE45W50CA5rHDPE57W40CA3
Fig. 5.1. Long term water absorption behaviour for wood flour-HDPE composites.
The water absorption increase with the wood content can be explained by the water-wood interaction. When wood flour loading is increased in the composite, the number of free OH groups of wood cellulose increases and hence the water absorption increases. These free OH groups come in contact with water and form hydrogen bonding, which results in weight gain in the composites. Also the composite with lower wood content reached equilibrium moisture content more quickly. Addition of the coupling agent enhanced the bonding in WPCs, due to the improved compatibility between the polymer and the wood particles thus more wood surface areas being covered by the polymer during compounding. The addition of the coupling agent increased the ester linkages

78
between the hydroxyl groups of wood flour and the anhydride part of MAPP [21]. Therefore, the amount of free OH- in the wood cellulose was reduced because some of them were interacting with succinic anhydride residues of the MAPP coupling agent. Succinic acid is the by-product produced by hydrogenation of maleic anhydride. Due to these changes, the water absorption increment was rather less, compared to the composite formulation without MAPP. The other possible reason for less water absorption could be the change in crystallinity (Xc) of WPCs coupled by the coupling agent (MAPP). This was confirmed with the DSC analysis, which showed that the MAPP coupled composites had higher crystallinity as compared to non-coupled composites (Table 6.4). For example, with the addition of 5 wt. % MAPP in the rPP50W50 and rHDPE50W50 composites, Xc was increased from 36.9 to 52.6%, and 58.4 to 72.8%, respectively. Similar increase in Xc of MAPP coupled composites as compared to corresponding composites without the MAPP coupling was also observed by another study [22]. As the crystalline regions are impermeable to the penetrant, the water absorption was obviously less in the MAPP coupled composites as compared to non-coupled composites. It was interesting to note that composites based on recycled matrix absorbed less water compared with virgin plastic matrix. The possible reason is the enhanced dispersion and interfacial adhesion due to the presence of chemical impurities, different molecular and compositional differences (MFI and crystallinity) between virgin and recycled plastics. It was found that Xc of the composites with vHDPE (56.2%) was lower than that of rHDPE (58.4%) (Table 6.4), which suggested that vHDPE absorbed more water as compared to rHDPE. But in case of PP based composites the Xc of the composites with vPP (42.2%) was higher than that of rPP (36.9%) (Table 6.4), this however showed opposite trend for water absorption. It was also observed that in the composites with recycled plastics, plastic penetrated into the fibre lumens, pit holes, and other void spaces in the matrix. The composites with the virgin plastics showed more isolated fibres, and some gaps and flaws which provided more water residence sites. This can be confirmed by comparing the SEM micrographs of fractured surfaces of composite with virgin and recycled plastics (Figs. 5.3 and 5.4). The wood flour dispersion and adhesion was slightly better in WPCs with rHDPE (Fig. 3.4(a)) as compared to vHDPE (Fig.

79
3.3(b)). Similarly, wood flour dispersion and adhesion in composites with rPP was better than with virgin PP (vPP). The better dispersion of wood flour in the recycled polymer may Xc be possible due to the improved compatibility and wettability with the presence of chemical impurities. Although recycled plastic have less MFI values as compared to virgin plastic, the better penetration is possible due to improved compatibility and wettability, hence reduced the water absorption.
0
9
18
27
36
0 300 600 900 1200 1500 1800Immersion time (h)
Wate
r abso
rption
(%)
rPP100 vPP50W50rPP50W50 rPP47W50CA3rPP60W40 rPP45W50CA5
Fig. 5.2. Long term water absorption behaviour for wood flour-PP composites.
The water sorption kinetics in WPCs specimens can be evaluated through the diffusion constants (k and n) obtained from the experimental data. Fig. 5.3 and Fig. 5.4 shows the typical curve of log (Mt/Mm) as a function of log t for wood flour-PP and wood flour-HDPE composites, respectively used to determine these constants. It was observed that except for one formulation (vHDPE60W40), the value of n is close to 0.5 for all of the other composites (Table 5.2). This confirms that the Fickian diffusion can be used to adequately describe water transport in the composites, which is consistent with previous
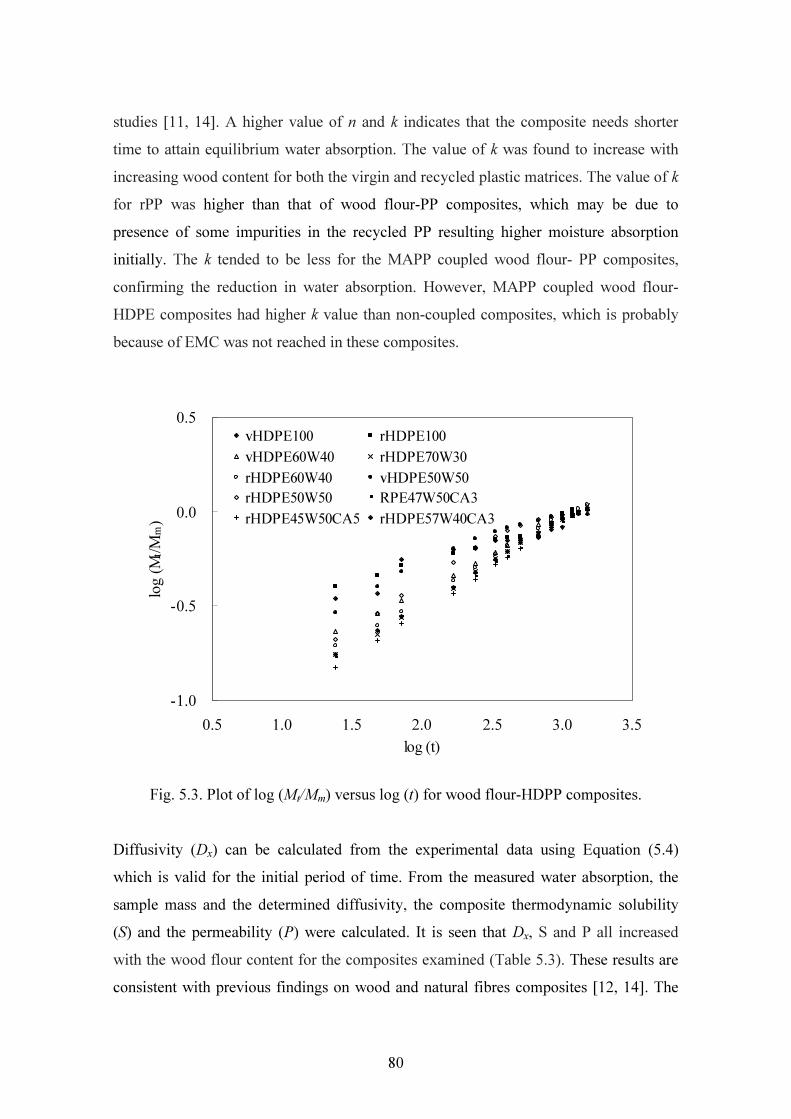
80
studies [11, 14]. A higher value of n and k indicates that the composite needs shorter time to attain equilibrium water absorption. The value of k was found to increase with increasing wood content for both the virgin and recycled plastic matrices. The value of k for rPP was higher than that of wood flour-PP composites, which may be due to presence of some impurities in the recycled PP resulting higher moisture absorption initially. The k tended to be less for the MAPP coupled wood flour- PP composites, confirming the reduction in water absorption. However, MAPP coupled wood flour-HDPE composites had higher k value than non-coupled composites, which is probably because of EMC was not reached in these composites.
-1.0
-0.5
0.0
0.5
0.5 1.0 1.5 2.0 2.5 3.0 3.5log (t)
log (M
t/Mm
)
vHDPE100 rHDPE100vHDPE60W40 rHDPE70W30rHDPE60W40 vHDPE50W50rHDPE50W50 RPE47W50CA3rHDPE45W50CA5 rHDPE57W40CA3
Fig. 5.3. Plot of log (Mt/Mm) versus log (t) for wood flour-HDPP composites.
Diffusivity (Dx) can be calculated from the experimental data using Equation (5.4) which is valid for the initial period of time. From the measured water absorption, the sample mass and the determined diffusivity, the composite thermodynamic solubility (S) and the permeability (P) were calculated. It is seen that Dx, S and P all increased with the wood flour content for the composites examined (Table 5.3). These results are consistent with previous findings on wood and natural fibres composites [12, 14]. The

81
addition of MAPP decreased Dx compared with the non-coupled composites. The vHDPE composites had higher diffusivity compared to the corresponding rHDPE composites. In contrast, the rPP composites exhibited higher diffusivity compared with composites based on virgin PP. This is possible due to contaminants present in rPP; however, the observed difference was within the experimental error and thus may not be significant.
-1.6
-1.2
-0.8
-0.4
0.0
0.4
-0.5 0.0 0.5 1.0 1.5 2.0 2.5 3.0 3.5log (t)
log (M
t/Mm
)
rPP100 vPP50W50rPP50W50 rPP47W50CA3rPP60W40 rPP45W50CA5
Fig. 5.4. Plot of log (Mt/Mm) versus log (t) for wood flour-PP composites.
The direct comparison of the diffusivity obtained from this work with previous studies is difficult due to differences in materials, manufacturing methods and test conditions. In spite of this, the magnitude of the diffusivity obtained in this work (2.76×10⁻¹² to 9.45×10⁻¹² m2/s) are similar to the reported values. Wang et al. [14] reported the value of diffusivity as 4.63×10⁻¹³ m2/s for hot pressed 50 wt. % rice hull–HDPE composites coupled with MAPP. Espert et al. [12] reported a diffusivity of 1.09×10⁻¹² m2/s for PP composites containing 30 wt. % coir fibre and a diffusivity of 1.83×10⁻¹² m2/s for composites containing 30 wt. % luffa fibre. Tajvidi et al. [23] prepared injection

82
moulded 50 wt. % wood flour-PP composites with 2 wt. % MAPP with a determined diffusivity of 1.33×10⁻¹¹ m2/s.
Table 5.2 Diffusion case selection parameters. Composite specimen code n k (hr-n) vHDPE60W40 0.3530 0.0839 rHDPE70W30 0.4165 0.0495 rHDPE60W40 0.4037 0.0599 vHDPE50W50 0.3865 0.0887 rHDPE50W50 0.4210 0.0605 rHDPE47W50CA3 0.4072 0.0525 rHDPE45W50CA5 0.4253 0.0435 rHDPE57W40CA3 0.4049 0.0562 rPP100 0.5300 0.0332 vPP50W50 0.5535 0.0295 rPP50W50 0.5687 0.0285 rPP47W50CA3 0.4260 0.0384 rPP60W40 0.4906 0.0246 rPP45W50CA5 0.4379 0.0381
5.4. 2 Long-term thickness swelling behaviour Thickness swelling of the wood flour-thermoplastic composites was determined in the experiment from Equation (5.8). The results showed that the thickness swelling was the highest for the 50 wt. % wood flour-HDPE (5.8-6.6%) and 50 wt. % wood flour-PP (9.3-10.6%), which corresponded to the highest water absorption (Fig. 5.5 and Fig. 5.6). In a similar manner to the water absorption, the thickness swelling increased with wood flour content for non-coupled composites. For example, 30, 40, and 50 wt. % wood filler in the rHDPE based composites exhibited equilibrium thickness swelling values of about 2.2, 4.4 and 6.6%, respectively (Fig. 5.5). However, the equilibrium thickness swelling of 50 wt. % wood flour-rHDPE composite was reduced from 6.6% to 2.8% with the addition of 3 wt. % MAPP. It is interesting to note that the thickness swelling of the 50 wt. % wood flour–vHDPE composite was greater than the 50 wt. % wood flour–rHDPE composite up to 300 h. After this time, the thickness swelling of the 50

83
wt. % wood flour–vHDPE composite was almost stable whereas the swelling of the 50 wt. % wood flour–rHDPE composite continued. The high thickness swelling for the wood flour-vHDPE in the initial stage of water immersion is possible due to the poor fibre dispersion and adhesion in the composite with the vHDPE matrix, which allowed easy access of water to cellulose. The thickness swelling for wood flour-PP composites followed a similar trend to the water absorption behaviour, increasing with immersion time until an equilibrium condition was attained (Fig. 5.6). For example, the equilibrium thickness swelling of the 40 and 50 wt. % wood filler in recycled PP matrix were 7.3 and 9.3%, respectively. Similarly to the HDPE based composites, the thickness swelling of the 50 wt. % wood flour-rPP composite was reduced from 9.3% to 4.1% with the addition of 3 wt. % MAPP. The experimental data was used to obtain the swelling rate parameter (Ksr) in Equation (5.6) by using non-linear regression curve fitting.
Table 5.3 Diffusivity and permeability of wood flour/ thermoplastic composites. Composite specimen code EMC (%) Diffusivity
(m2/s) Solubility parameter
Permeability (m2/s)
rHDPE100 0.12 (0.03) a vHDPE60W40 11.6 (1.4) 3.95E-12 1.13 4.45E-12 rHDPE70W30 5.63 (1.2) 3.24E-12 1.06 3.42E-12 rHDPE60W40 11.1 (1.7) 3.76E-12 1.11 4.19E-12 vHDPE50W50 23.54 (1.3) 9.45E-12 1.24 1.17E-11 rHDPE50W50 19.49 (0.8) 5.94E-12 1.19 7.10E-12 rHDPE47W50CA3 7.79 (1.4) 3.80E-12 1.09 4.15E-12 rHDPE45W50CA5 7.85 (1.5) 3.49E-12 1.09 3.79E-12 rHDPE57W40CA3 7.08 (1.6) 3.22E-12 1.08 3.47E-12 rPP100 0.21 (0.04) a vPP50W50 27.98 (1.7) 5.26E-12 1.29 6.76E-12 rPP50W50 23.23 (1.5) 6.26E-12 1.24 7.77E-12 rPP47W50CA3 9.62 (0.5) 3.43E-12 1.10 3.76E-12 rPP60W40 15.81 (0.4) 2.76E-12 1.16 3.20E-12 rPP45W50CA5 8.29 (0.7) 3.05E-12 1.08 3.30E-12
Note: *: Values given in the parentheses are average standard deviation of 5 replicate samples. a: Diffusivity was not calculated because gradient of linear portion could not determine precisely.

84
0
3
6
9
12
15
0 300 600 900 1200 1500 1800Immersion time (h)
TS (%
)rPP100 vPP50W50rPP50W50 rPP47W50CA3rPP60W40 rPP45W50CA5
Fig. 5.5. Thickness swelling versus water immersion time for wood flour-HDPE
composites.
0
3
6
9
0 300 600 900 1200 1500 1800Immersion time (h)
TS (%
)
rHDPE100 rHDPE70W30rHDPE60W40 vHDPE50W50rHDPE50W50 rHDPE45W50CA5rHDPE57W40CA3
Fig. 5.6. Thickness swelling versus water immersion time for wood flour-PP
composites.

85
0
3
6
9
12
15
0 300 600 900 1200 1500 1800Immersion time (h)
TS (%
)rPP100 vPP50W50rPP50W50 rPP47W50CA3rPP60W40 rPP45W50CA5Model fit
Fig. 5.7. Thickness swelling model fit for wood flour-PP composites.
0
2
4
6
8
10
0 300 600 900 1200 1500 1800Immersion time (h)
TS (%
)
vHDPE100 rHDPE100 vHDPE60W40rHDPE70W30 rHDPE60W40 vHDPE50W50rHDPE50W50 rHDPE47W50CA3 rHDPE45W50CA5rHDPE57W40CA3 Model fit
Fig. 5.8. Thickness swelling model fit for wood flour-HDPE composites.

86
The Ksr values, standard error, and coefficient of variation (CV) from the non-linear regression analysis are given in Table 5.4. The swelling parameter, Ksr, quantifies the rate of the composites approaching the equilibrium value for thickness swelling after sufficient time of water immersion. The higher value of Ksr indicated the higher rate of the swelling and thus the composite reached the equilibrium thickness swelling in a shorter period of time. It was found that Ksr values for the composites with the virgin plastic was higher than those of the composites made from the recycled plastics (HDPE and PP) in all levels of wood flour content. For example, the composite of 50 wt. % wood content and 50 wt. % of vPP approached the equilibrium thickness swelling about 36% faster than the rPP based composite. The swelling rate of the composites increased with the wood flour content but was reduced significantly with addition of the MAPP, which was due to the improved compatibility between polymer and wood flour through the esterification [21]. Fig. 5.7 and Fig. 5.8 shows the comparison of the predicted thickness swelling from the swelling model (Eq. 5.7) and the experimental data for PP series. It was found that the swelling model could fit the experimental data closely for both wood flour-PP composites (Fig. 5.7) and wood flour-HDPE composites (Fig 5.8). The model slightly overestimated the thickness swelling for the HDPE composites without the MAPP treatment during the immersion period after the initial fast swelling. The model prediction for the PP composites was satisfactorily accurate (R2 = 0.9) and the model accuracy appeared to be a function of the magnitude of the swelling rate parameter (Table 5.4 and Fig. 5.10). It was also observed that more accurate prediction from the swelling model could be obtained for the composites with lower thickness swelling. According to Shi and Gardner [19], the swelling rate increased linearly with the decreasing of the composite board density. Our findings support this in principle, but such relationships was not strong as shown in Fig. 5.9 with the R square value being 0.61. It reflects that the thickness swelling was a complicated behaviour and can be affected by the combination of factors such as plastic type, plastic form (virgin or recycled), wood content and more significantly the coupling agent addition. Fig. 5.10 showed a linear relationship (R2=0.95) between the

87
standard error and the swelling rate parameter (Ksr) for all of the composites investigated. Fig. 5.11 showed the relationship between the equilibrium moisture content (EMC) and the equilibrium thickness swelling of the composites and very significant relationship is confirmed (R2=0.91). The linear correlation can be expressed by an empirical equation as given in Equation (5.9). 55.035.0(%) += EMCTS (5.9) Table 5.4 Measured thickness swelling and predicted swelling rate parameter for wood flour/ thermoplastic composites.
Composite specimen code
Initial thickness (h0), mm
Final thickness (h∞), mm
Equilibrium thick. swell
(%) Swelling rate parameter (Ksr)10-3 hr-1
Standard error, (10-4 hr-
1) CV (%) R2
Wood flour-HDPE composites vHDPE60W40 6.61 6.95 4.86 (0.2) 12.76 17.57 18.35 0.91 rHDPE70W30 6.68 6.82 2.17 (0.4) 4.61 5.52 6.76 0.91 rHDPE60W40 6.67 6.94 4.38 (0.6) 9.31 15.95 13.42 0.85 vHDPE50W50 7.17 7.57 5.8 (0.3) 21.62 28.89 28.56 0.89 rHDPE50W50 6.88 7.34 6.56 (0.45) 5.98 6.94 8.15 0.91 rHDPE47W50CA3 6.80 7.13 2.8 (0.2) 1.05 1.74 1.47 0.83 rHDPE45W50CA5 6.84 7.12 3.6 (0.9) 2.37 2.33 3.34 0.88 rHDPE57W40CA3 6.60 6.81 3.39 (1.0) 4.76 5.42 6.98 0.93 Wood flour-PP composites vPP50W50 6.84 7.55 10.61(0.2*) 6.49 5.48 8.60 0.96 rPP50W50 6.96 7.61 9.31 (1.0) 4.77 2.04 6.26 0.99 rPP47W50CA3 7.19 7.50 4.1 (0.9) 2.76 2.87 3.67 0.89 rPP60W40 6.29 6.75 7.32 (0.96) 3.02 2.06 4.47 0.96 rPP45W50CA5 6.55 6.84 4.30 (0.85) 2.39 2.07 3.49 0.92 Note: *Values given in the parentheses are average standard deviation of five replicate samples. 5.5 Conclusions The hot pressed wood flour filled-recycled and virgin thermoplastic (HDPE and PP) composites were investigated for the long-term water absorption and thickness swelling under water immersion. The water absorption and thickness swelling increased with
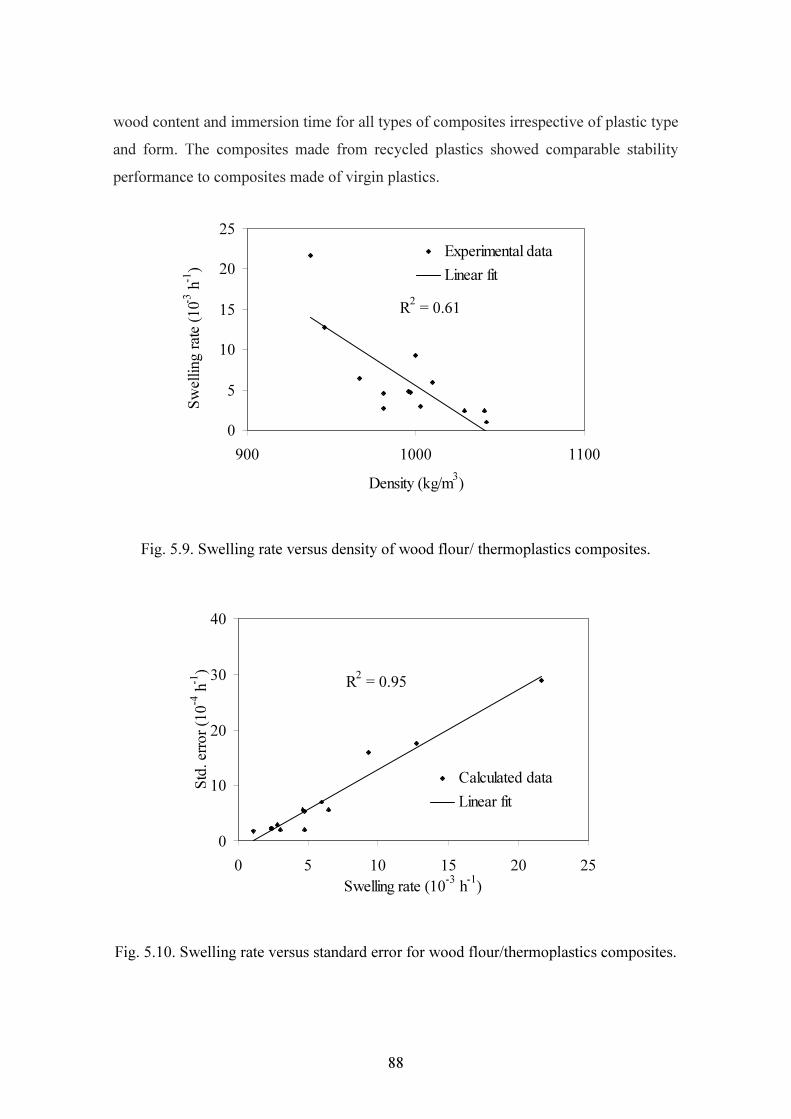
88
wood content and immersion time for all types of composites irrespective of plastic type and form. The composites made from recycled plastics showed comparable stability performance to composites made of virgin plastics.
R2 = 0.61
0
5
10
15
20
25
900 1000 1100Density (kg/m3)
Swell
ing ra
te (10
-3 h-1
)
Experimental dataLinear fit
Fig. 5.9. Swelling rate versus density of wood flour/ thermoplastics composites.
R2 = 0.95
0
10
20
30
40
0 5 10 15 20 25Swelling rate (10-3 h-1)
Std. e
rror (1
0-4 h-1
)
Calculated dataLinear fit
Fig. 5.10. Swelling rate versus standard error for wood flour/thermoplastics composites.

89
R2 = 0.91
0
3
6
9
12
0 5 10 15 20 25 30Equilibrium MC (%)
Equil
ibrium
TS (%
)
Experimental dataLinear fitting line
Fig. 5.11. Equilibrium moisture content versus equilibrium thickness swelling for the
wood flour/thermoplastics composites. However, the water uptake and thickness swelling can be reduced significantly with the incorporation of coupling agent (MAPP) in the composite formulation. From the experimental results, thickness swelling has liner relationship with the water absorption. Water transport mechanism within the wood flour-thermoplastic composites was proved to follow the kinetics of Fickian diffusion. The kinetics parameters are influenced by the wood flour content, plastic type and form, and coupling agent. The diffusivity, composite thermodynamic solubility and permeability increased with wood flour loading but were reduced with the addition of MAPP. A thickness swelling model was successfully employed to determine the swelling rate parameter. The more accurate prediction from the swelling model can be obtained for the composites with lower thickness swelling rate.
The results and findings of this work provide evidence that the recycled plastics (HDPE and PP) can be successfully used to produce stable WPCs suitable for exterior applications in terms of water absorption. The improved performance of the recycled
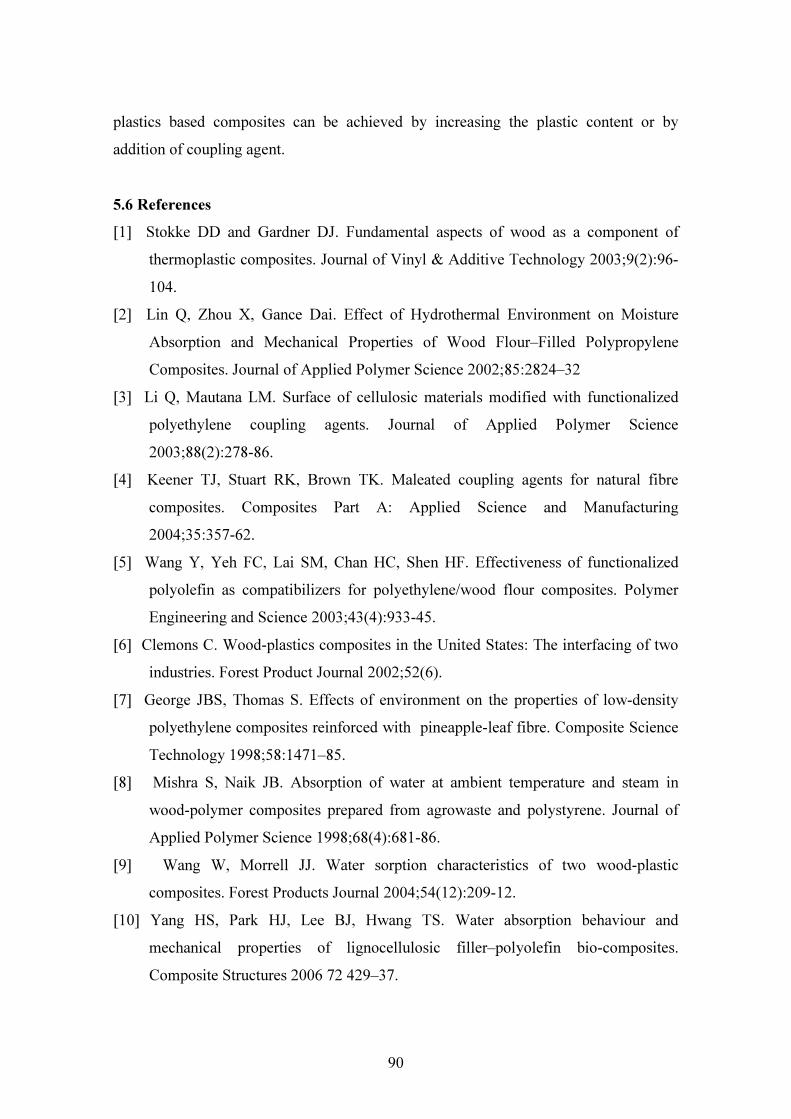
90
plastics based composites can be achieved by increasing the plastic content or by addition of coupling agent. 5.6 References [1] Stokke DD and Gardner DJ. Fundamental aspects of wood as a component of
thermoplastic composites. Journal of Vinyl & Additive Technology 2003;9(2):96-104.
[2] Lin Q, Zhou X, Gance Dai. Effect of Hydrothermal Environment on Moisture Absorption and Mechanical Properties of Wood Flour–Filled Polypropylene Composites. Journal of Applied Polymer Science 2002;85:2824–32
[3] Li Q, Mautana LM. Surface of cellulosic materials modified with functionalized polyethylene coupling agents. Journal of Applied Polymer Science 2003;88(2):278-86.
[4] Keener TJ, Stuart RK, Brown TK. Maleated coupling agents for natural fibre composites. Composites Part A: Applied Science and Manufacturing 2004;35:357-62.
[5] Wang Y, Yeh FC, Lai SM, Chan HC, Shen HF. Effectiveness of functionalized polyolefin as compatibilizers for polyethylene/wood flour composites. Polymer Engineering and Science 2003;43(4):933-45.
[6] Clemons C. Wood-plastics composites in the United States: The interfacing of two industries. Forest Product Journal 2002;52(6).
[7] George JBS, Thomas S. Effects of environment on the properties of low-density polyethylene composites reinforced with pineapple-leaf fibre. Composite Science Technology 1998;58:1471–85.
[8] Mishra S, Naik JB. Absorption of water at ambient temperature and steam in wood-polymer composites prepared from agrowaste and polystyrene. Journal of Applied Polymer Science 1998;68(4):681-86.
[9] Wang W, Morrell JJ. Water sorption characteristics of two wood-plastic composites. Forest Products Journal 2004;54(12):209-12.
[10] Yang HS, Park HJ, Lee BJ, Hwang TS. Water absorption behaviour and mechanical properties of lignocellulosic filler–polyolefin bio-composites. Composite Structures 2006 72 429–37.

91
[11] Marcovich NE, Reboredo MM, Aranguren MI. Moisture diffusion in polyester-wood flour composites. Polymer 1999;40(26):7313-20.
[12] Espert AV, Francisco; Karlsson, Sigbritt. Comparison of water absorption in natural cellulosic fibres from wood and one-year crops in polypropylene composites and its influence on their mechanical properties. Composites Part A: Applied Science and Manufacturing 2004;35(11):1267-76.
[13] Gupta KM, Pawar SJ. A nonlinear diffusion model incorporating edge and surface texture effects to predict absorption behaviour of composites. Materials Science and Engineering A 2005;412(1-2):78-82.
[14] Wang W, Sain M, Cooper PA. Study of moisture absorption in natural fibre plastic composites. Composites Science and Technology 2006;66(3-4):379-86.
[15] Bond DA, Smith PA. Modelling the transport of low-molecular-weight penetrants within polymer matrix composites. Applied Mechanics Reviews 2006;59:249-67.
[16] Comyn J, editor. Polymer permeability: Elsevier Applied Science, England., 1985. [17] Chiou JS and Paul DR. Journal of Polymer Engineering Science 1986;26:1218. [18] Shen CH and Springer GS. Moisture absorption and desorption of composites
materials Journal of Composite Materials 1976;10(1):pp. 2-20. [19] Shi SQ, Gardner DJ. Effect of density and polymer content on the hygroscopic
thickness swelling rate of compression moulded wood fibre/polymer composites. Wood and Fibre Science 2006;38(3):520-26.
20] ASTM D570-98: 2002 Annual book of ASTM Standards, West Conshohocken, PA: 2002.
[21] Matuana LM, Balatinecz JJ, Sodhi R S, Park CB. Surface characterization of esterified cellulosic fibres by XPS and FTIR spectroscopy. Wood Science and Technology 2001;35(3):191-201.
[22] Ichazo MN, Albano C, Gonzale J, Perera R, Candal MV. Polypropylene/wood flour composites: treatments and properties. Composite Structures 2001;54:207-14.
[23] Tajvidi M, Najafi SK, Moteei M. Long-term water uptake behaviour of natural fibre/polypropylene composites. Journal of Applied Polymer Science 2006;99:2199-203.

92
CHAPTER 6 EFFECTS OF ACCELERATED FREEZE-THAW CYCLING ON
PHYSICAL AND MECHANICAL PROPERTIES OF WOOD FLOUR-RECYCLED PLASTIC COMPOSITES
Abstract This part of study investigated durability performance of wood-plastic composites (WPCs) which were exposed to accelerated cycling of water immersion followed with repeated freeze – thaw (FT). WPCs used were made of high-density polyethylene (HDPE) or polypropylene (PP) with radiata pine (Pinus radiata) wood flour using hot-press moulding. These two types of plastics included both recycled and virgin forms in the formulation. In the experiments, surface colour, flexural properties and dimensional stability properties (water absorption and thickness swelling) of WPCs were measured after 12 accelerated FT cycles. Interface microstructures and thermal properties of WPCs were also investigated. The results showed that 24 h water absorption and thickness swelling of the WPC increased with 12 FT cycles. In the meantime, the flexural strength and stiffness decreased with the FT cycling. Scanning electron microscopy (SEM) images of the fractured surfaces confirmed a loss of interfacial bonding between the wood flour and the polymer matrix. Results from the differential scanning calorimetry (DSC) showed the decrease in crystallization enthalpy and crystallinity of the composites as compared to the neat PP and HDPE. The crystallinity (Xc) of the FT cycled WPCs made of both virgin and recycled PP and HDPE was increased expect rHDPE50W50 formulation. However, the WPC with MAPP coupling showed decrease in Xc for both recycled PP and HDPE polymer matrices. In general, overall performance of WPC was degraded significantly, after 12 accelerated FT cycling. 6.1 Introduction WPC is emerging as an important eco-material, and recent advances in processing technologies improved WPC properties and thus increased their share in both of

93
residential and industrial markets [1]. However, there is still limitation for outdoor applications due to uncertain durability performance of WPC. At present, their use is mostly confined to non-structural and interior applications. In the outdoor applications, exposure to environmental conditions such as humidity, temperature and sunlight may alter the chemical and physical properties of WPCs. Previous studies had shown that changes in ambient humidity and temperatures had an adverse effect on physical and mechanical properties of WPCs [2-5]. Marcovich et al. [2] found that compressive and flexural properties were severely affected by high humidity for moulded composites made of wood-flour and unsaturated polyester. Lin et al. [3] reported that water absorption and mechanical properties (tensile and flexural strengths) increased with increasing temperature in water immersion tests for extruded wood flour-polypropylene (PP) composites. Sombatsompop et al. [4] found that the tensile and flexural strength and elastic modulus of the wood-polyvinyl chloride (PVC) composites decreased and elongation at break increased at low moisture content of 1-2%, however, high moisture content decreased the mechanical properties and increased the elongation at break. Separate studies also showed that tensile properties of WPC made of PP and cellulose fibres (such as kraft pulp, sisal, coir) was decreased after water immersion as compared to corresponding dry WPC [5]. In previous studies, durability of WPCs made from thermoplastics with organic fillers (such as wood, natural fibres and rice hull) exposed to biological organisms [6, 7] and ultraviolet radiation [8-12] has been thoroughly investigated. However, there is an apparent lack in literature about durability and stability performance under accelerated freeze-thaw (FT) weathering conditions for polymer based composites filled with wood [13, 14] and other cellulose fibres [15, 16]. Pilarski et al. [13] reported that flexural strength and elastic modulus of extruded WPC made of virgin HDPE and pine wood flour with the addition of a lubricant (in the ratio of 44:50:6) were reduced by 5% and 37%, respectively, after these composites had been exposed to 15 accelerated cycles of water immersion, freezing and thawing. In a separate study by Pilarski et al. [14], extruded pine wood-flour reinforced PVC composites showed a significant loss in stiffness after 5 accelerated FT cycles. Panthapulakkal et al. [15] found that the dimensional stability and flexural properties of extruded rice-husk filled virgin HDPE composites were significantly decreased after 12 cycles of water immersion, freezing and thawing. In addition to material formulation,

94
the processing method can also affect the moisture absorption of WPCs. For example, the extruded WPC tend to absorb more moisture than the composites using compression or injection moulding under the same conditions [17]. When WPC is used in cold regions, where these experiences periodic wetting, freezing and drying during their service life, understanding and quantifying of the performance of WPC is very helpful with respect to composite formulation, processing methods and environmental conditions. The results reported in preceding chapters (Chapters 3-5) of this study demonstrated that the mechanical properties of the WPCs made from recycled HDPE and wood flour were comparable to that based on virgin HDPE. However, FT durability performance of WPCs made from wood flour and recycled plastics are presently not known. In this Chapter, FT durability of wood flour-plastic composite made from virgin and recycled HDPE and/ or PP were evaluated. Detailed studies were carried out to evaluate the influence of plastic type (HDPE, PP), form (recycled, virgin), wood flour content and coupling agent on the properties and aesthetic changes under the accelerated FT cycling. 6.2 Experimental The experimental variables studied were plastic type (HDPE, PP), plastic form (virgin, recycled), wood flour and coupling agent contents. Based on plastic form, the WPCs were divided into two series (HDPE and PP) to give a range of different formulations as described in Table 6.1. Water absorption, thickness swelling, mechanical properties, microstructures of fractured surfaces, surface colour analysis and thermal properties tests were conducted following the methods given in Chapter 2 for respective tests. In the accelerated tests, WPC samples were exposed to freeze-thaw (FT) weathering cycles in accordance with the ASTM standard for polyolefin-based plastic lumber decking boards (ASTM D6662–01) [18] with incorporating water immersion cycle. One complete FT cycle consisted of 3 separate stages: (iv) Firstly, WPC samples were immersed in water for one week at a temperature of
21°C with an accuracy of ±3°C. During the water immersion, each sample was weighed every 24 h until the weight gain was less than 1.0% in the 24 h period.

95
(v) After the water immersion, the WPC samples were frozen for 24 h at the controlled temperature of -27°C with an accuracy of ±3°C.
(vi) Finally, the WPC samples were thawed for 24 h in a controlled environment (21±3°C and 50± 5% RH) in a controlled humidity chamber.
During freezing and thawing cycling, the WPC samples were weighed and later used for determining the changes in the moisture content. In this study, 12 full FT cycles was performed to simulate variable extreme weather conditions. The changes in WPCs surface colour was monitored after 7 and 12 FT cycles. Dimensional stability properties (water absorption and thickness swelling), flexural properties, microstructures of fractured surfaces, and thermal properties of both control and FT weathered samples were measured after 12 full FT cycles. These properties were tested according to ASTM standards explained in Chapter 2. Theoretical heat of fusion used for calculation of ∆Hf100 for a 100% crystalline polymer were cited from [19] (∆Hf100=205 J/g for PP and ∆Hf100=293 J/g for HDPE) and w is the mass fraction of thermoplastic in the composite samples. Table 6.1 WPCs formulation selected for accelerated FT weathering test (percent by
weight). Composite sample code
Plastic type
Plastic content (%)
Wood flour (%)
Coupling agent (%)
Wood flour-HDPE composites rHDPE100 Recycled 100 0 0 vHDPE100 Virgin 100 0 0 vHDPE60W40 Virgin 60 40 0 vHDPE50W50 Virgin 50 50 0 rHDE50W50 Recycled 50 50 0 rHDPE47W50CA3 Recycled 47 50 3 Wood flour-PP composites rPP100 Recycled 100 0 0 vPP50W50 Virgin 50 50 0 rPP50W50 Recycled 50 50 0 rPP45W50CA5 Recycled 45 50 5

96
6.3 Results and discussion 6.3.1 Colour analysis The colour changes of the WPCs after 7 and 12 FT cycles are given in Table 6.2 and expressed as changes in chromaticity coordinates (∆a*, ∆b*), lightness (∆L*) and in overall colour change (∆E). It was observed that the overall colour change of the composite varied with composite formulation, and the values after 12 FT cycles were higher than those after 7 FT cycles. The value of ∆E for the PP based composites was greater when compared with that of the HDPE based composites. For example, ∆E values of PP based composites ranged from 7.5 to 10.5 after 12 FT cycles, while the corresponding values for HDPE based composites were 0.9 to 5.2. Incorporation of MAPP coupling agent significantly reduced the colour change. It was found that most of the composites tended to increase the lightness (∆L*) with the FT cycles, indicating that the composite surfaces for these composites became brighter with the weathering. However, two vHDPE based composites showed darkening with FT weathering as the surface lightness was decreased. This variation in lightening may be due to the differences in the initial colour of the composite samples. As vHDPE based composite was dominated by the wood colour while rHDPE based composite was dark black in colour. Following a similar trend to the overall colour change, the MAPP-containing composites showed less lightening for both of the PP and the HDPE based composites. For example, addition of 3 wt. % MAPP in the rHDPE based composite with 50 wt. % wood flour, the surface lightening after 12 FT cycles was reduced from 5.2 to 0.9. Similarly, with addition of 5 wt. % MAPP in the rPP based composite with 50 wt. % wood flour, the lightness after 12 FT cycles was reduced from 10.5 to 7.5. The results of the lightness also showed that PP based composites faded faster than HDPE based composites. In addition, composites with higher wood flour content faded somewhat more than did the composites with lower wood flour content. With higher wood content, greater proportion of wood flour was exposed at the sample surface where complete encapsulation by the matrix was less likely. It is believed that the increased lightness of composite was mainly due to bleaching of the wood component while darkening may be attributed to an increase in surface oxidation [20]. From the test results, it was observed that the changes in the chromaticity coordinates (a* and b*) were insignificant through FT cycle tests.
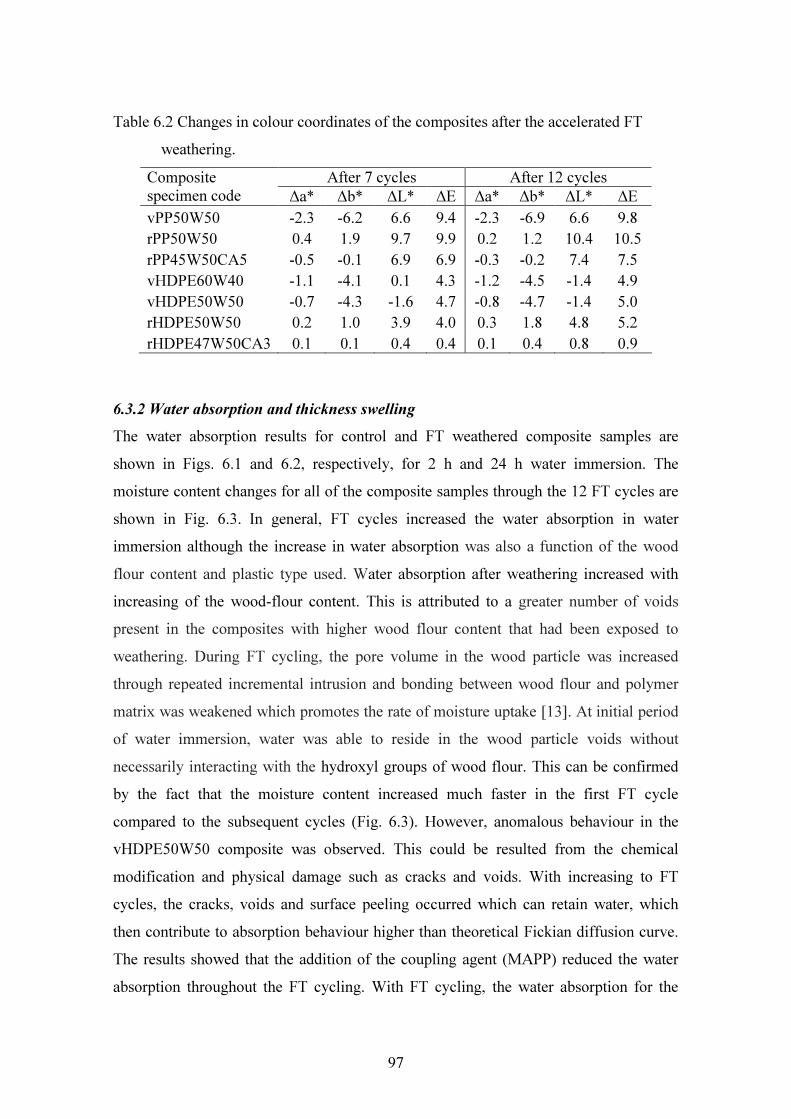
97
Table 6.2 Changes in colour coordinates of the composites after the accelerated FT weathering.
After 7 cycles After 12 cycles Composite specimen code ∆a* ∆b* ∆L* ∆E ∆a* ∆b* ∆L* ∆E vPP50W50 -2.3 -6.2 6.6 9.4 -2.3 -6.9 6.6 9.8 rPP50W50 0.4 1.9 9.7 9.9 0.2 1.2 10.4 10.5 rPP45W50CA5 -0.5 -0.1 6.9 6.9 -0.3 -0.2 7.4 7.5 vHDPE60W40 -1.1 -4.1 0.1 4.3 -1.2 -4.5 -1.4 4.9 vHDPE50W50 -0.7 -4.3 -1.6 4.7 -0.8 -4.7 -1.4 5.0 rHDPE50W50 0.2 1.0 3.9 4.0 0.3 1.8 4.8 5.2 rHDPE47W50CA3 0.1 0.1 0.4 0.4 0.1 0.4 0.8 0.9
6.3.2 Water absorption and thickness swelling The water absorption results for control and FT weathered composite samples are shown in Figs. 6.1 and 6.2, respectively, for 2 h and 24 h water immersion. The moisture content changes for all of the composite samples through the 12 FT cycles are shown in Fig. 6.3. In general, FT cycles increased the water absorption in water immersion although the increase in water absorption was also a function of the wood flour content and plastic type used. Water absorption after weathering increased with increasing of the wood-flour content. This is attributed to a greater number of voids present in the composites with higher wood flour content that had been exposed to weathering. During FT cycling, the pore volume in the wood particle was increased through repeated incremental intrusion and bonding between wood flour and polymer matrix was weakened which promotes the rate of moisture uptake [13]. At initial period of water immersion, water was able to reside in the wood particle voids without necessarily interacting with the hydroxyl groups of wood flour. This can be confirmed by the fact that the moisture content increased much faster in the first FT cycle compared to the subsequent cycles (Fig. 6.3). However, anomalous behaviour in the vHDPE50W50 composite was observed. This could be resulted from the chemical modification and physical damage such as cracks and voids. With increasing to FT cycles, the cracks, voids and surface peeling occurred which can retain water, which then contribute to absorption behaviour higher than theoretical Fickian diffusion curve. The results showed that the addition of the coupling agent (MAPP) reduced the water absorption throughout the FT cycling. With FT cycling, the water absorption for the
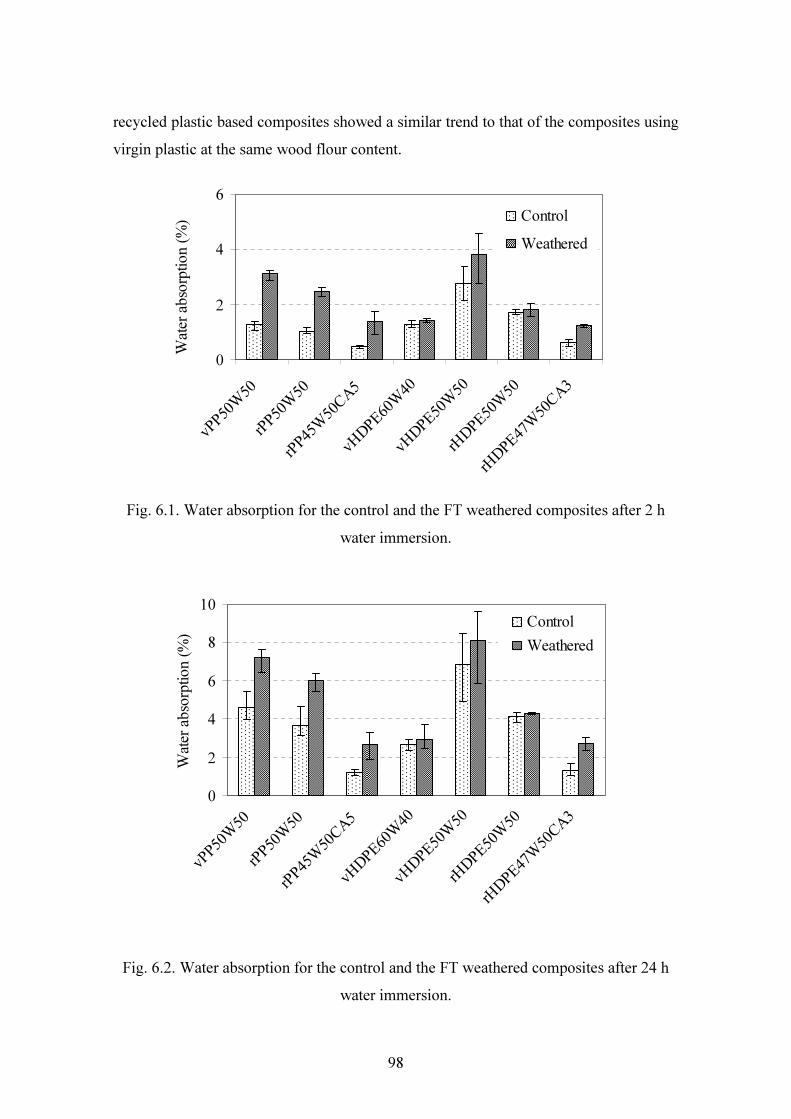
98
recycled plastic based composites showed a similar trend to that of the composites using virgin plastic at the same wood flour content.
0
2
4
6
v PP 50 W
5 0
r P P5 0 W
5 0
r P P4 5 W
5 0 CA 5
v HD PE 60 W
4 0
v HD PE 50 W
5 0
r HD PE 50 W
5 0
r HD PE 47 W
5 0 CA 3
Water
absor
ption
(%) Control
Weathered
Fig. 6.1. Water absorption for the control and the FT weathered composites after 2 h
water immersion.
0
2
4
6
8
10
v PP 50 W
5 0
r P P5 0 W
5 0
r P P4 5 W
5 0 CA 5
v HD PE 60 W
4 0
v HD PE 50 W
5 0
r HD PE 50 W
5 0
r HD PE 47 W
5 0 CA 3
Wate
r abso
rption
(%) Control
Weathered
Fig. 6.2. Water absorption for the control and the FT weathered composites after 24 h water immersion.
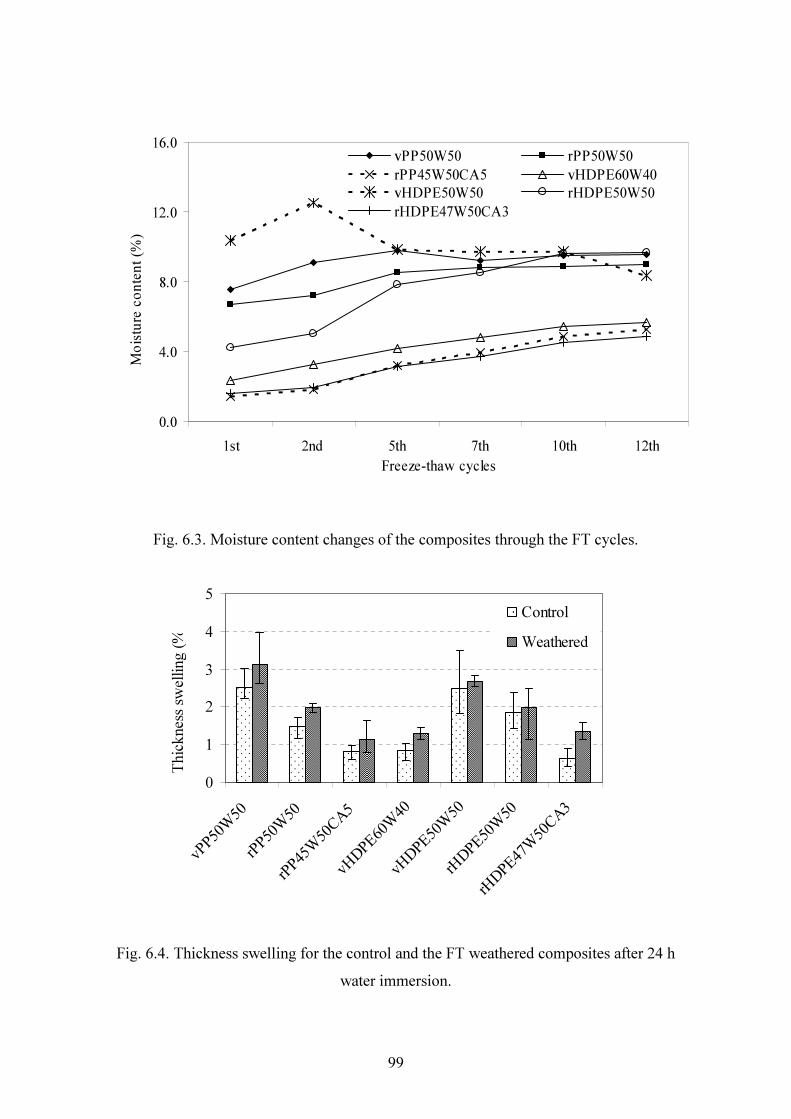
99
0.0
4.0
8.0
12.0
16.0
1st 2nd 5th 7th 10th 12thFreeze-thaw cycles
vPP50W50 rPP50W50rPP45W50CA5 vHDPE60W40vHDPE50W50 rHDPE50W50rHDPE47W50CA3
Moistu
re co
ntent
(%)
Fig. 6.3. Moisture content changes of the composites through the FT cycles.
0
1
2
3
4
5
v PP 50 W
5 0
r P P5 0 W
5 0
r P P4 5 W
5 0 CA 5
v HD PE 60 W
4 0
v HD PE 50 W
5 0
r HD PE 50 W
5 0
r HD PE 47 W
5 0 CA 3
Thick
ness
swell
ing (%
) Control
Weathered
Fig. 6.4. Thickness swelling for the control and the FT weathered composites after 24 h water immersion.
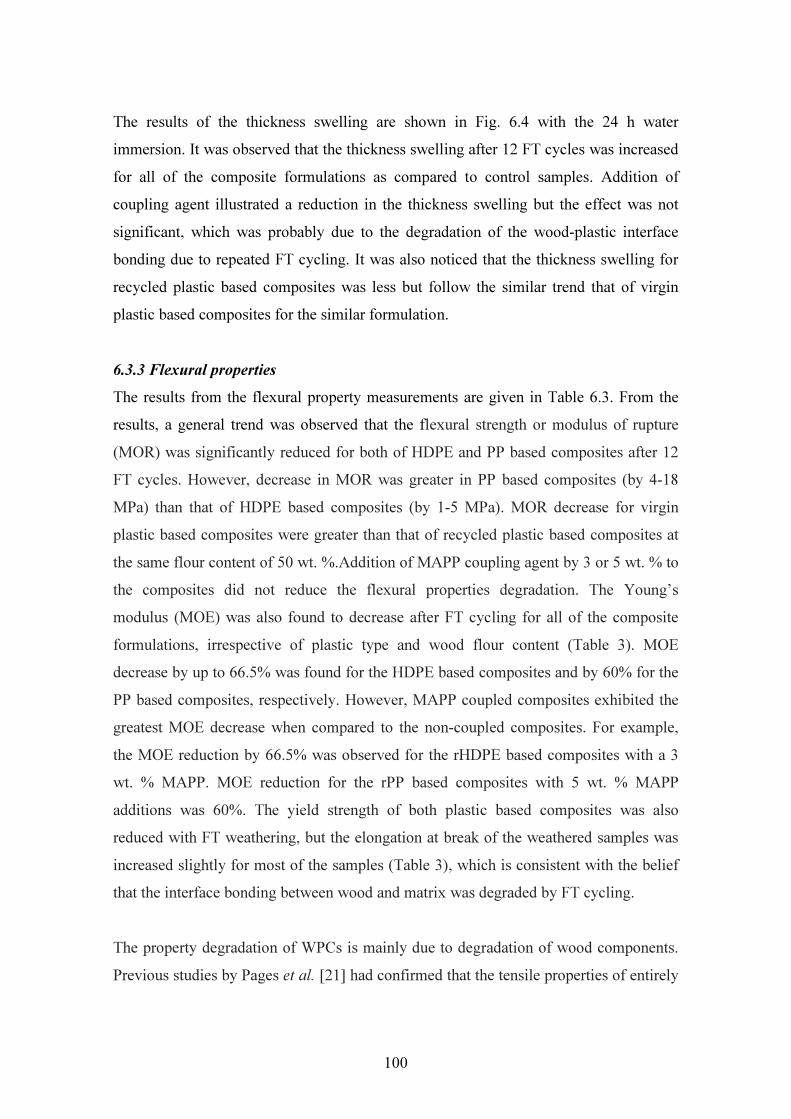
100
The results of the thickness swelling are shown in Fig. 6.4 with the 24 h water immersion. It was observed that the thickness swelling after 12 FT cycles was increased for all of the composite formulations as compared to control samples. Addition of coupling agent illustrated a reduction in the thickness swelling but the effect was not significant, which was probably due to the degradation of the wood-plastic interface bonding due to repeated FT cycling. It was also noticed that the thickness swelling for recycled plastic based composites was less but follow the similar trend that of virgin plastic based composites for the similar formulation. 6.3.3 Flexural properties The results from the flexural property measurements are given in Table 6.3. From the results, a general trend was observed that the flexural strength or modulus of rupture (MOR) was significantly reduced for both of HDPE and PP based composites after 12 FT cycles. However, decrease in MOR was greater in PP based composites (by 4-18 MPa) than that of HDPE based composites (by 1-5 MPa). MOR decrease for virgin plastic based composites were greater than that of recycled plastic based composites at the same flour content of 50 wt. %.Addition of MAPP coupling agent by 3 or 5 wt. % to the composites did not reduce the flexural properties degradation. The Young’s modulus (MOE) was also found to decrease after FT cycling for all of the composite formulations, irrespective of plastic type and wood flour content (Table 3). MOE decrease by up to 66.5% was found for the HDPE based composites and by 60% for the PP based composites, respectively. However, MAPP coupled composites exhibited the greatest MOE decrease when compared to the non-coupled composites. For example, the MOE reduction by 66.5% was observed for the rHDPE based composites with a 3 wt. % MAPP. MOE reduction for the rPP based composites with 5 wt. % MAPP additions was 60%. The yield strength of both plastic based composites was also reduced with FT weathering, but the elongation at break of the weathered samples was increased slightly for most of the samples (Table 3), which is consistent with the belief that the interface bonding between wood and matrix was degraded by FT cycling. The property degradation of WPCs is mainly due to degradation of wood components. Previous studies by Pages et al. [21] had confirmed that the tensile properties of entirely

101
HDPE panel remained almost constant after 90 days of weathering in Canadian winter (freeze-thaw condition). In separate studies by Stokke and Gardner [22] and George et al. [23], it was found that incorporation of the wood fibres in the composites increased moisture uptake and led to weakening interface bonding due to the presence of hydroxyl groups contained in wood. Therefore, the increased moisture uptake decreased the flexural properties of the composites during repeated FT cycling. In the presence of moisture, hydrogen bonds between wood and polymer were disturbed and the hydrogen bonds instead reformed with the water molecules, decreasing the flexural properties. In addition, degradation of the interface adhesion and increase in the pore size and pore numbers in composites could also contribute to the reduction of flexural properties [14]. Table 6.3. Flexural properties of the control and FT weathered composites.
Control sample FT weathered sample Composite specimen code MOR
(MPa) MOE (GPa)
Yield strength (MPa)
Elongation at break (%)
MOR (MPa)
MOE (GPa)
Yield strength (MPa)
Elongation at break (%)
vPP50W50 14.7 (0.7*)
1.68 (0.01)
7.91 (0.23)
1.55 (0.13)
10.08 (0.5)
1.36 (0.07)
3.19 (0.23)
2.86 (0.34)
rPP50W50 17.4 (0.4)
1.72 (0.02)
9.17 (0.4)
1.86 (0.18)
13.3 (0.38)
1.05 (0.05)
5.55 (0.5)
2.67 (0.04)
rPP45W50CA5 39.61 (1.3)
2.43 (0.03)
21.4 (1.2)
2.53 (0.3)
32.3 (2.7)
0.95 (0.02)
15.85 (1.23)
2.51 (0.23)
vHDPE60W40 17.9 (0.9)
1.06 (0.05)
8.5 (0.4)
3.86 (0.26)
17.1 (1.0)
1.06 (0.02)
7.33 (0.7)
4.9 (0.40)
vHDPE50W50 14.4 (1.5)
1.34 (0.03)
6.2 (0.2)
2.58 (0.3)
10.1 (2.5)
1.12 (0.17)
4.02 (0.3)
3.56 (0.5)
rHDPE50W50 15.6 (1.5)
1.41 (0.04)
6.8 (0.8)
2.22 (0.4)
14.2 (0.9)
0.81 (0.04)
6.4 (0.4)
2.80 (0.4)
rHDPE47W50CA3 25.5 (1.0)
1.88 (0.03)
11.8 (0.5)
2.32 (0.2)
23.2 (1.02)
0.63 (0.02)
11.12 (0.22)
2.19 (0.22)
Note: *values in the parentheses are standard deviation. The values given are the average of five replicate samples. The results from this study had shown that for recycled plastic matrix composites, the reduction in MOE was more significant than the reductions in strength with FT cycling. This indicates that the water absorbed by the composites has stronger impacts on MOE than on strength in recycled plastic based composites. However, for the virgin plastic based composites, loss in strengths was larger than the reduction of the MOE. The exact

102
cause for the difference between the virgin plastic and the recycled plastic are not fully understood but the impurity present and the processing of recycled plastic play an important role. The examination of the microstructures in the subsequent section will reveal some differences between these two forms of plastics. The reduction in yield strength and MOE were less for the composites with the MAPP addition after FT cycling and this trend was true for both PP and HDPE based composites. Because of the modified interface bonding in the presence of the MAPP, penetration of water into the composites through the interface was restricted, which could be the reason for improved flexural properties with FT cycling. 6.3.4 Microstructure characterization SEM images of fractured surfaces of the rHDPE based composites with 50 wt. % plastic and 50 wt. % wood flour are shown in Fig. 6.5. The fibre breakage and fibres being pulled out in the control and FT weathered composites are marked by the circle in the corresponding SEM images. It can be seen that the control sample (Fig. 6.5a) had server breakage of polymer matrix and some fibres were torn off leaving gaps and flaws over the fracture surface, indicating strong interface bonding. However, FT weathered sample in Fig. 6.5(b) shows larger number of holes and cavities with some fibres being pulled out of the matrix. Due to the weakening of interface bond during FT cycles, wood fibres were pulled out from the matrix and this led to cavities in the other side of the breakage surface. SEM images of fracture surfaces of PP based composites are shown in Figs. 6.6 to 6.8. Figs. 6.6(a) and (b) are for the control and FT weathered samples of vPP based composite with 50 wt. % wood flour. From the fractured surface of the control sample (Fig. 6.6a), breakage of a considerable amount of fibres and matrix can be seen with very limited intact material on the surface. This indicates the good adhesion between the wood fibres and the PP matrix during the breakage. On the other hand, the fractured surface of FT weathered sample (Fig. 6.6b) showed less fibre breakage with more fibres being pulled out from the matrix, illustrating weakened interface bonding between the matrix and the fibres. Similar phenomenon was also observed for the composites made from recycled PP as shown in Figs. 6.7(a) and 6.7(b). However, the bonding between

103
recycled PP matrix and wood fibres was slightly better as compared to vPP based composites. This observation has confirmed the differences in MOR and yield strength between vPP based and rPP based composites as shown in Table 6.3.
Fig. 6.5. SEM images (×100) of rHDPE based composites with 50 wt. % wood flour content, (a) control sample, (b) FT weathered sample.
Fig. 6.6. SEM images (×100) of vHDPE based composites with 50 wt. % wood flour content, (a) control sample, (b) FT weathered sample. With addition of the coupling agent (MAPP), the fractured surfaces showed stronger interface bonding between the wood fibre and polymer matrix as illustrated in Figs.
a b
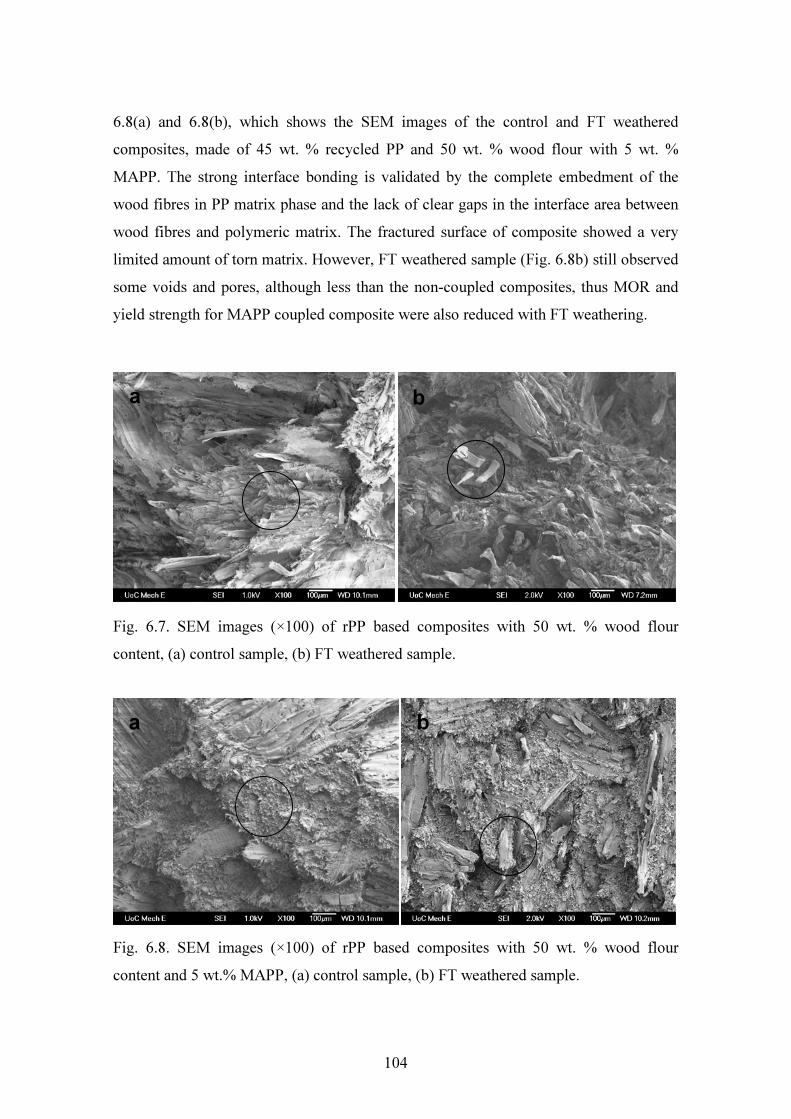
104
6.8(a) and 6.8(b), which shows the SEM images of the control and FT weathered composites, made of 45 wt. % recycled PP and 50 wt. % wood flour with 5 wt. % MAPP. The strong interface bonding is validated by the complete embedment of the wood fibres in PP matrix phase and the lack of clear gaps in the interface area between wood fibres and polymeric matrix. The fractured surface of composite showed a very limited amount of torn matrix. However, FT weathered sample (Fig. 6.8b) still observed some voids and pores, although less than the non-coupled composites, thus MOR and yield strength for MAPP coupled composite were also reduced with FT weathering.
Fig. 6.7. SEM images (×100) of rPP based composites with 50 wt. % wood flour content, (a) control sample, (b) FT weathered sample.
Fig. 6.8. SEM images (×100) of rPP based composites with 50 wt. % wood flour content and 5 wt.% MAPP, (a) control sample, (b) FT weathered sample.
a b
a b
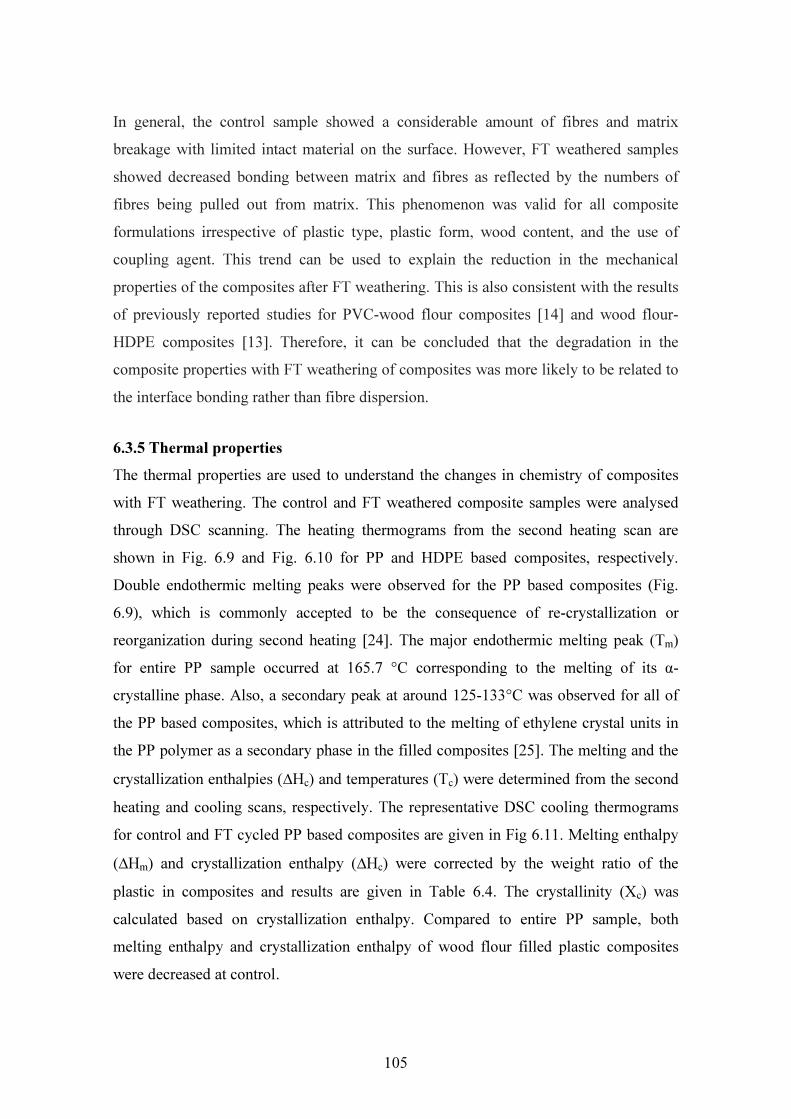
105
In general, the control sample showed a considerable amount of fibres and matrix breakage with limited intact material on the surface. However, FT weathered samples showed decreased bonding between matrix and fibres as reflected by the numbers of fibres being pulled out from matrix. This phenomenon was valid for all composite formulations irrespective of plastic type, plastic form, wood content, and the use of coupling agent. This trend can be used to explain the reduction in the mechanical properties of the composites after FT weathering. This is also consistent with the results of previously reported studies for PVC-wood flour composites [14] and wood flour-HDPE composites [13]. Therefore, it can be concluded that the degradation in the composite properties with FT weathering of composites was more likely to be related to the interface bonding rather than fibre dispersion.
6.3.5 Thermal properties The thermal properties are used to understand the changes in chemistry of composites with FT weathering. The control and FT weathered composite samples were analysed through DSC scanning. The heating thermograms from the second heating scan are shown in Fig. 6.9 and Fig. 6.10 for PP and HDPE based composites, respectively. Double endothermic melting peaks were observed for the PP based composites (Fig. 6.9), which is commonly accepted to be the consequence of re-crystallization or reorganization during second heating [24]. The major endothermic melting peak (Tm) for entire PP sample occurred at 165.7 °C corresponding to the melting of its α-crystalline phase. Also, a secondary peak at around 125-133°C was observed for all of the PP based composites, which is attributed to the melting of ethylene crystal units in the PP polymer as a secondary phase in the filled composites [25]. The melting and the crystallization enthalpies (∆Hc) and temperatures (Tc) were determined from the second heating and cooling scans, respectively. The representative DSC cooling thermograms for control and FT cycled PP based composites are given in Fig 6.11. Melting enthalpy (∆Hm) and crystallization enthalpy (∆Hc) were corrected by the weight ratio of the plastic in composites and results are given in Table 6.4. The crystallinity (Xc) was calculated based on crystallization enthalpy. Compared to entire PP sample, both melting enthalpy and crystallization enthalpy of wood flour filled plastic composites were decreased at control.

106
-0.35
-0.3
-0.25
-0.2
-0.15
-0.1
-0.05
0
50 80 110 140 170 200Temperature (oC)
Heat f
low (W
/g)
rPP100vPP50W50rPP50W50FT-vPP50W50FT-rPP50W50
Fig. 6.9. DSC second heating curves for control and FT cycled wood flour-PP
composites.
-1.1
-0.9
-0.7
-0.5
-0.3
-0.1
0.1
50 80 110 140 170 200Temperature (oC)
Heat f
low (W
/g)
rHDPE100vHDPE50W50rHDPE50W50rHDPE47W50CA3FT-vHDPE50W50FT-rHDPE50W50FT-rHDPE47W50CA3
Fig. 6.10. DSC second heating curves for control and FT cycled wood flour-HDPE composites.

107
However, FT weathered composite samples showed an increase in crystallization enthalpy compared to corresponding control samples. The presence of MAPP coupling agent by 5 wt. % in composite formulation increased both melting enthalpy and crystallization enthalpy. However, MAPP coupling did not show major influence on the peak melting temperature (Tm).
0
0.1
0.2
0.3
0.4
0.5
50 70 90 110 130 150 170 190Temperature (oC)
Heat
flow
(W/g)
rPP100vPP50W50rPP50W50FT-vPP50W50FT-rPP50W50
Fig. 6.11. DSC cooling curves for control and FT cycled wood flour-PP composites.
Crystallinity (Xc) of MAPP coupled composite was higher than that of the composite without MAPP, which is consistent with the findings by Kim et al. [26]. Also for PP based composites without MAPP coupling agent, the Xc was increased after FT weathering by 28% for virgin PP and by 11% for recycled PP compared to control samples. However, the Xc for MAPP coupled composite was decreased after FT weathering. This decrease in Xc for MAPP coupled composite is presumably due to the degradation of interface bonding by repeated wetting and thawing of composite samples. Interface degradation reduced the contact between the wood filler and polymer and thus could eliminate the nucleating effect of the wood fibres, resulting in a decrease in Xc.

108
Table 6.4 Thermal properties of the control and the FT weathered wood-plastic composites.
Control sample FT-weathered sample Composite code ∆Hm
(J/g) ∆Hc (J/g) Xc % Tm peak
(oC) Tc
peak (oC)
Tconset (oC)
∆Hm (J/g)
∆Hc (J/g) Xc %
Tm peak (oC)
Tc peak (oC)
Tconset (oC)
rPP100 75.6 89.8 43.8 165.7 133.4 138.6 a vPP50W50 85.1 86.4 42.2 164.1 125.1 128.8 98.9 109.6 53.5 164.9 126.1 131.6 rPP50W50 67.3 75.6 36.9 165.5 130.6 134.0 79.4 84.1 41.0 165.1 130.1 133.8 rPP45W50CA5 103.6 107.8 52.6 165.0 130.2 133.4 81.1 82.5 40.2 165.1 130.0 133.4 vHDPE100 198.5 191.5 65.4 131.6 121.2 122.2 a rHDPE100 179.5 172.8 59.0 130.9 121.3 123.2 a vHDPE50W50 167.2 164.5 56.2 131.9 121.3 123.4 212.6 199.2 68.0 131.9 121.7 123.4 rHDPE50W50 178.7 171.1 58.4 130.9 121.3 123.2 146.3 154.1 52.6 130.9 121.0 122.8 rHDPE47W50CA3 204.9 213.2 72.8 130.8 121.1 123.0 184.9 184.0 62.8 130.8 121.2 122.4
a not studied in this studied. Note: In the table, ∆Hm is the melting enthalpy, ∆Hc is the crystallization enthalpy, Xc is the crystallinity, Tm is the peak melting temperature and Tc is the peak crystallization temperature.

109
The peak crystallization temperature (Tc) of entirely rPP was decreased with an addition of wood flour and MAPP in the formulation, indicating the slow crystallization rate of the composites. The change in the Tc however was significant after FT weathering. The crystallization temperature at onset (Tconset) of entirely rPP was decreased with addition of wood flour and MAPP in the PP based control composites. However, Tconset did not change with the addition of wood flour and MAPP in HDPE based control composites. The Tconset decreased slightly in FT weathered composites for both series. The decrease in Tconset indicates the slow crystallization rate of the composites after weathering. For HDPE based composites and entire HDPE sample, a single endothermic melting peak occurred both for control and for FT weathered samples (Fig. 10). A major endothermic melting peak (Tm) for the entire vHDPE and rHDPE samples were found to be 131.6 °C and 130.9 °C, respectively. Tm had not noticeable changes with the FT weathering. When wood flour (50 wt. %) was added, both the melting enthalpy (∆Hm) and the crystallization enthalpy (∆Hc) were decreased significantly for both virgin and rHDPE based control composites. The addition of wood flour in HDPE matrix increased the matrix viscosity at the crystallization temperature, and would reduce the diffusion rate of the polyethylene chain. This resulted in lowering of the crystallization rate. However, MAPP coupled composites showed increase in both of the melting enthalpy and the crystallization enthalpy. It was interesting to note that with FT weathering, both the melting enthalpy and the crystallization enthalpy were increased for the vHDPE matrix and decreased for rHDPE matrix composites. Similarly, adding 3 wt. % MAPP, both melting and crystallization enthalpies were decreased after FT weathering. For HDPE based composites, the peak crystallization temperature (Tc) did not have noticeable changes with FT weathering. However, opposite trends for the changes in the Xc with FT weathering were observed between virgin HDPE based and recycled HDPE based composites. The Xc was increased remarkably (by 21 %) for the vHDPE based composites after FT cycles whereas Xc was decreased for the rHDPE composite with the same wood content (50 wt. %). The Xc loss and gain of the composites without coupling agent can be due to several factors including the interaction of the polymer components and the fibre reinforcement at the interfaces, and the moisture absorption and desorption occurring in the cellulosic fibres during the repeated FT cycles [27].
110
6.4. Conclusions Durability performance of WPCs both based on virgin and recycled HDPE and PP was investigated by exposing to 12 accelerated FT cycles. After FT weathering, the water absorption and thickness swelling of the composites were significantly increased after 24 h water immersion tests compared to corresponding control samples. MAPP coupling effect was vanished after FT cycles, and both water absorption and thickness swelling of FT cycled composites was increased compared to non-coupled composites. In general, the recycled plastic based composites showed lower water absorption and thickness swelling than those of the virgin plastic based composite at the same wood flour content. This tend was observed both for both control and FT weathered samples. FT weathered composites underwent colour changes with significant change in lightness (L*) than in the chromaticity values (a* and b*). The addition of the coupling agent MAPP did not have significant influence to protect the colour change with the FT weathering although it tended to reduce the colour change. With the FT weathering, flexural strength, Young’s modulus and yield strength of the composite samples were decreased, but elongation at break was increased regardless of plastics type and wood flour content. For the composites made from recycled plastics, the decrease in Young’s modulus was greater than strength in terms of the percentage reduction. The MAPP coupled composites showed similar trend that the reduction in the stiffness was greater compared to strength reduction for both the PP and the HDPE based composites. From the examination of the difference between recycled plastic based and virgin plastic based composites, the results showed that both showed similar trend for flexural strength and yield strength degradation at the same wood flour content. This trend was true for both PP and HDPE based composites. SEM micrographs of FT cycles sample showed that the interface bonding between the wood flour and polymer matrix was weakened with intact fibres being pulled out from the polymer matrices rather than fibres breakage. However, the extent of the weakening varied with the plastic type and addition of the coupling agent. Examination of SEM images confirmed the changes in stability and mechanical properties with FT weathering. From DSC analysis, the PP based composites showed a double peaks
111
thermograms, however, the HDPE based composites showed a single melting peak for both the control and the weathered samples. In general, the composites using both virgin and recycled plastics (PP and HDPE) showed an increase in Xc while MAPP coupled composites using recycled plastic showed a decrease in Xc after FT weathering. 6.5 References [1] Smith PM and Wolcott MP. Opportunities for wood/natural fibre-plastic composites
in residential and industrial applications. Forest Products Journal 2006;56(3):4-11. [2] Marcovich NE, Reboredo MM, Aranguren MI. Dependence of the mechanical
properties of wood flour-polymer composites on the moisture content. Journal of Applied Polymer Science 1998;68:2069-76.
[3] Lin Q, Zhou X, Dai G. Effect of hydrothermal environment on moisture absorption and mechanical properties of wood flour-filled polypropylene composites. Journal of Applied Polymer Science 2002;85:2824-32.
[4] Sombatsompop N and Chaochanchaikul K. Effect of moisture content on mechanical properties, thermal and structural stability and extrudate texture of PVC/wood sawdust composites. Polymer International 2004;53:1210-18.
[5] Espert A, Vilaplana F, Karlsson S. Comparison of water absorption in natural cellulosic fibres from wood and one-year crops in polypropylene composites and its influence on their mechanical properties. Composites Part A: Applied Science and Manufacturing 2004;35:1267-76.
[6] Schauwecker C, Morrell JJ, McDonald AG, Fabiyi JS. Degradation of a wood-plastic composite exposed under tropical conditions. Forest Products Journal 2006;56(11/12):123-29.
[7] Verhey SA, Laks PE. Wood particle size affects the decay resistance of wood fibre/thermoplastic composites. Forest Products Journal 2002;52(11/12):78-81.
[8] Matuana LM, Kamdem DP, Zhang J. Photoaging and stabilization of rigid PVC/wood-fibre composites. Journal of Applied Polymer Science 2001;80:1943-50.
[9] Stark NM and Matuana LM. Influence of photostabilizers on wood flour-HDPE composites exposed to xenon-arc radiation with and without water spray. Polymer Degradation and Stability 2006;91:3048-56.
112
[10] Falk RH, Lundin T, and Felton C. The effects of weathering on wood-thermoplastic composites intended for outdoor application. In: Durability and disaster mitigation in wood-frame housing; 2000; Wisconsin, USA: Forest Products Society; 2000: 175-79.
[11] Lundin T, Cramer SM, Falk RH, and Felton C. Accelerated weathering of natural fibre-filled polyethylene composites. Journal of Materials in Civil Engineering 2004;16(6):547-55.
[12] Li R. Environmental degradation of wood-HDPE composite. Polymer Degradation and Stability 2000;70:135-45.
[13] Pilarski JM and Matuana LM. Durability of wood flour-plastic composites exposed to accelerated freeze-thaw cycling. II. High density polyethylene matrix. Journal of Applied Polymer Science 2006;100:35-39.
[14] Pilarski JM and Matuana LM. Durability of wood flour-plastic composites exposed to accelerated freeze-thaw cycling. Part I. Rigid PVC matrix. Journal of Vinyl & Additive Technology 2005;11:1-8.
[15] Panthapulakkal S, Law S, Sain M. Effect of water absorption, freezing and thawing, and photo-ageing on flexural properties of extruded HDPE/rice husk composites. Journal of Applied Polymer Science 2006;100:3619-25.
[16] Wang WH, Wang QW, Xiao H, Morrell JJ. Effects of moisture and freeze-thaw cycling on the quality of rice-hull-PE composites. Pigment & Resin Technology 2007;36(6):344-49.
[17] Clemons CM, Ibach RE. Effects of processing method and moisture history on laboratory fungal resistance of wood-HDPE composites. Forest Products Journal 2004;54(4):50-57.
[18] ASTM D6662-01: Standard for polyolefin-based plastic lumber decking boards: American Society for Testing and Materials, West Conshohocken, PA., 2002.
[19] Ehrenstein GW, Trawiel R. Thermal analysis of plastics: theory and practice: Carl Hanser Verlag, Munich, 2004.
[20] Hon DNS, Clemons CS, Feist WC. Weathering characteristics of hardwood surfaces. Wood Science and Technology 1986;20:169-83.
[21] Pages P, Carrasco F, Saurina J, and Colom X. FTIR and DSC study of HDPE structural changes and mechanical properties variation when exposed to
113
weathering ageing during Canadian winter. Journal of Applied Polymer Science 1996;60:153-59.
[22] Stokke DD, Gardner DJ. Fundamental aspects of wood as a component of thermoplastic composites. Journal of Vinyl & Additive Technology 2003;9(2):96-104.
[23] George J, Sreekala MS, and Thomas S. A review on interface modification and characterization of natural fibre reinforced plastic composites. Polymer Engineering and Science 2001;41(9):1471-85.
[24] Hristov V and Vasileva S. Dynamic mechanical and thermal properties of modified poly (propylene) wood fibre composites. Macromolecular Material and Engineering 2003;288(10):798-806.
[25] Petrovic ZS, Simendic JB, Divjakovic V, and Skrbic Z. Effect of addition of polyethylene on properties of polypropylene/ethylene-propylene rubber blends. Journal of Applied Polymer Science 1996;59(2):301-10.
[26] Kim HS, Lee B-H, Choi SW, Kim S, Kim H-J. The effect of types of anhydride-grafted polypropylene (MAPP) on the interfacial adhesion properties of bio-flour filled polypropylene composites. Composites Part A: applied science and manufacturing 2007;38:1473-82.
[27] Colom X, CaNavate J, Pages P, Saurina J, Carrasco F. Changes in crystallinity of the HDPE matrix in composites with cellulosic fibre using DSC and FTIR. Journal of Reinforced Plastics and Composites 2000;19(10):818-30.

114
CHAPTER 7 ACCELERATED ULTRAVIOLET WEATHERING OF RECYCLED
POLYPROPYLENE-SAWDUST COMPOSITES Abstract Accelerated ultraviolet (UV) durability of hot-press moulded recycled polypropylene (rPP) based wood flour composite was investigated with combined ultraviolet radiation and water spray. Both water absorption and thickness swelling after 24 h water immersion of the UV weathered of the composites were increased. The surface of composites underwent significant colour changes (∆E) and lightening (∆L*) after weathering. Young’s modulus, flexural and yield strength of the composites were decreased after the UV weathering; however, elongation at break was increased. Microstructural observations from SEM images revealed a decrease in interface bonding between the wood flour and the polymer matrix with increased exposure to UV weathering. Crystallanity (Xc) of the weathered neat PP sample was increased by 6%, while the PP composites showed a decrease both for the non-coupled and coupled composites irrespective with virgin or recycled PP with weathering. However, Xc was increased by 2.4% for recycled PP based composite, which is within experimental error. The MAPP coupled (5 wt. %)-composite exhibited 8.3% reduction in Xc after weathering. From the experiments, it was observed that all of the property change with UV weathering followed similar and comparable for both of vPP based and corresponding rPP based composites. 7.1 Introduction Wood-plastic composites (WPCs) are increasingly used for non-structural applications in the automotive, furniture and building industries. Despite remarkable progresses in manufacturing and processing technologies for WPCs products, the application of WPCs in an outdoor environment is still a major concern. The physical degradation and bio-deterioration of the wood and polymer constituents of WPC is promoted through exposure to humidity, temperature and UV light. For example, the UV exposure of common polymer matrix materials in WPCs such as polypropylene (PP) leads to rapid

115
photo-oxidation that has a marked effect on the morphology, mechanical and physical properties [1-3]. Craig et al. [4] reported that blends of vPP and rPP that were already photo-degraded, experienced faster photo-degradation when compared with WPCs made of wood and vPP. The use of only rPP in WPCs had a significant effect on the mechanical properties due to secondary crystallization. Wood material that has been exposed to UV light also experienced colour changes [5, 6] and photo-degradation [7] with marked results in alteration of physical and chemical characteristics of wood surfaces due to the degradation of the lignin. The extent of the wood degradation varied with the wood species and wood type, namely softwood and hardwood [8, 9]. In addition, the hydrophilic nature of the wood filler influences the physical and mechanical properties of WPCs and the extent of the influence depends on moisture content and temperature of the environment [10, 11]. Therefore, the stability and durability performance of WPCs in different weathering conditions need to be investigated to expand WPCs markets for outdoor applications. Studies of durability performance of vPP based WPCs with wood or natural fibres exposed to UV radiation are rather limited [3, 12-14]. Selden et al. [3] studied the effectiveness of UV stabilizers (3 wt. %) for improving the UV light resistance of wood fibre-vPP composites with a filler content of 0-50 wt. %. It was found that both the neat PP sample and the PP-wood fibre composites had good UV resistance with regard to mechanical properties after the UV exposure to weatherometer for eight weeks. Falk et al. [12] had compared the WPCs made of vPP and virgin HDPE (vHDPE) with 1500 h UV exposure and found that the fading and the reduction of the flexural properties of vPP based composites were more rapid than those of the vHDPE based composites. Abu-Sharkh et al. [13] studied the palm fibre-vPP composites and found that the composites with the palm fibre filler was more stable than the neat PP sample after both accelerated UV weathering and natural weathering in Saudi Arabia with addition of the same stabilizer (Irgastab and Tinuvin-783). According to Joseph et al. [14], the tensile properties of sisal fibre-reinforced vPP composites were decreased with UV exposure time for up to 12 weeks. These studies clearly demonstrated that the durability performance of wood or natural fibres reinforced thermoplastic composites are affected

116
by composite formulations [12, 13, 15], exposure conditions [16], exposure time and the processing methods. In this Chapter, impacts of UV exposure of rPP based composites on the stability and durability performance were investigated. Although there are a number benefits for using the recycled plastic in the WPCs, there appears to be a lack of data regarding their UV resistance. The effect of combined exposure to UV resistance and water spray on the durability performance of rPP based composites has not been studied in detail despite the fact that rPP is now used extensively as a matrix material in commercially available WPCs [17]. In this work, the composites made of radiata pine (Pinus radiata) wood flour and rPP were exposed to combine UV light and water spray. Durability performance of rPP based composites was investigated in respect to the wood content and addition of coupling agent. 7.2 Experimental The experimental variables studied in this part of work were plastic form (virgin, recycled), wood flour content and coupling agent content, and the composite formulations are given in Table 7.1. The measurements and property analysis followed the methods descried in Chapter 2 of this thesis for water absorption, thickness swelling, flexural properties, microstructures of fractured surfaces, surface colour and thermal properties. All of the composite samples with the formulations given in Table 7.1 were exposed to Fluorescent UV light (UVA-340 Lamp type) according to ASTM D4329-99 [18]. In the experiments, a metal holder was used to reposition the sample surfaces periodically thus to ensure that all surfaces were exposed to the same level of UV light irradiance. The samples were removed from the UV light box for colour measurement and sample examination after 500, 51000, 1500 and 2000 h of exposure. One complete exposure cycle consisted of 5 steps: (a) 12 h of UV light exposure at a black panel temperature of 60 ± 3oC; (b) keeping the sample in the box with the UV light off for 3 h; (c) spraying water to the exposed surfaces until the surfaces were saturated; (d) exposing the sample to UV light for 6 h at a black panel temperature of 50±3oC; and (e) keeping the sample

117
in the box with the UV light off for 3 h before starting the next cycle. Thus, each complete cycle took approximately 24 h and the exposure time of 2000 h involved 83 exposure cycles, during which period, the total exposure spectral irradiance was 0.77 Wm-2nm-1 (wavelength = 340 nm). Table 7.1 WPC formulations used for UV weathering tests for the wood flour-PP composites (percent by weight).
Composite specimen code Plastic type Plastic
content
Wood flour content
MAPP content
rPP100 Recycled PP 100 0 vPP50W50 Virgin PP 50 50 rPP50W50 Recycled PP 50 50 rPP47W50CA3 Recycled PP 47 50 3 rPP60W40 Recycled PP 60 40 rPP45W50CA5 Recycled PP 45 50 5
In the experiments, water absorption, thickness swelling, flexural properties, microstructures of the fractured surfaces, and thermal properties of the composites were measured after the UV exposure test was completed (2000 h). In the determination of the thermal properties, the theoretical heat of fusion used for calculation of ∆Hf100 for a 100% crystalline polymer were cited from [19] (∆Hf100=205 J/g for PP) and w is the mass fraction of thermoplastic in the composite samples. 7.3 Results and discussion 7.3.1 Water absorption and thickness swelling The water absorption after 2 h and 24 h water immersion for the UV weathered samples and corresponding control samples are given in Table 7.2. From the results, it was observed that the water absorption occurred fast in the initial period of water immersion and then the water absorption slow down with the elapsed time. This phenomenon was confirmed by the measured water absorption at 2 h and 24 h. The composites with the vPP matrix absorbed more water as compared to the composites made of the rPP matrix

118
after 2 h water immersion for similar formulation. The addition of MAPP in composite formulation reduced the water absorption significantly. For example, for the rPP based control composites with 50 wt. % wood content, the addition of 5 wt. % of MAPP reduced the water absorption at 24 h water immersion by 79%. However, after UV weathering, 24 h water absorption for the 5 wt. % MAPP coupled composite was increased by 70%, whereas increase in water absorption was 16.3% for the uncoupled composite made of rPP with 50 wt. % wood flour. The impact of UV weathering of the composites on the thickness swelling (after 2 h and 24 h of water immersion) was similar for all of the composite formulations. Addition of MAPP in composite formulation did not protect the thickness swelling in the water immersion tests after UV weathering. Thickness swelling rate with 2 h water immersion was less as compared to that with the 24 h water immersion for UV weathered samples. Table 7.2 Water absorption and thickness swelling of control and UV weathered
composites. Water absorption (%) Thickness swelling (%)
Control UV-weathered Control UV-weathered Composite specimen code 2 h 24 h 2 h 24 h 2 h 24 h 2 h 24 h
rPP100 0.02 (0.01*)
0.05 (0.01)
0.06 (0.01)
0.10 (0.03)
0.06 (0.03)
0.13 (0.03)
0.10 (0.02)
0.16 (0.03)
vPP50W50 1.25 (0.15)
4.60 (0.6)
2.57 (0.50)
5.51 (0.53)
1.29 (0.24)
2.51 (0.36)
1.36 (0.36)
3.34 (0.29)
rPP50W50 1.02 (0.1)
3.67 (0.7)
1.98 (0.30)
4.27 (0.63)
0.81 (0.1)
1.47 (0.2)
0.91 (0.26)
2.27 (0.37)
rPP47W50CA3 0.51 (0.03)
1.39 (0.05)
0.59 (0.08)
1.45 (0.11)
0.43 (0.03)
0.86 (0.21)
0.47 (0.07)
1.23 (0.40)
rPP60W40 0.58 (0.04)
1.69 (0.11)
1.12 (0.35)
2.34 (0.41)
0.38 (0.08)
1.08 (0.18)
0.58 (0.10)
1.79 (0.41)
rPP45W50CA5 0.46 (0.06)
1.17 (0.13)
0.83 (0.18)
1.99 (0.35)
0.38 (0.10)
0.82 (0.20)
0.59 (0.08)
1.37 (0.30)
Note: *values in the parentheses are standard deviation. The values given are the average of five replicate samples
119
The hydrophilicity of cellulose and hemicellulose within the wood material is the main cause of water absorption and swelling of WPCs. The cellulose and the hemicellulose contain numerous hydroxyl groups (–OH) and carboxyl groups (–COOH) which had tendency to interact with water molecules via hydrogen bonding under humid environment [20, 21]. Although the PP matrix penetrated to wood pores and voids in the wood-plastic interface during the compounding and hot moulding, this penetration was limited due to the non-polar nature and low viscosity of plastic (PP). Therefore, under water immersion, the water molecules resided in the unfilled pores and voids in the composites, and formed hydrogen bonds with the components of cellulose and hemicellulose. The wood component, after being exposed to the UV weathering, increased the wettability because the water repellent effect of the extractives was reduced or modified and the hydrophobic lignin component was degraded at the composite surfaces [6, 20, 21]. Colom et al. [21] analysed the degradation mechanism of the wood material exposed to the UV irradiance in a xenon test chamber. In their study, FTIR spectroscopy demonstrated an increase in the acetyl or carboxylic acid after the UV exposure, mainly derived from two lignin components (guaiacyl and syringyl nuclei). However, the cellulose and the hemicellulose were degraded to a less extent during the UV exposure. Therefore, it is believed that with the UV weathering of WPCs, the accessibility to hydroxyl groups is increased, leading to greater uptake of water and thickness swelling. The difference in the change rate between the thickness swelling and the water absorption was dependent on immersion time due to a lag effect caused by the presence of crack and void formation after the UV weathering. The lower thickness swelling after 2 h water immersion compared to that of 24 h water immersion was due to the increased ability of the composites to accommodate the swelling of the wood cell walls within the interface pores and voids. It could be envisioned that the effective swelling of the composites started once the voids and the cracks could not accommodate further swelling of the wood components with further increase in the wood absorption with the immersion time. Consequently, after prolonged water immersion, the composite thickness swelling increased further as measured at 24 h water immersion.
120
With the addition of the coupling agent (MAPP) by 3-5 wt.%, the interface bonding between the wood flour and the PP matrix was improved as the anhydride moieties in the MAPP reacted with the surface hydroxyl groups of wood flour (i e. esterification) [22]. Interaction between the cellulose component and MAPP occurred in preference to cellulose–water interactions, hindering water uptake by cellulose. Interestingly, the composites containing 3 wt. % MAPP exhibited slightly lower water uptake compared with the composites with 5 wt. % MAPP. It is possible that unreacted MAPP increased the hydrophilicity of the composites since the MAPP contains a low content of polar groups in contrast to the non-polar PP matrix. From experiment results, it was also found that at the same formulation (50 wt. % PP and 50 wt. % wood), the vPP based composites absorbed more water and had higher thickness swelling than the rPP based composites. This was true for both control and UV weathered samples. This difference is likely to be due to better penetration and interfacial bonding of recycled PP with wood flour through improved wettability due to the presence of some chemical impurities. The vPP based composite showed more degradation (Fig 7.2a) than the recycled PP based composites (Fig. 7.2b), which increased the water residing sites due to incremental intrusion and decrease in bonding. 7.3.2 Colour analysis The results for chromaticity coordinates (∆a*, ∆b*), lightness change (∆L*) and overall colour change (∆E) are presented in Table 7.3 for the composites after 500 h and 2000 h of UV weathering. The surface colour change (∆E) of the composites was quite different for different composite formulations, although ∆E generally increased with increasing the exposure time as shown in Fig.7.1. The colour change (∆E) of the composites ranged from 0.42 to 8.83 after 500 h exposure, while the corresponding values after 2000 h exposure ranged for 4.57 to 14.03. The MAPP addition reduced the ∆E to a certain extent, but could not completely prevent the surface colour changes. For example, by adding 5 wt. % MAPP to a 50 wt. % wood flour-rPP composite, the ∆E was reduced from 14.03 to 5.3 for the 2000 h UV exposure. In examining the changes in the lightness (L*) and colour coordinates (a*, b*), it was observed that the lightness change (∆L*) increased with the exposure time for most of

121
the composite formulations. Addition of the coupling agent (MAPP) reduced the surface lightening compared to the composites without the coupling agent. Increased wood filler content tended to increase the surface fading in the composites, which was thought to be due to a greater proportion of the wood filler being exposed to the surface. Lightening was more pronounced in composites made from rPP as compared to vPP with 50 % wt. wood flour content. Changes in the chromaticity values (∆a* and ∆b*) were not a strong function of the weathering time for the rPP based composites. It was also found that the change in the lightening (∆L*) increased with the increasing exposure time in a similar way to the overall colour change (Fig.7.1). Some composites showed low over colour change and lightening in the early stages of the UV exposure (500 h) but the colour changes increased significantly with the elapsed exposure time (2000 h). The colour for some composites were more pronounced at the initial stage and other showed the rapid colour change at the later stage of exposure depending on the composite formulations. After 2000 h UV exposure, all of the samples had a colour change toward green (negative value for a*) but most of the composite except for the entire rPP sample showed a colour change towards red (positive value for a*). The negative change in chromatic coordinate (b*) was observed for the composite with vPP matrix. After 500 h UV weathering, the sample showed a colour shift toward blue (negative b*), however, after 2000 h UV weathering the colour change reversed the direction from blue to yellow (positive b*).
Table 7.3 Changes in colour coordinates for composites with UV exposure times. After 500 h After 2000 h Composite
specimen code ∆a* ∆b* ∆L* ∆E ∆a* ∆b* ∆L* ∆E rPP100 -2.38 -1.87 2.24 3.77 -3.25 0.13 6.98 7.70 vPP50W50 0.22 0.00 2.36 2.37 -3.29 -9.47 7.21 12.35 rPP50W50 0.04 1.79 8.65 8.83 -0.18 0.86 14.00 14.03 rPP47W50CA3 0.08 0.40 0.68 0.79 -0.14 0.40 4.55 4.57 rPP60W40 0.07 0.24 2.74 2.76 -0.10 1.05 5.77 5.86 rPP45W50CA5 0.07 -0.06 0.41 0.42 -0.04 0.35 5.28 5.29

122
The colour change in WPCs was primarily dictated by changes in the colour of wood filler. The discolouration of the wood filler was due to degradation of lignin and some extractives, and the generation of chromophoric groups (such as carboxylic acids, carbonyls and quinines) in the filler [6, 7]. In addition, the formation of extraneous chemical groups (such as carbonyls and hydro-peroxides) and chemi-crystallization of PP matrix due to photo-degradation could also contribute to the discolouration of the WPCs [23]. Lightening of WPCs was mainly due to bleaching of the wood component during the water spray cycles in the UV weathering. The loss of wood component due to photo-degradation was much greater in the presence of water, and the water facilitates deeper light penetration into previously inaccessible cellulose microfibrils via swelling [24]. The water spray not only accelerated the oxidation reactions [6] but also removed wood extractives, which was responsible for the colour changes and resulted in the composites lightening with the UV weathering. The less colour change in the MAPP coupled composites was likely due to decreased water penetration into the filler. The decrease in the water penetration observed was thought to be due to improvement in the filler-matrix bonding.
0
4
8
12
16
r P P1 0 0
v PP 50 W
5 0
r P P5 0 W
5 0
r P P4 7 W
5 0 CA 3
r P P6 0 W
4 0
r P P4 5 W
5 0 CA 5
500 h 1000 h1500 h 2000 h
∆E
Fig. 7.1. Overall colour changes (∆E) of the composites at various UV exposure times.
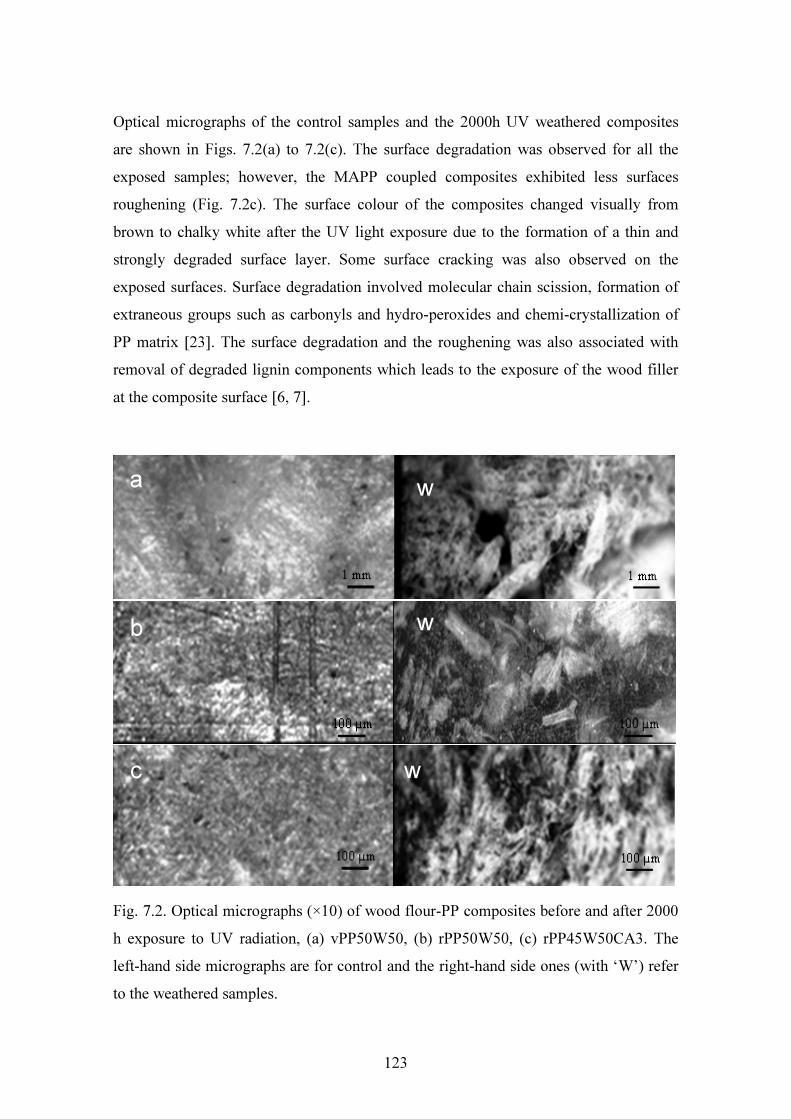
123
Optical micrographs of the control samples and the 2000h UV weathered composites are shown in Figs. 7.2(a) to 7.2(c). The surface degradation was observed for all the exposed samples; however, the MAPP coupled composites exhibited less surfaces roughening (Fig. 7.2c). The surface colour of the composites changed visually from brown to chalky white after the UV light exposure due to the formation of a thin and strongly degraded surface layer. Some surface cracking was also observed on the exposed surfaces. Surface degradation involved molecular chain scission, formation of extraneous groups such as carbonyls and hydro-peroxides and chemi-crystallization of PP matrix [23]. The surface degradation and the roughening was also associated with removal of degraded lignin components which leads to the exposure of the wood filler at the composite surface [6, 7].
Fig. 7.2. Optical micrographs (×10) of wood flour-PP composites before and after 2000 h exposure to UV radiation, (a) vPP50W50, (b) rPP50W50, (c) rPP45W50CA3. The left-hand side micrographs are for control and the right-hand side ones (with ‘W’) refer to the weathered samples.
a
b
c
w
w
w
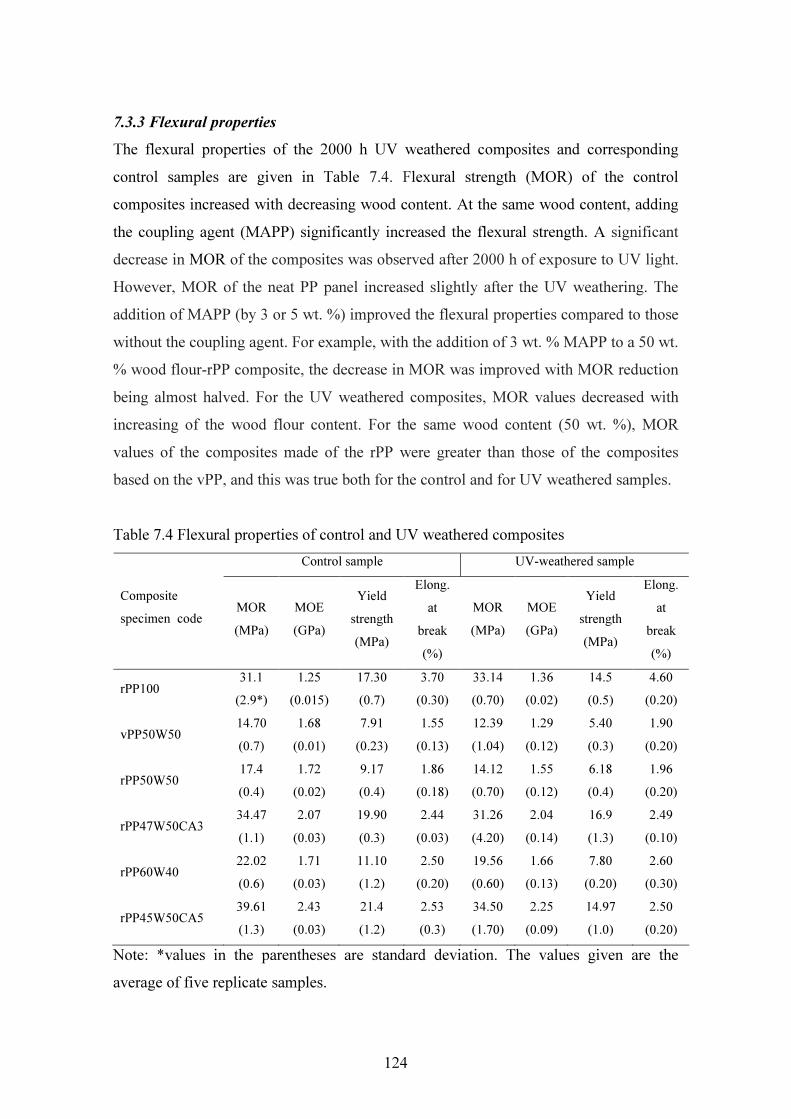
124
7.3.3 Flexural properties The flexural properties of the 2000 h UV weathered composites and corresponding control samples are given in Table 7.4. Flexural strength (MOR) of the control composites increased with decreasing wood content. At the same wood content, adding the coupling agent (MAPP) significantly increased the flexural strength. A significant decrease in MOR of the composites was observed after 2000 h of exposure to UV light. However, MOR of the neat PP panel increased slightly after the UV weathering. The addition of MAPP (by 3 or 5 wt. %) improved the flexural properties compared to those without the coupling agent. For example, with the addition of 3 wt. % MAPP to a 50 wt. % wood flour-rPP composite, the decrease in MOR was improved with MOR reduction being almost halved. For the UV weathered composites, MOR values decreased with increasing of the wood flour content. For the same wood content (50 wt. %), MOR values of the composites made of the rPP were greater than those of the composites based on the vPP, and this was true both for the control and for UV weathered samples. Table 7.4 Flexural properties of control and UV weathered composites
Control sample UV-weathered sample
Composite specimen code MOR
(MPa) MOE (GPa)
Yield strength (MPa)
Elong. at
break (%)
MOR (MPa)
MOE (GPa)
Yield strength (MPa)
Elong. at
break (%)
rPP100 31.1 (2.9*)
1.25 (0.015)
17.30 (0.7)
3.70 (0.30)
33.14 (0.70)
1.36 (0.02)
14.5 (0.5)
4.60 (0.20)
vPP50W50 14.70 (0.7)
1.68 (0.01)
7.91 (0.23)
1.55 (0.13)
12.39 (1.04)
1.29 (0.12)
5.40 (0.3)
1.90 (0.20)
rPP50W50 17.4 (0.4)
1.72 (0.02)
9.17 (0.4)
1.86 (0.18)
14.12 (0.70)
1.55 (0.12)
6.18 (0.4)
1.96 (0.20)
rPP47W50CA3 34.47 (1.1)
2.07 (0.03)
19.90 (0.3)
2.44 (0.03)
31.26 (4.20)
2.04 (0.14)
16.9 (1.3)
2.49 (0.10)
rPP60W40 22.02 (0.6)
1.71 (0.03)
11.10 (1.2)
2.50 (0.20)
19.56 (0.60)
1.66 (0.13)
7.80 (0.20)
2.60 (0.30)
rPP45W50CA5 39.61 (1.3)
2.43 (0.03)
21.4 (1.2)
2.53 (0.3)
34.50 (1.70)
2.25 (0.09)
14.97 (1.0)
2.50 (0.20)
Note: *values in the parentheses are standard deviation. The values given are the average of five replicate samples.

125
Similar trend to MOR was also found for the changes in the Young’s modulus (MOE), which decreased after the UV weathering. With 2000 h UV weathering, MOE decreased by 10.5% for rPP based composites with a wood flour content of 50 wt. %. The MAPP coupled composites exhibited less decrease in MOE when compared to composites without the MAPP. For example, for the composite with 50 wt. % wood content, MOE was reduced by 7.5% (compared to 10.5% without MAPP) with addition of 5 wt. % MAPP. For the same wood content (50 wt. %), MOE values of the composites made of the rPP were greater than those of the composites based on the vPP, and this was true both for the control and for UV weathered samples. The extent of MOE decrease was variable with the composite formulation, as some composites exhibited insignificant changes in MOE whereas for others MOE reduction was substantial. The results also demonstrated a decrease in the yield strength and an increase in the elongation at break with UV weathering. The mechanical property changes of WPCs can be linked to the colour change with UV weathering. The darkening composite surfaces indicate that the surface layers had absorbed more UV light energy and these layers act as a protective role to prevent deeper penetration of UV light. The degradation of the surface layers resulted in property reduction in the bulk. In general, MOE was less affected by the weathering when compared with yield strength indicating that the interface bonding between the wood filler and the plastic matrix was more susceptible to degradation by UV weathering. Chemical coupling between the MAPP coupled PP and the wood filler hindered the water penetration into the interfacial regions, and thus improved the mechanical properties (MOR, MOE and yield strength). From the linkage between the colour change and the mechanical changes, it was believed that the reduction in the mechanical properties after UV weathering was mainly due to the photo-degradation of PP matrix and wood flour. Microcracking that occurred due to the photo-degradation permitted moisture ingress. Moreover, when the microcracking occurred in combination with water spraying, the degradation appeared to be accelerated by erosion of the surface. The slight increase in MOR and MOE of the neat PP with UV weathering, although insignificant, could be due to an increase in the crystallinity of entire PP surface [3, 23]. The exact reasons for the difference between the composites made of the rPP and those made of the vPP are not fully understood, but

126
the darker surfaces of the composites made from rPP compared to those made of vPP could absorbed more UV radiation and thus acted as a stronger protective role that prevented the UV radiation from further penetrating into the composites. The observed increase in elongation at break with UV weathering is consistent with the findings of Li [25] who reported that the increase in the elongation at break in UV weathered WPCs was due to the weakening of the interface bonding. 7.3.4 Microstructure characterization The microstructure of the fractured surfaces of UV weathered composites was compared with the control samples as shown in Figs. 7.3 to 7.5. Fig. 7.3(a) shows the entire rPP sample (neat PP) at control and the corresponding sample after UV weathering is shown in Fig.7.3(b) although UV weathering did not cause significant changes in the morphology of the fracture surfaces. As discussed in the preceding sections, the photodegradation of the PP mainly concentrated at the surfaces, therefore, significantly morphological changes within the interior region of the composites was not likely. Fig. 7.3. SEM images (×200) of neat rPP, (a) control, and (b) weathered samples. Figs.7.4 (a) to 7.4(d) show the SEM images of fracture surfaces of the composites made from 50 wt. % wood flour with vPP (Fig. 7.4a for control and Fig. 7.4c for weathered sample) and with rPP matrix (Fig. 7.4b for control and Fig.7.4d for weathered sample). For both rPP and vPP based composites, the control samples exhibited a considerable amount of matrix and fibre fracture, leaving a relatively smooth fracture surface (Figs. 7.4a and c). The fracture surfaces of the weathered sample showed some fibre being
b a
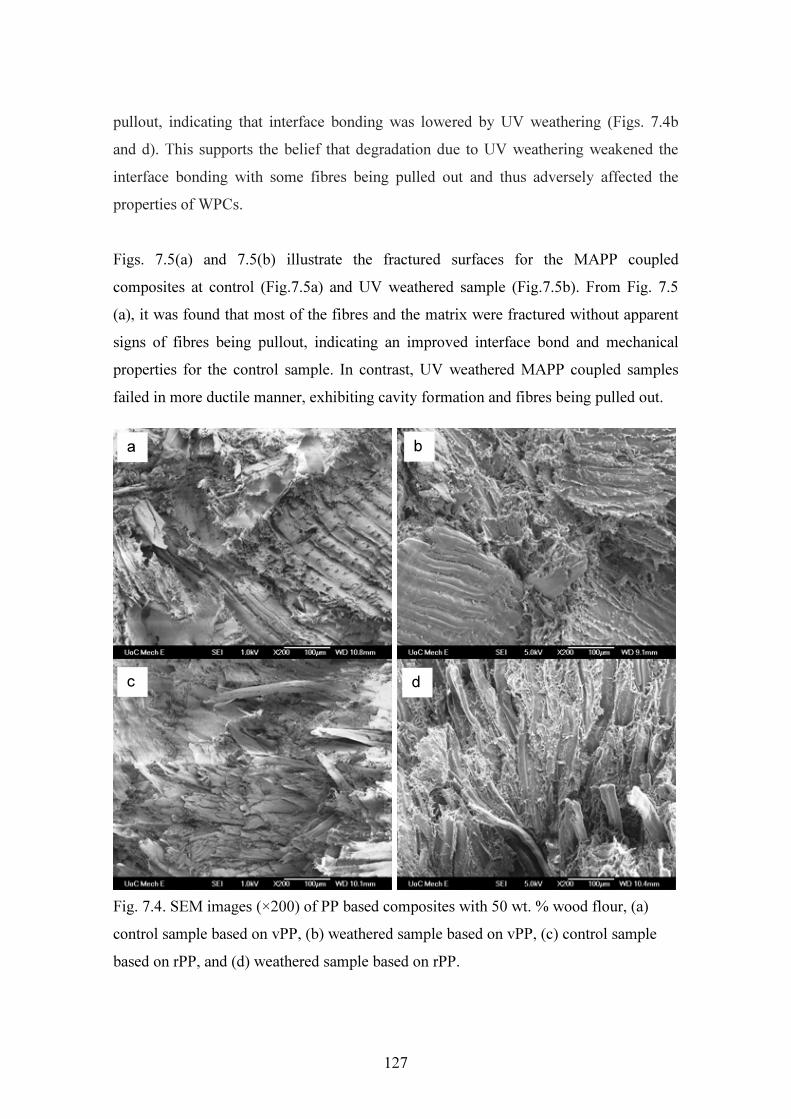
127
pullout, indicating that interface bonding was lowered by UV weathering (Figs. 7.4b and d). This supports the belief that degradation due to UV weathering weakened the interface bonding with some fibres being pulled out and thus adversely affected the properties of WPCs. Figs. 7.5(a) and 7.5(b) illustrate the fractured surfaces for the MAPP coupled composites at control (Fig.7.5a) and UV weathered sample (Fig.7.5b). From Fig. 7.5 (a), it was found that most of the fibres and the matrix were fractured without apparent signs of fibres being pullout, indicating an improved interface bond and mechanical properties for the control sample. In contrast, UV weathered MAPP coupled samples failed in more ductile manner, exhibiting cavity formation and fibres being pulled out. Fig. 7.4. SEM images (×200) of PP based composites with 50 wt. % wood flour, (a) control sample based on vPP, (b) weathered sample based on vPP, (c) control sample based on rPP, and (d) weathered sample based on rPP.
c
a
d
b

128
Fig. 7.5. SEM micrographs (×200) of composite of rPP45W50CA5, (a) control sample, (b) weathered sample. This form of failure indicates that UV weathering had decreased the interfacial strength in MAPP coupled WPCs (Fig 7.5b). The weakening of the interfacial bonding was due to the degradation of the cellulose, lignin and hemicellulose in the wood component, and the increased concentration of chromophoric groups because of photo-degradation of the PP matrix in the presence of water. 7.3.5 Thermal properties 7.3.5.1 Melting enthalpy and temperatures The melting thermograms for the weathered composites and corresponding control samples were obtained from the second heating in the DSC scanning tests and the results are shown in Fig. 7.6. The composite thermal properties including melting enthalpy (∆Hm), crystallization enthalpy (∆Hc), peak crystallization temperature (Tc), peak melting temperature (Tm), onset crystallization temperature (Tconset) and crystallisation (Xc) were determined from the second heating and cooling scans and the results are given in Table 7.4. Double endothermic melting peaks were observed for all of the composite formulations although the secondary peaks were much weaker than the primary peaks. The primary (major) melting peak for the neat rPP control sample was found to be at 165.7 °C, which corresponds to the melting temperature of its α-crystalline phase.
b a
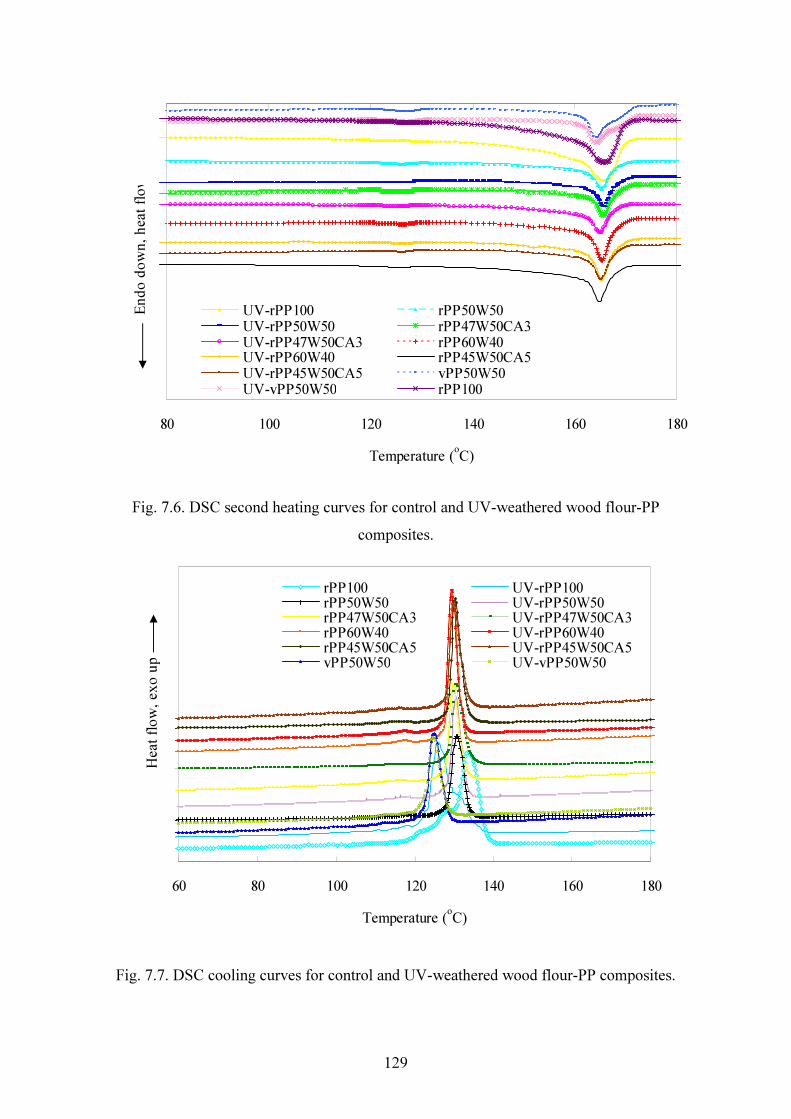
129
Fig. 7.6. DSC second heating curves for control and UV-weathered wood flour-PP composites.
Fig. 7.7. DSC cooling curves for control and UV-weathered wood flour-PP composites.
60 80 100 120 140 160 180Temperature (oC)
Heat
flow,
exo u
p.
rPP100 UV-rPP100rPP50W50 UV-rPP50W50rPP47W50CA3 UV-rPP47W50CA3rPP60W40 UV-rPP60W40rPP45W50CA5 UV-rPP45W50CA5vPP50W50 UV-vPP50W50
80 100 120 140 160 180Temperature (oC)
Endo
down
, hea
t flow
UV-rPP100 rPP50W50UV-rPP50W50 rPP47W50CA3UV-rPP47W50CA3 rPP60W40UV-rPP60W40 rPP45W50CA5UV-rPP45W50CA5 vPP50W50UV-vPP50W50 rPP100

130
For the neat PP control sample, the secondary peak appeared at a lower temperature of approximately 148 to 154°C which corresponds to the melting of β-crystalline forms of PP in the composite [26]. For all of the control samples of PP based composites, the major peaks were similar to the neat rPP control sample. While the secondary melting peaks were observed at approximately 125°C, which was attributed to the melting of ethylene crystal units in the PP copolymer segregating as a second phase in the filled composites [27]. The weathered neat rPP and composite samples showed similar melting thermograms with a slight decrease in the peak melting temperature. For the rPP based composites, the melting enthalpy and crystallization enthalpy decreased with increasing of wood flour, which indicates the decreased thermal stability with adding more wood flour [28]. The weathered composites showed a decrease in the melting enthalpy and Tm and this could be the result of crystal formation with smaller molecules during re-crystallization. In UV weathering, chain scission and more defective groups of many extraneous groups (carbonyl and hydroperoxide) also led to a decrease in crystallinity [23].
7.3.5.2 Crystallization temperature and crystallinity The crystallization properties of the PP based composites were calculated from cooling thermograms (Fig. 7.7). The peak crystallization temperature (Tc) of the control sample was decreased as compared to the neat rPP (Table 7.4). The crystallisation (Xc) of the non-coupled composites was slightly lower than that of the neat rPP sample. Incorporation of MAPP in the composite slightly increased Xc and this is believed to be due to chain branching of maleaic anhydride and better coupling effect of the MAPP, which extended the predominance of the crystallization process [29]. The weathered neat PP sample showed a decrease of approximately 3 °C in Tc compared to the control whereas the corresponding values for the PP based composites were almost constant with the UV weathering. This trend also applied to the crystallization temperature at onset (Tconset) with a 4.6°C decrease for the weathered neat rPP sample, while PP based composites showed almost constant values of Tconset with the UV weathering. For the crystallisation (Xc), a slight increase was observed for the weathered neat PP sample while the PP based composites showed a decrease both for the non-coupled and the coupled composites with weathering. For example, the composite with 5 wt. % MAPP
131
exhibited 8.3% reduction in Xc after weathering. The crystallinity decrease in PP based composites was presumably because of the increased defects of the reclaimed molecules having stronger influence than the reduced molecular size [4]. In addition, the progressive reduction of molecular weight and increase in numbers of chemical irregularities in the chain and the generation of impurity groups with the UV exposure hindered further crystallization, resulting in the decrease of Xc in the molecules of photo-degraded PP [4, 23]. 7.4 Conclusions This part of study presented in this chapter has investigated the effect of accelerated weathering under combined UV radiation and water spray on microstructure and properties of the PP based composites. The influence of wood content, addition of coupling agent and the UV exposure time had been studied. The results from this study had confirmed that the composites made of both the virgin and the recycled PP has comparable stability and durability performance with the UV weathering. The main observations drawn from this study are summarised as follows:
1. In the 2 h and 24 h water immersion, water absorption and thickness swelling of the UV weathered composites were increased compared to those of the corresponding control samples. The coupling effect of MAPP was reduced and MAPP coupled composite showed increase in 24 h water absorption after UV weathering.
2. Flexural strength (MOR) and Young’s modulus (MOE) of the weathered composites were decreased while elongation at break was increased irrespective of composite formulations. However, the MAPP coupled weathered composite showed lower degradation of MOR and MOE by 50% and 27%, respectively, as compared to non-coupled composite.
3. Observations of the fracture surfaces confirmed a decrease in interface bonding between the wood flour and the PP matrix. Fibre pullout was observed in the weathered composites, while the fibre fracture was dominant in the control samples.
4. The surface of the weathered composites experienced a colour change (∆E) mainly due to the lightening (∆L*) of the composites surface. The colour change
132
also increased with the UV exposure time for all the composite formulations. Composites containing MAPP exhibited a less colour change as compared to non-coupled composites.
5. Crystallanity (Xc) of the weathered neat PP sample was increased by 6%, while the PP composites showed a decrease both for the non-coupled and coupled composites irrespective with virgin or recycled PP with weathering. However, the Xc was increased by 2.4% for recycled PP based composite, which is within experimental error. The MAPP coupled (5 wt. %) composite exhibited 8.3% reduction in Xc after weathering.

Table 7.4 Thermal properties control and UV weathered composites through DSC analysis. Control sample UV-weathered sample
Composite code ∆Hm
(J/g) Tm peak (oC)
∆Hc (J/g)
Xc
(%) Tc peak (oC)
Tconset (oC)
∆Hm
(J/g) Tm peak (oC)
∆Hc (J/g)
Xc
(%) Tc peak (oC)
Tconset (oC)
rPP100 75.6 165.7 89.8 43.8 133.4 138.6 74.7 164.2 95.3 46.5 130.4 134.0 vPP50W50 85.1 164.1 86.4 42.2 125.1 128.8 65.1 164.0 82.9 40.4 125.0 129.0 rPP50W50 67.3 165.5 75.6 36.9 130.6 134.0 69.3 165.3 77.4 37.8 130.7 133.8 rPP47W50CA3 76.3 165.3 86.6 42.2 129.9 134.0 75.3 165.2 79.7 38.9 130.0 133.8 rPP60W40 74.3 165.1 88.3 43.1 130.0 132.5 75.8 164.9 85.1 41.5 129.7 132.8 rPP45W50CA5 100.7 165.0 105.3 51.4 130.2 133.4 90.5 164.9 90.9 44.3 130.1 134.0
In the table, ∆Hm is the melting enthalpy, ∆Hc is the crystallization enthalpy, Xc is the crystallinity, Tm is the peak melting temperature, Tc and Tconset are the crystallization temperature at peak and onset, respectively.
134
7.5 References [1] Bedia EL, Paglicawan MA, Bernas CV, Bernardo ST, Tosaka M, Kohjiya S.
Natural weathering of polypropylene in a tropical zone. Journal of Applied Polymer Science 2003; 87:931-38.
[2] Tidjani A. Photooxidation of polypropylene under natural and accelerated weathering conditions. Journal of Applied Polymer Science 1998; 64(13):2497-2503.
[3] Seldén R., Nyström B., and Långström R. UV aging of poly(propylene)/wood-fibre composites. Polymer Composites 2004; 25(5):543-53.
[4] Craig IH, White J, Kin PC. Crystallization and chemi-crystallization of recycled photo-degraded polypropylene. Polymer 2005; 46:505-12.
[5] Cui W, Kamdem DP, Rypstra T. Diffuse reflectance infrared fourier transform spectroscopy (DRIFT) and colour changes of artificial weathering wood. Wood and Fibre Science 2004; 36(3):291-301.
[6] Hon DNS, Chang ST, Feist W C. Weathering characteristics of hardwood surfaces. Wood Science and Technology 1986; 20:169-83.
[7] Chang ST, Hon DNS, Feist WC. Photodegradation and photoprotection of wood surfaces. Wood and Fibre 1982;14(2):104-17.
[8] Pandey KK. Study of the effect of photo-irradiation on the surface chemistry of wood. Polymer Degradation and Stability 2005;90:9-20.
[9] Pastore T C M, Santos KO, Rubim JC. A spectrocolorimetric study on the effect of ultraviolet irradiation of four tropical hardwoods. Bioresource Technology 2004;93:37-42.
[10] Marcovich NE, Reboredo MM, Aranguren MI. Dependence of the mechanical properties of wood flour-polymer composites on the moisture content. Journal of Applied Polymer Science 1998;68:2069-76.
[11] Lin Q, Zhou X, Dai G. Effect of hydrothermal environment on moisture absorption and mechanical properties of wood flour–filled polypropylene composites. Journal of Applied Polymer Science 2002;85:2824–32
[12] Falk RH, Lundin T, and Felton C. The effects of weathering on wood-thermoplastic composites intended for outdoor application. In: Durability and

135
disaster mitigation in wood-frame housing; 2000; Madison, Wisconsin, USA: Forest Products Society; 2000. p. 175-79.
[13] Abu-Sharkh BF, Hamid H. Degradation study of date palm fibre/polypropylene composites in natural and artificial weathering: mechanical and thermal analysis. Polymer Degradation and Stability 2004;85:967-73.
[14] Joseph PV, Rabello M S, Mattoso LHC, Joseph K, Thomas S. Environmental effects on the degradation behaviour of sisal fibre reinforced polypropylene composites. Composite Science and Technology 2002;62:1357–72.
[15] Stark NM, Matauna LM. Influence of photostabilizers on wood flour-HDPE composites exposed to xenon-arc radiation with and without water spray. Polymer Degradation and Stability 2006;91:3048-56.
[16] Schut JH. Wood-plastic composites: Weathering quality issues. Plastics Technology 2005;51(9):62-69.
[17] Clemons C. Wood-plastics composites in the United States: The interfacing of two industries. Forest Products Journal 2002:52(6):10-18.
[18] ASTM D 4329-99 Standard practice for fluorescent UV exposure of plastics. In: 2002 Annual book of American Society for Testing and Materials Standards. West Conshohocken, PA. 2002.
[19] Ehrenstein GW, Trawiel R. Thermal analysis of plastics: theory and practice: Carl Hanser Verlag, Munich, 2004.
[20] Kalnins MA, Feist WC. Increase in wettability of wood with weathering. Forest product journal 1993;43(2):55-57.
[21] Colom X, Carrillo F, Nogues F, Garriga P. Structural analysis of photodegraded wood by means of FTIR spectroscopy. Polymer Degradation and Stability 2003;80:543–49.
[22] Matuana LM, Balatinecz JJ, Sodhi RNS, Park CB. Surface characterization of esterified cellulosic fibres by XPS and FTIR spectroscopy. Wood Science and Technology 2001;35(3):191-201.
[23] Rabello MS. and White JR. Crystallization and melting behaviour of photodegraded polypropylene-I. Chemi-crystallization. Polymer 1997;38(26):6379-87.
136
[24] Hon DNS, Chang ST. Surface degradation of wood by ultraviolet light. Journal of Polymer Science: Polymer Chemistry edition 2003;22(9):2227-41.
[25] Li R. Environmental degradation of wood-HDPE composite. Polymer Degradation and Stability 2000;70(2):135-45.
[26] Yongli M, Xiaoya C, Qipeng G. Bamboo fibre-reinforced polypropylene composites: Crystallization and interfacial morphology. Journal of Applied Polymer Science 1997;64(7):1267-73.
[27] Zoran SP, Jaroslava BS, Vladimir D, and Zeljko S. Effect of addition of polyethylene on properties of polypropylene/ethylene-propylene rubber blends. Journal of Applied Polymer Science 1996;59(2):301-10.
[28] Doh GH, Lee SY, Kang IA, Kong YT. Thermal behaviour of liquefied wood polymer composites (LWPC). Composites Structures 2005;68:103-08.
[29] Kim HS, Lee BH, Choi SW, Kim S, Kim HJ. The effect of types of maleic anhydride-grafted polypropylene (MAPP) on the interfacial adhesion properties of bio-flour-filled polypropylene composites. Composites Part A: Applied Science and Manufacturing 2007;38:1473-82.

137
CHAPTER 8 ACCELERATED ULTRAVIOLET WEATHERING OF RECYCLED
HIGH DENSITY POLYETHYLENE-SAWDUST COMPOSITES Abstract This part of study has investigated accelerated ultraviolet (UV) weathering of hot-press moulded recycled high-density polyethylene (rHDPE) based wood flour composites with combined UV and water spray. Colour change, dimensional stability, flexural and thermal properties were determined after 2000 h of UV weathering. The results showed that water absorption and thickness swelling of composites were increased after 2000 h accelerated UV weathering. Flexural strength, yield strength, and stiffness of the composites were decreased; however, elongation at break was increased after weathering. Exposed surface of the composites experienced significant colour changes and lightening. SEM examination revealed a decrease in interface bonding between the wood flour and the HDPE matrix after UV weathering. The MAPP coupled composites showed improvements in colour change, stability and flexural properties compared to corresponding non-coupled ones after weathering. Crystallanity (Xc) of the weathered neat HDPE sample was decreased by 6.4%, while the HDPE composites showed a decrease both for the non-coupled and coupled composites irrespective with virgin or recycled HDPE with weathering. The MAPP coupled (5 wt. %) composite exhibited greater reductions in Xc by 30% after UV weathering. It was observed that all of the property changes were similar and comparable for both virgin HDPE (vHDPE) and rHDPE based composites after UV weathering. 8.1 Introduction WPCs application in outdoor environment is still a major concern despite remarkable progresses had been made in processing technologies. Physical degradation and bio-deterioration of the wood and the polymer constituents of WPCs are promoted when the composites are exposed to humidity, temperature and UV light during their service life. Subsequently, the physical and mechanical properties of WPCs were affected depending on the moisture content and temperature [1, 2]. Marcovich et al. [1] found that the
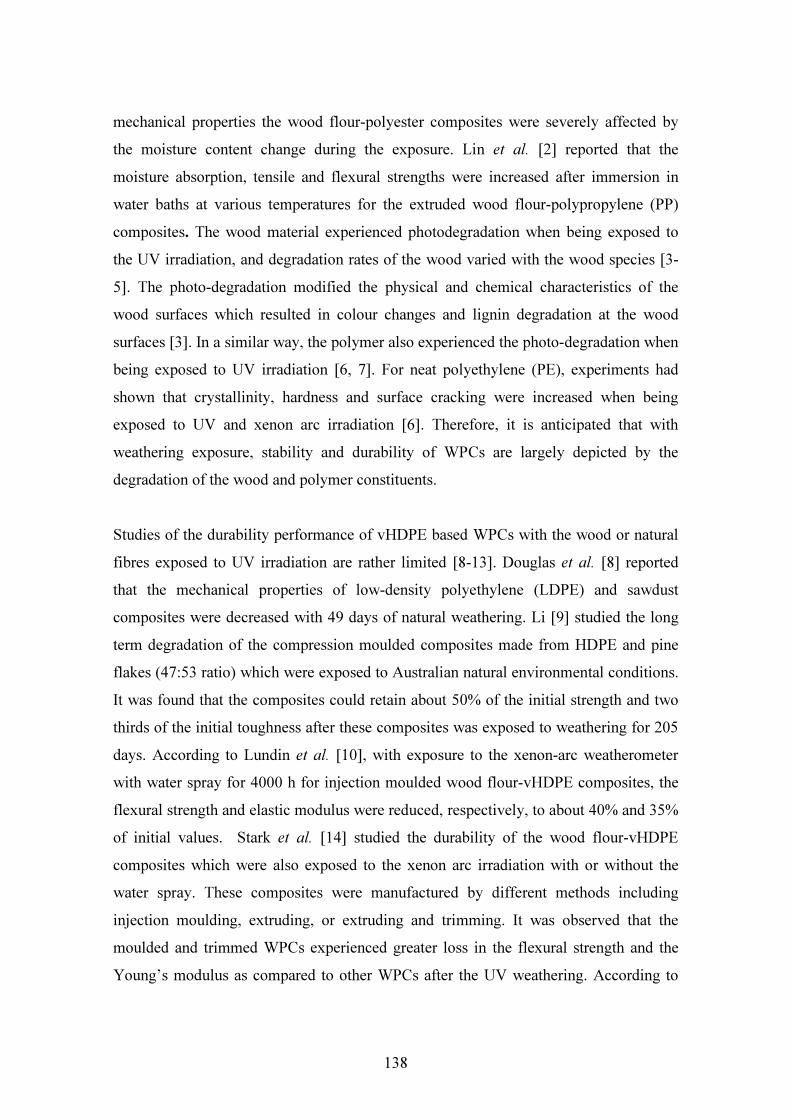
138
mechanical properties the wood flour-polyester composites were severely affected by the moisture content change during the exposure. Lin et al. [2] reported that the moisture absorption, tensile and flexural strengths were increased after immersion in water baths at various temperatures for the extruded wood flour-polypropylene (PP) composites. The wood material experienced photodegradation when being exposed to the UV irradiation, and degradation rates of the wood varied with the wood species [3-5]. The photo-degradation modified the physical and chemical characteristics of the wood surfaces which resulted in colour changes and lignin degradation at the wood surfaces [3]. In a similar way, the polymer also experienced the photo-degradation when being exposed to UV irradiation [6, 7]. For neat polyethylene (PE), experiments had shown that crystallinity, hardness and surface cracking were increased when being exposed to UV and xenon arc irradiation [6]. Therefore, it is anticipated that with weathering exposure, stability and durability of WPCs are largely depicted by the degradation of the wood and polymer constituents. Studies of the durability performance of vHDPE based WPCs with the wood or natural fibres exposed to UV irradiation are rather limited [8-13]. Douglas et al. [8] reported that the mechanical properties of low-density polyethylene (LDPE) and sawdust composites were decreased with 49 days of natural weathering. Li [9] studied the long term degradation of the compression moulded composites made from HDPE and pine flakes (47:53 ratio) which were exposed to Australian natural environmental conditions. It was found that the composites could retain about 50% of the initial strength and two thirds of the initial toughness after these composites was exposed to weathering for 205 days. According to Lundin et al. [10], with exposure to the xenon-arc weatherometer with water spray for 4000 h for injection moulded wood flour-vHDPE composites, the flexural strength and elastic modulus were reduced, respectively, to about 40% and 35% of initial values. Stark et al. [14] studied the durability of the wood flour-vHDPE composites which were also exposed to the xenon arc irradiation with or without the water spray. These composites were manufactured by different methods including injection moulding, extruding, or extruding and trimming. It was observed that the moulded and trimmed WPCs experienced greater loss in the flexural strength and the Young’s modulus as compared to other WPCs after the UV weathering. According to
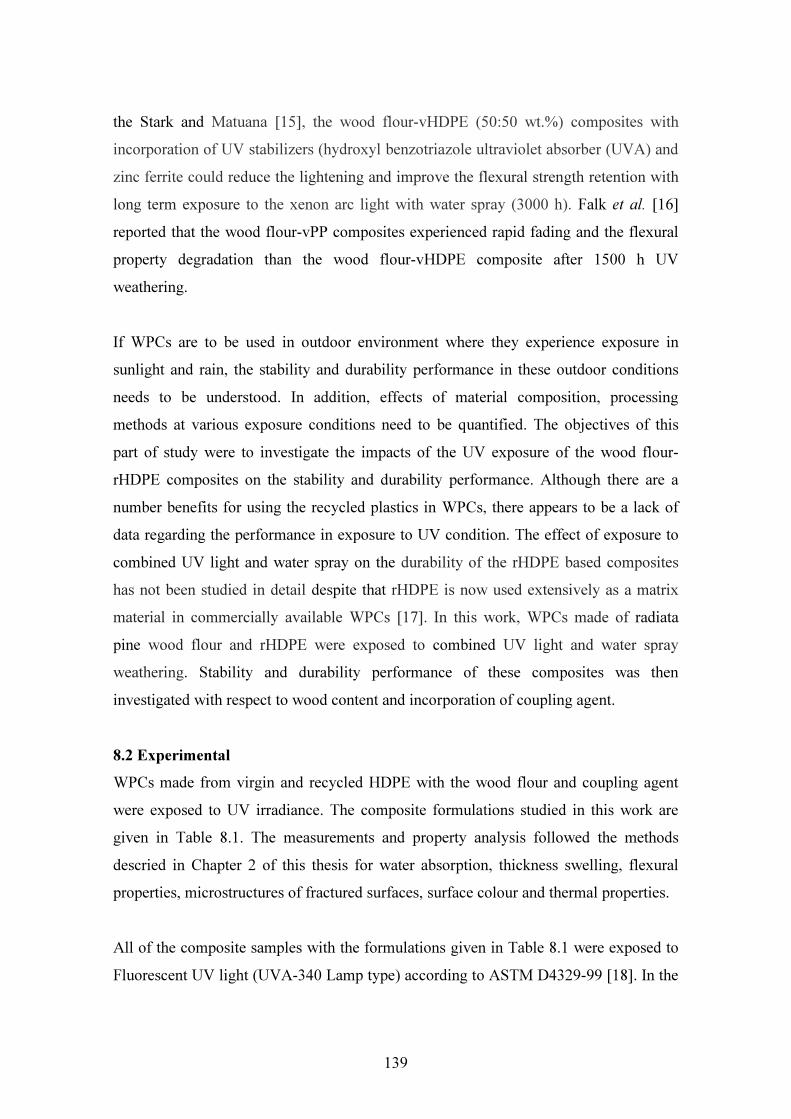
139
the Stark and Matuana [15], the wood flour-vHDPE (50:50 wt.%) composites with incorporation of UV stabilizers (hydroxyl benzotriazole ultraviolet absorber (UVA) and zinc ferrite could reduce the lightening and improve the flexural strength retention with long term exposure to the xenon arc light with water spray (3000 h). Falk et al. [16] reported that the wood flour-vPP composites experienced rapid fading and the flexural property degradation than the wood flour-vHDPE composite after 1500 h UV weathering. If WPCs are to be used in outdoor environment where they experience exposure in sunlight and rain, the stability and durability performance in these outdoor conditions needs to be understood. In addition, effects of material composition, processing methods at various exposure conditions need to be quantified. The objectives of this part of study were to investigate the impacts of the UV exposure of the wood flour-rHDPE composites on the stability and durability performance. Although there are a number benefits for using the recycled plastics in WPCs, there appears to be a lack of data regarding the performance in exposure to UV condition. The effect of exposure to combined UV light and water spray on the durability of the rHDPE based composites has not been studied in detail despite that rHDPE is now used extensively as a matrix material in commercially available WPCs [17]. In this work, WPCs made of radiata pine wood flour and rHDPE were exposed to combined UV light and water spray weathering. Stability and durability performance of these composites was then investigated with respect to wood content and incorporation of coupling agent. 8.2 Experimental WPCs made from virgin and recycled HDPE with the wood flour and coupling agent were exposed to UV irradiance. The composite formulations studied in this work are given in Table 8.1. The measurements and property analysis followed the methods descried in Chapter 2 of this thesis for water absorption, thickness swelling, flexural properties, microstructures of fractured surfaces, surface colour and thermal properties. All of the composite samples with the formulations given in Table 8.1 were exposed to Fluorescent UV light (UVA-340 Lamp type) according to ASTM D4329-99 [18]. In the

140
experiments, a metal holder was used to reposition the sample surfaces periodically thus to ensure that all surfaces were exposed to the same level of the UV light irradiance. The samples were removed from the UV light box for colour measurement after 500, 1000, 1500 and 2000 h of exposure. One complete exposure cycle consisted of 5 steps: (a) 12 h of UV light exposure at a black panel temperature of 60 ± 3oC; (b) keeping the sample in the box with the UV light off for 3 h; (c) spraying water to the exposed surfaces until the surfaces were saturated; (d) exposing the sample to the UV light for 6 h at a black panel temperature of 50±3oC; and (e) keeping the sample in the box with the UV light off for 3 h before starting the next cycle. Thus, each complete cycle took approximately 24 h and the exposure time of 2000 h involved 83 exposure cycles, during which period, the total exposure spectral irradiance was 0.77 Wm-2nm-1 (wavelength = 340 nm). In the experiments, water absorption, thickness swelling, flexural properties, microstructures of the fractured surfaces and thermal properties of the composites were measured after UV exposure test was completed (2000 h). The crystallinity of the composites was calculated by using Eq. (2.6). In the determination of the thermal properties, the theoretical heat of fusion used for calculation of ∆Hf100 for a 100% crystalline polymer were cited from [19] (∆Hf100=293 J/g for HDPE) and w is the mass fraction of thermoplastic in the composite samples. Table 8.1 Formulations of wood flour-HDPE composites used for UV weathering (percent by weight).
Composite specimen code Plastic type Plastic
content Wood flour content
MAPP content
rHDPE100 Recycled 100 0 0 rHDPE70W30 Recycled 70 30 0 rHDPE60W40 Recycled 60 40 0 vHDPE50W50 Virgin 50 50 0 rHDPE50W50 Recycled 50 50 3 rHDPE45W50CA5 Recycled 45 50 5

141
8.3 Results and discussion 8.3.1 Colour analysis The results for chromaticity coordinates (∆a*, ∆b*), lightness (∆L*) and overall colour change (∆E) are presented in Table 8.2 for the composites after 500 h and 2000 h of UV weathering. A value of ∆E = 1 is generally accepted as the minimum colour change that is detectable to the human eye. From the results, it was observed that WPCs with higher wood content exhibited greater colour changes. For example, after 2000 h UV weathering the ∆E value was 1.65 for the composite made of 30 wt. % wood flour and 70 wt. % rHDPE matrix, while this value was increased to 2.66 for the composite with 50 wt. % wood flour. The increased colour change was attributed to a greater proportion of wood flour being exposed at the composite surface where complete encapsulation by the HDPE matrix was less likely. It was observed that the vHDPE based composites had experienced greater colour changes than those of the rHDPE based composites. However, the MAPP coupled composites showed less surface colour changes compared to those without the MAPP coupling agent. For example, by adding 5 wt. % MAPP to the 50 wt. % wood flour-rHDPE composite, the ∆E was reduced from 2.7 to 1.8 after the 2000 h UV exposure. In examining the changes in lightness (∆L*) and colour coordinates (∆a*, ∆b*), it was observed that the lightness change (∆L*) increased with the exposure time for most of the composite formulations. Addition of the coupling agent (MAPP) reduced the surface lightening compared to the composites without the coupling agent. However, the neat rHDPE sample actually yielded a negative ∆L* value confirming that the composite surface was darkened after the weathering. Changes in the chromaticity values (∆a* and ∆b*) were not a strong function of the weathering time for the rHDPE based composites. The negative ∆b* value for the vHDPE based composites indicates the colour shift towards blue after the weathering. These results are consistent with the results obtained by Stark et al. [20] for the vHDPE based composites. It was also found that the overall colour change (∆E) increased with increasing of UV exposure time (Fig.8.1). Some composites showed lower colour change and lightening in the early stages of UV exposure (500 h) but the colour changes increased significantly with the elapsed exposure time (2000 h).

142
Table 8.2 Change in colour coordinates of the composites after accelerated UV weathering.
500 h UV weathering 2000 h UV weathering Composite specimen code ∆a* ∆b* ∆L* ∆E ∆a* ∆b* ∆L* ∆E rHDPE100 0.17 0.31 -4.10 4.11 -0.01 -0.39 -3.04 3.07 rHDPE70W30 -0.04 0.39 0.41 0.57 -0.04 0.61 1.53 1.65 rHDPE60W40 0.12 0.83 0.23 0.87 0.14 1.01 1.56 1.86 vHDPE50W50 0.24 -1.13 -0.10 1.16 -1.05 -3.10 6.11 6.94 rHDPE50W50 0.20 0.37 -0.32 0.53 0.05 0.57 2.60 2.66 rHDPE45W50CA5 0.13 0.34 -0.49 0.61 0.02 0.53 1.71 1.80
0
2
4
6
8
r HD PE 10 0
r HD PE 70 W
3 0
r HD PE 60 W
4 0
v HD PE 50 W
5 0
r HD PE 50 W
5 0
r HD PE 45 W
5 0 CA 5
500 h 1000 h
1500 h 2000 h
∆E
Fig. 8.1. Overall colour changes (∆E) of the composites at various UV exposure times. In WPCs, change in wood colour plays an important role in the composite colour change. The photo-degradation of the wood could result in breakdown of lignin, hemicelluloses, cellulose, and loss of the wood material. On the other hand, the water spray cycles accelerated the oxidation reaction, washed away the degraded layer, and removed the natural wood extractives. Subsequent loss of the lignin and other colouring components such as wood extractives, and the generation of chromophoric groups (such as carboxylic acids, carbonyls, and quinines) of wood filler caused the colour change of the composites [20-22]. Furthermore, the formation of extraneous groups (such as

143
carbonyls and hydro-peroxides) from the photodegradation of the HDPE matrix due to chain scission and cross-linking also increased the colour change of WPCs [6, 23]. The lightening was mainly due to bleaching of the wood component during the water spray cycles. Reduced colour change in the MAPP coupled composites was likely due to the reduced photo-oxidation because of strengthened interface bounding which limited water penetration in the wood component during the water spray.
Fig. 8.2. Optical micrographs (×10) of control and weathered composites (2000 h), (a) rHDPE100, (b) vHDPE50W50, (c) rHDPE50W50 and (d) rHDPE45W50CA5. The left-hand side micrographs are for control and the right-hand side ones (with ‘W’) refer to the weathered samples.

144
Optical micrographs of the control samples and composites with 2000 h UV weathering are shown in Figs. 8.2(a) to 8.2(d). The surface degradation was observed for all the exposed samples, however, MAPP coupled composites exhibited less surface roughening (Fig. 8.2d). The surface colour of the composites changed visually from brown to chalky after UV light exposure due to the formation of a thin and strongly degraded surface layer. Some cracking was also observed on the exposed surfaces. The degradation of the lignin and the micro-fibril (cellulose) emerged at surface resulting in roughening and checking of the exposed wood surfaces [21, 24]. 8.3.2 Water absorption and thickness swelling The water absorption after 2 h and 24 h of water immersion for UV weathered samples and that of the corresponding control samples are given in Figs. 8.3 and 8.4, respectively. From the results, it was observed that the water absorption occurred fast in the initial period of water immersion and then the water absorption slowed down with the elapsed time. This phenomenon was confirmed by the measured water absorption at 2 h and 24 h. The neat rHDPE sample did not show significant variation in the water absorption after the UV weathering. With the same formulation, the composites with the vHDPE matrix absorbed more water as compared to the composites made of the rHDPE matrix after 2 h water immersion. The addition of MAPP in the composite formulation reduced the water absorption significantly; however, the influence of the coupling agent was reduced to a certain extent after weathering. For example, for the rHDPE based control composites with 50 wt. % wood content, addition of 5 wt. % MAPP reduced the water absorption at 24 h immersion by 68%. However, the water absorption after the UV weathering, the water absorption by the 5 wt. % MAPP containing composites was increased by 12% compared an increase of 15.4% for the non-coupled composites. The rate of water absorption in terms of water absorption per unit time was higher in 2 h water immersion than that in the 24 h water immersion for the exposed composite samples (Fig. 8.5). From Fig.8.5, it was also seen that the water absorption rate after 2 h water immersion for the vHDPE based composite was about twice that of 24 h water immersion. The results of thickness swelling for the 2 h and 24 h water immersion are given in Fig. 8.6 and Fig. 8.7, respectively, for weathered composites and corresponding control samples.

145
0
2
4
6
r HD PE 10 0
r HD PE 70 W
3 0
r HD PE 60 W
4 0
v HD PE 50 W
5 0
r HD PE 50 W
5 0
r HD PE 45 W
5 0 CA 5
Water
absor
ption
(%) Control
Weathered
Fig. 8.3. Water absorption for control and UV weathered composites after 2 h water
immersion.
0
2
4
6
8
10
r HD PE 10 0
r HD PE 70 W
3 0
r HD PE 60 W
4 0
v HD PE 50 W
5 0
r HD PE 50 W
5 0
r HD PE 45 W
5 0 CA 5
Wate
r abso
rption
(%) Control
Weathered
Fig. 8.4. Water absorption for control and UV weathered composites after 24 h water immersion.
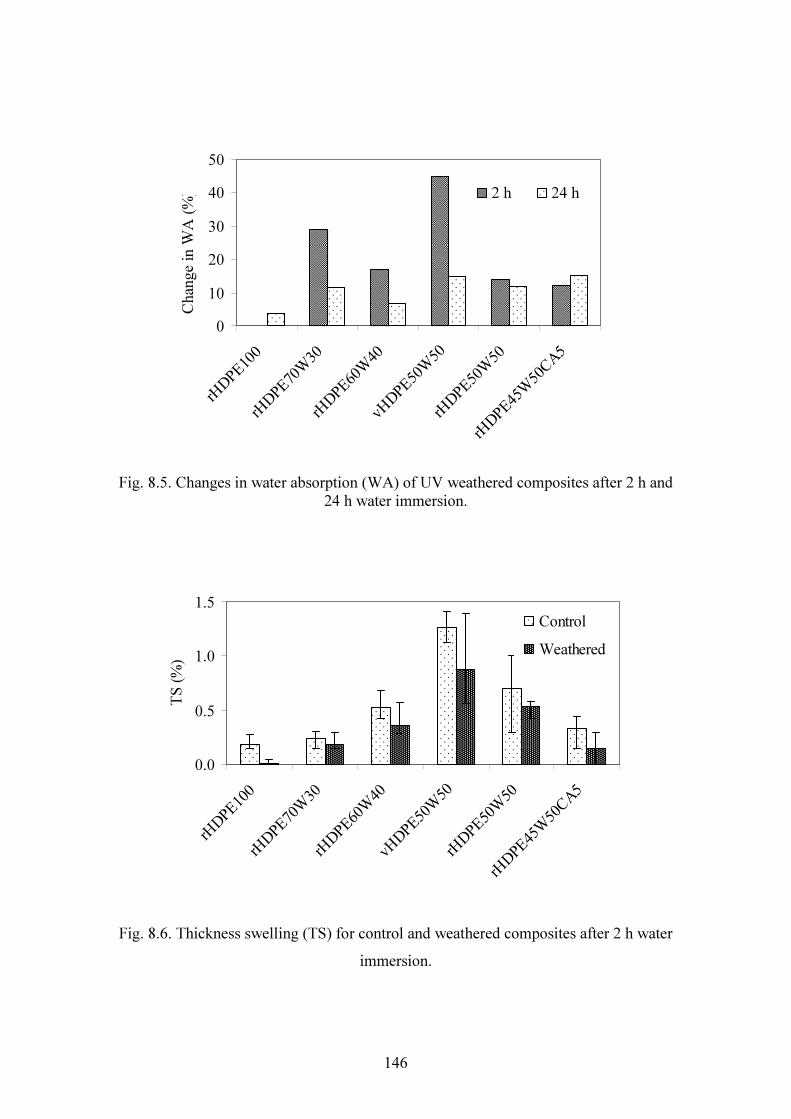
146
0
10
20
30
40
50
r HD PE 10 0
r HD PE 70 W
3 0
r HD PE 60 W
4 0
v HD PE 50 W
5 0
r HD PE 50 W
5 0
r HD PE 45 W
5 0 CA 5
Chan
ge in
WA
(%) 2 h 24 h
Fig. 8.5. Changes in water absorption (WA) of UV weathered composites after 2 h and
24 h water immersion.
0.0
0.5
1.0
1.5
r HD PE 10 0
r HD PE 70 W
3 0
r HD PE 60 W
4 0
v HD PE 50 W
5 0
r HD PE 50 W
5 0
r HD PE 45 W
5 0 CA 5
TS (%
)
ControlWeathered
Fig. 8.6. Thickness swelling (TS) for control and weathered composites after 2 h water
immersion.
147
0
1
2
3
4
r HD PE 10 0
r HD PE 70 W
3 0
r HD PE 60 W
4 0
v HD PE 50 W
5 0
r HD PE 50 W
5 0
r HD PE 45 W
5 0 CA 5
TS (%
)
ControlWeathered
Fig. 8.7. Thickness swelling (TS) for control and weathered composites after 24 h water immersion.
The impact of the UV weathering of the composites on the thickness swelling (after 2 h and 24 h of water immersion) was similar for all of the composite formulations. Interestingly, MAPP containing composites did not exhibit significant improvement to the thickness swelling in the water immersion. Strong hydrophilicity of the cellulose and hemicellulose of wood material are the main cause of water absorption and swelling of WPCs. Under humid conditions, the hydroxyl groups and carboxyl groups contained in the cellulose and the hemicellulose had tendency to interact with water molecules via hydrogen bonding. Also the weathering increased the wettability of the wood component by reducing the water repellent effect of extractives, degrading the hydrophobic lignin component and exposing the cellulose-rich wood component at the composite surface layer [24]. The increased hydroxyl groups from the exposed cellulose then promoted the water absorption and the thickness swelling of the composites. Although the HDPE matrix penetrated to the wood pores and voids in the wood-plastic interface during the compounding and hot moulding, this penetration was limited due to the non-polar nature and low viscosity of the plastic (HDPE). Therefore, under water immersion, the water molecules resided in the unfilled pores and voids in the composites. The lower thickness swelling after 2 h compared to 24 h water immersion was due to the increased ability to accommodate swelling of cell wall of wood

148
component in the voids and cracks at the interface. It is obvious that wood fibre was accessible only after the pores filled with water. Consequently after prolong immersion; more water was absorbed by the cellulose, which resulted in increased wood swelling. While MAPP coupling improved the interface bonding between the wood fibres and the matrix by establishing bonds between the hydroxyl groups of the wood filler and functional groups present in MAPP. This prevented interaction of the cellulose filler with water, and hence limited the water absorption. Furthermore, the composite containing 3 wt. % MAPP (not shown in the figures) exhibited better effect on the water absorption behaviour than the composites with 5 wt. % MAPP, which was probably due to complete bonding of the MAPP to the cellulose fibres. From the experiment results, it was also found that with the same formulation (50 wt. % HDPE and 50 wt. % wood), the vHDPE based composites absorbed more water and had higher thickness swelling than the rHDPE based composites. This was true for both the control and the UV weathered samples. This difference was likely to be due to the impurity and early processing of the recycled plastics. 8.3.3 Flexural properties Fig.8.8. shows the results of flexural strength (MOR) of UV weathered composites (after 2000 h) and the corresponding control samples. MOR of control composites increased with decreasing of the wood content. With UV weathering, a slight decrease in MOR was observed for most of the composites, however, the neat HDPE sample did not show apparent change with UV weathering. The addition of MAPP (5 wt. %) improved the flexural properties and reduced the degradation after weathering compared to those without the coupling agent. For example, the MOR loss was reduced from 6.5 to 1.6 % with the coupling agent (MAPP) in the composite containing 50 wt. % wood flour with rHDPE matrix. For the same wood content (50 wt. %), the MOR values of the rHDPE based composites were greater than those of the vHDPE based composites, and this was true both for the control and for UV weathered samples.
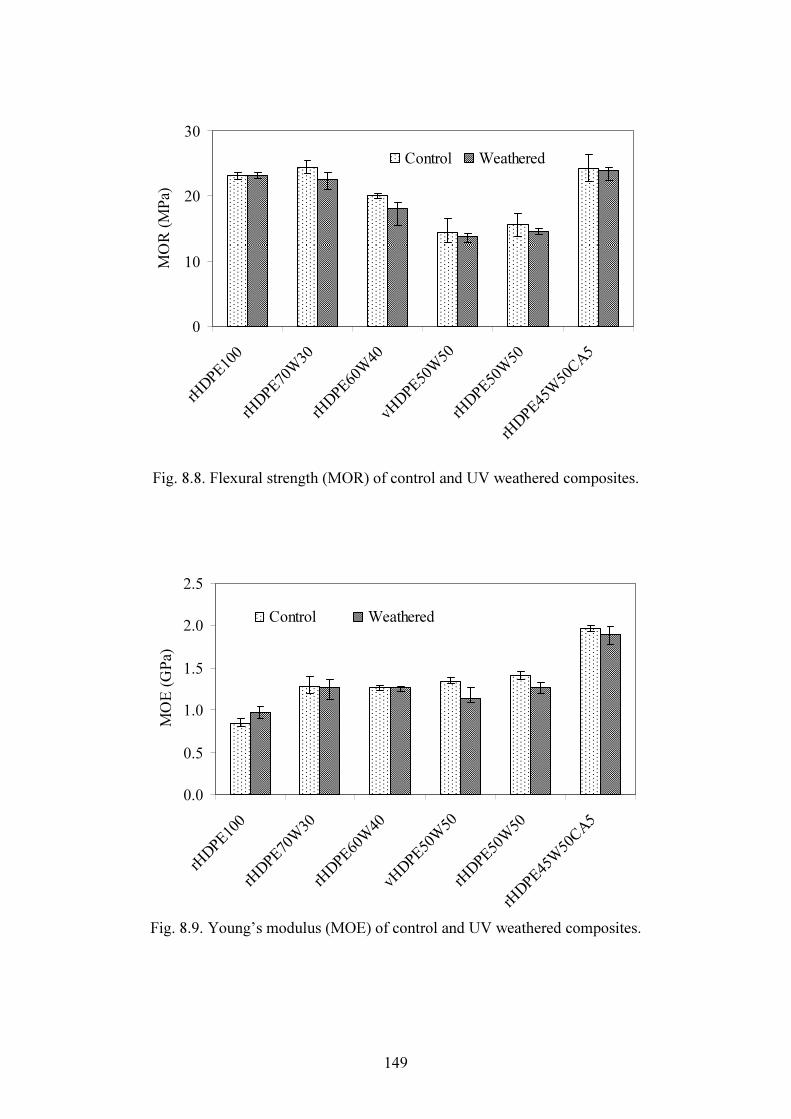
149
0
10
20
30
r HD PE 10 0
r HD PE 70 W
3 0
r HD PE 60 W
4 0
v HD PE 50 W
5 0
r HD PE 50 W
5 0
r HD PE 45 W
5 0 CA 5
MOR
(MPa
)Control Weathered
Fig. 8.8. Flexural strength (MOR) of control and UV weathered composites.
0.0
0.5
1.0
1.5
2.0
2.5
r HD PE 10 0
r HD PE 70 W
3 0
r HD PE 60 W
4 0
v HD PE 50 W
5 0
r HD PE 50 W
5 0
r HD PE 45 W
5 0 CA 5
MOE (
GPa)
Control Weathered
Fig. 8.9. Young’s modulus (MOE) of control and UV weathered composites.

150
0
5
10
15
r HD PE 10 0
r HD PE 70 W
3 0
r HD PE 60 W
4 0
v HD PE 50 W
5 0
r HD PE 50 W
5 0
r HD PE 45 W
5 0 CA 5
Yield
stress
(MPa
) Control Weathered
Fig. 8.10. Yield stress of control and UV weathered composites.
0
3
6
9
r HD PE 10 0
r HD PE 70 W
3 0
r HD PE 60 W
4 0
v HD PE 50 W
5 0
r HD PE 50 W
5 0
r HD PE 45 W
5 0 CA 5
Elong
ation a
t brea
k (%)
Control Weathered
Fig. 8.11. Elongation at break for control and UV weathered composites.

151
From the results, it was found that the changes in the Young’s modulus (MOE) had similar trend to the MOR, which decreased after UV weathering and decreased with increasing of the wood content (Fig. 8.9). With the 2000 h of UV weathering, the MOE was decreased by 14.8 and 10.2 %, respectively, for the vHDPE and rHDPE based composites with 50 wt. % wood flour content, however, the neat rHDPE sample showed an increase in the MOE by 14.7%. The MAPP coupled composites exhibited less decrease in the MOE when compared to composites without the MAPP. For example, for the composite with 50 wt. % wood content, the MOE was reduced by 3.7% (compared to 10.2% without MAPP) with addition of 5 wt. % MAPP. It was observed that the MOE degradation after weathering was variable with the composite formulation, with some formulations showing no significant change. The results also demonstrated a decrease in the yield stress (Fig. 8.10) and an increase in the elongation at break (Fig. 8.11) with the UV weathering. The loss in yield strength was 29.5% for the rHDPE based composite with 50 wt. % wood flour content. The mechanical property changes of WPCs with UV weathering could be reflected by the corresponding colour changes. The composite surface with greater colour change indicated that the surface layers had absorbed more UV light energy and these layers acted as a protective role to prevent deeper penetration of UV light. The degradation of the surface layers resulted in property reduction of the composite as a whole. From the experiments, it was found that the degradation in the flexural properties was comparable between the vHDPE based composites and the rHDPE based composites for the same wood content. However, for the rHDPE based composites, MOE degradation was less significant as compared to the degradation in MOR. On the other hand, the vHDPE based composites exhibited more MOE loss than MOR. For all of the formulations, MOE degradation was increased with increase in the wood filler loading. This can be explained by the fact that composites with higher wood content exposed more wood at the surface, which provided more pathways for the moisture penetration into the composite, becoming more susceptible to MOE loss. With coupling agent, the bonding between the wood filler and the polymer matrix was enhanced and the water penetration into the composite interface was restricted during weathering, hence, MAPP coupled composites showed more resistance to flexural property degradation. In addition, the
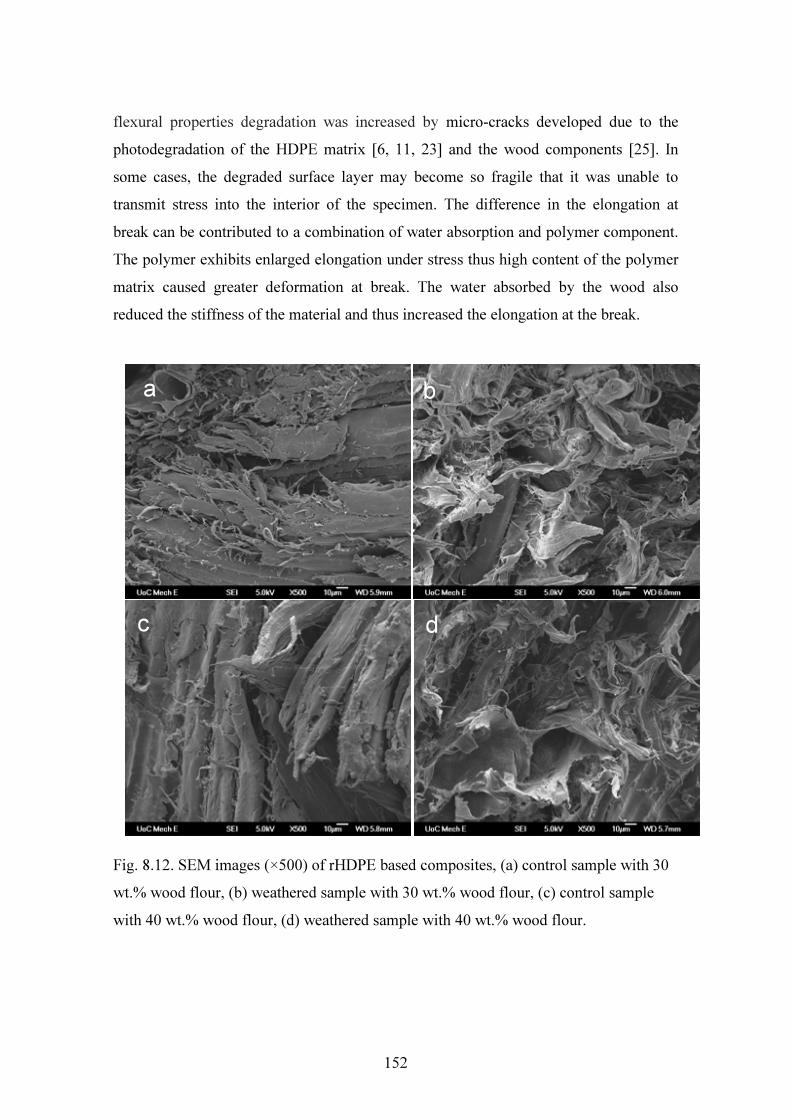
152
flexural properties degradation was increased by micro-cracks developed due to the photodegradation of the HDPE matrix [6, 11, 23] and the wood components [25]. In some cases, the degraded surface layer may become so fragile that it was unable to transmit stress into the interior of the specimen. The difference in the elongation at break can be contributed to a combination of water absorption and polymer component. The polymer exhibits enlarged elongation under stress thus high content of the polymer matrix caused greater deformation at break. The water absorbed by the wood also reduced the stiffness of the material and thus increased the elongation at the break.
Fig. 8.12. SEM images (×500) of rHDPE based composites, (a) control sample with 30 wt.% wood flour, (b) weathered sample with 30 wt.% wood flour, (c) control sample with 40 wt.% wood flour, (d) weathered sample with 40 wt.% wood flour.
a b
c d

153
Fig. 8.13. SEM images (×500) of HDPE based composites with 50 wt. % wood flour, (a) control sample based on vHDPE, (b) weathered sample based on vHDPE, (c) control sample based on rHDPE, (d) weathered sample based on rHDPE. 8.3.4 Microstructure characterization The microstructure of the fracture surfaces of UV weathered composites was compared with the control samples as shown in Figs. 8.12 to 8.15. Fig. (a) to Fig. 8.12 (d) show the SEM images of fracture surfaces of the control and weathered samples made of rHDPE matrix with wood flour loadings at 30 and 40 wt. %, respectively. The control sample with 30 wt. % wood flour as shown in Fig.8.12 (a) exhibited a considerable amount of fractured matrix and fibres, leaving a relatively smooth surface. The fracture surfaces of the weathered sample exhibited fibre pullout, indicating that interfacial bonding was lowered by the weathering. This supports the notion that the degradation due to weathering affected the interfacial regions in WPCs (Fig. 8.12b).
a b
c d

154
Similar failure surfaces were observed for the control (Fig. 8.12c) and weathered composites (Fig. 8.12d) made from 40 wt. % wood flour with recycled HDPE matrix. Fig. 8.13 illustrates the SEM images of fracture surfaces of the control and the weathered composites made from 50 wt. % wood flour with recycled and virgin HDPE matrix. For the control sample of vHDPE based composite (Fig. 8.13a) and rHDPE based composite 13(c), a considerable amount of matrix breakage and fibre tearing-off was observed with very little intact material on the surface. This indicates good interface bonding between the wood fibre and polymer matrix. Conversely, with UV weathering, the interface bond was degraded with intact fibres being completely separated and pulled out from the matrix as seen from Fig. 8.13(b) and Fig. 8.13(d). This also supports the belief that degradation due to UV weathering weakened the interface bonding with some fibres being pulled out and thus adversely affected the properties of the WPCs.
Fig. 8.14. SEM images (×500) of rHDPE based composites with 50 wt. % wood flour and 5 wt. % MAPP, (a) control sample, (b) weathered sample. The control sample of MAPP coupled composite showed both brittle fibre and matrix fracture with a lack of fibre pullout (Fig. 8.14a), indicating an improved interface bonding and composite mechanical properties for the control sample. In contrast, the UV weathered MAPP coupled sample failed in more ductile manner, exhibiting cavity formation and fibre being pulled out (Fig. 8.14b). This form of failure indicates that the UV weathering had decreased the interfacial strength in the MAPP coupled composite.
a b

155
The weakening of the interfacial bonding was due to the degradation of the cellulose, lignin and hemicellulose in the wood component, and the increased concentration of chromophoric groups because of photo-degradation of the HDPE matrix in the presence of water. Further work is required to elucidate the exact mechanisms and relative contribution for interfacial degradation observed in weathered composite. 3.3.5 Thermal properties 3.3.5.1 Melting enthalpy and temperature Melting temperature (Tm) of the composite samples were obtained from the second heating curves in the DSC scanning as shown in Fig. 8.15. The samples include both control and corresponding weathered neat rHDPE composite and HDPE based composites. From the second heating curves, a single endothermic melting peak was observed for all of the samples, which was actually a characteristic of semi-crystalline polymer. The melting peak occurred (melting temperature, Tm) at 130.9°C for the neat rHDPE control sample, while it varied from 130.6 to 131.0°C for other rHDPE based control composites. However, the composites made of vHDPE had a single melting peak of 131.9 °C. With UV weathering, all of the rHDPE composite samples showed similar melting thermograms with slight decrease in the peak melting temperatures. Melting enthalpy (∆Hm), crystallization enthalpy (∆Hc) and crystallization temperature (Tc) were determined from the second heating and cooling scans, respectively, and were corrected by the weight ratio of the HDPE content in the composites (Table 8.3). The melting enthalpy of the rHDPE based composite was the highest (179.5 J/g), which was decreased with the addition of wood flour, indicating the decreased thermal stability of the composites [20]. However, the MAPP coupled composite showed a slight increase in both the melting enthalpy and the crystallization enthalpy. From Table 8.3, it was observed that by including 30 wt. % to the rHDPE, the melting enthalpy (∆Hm) of the composite dropped from 179.5 J/g to 159.0 J/g in the control samples. With the UV weathering, the ∆Hm of the neat rHDPE was reduced by 12.0 J/g. The trend of decrease in ∆Hm with UV weathering has been observed for all other composites based on both virgin and recycled HDPE with only one exception for rHDPE60W40, for which it was increased from the control value of 143.4 J/g to 179.8 J/g after the weathering. The exact reason for this opposite trend is unclear.

156
Fig. 8.15. DSC second heating curves for control and UV weathered composites.
Fig. 8.16. DSC cooling curves for the control and the UV weathered composites.
80 100 120 140 160 180Temperature (oC)
Heat
flow
exo u
p.
rHDPE100 rHDPE70W30rHDPE60W40 vHDPE50W50rHDPE50W50 rHDPE45W50CA5UV-rHDPE100 UV-rHDPE70W30UV-rHDPE60W40 UV-vHDPE50W50UV-rHDPE50W50 UV-rHDPE45W50CA5
80 100 120 140 160 180Temperature (oC)
endo
dowe
, hea
t flow
rHDPE100 rHDPE70W30rHDPE60W40 vHDPE50W50rHDPE50W50 rHDPE45W50CA5UV-rHDPE100 UV-rHDPE70W30UV-rHDPE60W40 UV-vHDPE50W50UV-rHDPE50W50 UV-rHDPE45W50CA5
157
The UV weathered samples did not exhibit noticeable change in the Tm for all the composite formulations compared to corresponding control samples. There was no distinct difference either between the non-coupled and the MAPP coupled composites after weathering. 3.3.5.2 Crystallization temperature and crystallinity The crystallization properties, including the peak crystallization temperature (Tc) and the crystallinity (Xc), of the HDPE based composites were calculated from the first cooling thermograms (Fig. 8.16). The peak crystallization temperature of the control rHDPE composites did not show noticeable change with wood flour loadings and addition of coupling agent (Table 8.3). For the control samples, the Xc of the non-coupled control composite samples was lower than that of the neat rHDPE. The Xc values for the entirely rHDPE and vHDPE control samples was 59 and 65.4 %, respectively (Table 6.4). These values decreased to 58.4 and 56.2 % with the incorporation of 50 wt. % wood flour in the composite formulation of rHDPE and vHDPE matrix. However, with the incorporation of 3 wt. % MAPP in the formulation the Xc was increased from 58.4 to 72.8% in the rHDPE50W50 formulation. The high Xc value for MAPP coupled composite may be due to chain branching of the maleaic anhydride and better coupling effect of the MAPP, which extended the predominance of the crystallization process [26]. The Xc values for the wood flour-HDPE composites were lower than that of neat rHDPE sample. The addition of wood flour to HDPE matrix changes the crystallinity of HDPE. The crystallinity of HDPE in the control sample was higher for neat HDPE sample than for composites. Although wood flour can act as a nucleating site for crystallization, it has been found to physically hinder crystal growth at the higher fiber loading and , begins to hinder the molecular motion of HDPE resulting in lower polymer crystallinity, which is consistent with pervious study by Stark et al. [27]. However, in case of rHDPE based composite, decrease in Xc was lower as compared to the vHDPE based composite. This is possibly due to the better surface wetting in case of rHDPE matrix composite because of chemical impurities. With UV weathering, the Xc values were decreased by up to 3.8% for most of the samples. However, the rHDPE60W40 composite showed an increase by 7.4% and the

158
MAPP coupled composite showed a substantial decrease by 19.4% from 63.8% to 44.4%. The decrease in the Xc in the composites is presumably caused by the increased defect content of the reclaimed molecules being more influential than the molecular size reduction [28]. In addition, the prolonged UV exposure induced progressive reduction of the molecular weight, increasing chemical irregularities in the chain and generation of the impurity groups (such as carbonyls). These changes prevented further crystallization and resulted in decrease in the crystallinity of the photodegraded HDPE [29]. The inconsistent Xc changes for the wood flour-HDPE composites is believed to be caused by complicated degradation mechanism such as chain scission, cross linking and formation of bulkier groups (for example, carbonyl and peroxide) [29, 30]. The changes were also affected by the polymer content and quality at the exposed surfaces. The inconsistent variation in Xc was also observed by Carrasco et al. [31] by examined the UV aging of HDPE. It was interesting to note that the crystallisation temperature (Tc) were stable at a value of 121±1°C for all of the composite samples both at control and with the UV weathering. This was also true for the crystallization temperature at onset (Tconset) with values of 123±1°C. 8.4 Conclusions The performance examined includes the mechanical property change, composite surface colour changes, water absorption and thickness swelling. In addition, microstructure and thermal properties were also investigated to get in-depth understanding of the composite performances with UV weathering. The influence of wood content, addition of coupling agent (MAPP) and UV exposure time had also been studied. The results from this study had confirmed that the composites made of both virgin and the recycled HDPE had comparable stability and durability performance with the UV weathering. The main observations drawn from this study are summarised as follows:
6. In the 2 h and 24 h water immersion, water absorption and thickness swelling of the UV weathered composites were increased compared to those of the corresponding control samples. The MAPP addition to the composites did not significantly reduce the water absorption with the UV weathering although the values for the MAPP coupled composites tended to be lower than the non-coupled composites at the same wood content.
159
7. Flexural strength (MOR) and Young’s modulus (MOE) of the weathered composites were decreased while the elongation at break was increased irrespective of composite formulations. However, the MAPP coupled weathered composite showed lower degradation of MOR and MOE by 75% and 64%, respectively, as compared to non-coupled composite.
8. Examination of the SEM images of the fractured surfaces confirmed the decrease in interface bonding between the wood flour and the HDPE matrix. Fibre pullout was observed in the weathered composites, while the fibre fracture was dominant in the control samples. These observations can explain the property variations with different composite formulations and the property changes with the UV weathering.
9. The HDPE based composites experienced overall colour changes with UV weathering, mainly due to the surface lightening (∆L*). The colour change increased with the UV exposure time for all composite formulations. MAPP coupled composite however exhibited a less colour change as compared to the non-coupled composites.
10. The Xc of the weathered neat HDPE sample was decreased by 6.4%, while the HDPE composites showed a decrease both for the non-coupled and coupled composites irrespective with virgin or recycled PP with weathering. However, the Xc was increased by 1.1% for recycled HDPE based composite with 30 wt. % wood flour, which is within experimental error. The MAPP coupled (5 wt. %) composite exhibited greater reductions in Xc by 30% after weathering.

160
Table 8.3 Thermal properties of control and UV weathered HDPE based composites. Control samples UV-weathered samples
Composite sample code ∆Hm
(J/g) ∆Hc (J/g) Xc % Tm peak
(oC) Tc peak (oC)
Tconset (oC)
∆Hm (J/g)
∆Hc (J/g) Xc % Tm peak
(oC) Tc peak (oC)
Tconset (oC)
rHDPE100 179.5 172.8 59.0 130.9 121.3 123.2 167.5 161.7 55.2 130.8 121.4 123.2 rHDPE70W30 159.0 153.3 52.3 131.0 121.3 123.1 157.0 154.9 52.9 131.0 121.3 123.1 rHDPE60W40 143.4 148.3 50.6 130.6 121.2 122.5 179.8 169.8 58.0 130.8 121.3 122.6 vHDPE50W50 167.2 164.5 56.2 131.9 121.3 123.4 164.5 156.1 53.3 131.6 121.6 123.2 rHDPE50W50 178.7 171.1 58.4 130.9 121.3 123.2 158.0 161.3 55.0 130.7 121.0 122.6 rHDPE45W50CA5 180.2 186.9 63.8 130.9 121.1 122.9 138.7 144.7 44.4 130.7 120.9 122.4 Note: In the table, ∆Hm is the melting enthalpy, ∆Hc is the crystallization enthalpy, Xc is the crystallinity, Tm is the peak melting temperature, Tc and Tconset are the crystallization temperature at peak and onset, respectively.
161
8.5 References [1] Marcovich NE, Reboredo MM, Aranguren MI. Dependence of the mechanical
properties of wood flour-polymer composites on the moisture content. Journal of Applied Polymer Science 1998;68:2069-76.
[2] Lin Q, Zhou X, Dai G. Effect of hydrothermal environment on moisture absorption and mechanical properties of wood flour–filled polypropylene composites. Journal of Applied Polymer Science 2002;85:2824–32
[3] Pandey KK. Study of the effect of photo-irradiation on the surface chemistry of wood. Polymer Degradation and Stability 2005;90:9-20.
[4] Cui W, Kamdem DP, Rypstra T. Diffuse reflectance infrared fourier transform spectroscopy (DRIFT) and colour changes of artificial weathering wood. Wood and Fibre Science 2004;36(3):291-301.
[5] Pastore T C M, Santos KO, Rubim JC. A spectrocolorimetric study on the effect of ultraviolet irradiation of four tropical hardwoods. Bioresource Technology 2004;93:37-42.
[6] Gulmine JV, Janissek PR, Heise HM, Akcelrud L. Degradation profile of polyethylene after artificial accelerated weathering. Polymer Degradation and Stability 2003;79:385-97.
[7] Gijsman P, Meijers G, Vitarelli G. Comparison of the UV-degradation chemistry of polypropylene, polyethylene, polyamide 6 and polybutylene terephthalate. Polymer Degradation and Stability 1999;65(3):433-41.
[8] Douglas P, Murphy WR, Billham M, McNally GM. Effect of coupling agents and weathering on the mechanical properties of wood-polymer composites. Developments in Chemical Engineering and Mineral Processing 2004;12(1-2):129-40.
[9] Li R. Environmental degradation of wood-HDPE composite. Polymer Degradation and Stability 2000;70(2):135-45.
[10] Lundin T, Cramer SM, Falk RH, and Felton C. Accelerated weathering of natural fibre-filled polyethylene composites. Journal of Materials in Civil Engineering 2004;16(6):547-55.

162
[11] Stark NM, Matauna LM. Surface chemistry changes of weathered HDPE/wood-flour composites studied by XPS and FTIR spectroscopy. Polymer Degradation and Stability 2004;86:1-9.
[12] Stark NM, Matauna LM. Influence of photostabilizers on wood flour-HDPE composites exposed to xenon-arc radiation with and without water spray. Polymer Degradation and Stability 2006;91:3048-56.
[13] Pendleton DE, Hoffard TA, Adcock T, Woodward B, Wolcott MP. Durability of an extruded HDPE/wood composite. Forest Products Journal 2002;52(6):21-27.
[14] Stark NM, Matauna LM, Clemons CM. Effect of processing method on surface and weathering characteristics of wood-flour/HDPE composites. Journal of Applied Polymer Science 2004;93:1021-30.
[15] Stark NM, Matauna LM. Ultraviolet weathering of photostabilised wood-flour filled high-density polyethylene composites. Journal of Applied Polymer Science 2003;90:2609-17.
[16] Falk RH, Lundin T, and Felton C. The effects of weathering on wood-thermoplastic composites intended for outdoor application. In: Durability and disaster mitigation in wood-frame housing; 2000; Madison, Wisconsin, USA: Forest Products Society; 2000. p. 175-79.
[17] Clemons C. Wood-plastics composites in the United States: The interfacing of two industries. Forest Product Journal 2002;52(6).
[18] ASTM D 4329-99 Standard practice for fluorescent UV exposure of plastics. Annual book of American Society for Testing and Materials Standards. West Conshohocken, PA. 2002.
[19] Ehrenstein GW, Trawiel R. Thermal analysis of plastics: theory and practice: Carl Hanser Verlag, Munich, 2004.
[20] Stark NM. Effect of weathering cycle and manufacturing method on performance of wood flour and high-density polyethylene composites. Journal of Applied Polymer Science 2006;100(4):3131-40.
[21] Hon DNS, Chang ST, Feist W C. Weathering characteristics of hardwood surfaces. Wood Science and Technology 1986;20:169-83.
[22] Chang ST, Hon DNS, Feist WC. Photodegradation and photoprotection of wood surfaces. Wood and Fibre 1982;14(2):104-17.

163
[23] Valadez-Gonzalez A, Cervantes-UC JM, Veleva L. Mineral filler influence on the photo-oxidation of high-density polyethylene: I. Accelerated UV chamber exposure test. Polymer Degradation and Stability 1999;63:253-60.
[24] Colom X, Carrillo F, Nogues F, Garriga P. Structural analysis of photodegraded wood by means of FTIR spectroscopy. polymer Degradation and Stability 2003;80:543–49.
[25] Kalnins MA, Feist WC. Increase in wettability of wood with weathering. Forest Product Journal 1993;43(2):55-57.
[26] Doh GH, Lee SY, Kang IA, Kong YT. Thermal behaviour of liquefied wood polymer composites (LWPC). Composites Structures 2005;68:103-08.
[27] Kim HS, Lee BH, Choi SW, Kim S, Kim HJ. The effect of types of maleic anhydride-grafted polypropylene (MAPP) on the interfacial adhesion properties of bio-flour-filled polypropylene composites. Composites Part A: Applied Science and Manufacturing 2007;38:1473-82.
[28] Stark NM, Matuana M. Surface chemistry and mechanical property changes of wood-flour/High-density-polyethylene composites after accelerated weathering. Journal of Applied Polymer Science 2004;94:2263-73.
[29] Craig IH, White JR, Phua CK. Crystallization and chemi-crystallization of recycled photo-degraded polypropylene. Polymer 2005;46:505-12.
[30] Rabello MS. and White JR. Crystallization and melting behaviour of photodegraded polyproopylene-I. Chemi-crystallization. Polymer 1997;38(26):6379-87.
[31] Carrasco F, Pages P, Pascual S, Colom X. Artificial aging of high-density polyethylene by ultraviolet irradiation. European Polymer Journal 2001;37:1457-64.

164
CHAPTER 9 DIMENSIONAL STABILITY, MECHANICAL AND THERMAL
PROPERTIES OF NANOCLAY BASED WOOD FLOUR-RECYCLED HDPE NANOCOMPOSITES
Abstract This study was aimed to identify the best approach of incorporating nanoclay into wood-plastic composites (WPCs) to enhance their overall properties. Recycled high-density polyethylene (rHDPE) based nanocomposites were made by both direct dry and melt compounding methods. Effects of the processing methods, coupling agent content, nanoclay content and nanoclay type on dimensional stability, flexural properties and thermal properties were investigated. Incorporation of 1 wt. % nanoclay and 5 wt. % maleated polyethylene (MAPE) coupling agent, did not reduce the water absorption and thickness swelling of the nanocomposites. However, with increasing nanoclay content to 5 wt. % showed significant reduction in water absorption and thickness swelling. Flexural strength and stiffness of nanocomposite processed by the melt-blending were increased by 27% and 31% with the addition of both MAPE and nanoclay (5 wt. % each) as compared to corresponding nanocomposite made by dry blending. Furthermore, adding 2 wt. % MAPE in the second compounding with melt blending further increased the flexural properties. With the SEM imaging, traces of nanoclay on the nanocomposite surfaces had been detected which did not show large-scale nanoclay particle agglomeration. Crystallinity (Xc) of the neat rHDPE was increased by 9.4% with an addition of 5 wt. % nanoclay, while Xc was reduced by 3.5% with an addition of 5 wt. % MAPE. From the results, it was found that dimensional stability and flexural properties of the recycled HDPE/wood flour composites could be significantly improved with an appropriate combination of MAPE coupling agent and nanoclay contents by processing through melt blending. 9.1 Introduction Although WPCs are commercialised with expanding markets, they have limited use for structural applications due to lower mechanical properties (flexural strength and

165
stiffness) as compared to solid wood lumber [1]. The improvement in the mechanical properties of WPCs could expand their market share in the structural applications. This may be achieved, firstly, by using high performance thermoplastic such as poly(phenylene-ether) (PPE) as a matrix due to its greater strength and stiffness as compared to commonly used thermoplastics [2]. However, processing of the wood flour with PPE needs high temperatures (in the range of 280-320oC) which is extremely difficult as this temperature range is far above the thermal degradation temperature of wood. Secondly, WPC properties may be improved by addition of nanoparticles and or coupling agent in the composite formulation. Recently, studies had been conducted to develop the hybrid nanocomposites of nanoclays with thermoplastic matrix processed through different methods [3-6]. Gopakumar et al. [3] reported that melt compounded nanocomposite of montmorillonite clay (Cloisite Na+) and HDPE or maleic anhydride grafted HDPE shows a significant reduction in the crystallinity and modest increase in Young’s Modulus. Lei et al. [5] examined mechanical properties of hybrid nanocomposites made from recycled HDPE (rHDPE) and organic clay through melt blending. It was reported that adding 5 wt. % MAPE coupling agent achieved about 44% increase in impact strength for the rHDPE-clay hybrid with improved compatibilization. Kato et al. [7] reported that the tensile strength of the melt compounded maleated PE/clay nanocomposites increased with clay loading from 102 MPa for neat PE to 157 MPa for PE/clay nanocomposites with 3 wt. % clay. Separate studies by Hasegawa et al. [8] and Kato et al. [7] observed that neat PE did not exfoliate clay under any conditions, however, with MAPE the PE exfoliated the clay readily and thus improved the tensile strength and Young’s Modulus with the latter increasing with clay content. Wang et al. [9] investigated the MAPE-clay composites and found that the nanoclay was completely exfoliated in the MAPE. In addition, MAPE-clay (Cloisite-20A) nanocomposites showed about 33 % improvement in the tensile strength over the pure MAPE matrix sample [10]. From these studies, it becomes clear that the nanoclays along with functionalised polyolefin-coupling agents significantly improved the mechanical, thermal and rheological properties of thermoplastics. Therefore, it could be possible to incorporate the nanoclays along with the coupling agents to improve the mechanical properties of the WPCs.
166
Recently, some studies were conducted to investigate the influence of nanoclays on mechanical properties of the wood flour-thermoplastic composites [1, 11, 12]. Faruk et al. [1] incorporated several types of nanoclays in the wood flour-virgin HDPE composites made through both melt and direct dry blending methods. It was reported that the flexural properties of WPCs were significantly improved with proper combination of the coupling agent and nanoclay contents. Lei et al. [11] examined the injection moulded HDPE/wood flour/MAPE and nanoclay (Cloisite-15A) nanocomposites made through the melt compounding. It was found that the flexural and tensile strength of the HDPE/wood/MAPE composites was increased by about 20% with addition of 1 wt. % nanoclay. Zhong et al. [12] had incorporated Cloisite-20A nanoclay into the polyethylene /wood flour composites in the presence of MAPE. It was found that flexural strength was decreased by 24% and Young’s Modulus was increased by 10% with 3 wt. % nanoclay loading. Moreover, the nanoclay particles dispersion in the polymer matrix is important for the composite properties and was affected by the processing method [13]. Several processing methods (melt mixing, extrusion, and compression moulding) can be used for the clay-based nanocomposites. Adhikary et al. [14, 15] demonstrated that WPCs made from the recycled HDPE and PP with the MAPP coupling agent possessed comparable stability and mechanical properties as those made from the corresponding virgin thermoplastics. The incorporation of nanoclays on WPCs made from recycled plastics can be studied in order to understand its influence on the mechanical and stability properties. Hence, the study is needed to investigate the effects of adding nanoclays on WPCs and to examine the differences between the virgin plastics and the recycled plastics in the composites. In this Chapter, the influence of the nanoclays on the mechanical and dimensional stability properties of the rHDPE based WPCs was investigated with respect to the contents of nanoclay, coupling agent, plastic and wood flour in the composite formulations. 9.2 Experimental 9.2.1 Materials Fresh Pinus radiata sawdust was collected from a local supplier (Canterbury Landscape Supplies Ltd., New Zealand), dried and ground into fine flour with particle size ranging from 0.18 to 0.5 mm. Recycled HDPE was obtained from New Zealand Plastics
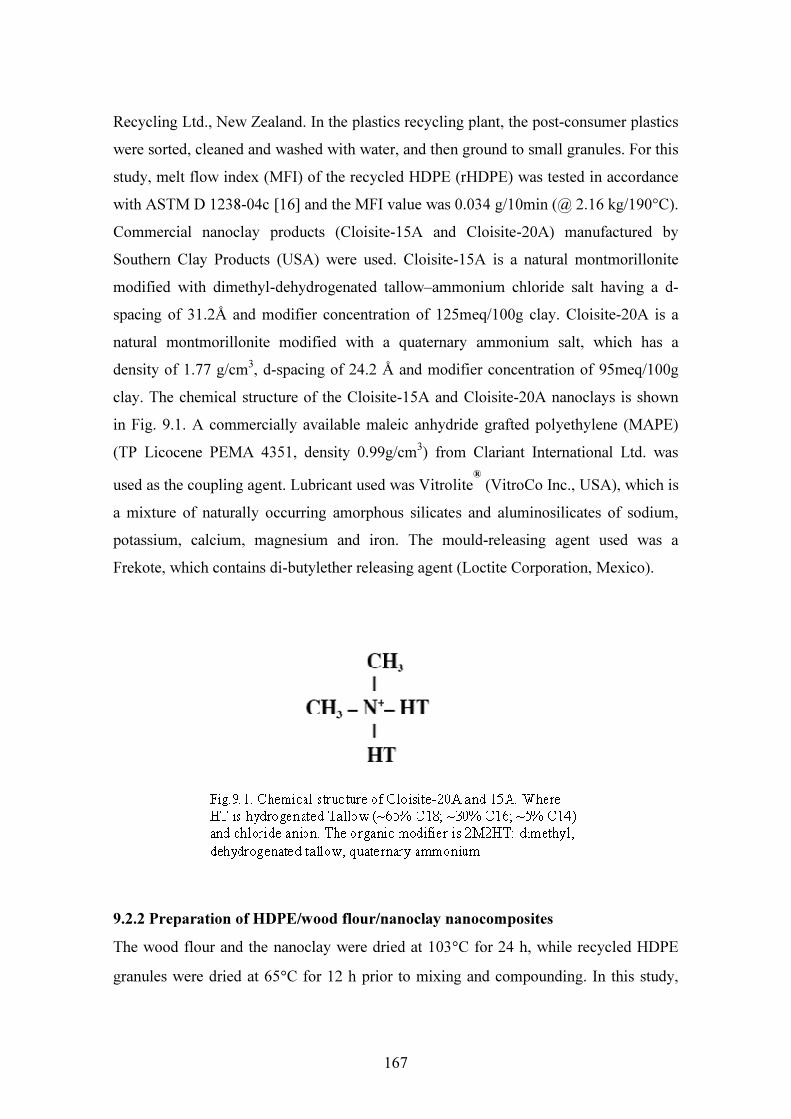
167
Recycling Ltd., New Zealand. In the plastics recycling plant, the post-consumer plastics were sorted, cleaned and washed with water, and then ground to small granules. For this study, melt flow index (MFI) of the recycled HDPE (rHDPE) was tested in accordance with ASTM D 1238-04c [16] and the MFI value was 0.034 g/10min (@ 2.16 kg/190°C). Commercial nanoclay products (Cloisite-15A and Cloisite-20A) manufactured by Southern Clay Products (USA) were used. Cloisite-15A is a natural montmorillonite modified with dimethyl-dehydrogenated tallow–ammonium chloride salt having a d-spacing of 31.2Å and modifier concentration of 125meq/100g clay. Cloisite-20A is a natural montmorillonite modified with a quaternary ammonium salt, which has a density of 1.77 g/cm3, d-spacing of 24.2 Å and modifier concentration of 95meq/100g clay. The chemical structure of the Cloisite-15A and Cloisite-20A nanoclays is shown in Fig. 9.1. A commercially available maleic anhydride grafted polyethylene (MAPE) (TP Licocene PEMA 4351, density 0.99g/cm3) from Clariant International Ltd. was used as the coupling agent. Lubricant used was Vitrolite® (VitroCo Inc., USA), which is a mixture of naturally occurring amorphous silicates and aluminosilicates of sodium, potassium, calcium, magnesium and iron. The mould-releasing agent used was a Frekote, which contains di-butylether releasing agent (Loctite Corporation, Mexico).
9.2.2 Preparation of HDPE/wood flour/nanoclay nanocomposites The wood flour and the nanoclay were dried at 103°C for 24 h, while recycled HDPE granules were dried at 65°C for 12 h prior to mixing and compounding. In this study,

168
only two methods of mixing and compounding were used, namely direct dry blending and melt blending which are describe as follows. 9.2.2.1 Direct dry blending method In direct dry blending method, the rHDPE granules, nanoclay, coupling agent, lubricant and wood flour after drying were mixed before compounding in a conical co-rotating twin-screw extruder (SHJ-20, Nanjing Giant Machinery Co., Ltd.). Firstly, two streams of materials were mixed separately, one stream consisting of rHDPE, coupling agent and nanoclay and the other stream being wood flour and lubricant. After this, the premixed two streams were mixed together manually in the polyethylene bag for 10 min, before feeding to the extruder for compounding. The extruder has the screw diameter of 21.7 mm, and length to diameter (L/D) ratio of 32-40 with a total barrel length being 672 mm. The extruder consisted of four separate temperature-controlled barrel/extruding zones (1, 2, 3, and 4) and die head. Table 9.1 shows the extruder barrel temperature at different extruding zones, the melt pressure, and the screw speed employed for the compounding of the wood flour and rHDPE blends. The screw speed and melt pressure were varied between 145-165 rpm and 30-50 bars, respectively. The extruded strand coming out from the die head was then water-cooled and pelletized. Table 9.1 Extruding parameters for the rHDPE/wood flour/nanoclay nanocomposite.
Temperature (oC ) at different zone Plastic type Die 4 3 2 1
Screw speed (rpm)
Torque (%)
Melt pressure (bar)
Melt temp (oC)
HDPE 190 180 175 170 160 145-165 33-70 30-50 195-197
9.2.2.2 Melt blending method In melt blending method, the rHDPE, coupling agent and nanoclay were firstly mixed for 10 min in a polyethylene bag. Then the mixture was compounded in the conical co-
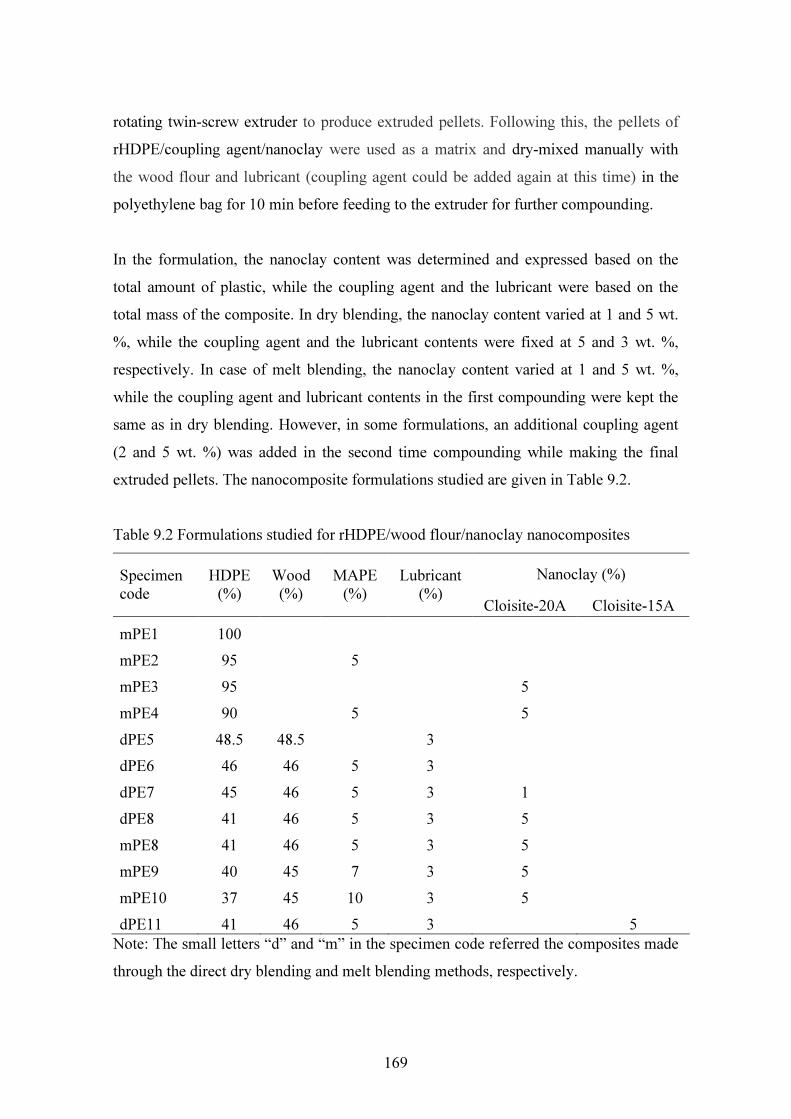
169
rotating twin-screw extruder to produce extruded pellets. Following this, the pellets of rHDPE/coupling agent/nanoclay were used as a matrix and dry-mixed manually with the wood flour and lubricant (coupling agent could be added again at this time) in the polyethylene bag for 10 min before feeding to the extruder for further compounding. In the formulation, the nanoclay content was determined and expressed based on the total amount of plastic, while the coupling agent and the lubricant were based on the total mass of the composite. In dry blending, the nanoclay content varied at 1 and 5 wt. %, while the coupling agent and the lubricant contents were fixed at 5 and 3 wt. %, respectively. In case of melt blending, the nanoclay content varied at 1 and 5 wt. %, while the coupling agent and lubricant contents in the first compounding were kept the same as in dry blending. However, in some formulations, an additional coupling agent (2 and 5 wt. %) was added in the second time compounding while making the final extruded pellets. The nanocomposite formulations studied are given in Table 9.2. Table 9.2 Formulations studied for rHDPE/wood flour/nanoclay nanocomposites
Nanoclay (%) Specimen code
HDPE (%)
Wood (%)
MAPE (%)
Lubricant (%) Cloisite-20A Cloisite-15A
mPE1 100 mPE2 95 5 mPE3 95 5 mPE4 90 5 5 dPE5 48.5 48.5 3 dPE6 46 46 5 3 dPE7 45 46 5 3 1 dPE8 41 46 5 3 5 mPE8 41 46 5 3 5 mPE9 40 45 7 3 5 mPE10 37 45 10 3 5 dPE11 41 46 5 3 5
Note: The small letters “d” and “m” in the specimen code referred the composites made through the direct dry blending and melt blending methods, respectively.
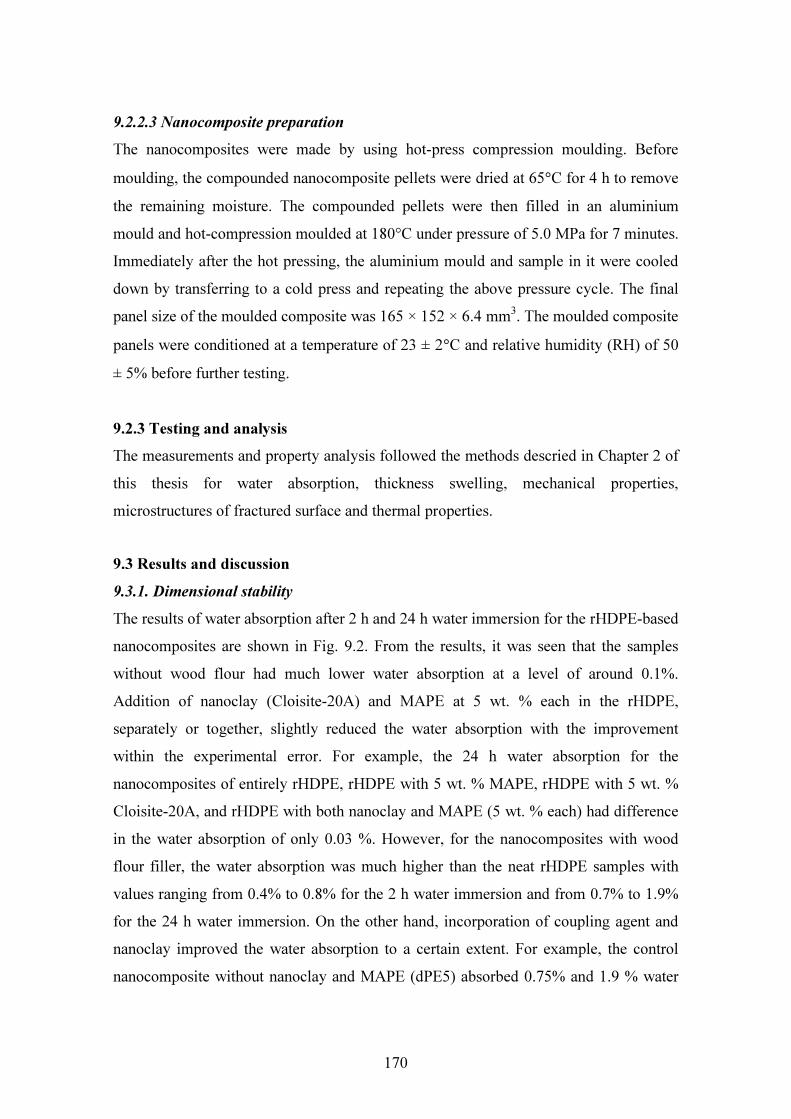
170
9.2.2.3 Nanocomposite preparation The nanocomposites were made by using hot-press compression moulding. Before moulding, the compounded nanocomposite pellets were dried at 65°C for 4 h to remove the remaining moisture. The compounded pellets were then filled in an aluminium mould and hot-compression moulded at 180°C under pressure of 5.0 MPa for 7 minutes. Immediately after the hot pressing, the aluminium mould and sample in it were cooled down by transferring to a cold press and repeating the above pressure cycle. The final panel size of the moulded composite was 165 × 152 × 6.4 mm3. The moulded composite panels were conditioned at a temperature of 23 ± 2°C and relative humidity (RH) of 50 ± 5% before further testing. 9.2.3 Testing and analysis The measurements and property analysis followed the methods descried in Chapter 2 of this thesis for water absorption, thickness swelling, mechanical properties, microstructures of fractured surface and thermal properties.
9.3 Results and discussion 9.3.1. Dimensional stability The results of water absorption after 2 h and 24 h water immersion for the rHDPE-based nanocomposites are shown in Fig. 9.2. From the results, it was seen that the samples without wood flour had much lower water absorption at a level of around 0.1%. Addition of nanoclay (Cloisite-20A) and MAPE at 5 wt. % each in the rHDPE, separately or together, slightly reduced the water absorption with the improvement within the experimental error. For example, the 24 h water absorption for the nanocomposites of entirely rHDPE, rHDPE with 5 wt. % MAPE, rHDPE with 5 wt. % Cloisite-20A, and rHDPE with both nanoclay and MAPE (5 wt. % each) had difference in the water absorption of only 0.03 %. However, for the nanocomposites with wood flour filler, the water absorption was much higher than the neat rHDPE samples with values ranging from 0.4% to 0.8% for the 2 h water immersion and from 0.7% to 1.9% for the 24 h water immersion. On the other hand, incorporation of coupling agent and nanoclay improved the water absorption to a certain extent. For example, the control nanocomposite without nanoclay and MAPE (dPE5) absorbed 0.75% and 1.9 % water
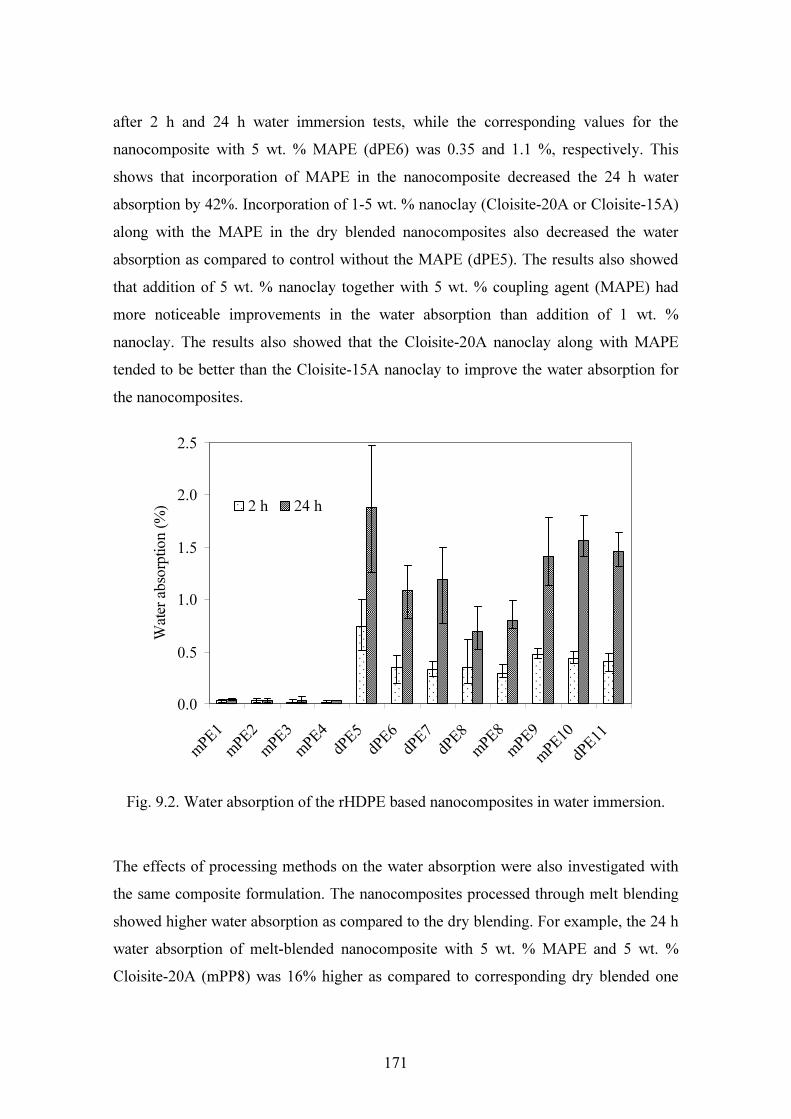
171
after 2 h and 24 h water immersion tests, while the corresponding values for the nanocomposite with 5 wt. % MAPE (dPE6) was 0.35 and 1.1 %, respectively. This shows that incorporation of MAPE in the nanocomposite decreased the 24 h water absorption by 42%. Incorporation of 1-5 wt. % nanoclay (Cloisite-20A or Cloisite-15A) along with the MAPE in the dry blended nanocomposites also decreased the water absorption as compared to control without the MAPE (dPE5). The results also showed that addition of 5 wt. % nanoclay together with 5 wt. % coupling agent (MAPE) had more noticeable improvements in the water absorption than addition of 1 wt. % nanoclay. The results also showed that the Cloisite-20A nanoclay along with MAPE tended to be better than the Cloisite-15A nanoclay to improve the water absorption for the nanocomposites.
0.0
0.5
1.0
1.5
2.0
2.5
m PE 1
m PE 2
m PE 3
m PE 4
d PE 5
d PE 6
d PE 7
d PE 8
m PE 8
m PE 9m PE 10d PE 11
Wate
r abso
rption
(%) 2 h 24 h
Fig. 9.2. Water absorption of the rHDPE based nanocomposites in water immersion.
The effects of processing methods on the water absorption were also investigated with the same composite formulation. The nanocomposites processed through melt blending showed higher water absorption as compared to the dry blending. For example, the 24 h water absorption of melt-blended nanocomposite with 5 wt. % MAPE and 5 wt. % Cloisite-20A (mPP8) was 16% higher as compared to corresponding dry blended one
172
(dPE8). However, additional 2-5 wt. % MAPE in the second compounding of melt-blended matrix of HDPE/MAPE/nanoclay while extruding did not show any improvement on the water resistant capacity.
0.0
0.5
1.0
1.5
m PE 1
m PE 2
m PE 3
m PE 4
d PE 5
d PE 6
d PE 7
d PE 8
m PE 8
m PE 9m PE 10d PE 11
Thick
ness
swell
ing (%
) 2 h 24 h
Fig. 9.3. Thickness swelling of the rHDPE based nanocomposites in water immersion.
Thickness swelling of the nanocomposites had linear relationship with water absorption, as expected, and thus showed similar trend to that of the water absorption as shown in Fig. 9.3. In a similar way to the water absorption, the entirely rHDPE samples, either with addition of nanoclay and coupling agent separately or together (5 wt. % MAPE, 5 wt. % Cloisite-20A) had low level of thickness swelling with values of less than 0.04%. It was interesting to note that the sample with 5 wt. % MAPE and 5 wt. % Cloisite-20A had relatively higher thickness swelling than other formulations for the 24 h water immersion. The rHDPE-wood flour nanocomposites showed much higher thickness swelling values varying from 0.09% to 0.36% for the 2h water immersion and from 0.4% to 1.02% for the 24 h water immersion.

173
As for the water absorption, the blending method and the addition of the coupling agent and the nanoclay also affected the thickness swelling to a certain extent. Addition of 5 wt. % MAPE in the dry blended control nanocomposite (dPE5) reduced the thickness swelling with 24 h water immersion from 1.02 to 0.36%. In addition, the nanocomposites containing both nanoclay and MAPE exhibited further decrease in thickness swelling values. The melt-blended nanocomposites showed higher thickness swelling as compared to corresponding dry blended ones. For example, for the 24 h water immersion, the melt blended nanocomposite (mPE8) containing both 5 wt. % MAPE and 5 wt. % nanoclay (Cloisite-20A) showed thickness swelling value (0.9%) almost double that of the corresponding dry blended nanocomposite (dPE8, 0.45%). Further addition of 2-5 wt. % MAPE in the second compounding with the melt-blended matrix of HDPE/MAPE/nanoclay adversely affected thickness swelling as illustrated in Fig.9.3 (mPE9 and mPE10). It is believed that the high values of moisture absorption and thickness swelling of the rHDPE/wood flour nanocomposites were mainly due to the presence of lumens, fine pores and hydrogen bonding sites in the wood flour, gaps and flaws at the interfaces, and micro-cracks in the plastic matrix formed during the compounding process [17]. On the other hand, the water absorption and thickness swelling for the neat rHDPE based nanocomposite containing only nanoclay and MAPE coupling agent were mainly affected by the intrinsic characteristics of these materials. Other factor affecting the water absorption and thickness swelling include the gaps and flaws at the interfaces, and the micro-cracks in the matrix formed during the compounding process. As the nanoclay is hydrophobic, it acted as a water repellent in the water immersion. In the case of wood filled nanocomposites, the hydrophilic wood flour absorbed water either in the form of bound water or free water thus the wood flour tended to increase the water absorption in the water immersion. The MAPE improved the interface bonding due to anhydride moieties in MAPE initiating an esterification reaction with the surface hydroxyl groups of wood flour [18]. Furthermore, the incorporation of 5 wt. % nanoclay along with MAPE improved the water resistant of the nanocomposites as compared with the only MAPE containing nanocomposites. Since the nanoclays themselves are hydrophobic and impermeable, it was believed that the nanolayers formed could

174
generate a tortuous pathway for a movement of water molecules to diffuse through the nanocomposite, and hence reduced the water absorption capacity [11]. 9.3.2 Flexural properties Flexural properties of the rHDPE based nanocomposites were measured from 3 point bending tests and the results are given in Table 9.3. As the entirely rHDPE based samples (mPE1, mPE2, mPE3, mPE4) did not fail in the bending, the flexural strength (MOR) was calculated based on 5% strain level. The MOR of the entirely rHDPE based samples was increased by 4.7% and 3%, respectively, with the addition of 5 wt. % MAPE and 5 wt. % nanoclay (Cloisite-20A) separately. However, when the MAPE and the naoclay were added together, the MOR was increased by 27%. Adding 46-48.5 wt. % wood flour as filler (dPE5) reduced the MOR by about 20% without coupling agent and nanoclay compared to the entirely rHDPE sample. On the other hand, the addition of 5wt. % MAPE in the rHDPE/wood flour composite (dPE6) showed 51 % increase in the MOR. With the dry blending method, the addition of nanoclay along with MAPE (dPE7) showed a decrease in the MOR values, and the MOR loss was increased with increasing the nanoclay content. For example, when 1 wt. % (dPE7) and 5 wt. % (dPE8) Cloisite-20A nanoclay was added separately to the MAPE coupled control nanocomposite (dPE6), the MOR was decreased by 11.3 and 30.2%, respectively. The addition of the Cloisite-15A nanoclay (5 wt. %) also showed 27% MOR degradation as compared to control nanocomposite (dPE6). Comparing to dry blending, melt blending processing significantly improved the MOR of the nanocomposites. For example, MOR of melt-blended nanocomposite with 5 wt. % MAPE and 5 wt. % Cloisite-20A nanoclay (mPE8) was increased by 27% as compared to corresponding nanocomposite made by dry blending (dPE8). Incorporation of additional 2 wt. % MAPE in the second compounding extrusion with melt-blended mixture of rHDPE/MAPE/nanoclay further increased the MOR by 44% (dPE9). However, further increase of MAPE content by 5 wt. % in the second compounding extrusion (mPE10) had adverse effect on MOR value as compared to the formulation with 2 wt. % addition (dPE9).

175
Table 9.3 Flexural properties of the rHDPE based nanocomposites. Composite code
Flexural strength (MPa)
Young's modulus (GPa)
Yield stress (MPa)
Elongation at break (%)
mPE1 21.4 (0.3*) 1.05 (0.03) 5.5 (0.2) 5.0 (0.1) mPE2 22.4 (0.3) 0.99 (0.03) 6.9 (0.3) 5.0 (0.0) mPE3 22.0 (0.9) 1.02 (0.06) 6.7 (0.7) 5.0 (0.0) mPE4 26.9 (0.2) 1.29 (0.04) 6.8 (0.2) 5.1 (0.1) dPE5 16.8 (0.6) 1.88 (0.10) 6.2 (0.1) 2.2 (0.2) dPE6 25.3 (1.1) 2.49 (0.12) 8.8 (0.6) 1.7 (0.1) dPE7 22.4 (1.4) 2.27 (0.10) 7.9 (1.0) 1.6 (0.2) dPE8 17.7 (1.0) 2.13 (0.07) 8.1 (0.5) 1.4 (0.1) mPE8 22.5 (1.0) 2.79 (0.24) 8.1 (0.3) 1.3 (0.1) mPE9 25.5 (1.5) 2.94 (0.14) 8.3 (0.3) 1.4 (0.1) mPE10 20.7 (0.4) 2.54 (0.09) 7.7 (0.3) 1.2 (0.1) dPE11 19.03 (1.3) 2.21 (0.09) 10.4 (0.5) 1.4 (0.2)
Note: *values in the parentheses are standard deviation. The values given are the average of five replicate samples Young’s modulus (MOE) of the entirely rHDPE, rHDPE with 5 wt. % MAPE and rHDPE with 5 wt. % nanoclay (Cloisite-20A) nanocomposites did not change significantly with MOE values ranging from 0.99 to 1.05 GPa. However, the addition of both 5 wt. % nanoclay and 5 wt. % MAPE (mPE4) showed 23% increase in the MOE to 1.28 GPa. As expected, incorporation of wood flour significantly increased the MOE for all of the nanocomposite formulations with the MOE values varying from 1.88 to 2.94 GPa. By adding 5 wt. % MAPE in the rHDPE/wood flour composite (dPE6), the MOE increased by 32.4% compared to the control sample (dPE5) which had a MOE value of 1.88 GPa. When both the nanoclay and MAPE were added together (dPE7 and dPE8), the MOE values were actually decreased significantly and the MOE loss was increased with increasing of the nanoclay content. The addition of different nanoclay (5 wt. %, Cloisite-15A) (dPE11) with MAPE also showed the MOE decrease compared to rHDPE/wood flour/MAPE composite (dPE6). The nanocomposites made through melt blending method exhibited higher MOE values compared to the dry blended nanocomposites with the same formulation. For example, the MOE of the melt-blended

176
nanocomposite (mPE8) with 5 wt. % MAPE and 5 wt. % nanoclay (Cloisite-20A) was increased by 31% as compared to that made through the dry blending (dPE8). With the additional MAPE (2 wt. %) in the second compounding extrusion of the melt-blended matrix (mPE9), the MOE was further increased by 38%. Further increase in the MAPE content (by 5 wt. %) in the second compounding extrusion (mPE10) showed adverse effect on the MOE compared to the 2 wt. % addition in the second compounding (mPE9). As the crystallinity of the nanocomposite increased from 74.1 to 76.9 (Table 9.4) with the additional 2 wt. % MAPP in the composite, which increased the flexural property. However, melt and dry blended processing did not show any change in Xc of the nanocomposite, which suggests that property improvement is associated with the better dispersion of clay within the matrix. The change in yield stress was similar to the change in MOR values, however, a clear trend was observed for the yield strength, which was higher for the rHDPE/wood flour composites than the samples of entirely rHDPE. The addition of nanoclay and coupling agent also increased the yield stress but the difference between the blending methods was not significant. Elongation at failure of the entirely rHDPE based sample had much higher value of about 56% than the rHDPE/wood flour composites (1.2 to 2.2%). The elongation at failure of the rHDPE/wood flour composites was reduced with the addition of the MAPE and the nanoclay in the formulation. In addition, the elongation at failure was increased with increasing of the nanoclay content. This implied that the incorporation of MAPE and nanoclay reduced the ductility of the nanocomposites, leading to a brittle failure under loading.

177
Fig. 9.4. Flexural strength and Young’s modulus of the rHDPE based nanocomposites as functions of nanoclay content and processing methods. The results of MOR and MOE for the rHDPE based nanocomposites as a function of clay content and processing method are shown in Fig. 9.4. In general, the rHDPE/wood flour composites had increased MOR and MOE with incorporation of nanoclay and made through melt blending processing. With the same formulation, the nanocomposites made using dry blending were observed to have lower values for both MOR and MOE. Furthermore, addition of coupling agent significantly increased both MOE and MOE values. The increase in flexural properties with the coupling agent was expected due to the improved adhesion between components in the composites, as discussed in previous chapters. However, the incorporation of nanoclay into WPCs had impacts with MOR being decreased whereas MOE increased, which is consistent with the results reported by Faruk et al. [1] for the dry blended HDPE/wood flour nanocomposite with 5 wt. % nanoclay (Cloisite-10A) with or without MAPE coupling agent. The flexural property improvement with the increasing of nanoclay loadings in this study was consistent with the results obtained by the Yang et al. [12] for the melt blended HDPE/wood flour nanocomposites with incorporation of nanoclay (Cloisite-20A) with or without MAPE coupling agent. From these results, the melt blending

178
process, in which rHDPE/MAPE/nanoclay mixture was used as a matrix, appeared to be the best approach for incorporating the nanoclay in the wood flour-plastic composites. Melt blended nanocomposite showed higher water absorption as compared to dry blending method, however, melt blending composite showed higher flexural strength. In dry blending, nanoclay interacted with the wood flour, MAPE and HDPE at the same time during compounding. Since nanoclay is hydrophobic and impermeable, it was believed that the nanolayer formed could generate tortuous pathways for a movement of water molecules to diffuse through the composite, and reduced the water absorption. On the other hand, enhancement of flexural properties was believed to be largely dependent on dispersion of nanoclay particles in the composite. Since both wood flour and nanoclay interact with MAPE, there was the possibility that competition could negatively affect the when both fillers added together and reduced the flexural property. In melt blending, nanoclay could interact with MAPE and HDPE in first compounding and remain within the HDPE matrix. Hence, the increased hydrophilicity of the MAPE coupled HDPE combined with the increased hydrophobicity of the organically modified nanoclay would lead to a well dispersed and exfoliated clay structure, which increased the flexural property. However, the effect of nanoclay was less significant in the composite hence water absorption was increased. According to Wang et al. [10], addition of maleic anhydride to the polymer increased its hydrophilicity. Therefore, increased hydrophilicity of the polymer combined with the increased hydrophobicity of the organically modified nanoclay would lead to a well-dispersed and exfoliated clay structure in the nanocomposites [19, 20]. Exfoliation of clay tactoids within the polymer matrix would lead to a dramatic enhancement of the mechanical properties with only a small clay content (<5 wt. %). This suggests that the clay-layers were better exfoliated at a lower nanoclay content and provided a good reinforcing effect, but with further increase of the nanoclay content, some of the nanoclay remained partially intercalated and stacked, which weakened the reinforcing effect. It is believed that better exfoliation of the clay particles can be achieved in the nanocomposites made through the melt blending method [20] which exhibited the higher mechanical properties in this study. In the case of the dry blended nanocomposites, since both the wood flour and the nanoclay could interact with MAPE, there was the possibility that this competition could

179
negatively affect dispersion when both fillers were added together [11]. However, it was unclear about what mechanism prevails within the nanoclay, coupling agent and wood flour when these were mixed by the dry and melt blending methods with the polymer matrix. This could be further investigated in future work. 9.3.3. Microstructures characterization SEM images of the original surface of the nanocomposites were taken to study the dispersion of nanoclay in the rHDPE matrix at the magnification of 1000× and 2000× (Fig. 9.5 and Fig. 9.6). The trace of the nanoclay or lubricant (Vitrolite) can be detected in the SEM images. In the images, a large-scale particle agglomeration was not observed except for a few patches in some formulations. Therefore, it can be assumed that the nanoclays were uniformly dispersed in the rHDPE matrix. SEM image of the rHDPE and nanoclay and MAPE (5 wt. % each) nanocomposite showed the uniform dispersion of nanoparticles with only a few agglomerated clusters (Fig. 9.5a). However, the rHDPE/wood flour with 5 wt. % MAPE and 3 wt. % lubricant did not show any of such particle agglomeration on the nanocomposite surface (Fig. 9.5b). It can also be seen that the nanoparticles was more uniformly dispersed in the nanocomposites made through the melt blending method (Fig. 9.6a) as compared to that made through dry blending method (Fig. 9.6b) for the similar formulation. From the SEM images at the magnifications of ×1000 and ×2000, the intercalated or exfoliated structure of the nanoclay developed within the nanocomposites could not be analysed. However, it was reported that the nanoclays in the PE based nanocomposites with the coupling agent (MAPE) were better exfoliated [20].

180
Fig.9.5. SEM images of surface of the rHDPE based nanocomposites, (a) mPE4 and (b) dPE7 samples, where white spots are the nanoclay particles.
Fig.9.6. SEM images of surface of the rHDPE based nanocomposites, (a) dPE8 and (b) mPE8 samples, where white spots are the nanoclay particles. The fractured surfaces of the rHDPE based nanocomposites were analysed by the SEM images at the magnification of ×500 (Fig. 9.7 and Fig. 9.8). All of the nanocomposites showed the typical brittle fracture characteristics in the bending tests. The nanocomposite sample without nanoclay (dPE6) exhibited relatively more fibre pullout rather than the fibre breakage (Fig.9.7a); indicating the inferior interface bonding. However, a considerable amount of matrix and fibre breakages was observed in the nanocomposite containing 1 wt. % nanoclay (dPE7), leaving a relatively smooth fracture surface (Fig. 9.7b). Similar fracture mechanism was observed for the 5 wt. % nanoclay containing nanocomposite (dPE8) showing the considerable fibres being

181
pulled out (Fig.9.8a). On the other hand, the fractured surface of melt blended nanocomposite for similar formulation (mPE8) showed brittle fibre and matrix fractures with less fibres being pulled out which indicated good interface bonding (Fig. 9.8b). The traces of the nanoclay by the SEM images of the fractured surfaces, however, could not be spotted at magnification of ×500.
Fig.9.7. SEM images of fractured surface of the rHDPE based nanocomposites, (a) dPE6 and (b) dPE7 samples.
Fig.9.8. SEM images of fractured surface of the rHDPE based nanocomposites, (a) dPE8 and (b) mPE8 samples.
182
9.3.4 Thermal properties 9.3.4.1 Melting enthalpy and temperature The melting thermograms for the rHDPE based nonocomposites studied were obtained from the second heating DSC scanning as shown in Fig. 9.9. A single endothermic melting peak was observed for all of the nanocomposite samples. The melting peak occurred at 132.3 °C for the neat rHDPE sample, while it varied from 131.4-132.5°C for the rHDPE/wood flour composite depending on the formulations. Melting enthalpy (∆Hm) and peak melting temperature (Tm) of the samples were determined from the second heating scans with correction by weight fraction of the rHDPE in the nanocomposites. The results of the measured ∆Hm and Tm are given in Table 9.4. From the results, it was seen that with addition of 5 wt. % MAPE in the rHDPE matrix, the ∆Hm was decreased from 172.1 to 168 J/g but the value was increased from 172.1 to 190.2 J/g with addition of 5 wt. % Cloisite-20A nanoclay in the rHDPE matrix. An incorporation of both 5 wt. % MAPE and 5 wt. % nanoclay further increased the ∆Hm to 209.2 J/g. On the other hand, the addition of wood flour and lubricant reduced the ∆Hm of the rHDPE slightly by about 1.7%. The ∆Hm of the rHDPE/wood flour composites increased with increasing of the nanoclay content and the MAPE content irrespective of processing methods and nanoclay type. For example, the ∆Hm was increased from 197.7 to 216.8 J/g when the content of nanoclay Cloisite-20A was increased from 1 to 5 wt. %. The ∆Hm also increased with increasing of the MAPE content with values changing from 216.1 J/g at 5 wt. % to 226.4 J/g at 10 wt. % for the nanocomposites processed by melt blending method. However, the addition of MAPE and nanoclay, either added separately or together, did not show remarkable change in the peak melting temperature (Tm) of the nanocomposites irrespective of the processing methods. The values for Tm remained relatively constant for all of the composites tested, varying from 131.41 to 132.53°C.

183
Fig. 9.9. DSC second heating curves for the rHDPE based nanocomposites.
Fig. 9.10. DSC cooling curves for the rHDPE based nanocomposites.

184
Table 9.4 Thermal properties of the rHDPE based nanocomposites. Composite code ∆Hm (J/g) ∆Hc (J/g) Xc, % Tm peak (oC) Tc peak (oC) Tconset (oC) mPE1 172.1 168.1 57.4 132.27 121.78 123.26 mPE2 168.0 163.2 55.7 132.37 121.49 123.11 mPE3 190.2 183.9 62.8 132.53 121.48 123.30 mPE4 209.2 219.6 74.9 132.15 121.47 122.99 dPE5 169.1 164.7 56.2 131.96 120.89 122.26 dPE6 214.5 207.4 70.8 131.83 120.97 122.46 dPE7 197.7 193.1 65.9 132.35 120.74 122.53 dPE8 216.8 218.5 74.6 132.09 120.96 122.54 mPE8 216.1 217.2 74.1 131.53 121.41 122.54 mPE9 228.0 225.4 76.9 131.91 121.04 122.50 mPE10 226.4 223.2 76.2 131.41 121.30 122.42 dPE11 215.9 212.0 72.4 132.35 121.21 122.90
Note: In the table, ∆Hm is the melting enthalpy, ∆Hc is the crystallization enthalpy, Xc is the crystallinity, Tm is the peak melting temperature, Tc and Tconset are the crystallization temperature at peak and onset, respectively. 9.3.4.2 Crystallization The cooling thermograms for the nanocomposites studied were obtained from the first DSC cooling scanning and are shown in Fig. 9.10. Crystallization enthalpy (∆Hc), crystallinity (Xc), peak crystallization temperature (Tc) and crystallization onset temperature (Tconset) for all of the nanocomposites tested were determined, and corrected by the weight fraction of rHDPE in the nanocomposites. The results for the crystallization properties are also included in Table 9.4. From the results, it was found that the Tc of rHDPE was changed slightly with the incorporation of nanoclay, coupling agent and the wood filler in the nanocomposite formulation. Similarly, the addition of the nanoclay, MAPE, lubricant and the wood flour also had moderate influence on Tconset with its values generally reducing from 123.26°C by less than 1°C for the nanocomposites. However, incorporation of 5 wt. % nanoclay, the Xc of the rHDPE was increased from 57.4% to 62.8% whereas value of Xc was reduced slightly with addition of 5 wt. % MAPE. The Xc of the rHDPE matrix was further increased by 17.5% with
185
the addition of both 5 wt. % MAPE and 5 wt. % nanoclay together. Although, the Xc was reduced with the wood flour as filler, incorporation of the MAPE and the nanoclay to the rHDPE/wood flour composites increased the Xc value significantly. The blending methods seemed to have unnoticeable effect on the crystallization values. From this study, it was found that the addition of nanoclay in the rHDPE and in the rHDPE/wood flour composites, the thermal properties was changed to a varying extent. Even moderate changes of the melting and crystallization temperatures may significantly change the Xc. The change in Xc could have strong influence on the structure of the nanocomposites and, ultimately, on their mechanical properties. The addition of MAPP in the rHDPE matrix reduced the Xc, however, the addition of nanoclay increased the Xc which is consistent with the findings of Deshmanea et al. [21] who reported that the addition of 4 wt. % nanoclay in the HDPE matrix increased the Xc significantly. The depressed crystallization temperature and the crystallinity of the MAPE containing rHDPE was attributed to the influence of pendant anhydride grafts [3]. With the wood flour as filler, the HDPE matrix viscosity at the crystallization temperature was increased which is expected to reduce the diffusion rate of the HDPE chain. As a result, the crystallization rate was obviously lowered. Although the wood fibre acted as a nucleating agent for crystallization, in some case, the wood fibre was found to physically hinder the crystal growth and reduced the crystallization [7]. The crystallization behaviour of the polymer matrix containing MAPE and nanoclay was believed to be dependent on the nanoclay content and on the relative dominating status of the two aspects. On one hand, the nanoclay could provide heterogeneous nuclei during the initial nucleation stage, but on the other hand, it may restrict the conformational transition of molecules during growth stage. When the nanoclay and wood flour were added, the crystal nucleation occurred due to the promoted nucleating by the nanoclay and the wood flour for the crystallites [22] which increased the crystallinity of the nanocomposites. 9.4 Conclusions In this study, recycled HDPE based nanocomposites were manufactured by direct dry blending and melt blending processing. Effects of processing method, coupling agent

186
and nanoclay contents, and nanoclay type on the dimensional stability, dispersion of nanoclay particles, flexural properties and thermal properties of the nanocomposites were investigated. From the results, incorporation of 1 wt. % nanoclay in the MAPE coupled nanocomposites did not reduce the water absorption at 2h and 24h water immersion, however, increasing the nanoclay content to 5 wt. % significantly decreased the water absorption irrespective of processing methods (dry blending or melt blending). The nanocomposites made using melt blending exhibited lower dimensional stability as compared to those using dry blending. Addition of MAPE in the second compounding with the melt blending method did not improve the water absorption of the nanocomposites. The MOR and MOE of the melt blended nanocomposites were increased with incorporation of the nanoclay while the corresponding properties were decreased for the dry blended nanocomposites of the same formulation. Comparing to the dry blended nanocompoaites, the melt blending increased the flexural MOR and MOE of the nanocomposites by 27% with 5 wt. % MAPE coupling agent. These properties were increased by 31% when both MAPE and nanoclay (Cloisite-20A) were added at 5 wt. % each. Further improvement in the flexural properties could be achieved by adding additional 2 wt. % MAPE in the second compounding with melt blending. The traces of the nanoclay had been detected with SEM images for the nanocomposite surfaces. From the image analysis, no significant nanoclay particle agglomeration was observed and, thus, it was believed that the nanoclay was uniformly dispersed in the rHDPE matrix. SEM images of the fractured surfaces of the composites without nanoclay exhibited relatively more fibre pullout while the nanoclay containing nanocomposites showed a considerable amount of matrix and fibre breakages. This is consistent with the improvements of flexural properties with the incorporation of the nanoclay, MAPE in both of neat rHDPE based and rHDPE/wood flour based composites. The melting enthalpy of the rHDPE/wood flour based nanocomposites was increased with increasing of the nanoclay content and MAPE content, irrespective of the blending

187
method and the nanoclay type. The addition of MAPE and nanoclay, separately and both together, did not show remarkable change in the peak melting temperature of the nanocomposites. The Xc of the rHDPE was reduced with addition of MAPE or wood flour. Either incorporation of MAPE and nanoclay together further increased the Xc for the neat rHDPE or rHDPE/wood flour based nanocomposites. The thermal properties did not change noticeably with the different blending methods used. The experimental results indicated that the flexural properties of rHDPE/ wood flour based nanocomposites could be significantly improved with appropriate combination of the coupling agent, nanoclay contents using melt blending processing method. It is recommended that further work should be conducted to investigate the dimensional stability and nanoclay dispersion mechanism (e.g. intercalated or exfoliated structure) using transmission electron microscopy (TEM) and X-ray diffraction. 9.5 References [1] Faruk O, Matuana LM. Nanoclay reinforced HDPE as a matrix for wood-plastic
composites. Composites Science and Technology 2008; 68:2073-2077. [2] Jana SC, Prieto A. On the development of natural fibre composites of high-
temperature thermoplastic polymers. Journal of Applied Polymer Science 2002; 86:2159-67.
[3] Gopakumar TG, Lee JA, Kontopoulou M, Parent JS. Influence of clay exfoliation on the physical properties of montmorillonite/polyethylene composites. Polymer 2002; 43: 5483–91.
[4] Zhai H, Xu w, Guo H, Zhou Z, Shen S, Song Q. Preparation and characterization of PE and PE-g-MAH/montmorillonite nanocomposites. European Polymer Journal 2004;40: 2539–2545.
[5] Lei Y, Wu Q, Clemons CM. Preparation and properties of recycled HDPE/clay hybrids. Journal of Applied Polymer Science 2007;103:3056–63.
[6] Kawasumi M, Hasegawa N, Kato M, Usuki A, and Okada A. Preparation and mechanical properties of polypropylene-clay hybrids. Macromolecules 1997;30:6333-38.

188
[7] Kato M, Okamoto H, Hasegawa N, Tsukigase A and Usuki A. Preparation and properties of polyethylene-clay hybrids. Polymer Engineering and Science 2003;43 (6):1312–16
[8] Hasegawa N, Okamoto H, Kawasumi M, Kato M, Tsukigase A, Usuki A. Polyolefin-clay hybrids based on modified polyolefins and organophilic clay. Macromolecular Material Engineering 2000; 280/281:76-79.
[9] Wang KH, Chung IJ, Jang MC Keum JK and Song HH. Deformation behaviour of polyethylene/silicate nanocomposites as studied by real-time wide-angle x-ray scattering. Macromolecules 2002;35:5529–35.
[10] Wang KH, Xu M, Choi YS, and Chung IJ. Effect of aspect ratio of clay on melt extensional process of maleated polyethylene/clay nanocomposites. Polymer Bulletin 2001; 46:499–505.
[11] Lei Y, Wu Q, Clemons CM, Yao F, Xu Y. Influence of nanoclay on properties of HDPE/wood composites. Journal of Applied Polymer Science 2007;106:3958–66.
[12] Zhong Y, Poloso T, Hetzer M, and Kee DD. Enhancement of wood/polyethylene composites via compatibilization and incorporation of organoclay particles. Polymer Engineering and Science 2007:797-803.
[13] Jordana J, Jacobb KI, Tannenbaumc R, Sharafb MA, Jasiukd I. Experimental trends in polymer nanocomposites—a review. Materials Science and Engineering A 2005;393:1-11.
[14] Adhikary KB, Pang S, Staiger MP. Dimensional stability and mechanical behaviour of wood–plastic composites based on recycled and virgin high-density polyethylene (HDPE). Composites: Part B Engineering 2008;39:807-15.
[15] Adhikary KB, Pang S, Staiger MP. Long-term moisture absorption and thickness swelling behaviour of recycled thermoplastics reinforced with Pinus radiata sawdust. Chemical Engineering Journal 2008;142:190–98.
[16] ASTM D1238-04c A. Standard test method for melt flow rates of thermoplastics by extrusion plastometer ASTM, 2002.
[17] Stokke DD, Gardner D. Fundamental aspects of wood as a component of thermoplastic composites. Journal of Vinyl & Additive Technology 2003;9(2):96-104.

189
[18] Matuana LM, Balatinecz JJ. Sodhi RNS. Park CB. Surface characterization of esterified cellulosic fibres by XPS and FTIR spectroscopy. Wood Science and Technology 2001; 35(3):191-201.
[19] Morawiec J, Pawlak A, Slouf M, Galeski A, Piorkowska E, Krasnikowa N. Preparation and properties of compatibilized LDPE/organo-modified montmorillonite nanocomposites. European Polymer Journal 2005;41:1115–22.
[20] Lee J-H, Jung D, Hong C-E, Rhee KY, Advani SG. Properties of polyethylene-layered silicate nanocomposites prepared by melt intercalation with a PP-g-MA compatibilizer. Composites Science and Technology 2005;65:1996–2002.
[21] Deshmanea C, Yuana Q, Perkins RS, Misra RDK. On striking variation in impact toughness of polyethylene-clay and polypropylene–clay nanocomposite systems: The effect of clay–polymer interaction. Materials Science & Engineering 2007;458:150–57.
[22] Xie Y, Yu D, Kong J, Fan X, Qiao W. Study on morphology, crystallization behaviours of highly filled maleated polyethylene-layered silicate nanocomposites. Journal of Applied Polymer Science 2006;100:4004–11.
190
CHAPTER 10 NUMERICAL SIMULATION FOR TEMPERATURE
DISTRIBUTION DURING HOT PRESS MOULDING OF THE WOOD PLASTIC COMPOSITES
Abstract In this part of study, a one-dimensional hot press model was proposed to predict temperature profile of wood plastic composites (WPCs) during the hot press moulding. The model is based on non-linear transient heat conduction through the panel thickness during the hot press. A MATLAB code was compiled to solve the proposed model based on finite difference method (FDM). Experiments were performed to measure the temperature profiles of the composite at the mid-thickness position during the hot pressing. The experimental data shows that the model simulation results are in close agreement with the experimental results with reasonable accuracy. However, due to the lack of necessary thermo-physical property data for the modelling, the model over-predicted the temperatures for most of the composites based on the existing data obtained from literature. Therefore, the model could be used as a guidance tool in the process design of the hot pressing cycle for manufacturing of WPCs. However, the model prediction can be improved once the thermo-physical properties of WPCs are determined in the future work. 10.1 Introduction For manufacturing of WPCs, different processing methods and operation conditions have been studied to achieve the best quality of WPCs such as dimensional stability and mechanical properties [1, 2]. In the manufacturing of thermoset composites, proper curing cycle during the moulding process leads to a uniform curing and compaction of the composites. In previous studies [3-7], numerical analysis was employed to study the curing behaviour and temperature distribution in the thermoset composites made from synthetic fibre or natural fibre with different moulding. Guo et al. [3] used a one-dimensional transient heat transfer analysis to simulate the autoclave cure cycle for thick carbon fibre - epoxy laminates using commercial finite element (FE) software.

191
Joshi et al. [4] performed the transient heat transfer analysis by using a general purpose FE software and two subroutine programs to simulate the resin curing kinetics of a thick graphite - epoxy laminate. The results showed close agreement between the predicted results and experimental data. Rouison et al. [5] presented a one-dimensional model using finite difference method (FEM) to predict the temperature distribution and curing behaviour of hemp kenaf fibre - unsaturated polyester composites manufactured using a resin transfer moulding (RTM). It was reported that the predicted results were also in close agreement with experimental data measured at different positions. Behzad et al. [6, 7] studied the curing simulation of hemp fibre-acrylic based composites during sheet moulding and developed both a one–dimensional model and a three-dimensional model to simulate the hot pressing process. It was reported that the model prediction was in reasonable agreement with the experimental data. However, no work has been reported about the heat transfer simulation of the thermoplastic-based wood plastic composites during the hot moulding process. Therefore, in this work, a one-dimensional non-linear transient heat transfer model was developed to simulate the temperature profile of the WPCs during hot pressing, and experiments were performed to check the accuracy of the proposed model. 10. 2 Experimental WPC panels were made following procedures described in Chapter 2 using hot press moulding. For this study, temperature profile at the mid-thickness (core) of the composite mat was measured by using Fluke thermometer (with K-type thermocouple wire). The temperature profile was measured for both hot pressing and cold pressing cycles. As the thermocouple wires were exposed directly to the molten wood flour – plastic particles, there might be errors during the temperature measurement due to the heat conduction through the thermocouple wires. Schematic diagram of the experimental setup used for the temperature measurement was shown in Fig.10.1. The temperature profiles were measured for samples of both PP and HDPE based composites.

192
10. 3 Theoretical modelling of the temperature profile 10.3.1 Governing equations for transient heat conduction For this study, the compounded pellets of wood flour and plastics (PP and HDPE) were the same as those for other studies reported in previous chapters. In the modelling of the temperature profile in the hot press moulding, convective heat transfer caused by the polymer flow and moisture movement were neglected for simplicity.
Fig. 10.1. Schematic diagram of the experimental setup for the measurement of core temperature of the wood flour plastic composites. It was assumed that after pre-compaction, the composite geometry, thickness and polymer mass remained constant during the moulding process. This means no polymer flow or thickness reduction occurring during the hot moulding process. This assumption may cause some errors, as the actual thickness reduction was about 10% in the hot press moulding. In addition, it was assumed that during the hot pressing, the polymer and the wood fibres were at the same temperature and form a macroscopically homogeneous material system for the heat transfer. Based on these assumptions, the temperature profile inside the WPCs can be evaluated by solving the non-linear anisotropic heat conduction equation including the internal heat consumption as given in equation [8]:

193
tQ
zTkzy
TkyxTkxt
TC zyxpcc ∂∂−
∂∂
∂∂+
∂∂
∂∂+
∂∂
∂∂=∂
∂ρ (10.1) In which ρc is the density of the composite material (kg m-3); Cpc is the heat capacity of the composite material (kJ kg-1 K-1) and ki is the thermal conductivity of the composite panel (W m-1 K-1). The internal heat generation term (∂Q/∂t) represents an exothermic effect of the polymer resin reaction, which was neglected in the model. Considering that the width and length dimensions of the composite are 20–30 times of the thickness, the heat conduction governing equation (Eq. 10.1) can be reduced to one-dimensional (along the composite thickness) and is rearranged as follows:
∂∂
∂∂=∂
∂xTk
xtTC xpccρ
2
2
xT
tT
∂∂=
∂∂
α (10.2) Where α is the diffusivity of the composite and can be determined by following equation:
pcc
x
Ck
ρα = (10.3)
10.3.2 Thermo-physical properties To predict the temperatures distribution in the WPC mat during hot pressing cycle, thermo-physical properties such as density, heat capacity and thermal conductivity of the composites are needed. In this study, these thermo-physical properties of the WPCs for different composite formulations were not investigated. Hence, these properties were cited from literature and calculated using the rule of mixture as described in the following sections. 'Rule of Mixtures' is a mathematical expression, which determines a property of the composite from known composition and properties of each component of the material. 10.3.2.1 Density of composite
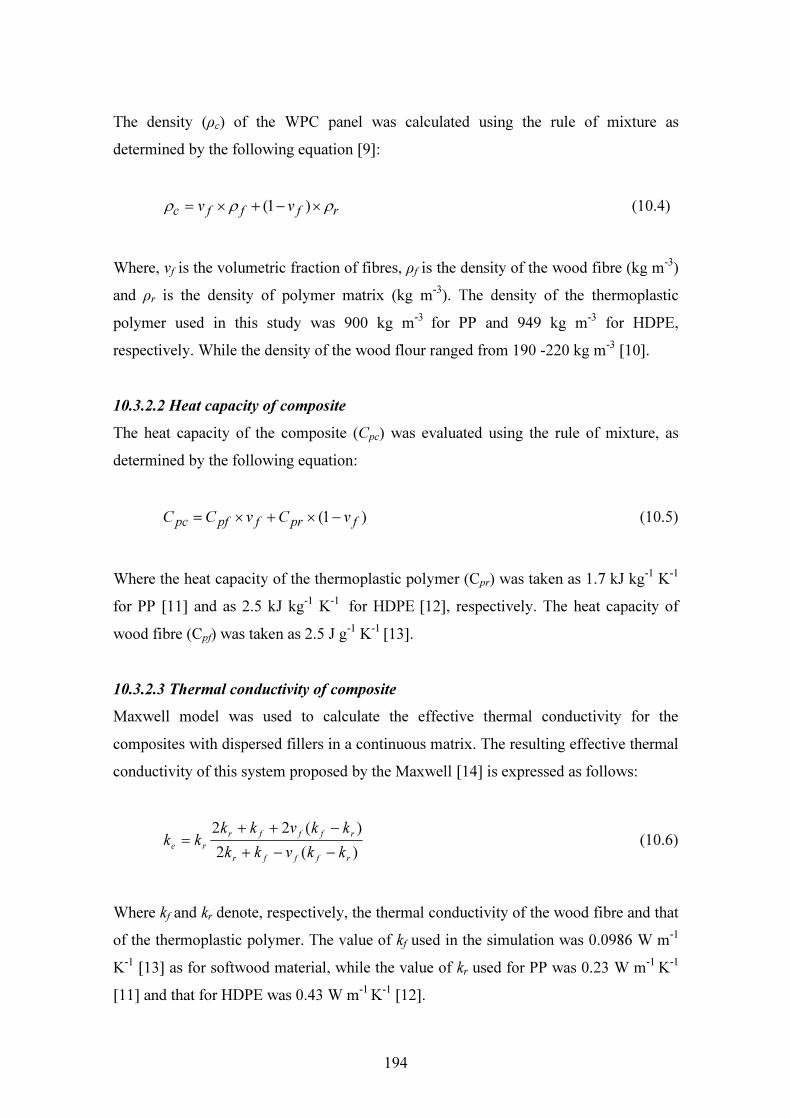
194
The density (ρc) of the WPC panel was calculated using the rule of mixture as determined by the following equation [9]: rfffc vv ρρρ ×−+×= )1( (10.4) Where, vf is the volumetric fraction of fibres, ρf is the density of the wood fibre (kg m-3) and ρr is the density of polymer matrix (kg m-3). The density of the thermoplastic polymer used in this study was 900 kg m-3 for PP and 949 kg m-3 for HDPE, respectively. While the density of the wood flour ranged from 190 -220 kg m-3 [10]. 10.3.2.2 Heat capacity of composite The heat capacity of the composite (Cpc) was evaluated using the rule of mixture, as determined by the following equation: )1( fprfpfpc vCvCC −×+×= (10.5) Where the heat capacity of the thermoplastic polymer (Cpr) was taken as 1.7 kJ kg-1 K-1 for PP [11] and as 2.5 kJ kg-1 K-1 for HDPE [12], respectively. The heat capacity of wood fibre (Cpf) was taken as 2.5 J g-1 K-1 [13]. 10.3.2.3 Thermal conductivity of composite Maxwell model was used to calculate the effective thermal conductivity for the composites with dispersed fillers in a continuous matrix. The resulting effective thermal conductivity of this system proposed by the Maxwell [14] is expressed as follows: )(2
)(22rfffr
rfffrre kkvkk
kkvkkkk
−−+
−++= (10.6)
Where kf and kr denote, respectively, the thermal conductivity of the wood fibre and that of the thermoplastic polymer. The value of kf used in the simulation was 0.0986 W m-1
K-1 [13] as for softwood material, while the value of kr used for PP was 0.23 W m-1 K-1 [11] and that for HDPE was 0.43 W m-1 K-1 [12].

195
10.4 Finite difference method for solving the heat equation Finite difference method (FDM) was used to solve the partial differential equation (PDE) for the transient heat equation (Eq.10.2) with the needed parameters determined by Eqs.(10.4) to (10.6). The FDM is a numerical method for obtaining solution to Eq. (10.2) by replacing the continuous PDE with discrete approximation. Firstly, finite difference formulas are developed with the target variable T as a function of only one independent variable of location (x) at a given time step, i.e. T = T(x). The resulting formulas are then used to approximate derivatives with respect to time with an interval of ∆t. Fig. 10.2 shows the mesh and the nodal points used for the approximations. In the heat equation, there are derivatives with respect to time and derivatives with respect to space. As the thickness domain is divided into (N-1) elements with equal size, the distance between two adjacent nodes is ∆x= L/ (N-1), where L is the thickness of the composite and N is the number of nodes. The nodes i=1 and i=N correspond to the boundaries of the domain (the upper and lower surface of the mould). In the time domain, the time interval is ∆t and the index ‘m’ is used to count the time steps.
Fig.10.2. Mesh of a semi-infinite strip used for solving the one dimensional heat transfer equation. The solid squares indicate the location of the known initial values. The open squares indicate the location of the known boundary values. The open circles indicate the position of the interior points where the finite difference approximate is computed.

196
10.4.1 Initial and boundary conditions The solution of the Eq. (10.2) requires known boundary at x = 0 and x = L, and initial conditions at the start of the hot pressing cycle (t = 0). For the modelling, these conditions are defined as follows: T (0, t) = T1, T (L, t) = TL (10.7)
T(x, 0) = f0(x) (10.8) In the simulation, f0(x) = sin (πx/L), T1 = TL = 200 oC. The heat transfer resistance between the platen and the panel surface is ignored and thus the surface temperature of the composite was the same as the mould platen. This indicates the heat transfer resistance between the hot platen and the panel surface is negligible which is valid after a very short period of time from the start of the press when the surface layer is molten. The temperatures of the top and bottom platens were the same as the control temperature of 200 oC. The Crank–Nicholson technique with dirichlet boundary conditions is applied to obtain the temperature at each time step [15]. The left hand side of the heat equation (Eq. 10.2) is approximated with the first order backward time difference used as given in the following equation:
tTT
tT m
imi
xt im∆−=
∂∂ −
+
1
,1 (10.10)
In this way, the first order derivative with respect to time is related to the values of temperature (T) at the ‘new’ time step (m) and at the ‘old’ time step (m-1). The above equation (Eq.10.10) can be used for determination of the second order derivative using central difference scheme evaluated at the current and the previous time step as given in following equation: 2
11
,2
2 2
1x
TTTxT m
imi
mi
xt im∆
+−=∂∂ +−
+
(10.11)
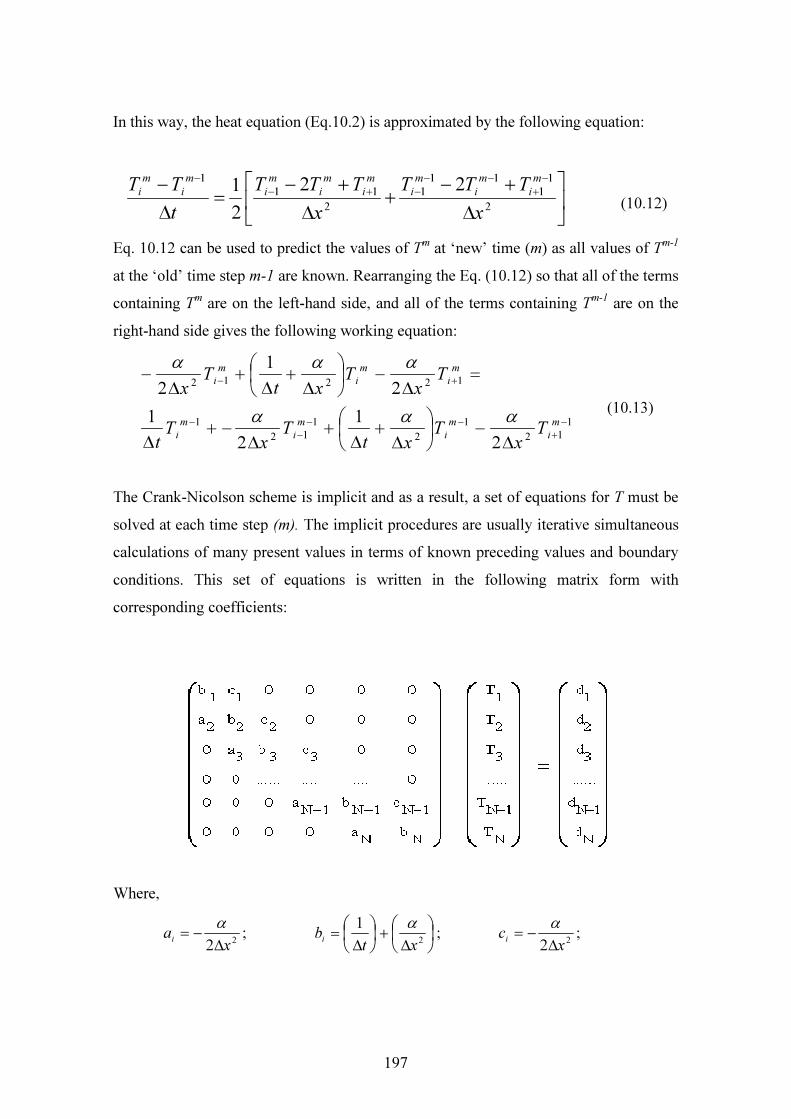
197
In this way, the heat equation (Eq.10.2) is approximated by the following equation:
∆
+−+∆+−=∆
− −+
−−−+−
−
2
11
111
211
1 2221
xTTT
xTTT
tTT m
imi
mi
mi
mi
mi
mi
mi (10.12)
Eq. 10.12 can be used to predict the values of Tm at ‘new’ time (m) as all values of Tm-1 at the ‘old’ time step m-1 are known. Rearranging the Eq. (10.12) so that all of the terms containing Tm are on the left-hand side, and all of the terms containing Tm-1 are on the right-hand side gives the following working equation:
112
12
112
1
12212
21
21
21
2−
+−−
−−
+−
∆−
∆+∆+∆−+∆
=∆−
∆+∆+∆−
mi
mi
mi
mi
mi
mi
mi
Tx
Txt
Tx
Tt
Tx
Txt
Tx
ααα
ααα
(10.13)
The Crank-Nicolson scheme is implicit and as a result, a set of equations for T must be solved at each time step (m). The implicit procedures are usually iterative simultaneous calculations of many present values in terms of known preceding values and boundary conditions. This set of equations is written in the following matrix form with corresponding coefficients:
Where, 22 x
ai ∆−= α ;
∆+
∆= 21
xtbi
α ; 22 xci ∆
−= α ;
198
11
111
1 )(1 −+
−−−
− ++++
∆= m
iimiii
mii
mii TcTcaTaT
td ;
for i = 2, 3, 4….N-1 The above set of equations can be solved by using the dirichlet boundary conditions as follows: b1 = 1, c1 = 0, d1 = T1 aN = 0, bN = 1, dN = TL For each time step (m), this system are solved on all of the nodes in the spatial domain, for i =2, 3, 4…...N-1. The temperatures at the panel surface layers (i = 1 and i = N) have been known which lead to a tridiagonal matrix (N-2, N-2) that has been solved using the Thomas algorithm [15]. 10.5 Numerical simulation Using the above numerical techniques and the boundary and initial conditions, the non-linear, one-dimensional transient heat transfer model (Eq.10.2) has been solved to predict the temperature profile through the thickness of the composite during the hot pressing cycle. For doing this, a code in MATLAB was compiled and the execution of the numerical solution was repeated until the completion of the hot pressing cycle. The sensitivity analysis was carried out to investigate the variation of the temperature profiles by varying the time steps and the mesh sizes. It was observed that the temperatures were stable for the number of nodes greater than 11, and time steps less than 20 sec. Therefore, the time step of 10 sec and number of nodes of 31 were selected for the simulation to achieve the stable solution. The total time for the simulation was 600 sec for all of the WPCs and the thickness of the composites was varied from 8-10 mm. Then the temperature results at the mid-thickness position of the WPC panel obtained from the numerical simulation was compared with the experimental results. 10.6 Results and discussion Fig. 10.3 presents the comparison between the model predicted temperature profile and the experimental temperature measured in the hot pressing of the PP based WPCs at the

199
mid thickness (core) of the composite. Similarly, the comparison between the experimental data collected for the HDPE based WPCs and the model predicted values at the core of the composite are presented in Fig. 10.4. During the hot-pressing cycle the maximum temperatures of the top and the bottom platens were controlled in a range from 198-203oC, depending on the composite formulations. Therefore, an average value of 200 oC was used in the simulation. From the measured and predicted temperature profile, it is seen that the core temperature of the WPCs during the hot pressing increased rapidly from the start of the pressing until the blended material reached its melting temperature. After then the temperature increase was levelled off approaching a constant temperature in the late stage of the pressing. This behaviour applied to both PP and HDPE based composites. The predicted results were fitted fairly well with the experimental data for both the PP and HDPE based composites. It was observed that the composites with lower wood flour loading reached the constant temperature at the core earlier as compared to the higher wood flour loading composites. For example, the composite made from PP and wood flour (ratio of PP to wood flour of 60:40) reached the constant temperature of 185oC within the shortest time (about 480 sec); however, composite with the PP to wood flour ratio of 50:50 needed longer time (about 520 sec) to reach the constant temperature of 185oC. The reason for the longer heating time for the composites with higher wood flour content can be due to the differences in the thermal properties between wood and plastics. The wood has a lower heat conductivity and lower heat capacity than the plastics during the heating. The heat conductivity of the wood was 0.0986 W m-1 K-1 [13], while the heat conductivity of PP was 0.23 W m-1 K-1 [11] and that for HDPE was 0.43 W m-1 K-1 [12].

200
0
55
110
165
220
0 200 400 600Time (Sec)
Temp
eratur
e (oC)
Expe. rPP60W40Model-rPP60W40Expt. vPP50W50Model-vPP50W50Expt. rPP50W50Model-rPP50W50
Fig.10.3. Comparison of the experimental and the predicted core temperature for the PP
based composites.
0
55
110
165
220
0 200 400 600Time (Sec)
Temp
eratur
e (oC) Expt. rHDPE60W40Model-rHDPE60W40Expt. vHDPE50W50Model-vHDPE50W50Expt. rHDPE70W30Model-rHDPE70W30
Fig.10.4. Comparison of the experimental and the predicted core temperature for the HDPE
based composites.

201
A varying degree of discrepancies was observed in the initial and the intermediate stage of the pressing cycle for both the PP and HDPE based composites. These discrepancies could be explained by the approximations made to describe the thermo-physical parameters of the system. Some variations such as the changes of the heat capacity and the thermal conductivity of the system with the increasing temperature were neglected. In addition, the heat generation term was neglected in the model, which may cause some errors. However, the close agreement between the model predicted and the measured temperature profiles gave confidence in the modelling. This shows that one dimensional transient heat transfer model could predict the temperature variation in the WPCs during the hot pressing cycle with good accuracy. As the thermal conductivity and the heat capacity of both the plastics and wood fibre may be affected by the temperature, it is believed that the prediction accuracy can be increased when more accurate values of the thermal properties of the wood and the plastics are available and used in the model. Therefore, with the inclusion of the temperature dependent variables such as the thermal conductivity and the heat capacity of the constituent materials, and the heat generation term, the model can be further improved. 10.7 Conclusions In this work, a hot press-moulding model was proposed based on the one-dimensional transient heat conduction equation to predict the temperature profile of the WPCs made from wood flour with both PP and HDPE plastics during hot pressing cycle. A MATLAB code was compiled to numerically solve the proposed model using finite difference method. The model predicted core temperature distribution in the composite during the hot press moulding was compared with experimental data. The results show that the model predictions are in close agreement with the experimental data. Therefore, the model can be employed to determine the pressing time for different WPC formulations. The model can also be used for design of optimised hot press operation of the wood flour – plastic composites. In order to improve the model prediction accuracy, the temperature dependent variables such as thermal conductivity and heat capacity of the composites should be investigated and incorporated in the present model. Therefore, the model can be improved once the thermo-physical properties of the WPCs are determined in the future work.

202
10.8 References [1] Bledzki AK, Letman M, Viksne A, Rence L. A comparison of compounding
processes and wood type for wood fibre-PP composites. Composites Part A: Applied Science and Manufacturing 2005;36:789-97.
[2] Clemons C. Wood-plastics composites in the United States: The interfacing of two industries. Forest Product Journal 2002;52(6).
[3] Guo Z-S, Du S, Zhang B. Temperature distribution of thick thermoset composites. Modelling and Simulation in Materials Science and Engineering 2004;12(3):443–52.
[4] Joshi SC, Liu X, Lam Y. A numerical approach to the modelling of polymer curing in fibre-reinforced composites. Composite Science and Technology 1999;59:1003–13.
[5] Rouison D, Sain M, Couturier MR. Resin transfer moulding of natural fibre reinforced composites: cure simulation. Composite Science and Technology 2004;64:629–44.
[6] Behzad T, Sain M. Cure simulation of hemp fibre acrylic based composites during sheet moulding process. Polymer and Polymer Composites 2005;13(3):235-44.
[7] Behzad T, Sain M. Finite element modelling of polymer curing in natural fibre reinforced composites. Composites Science and Technology 2007;67:1666–73.
[8] Milles AF. Basic heat and mass transfer. Prentice Hall,1999. [9] Soboyejo WO. Mechanical properties of engineered materials: Published by CRC
Press, 2003. [10] Xanthos M, editor. Functional fillers for plastics Weinheim: Wiley-VCH, 2005. [11] Radhakrishnan S, Sonawane P, Pawaskar N. Effect of thermal conductivity and
heat transfer on crystallization, structure, and morphology of polypropylene containing different fillers. Journal of Applied Polymer Science 2004;93:615-23.
[12] Li X, Tabil LG, Oguocha IN, Panigrahi S. Thermal diffusivity, thermal conductivity, and specific heat of flax fibre-HDPE biocomposites at processing temperatures. Composite Science and Technology 2008;68:1753-58.
[13] Gupta M, Yang J, Roy C. Specific heat and thermal conductivity of softwood bark and softwood char particles. Fuel 2003;82:919-27.

203
[14] Maxwell JC. A Treatise on electricity and magnetism, 3rd ed. Ch.9: Dover Inc., New York, NY, 1954.
[15] Chapra SC, Canale RP. Numerical methods for engineers: with programming and software applications. 3rd ed: Boston: WCB/McGraw-Hill., 1998.
204
CHAPTER 11 CONCLUSIONS AND RECOMMENDATIONS
11.1 Conclusions Wood plastic composites (WPCs) were made using recycled polyethylene (rHDPE) and recycled polypropylene (rPP) with wood flour (Pinus radiate) as filler. Post-consumer plastics and waste sawdust were used as raw materials. Corresponding WPCs were also made for some composite formulations using virgin plastics (HDPE and PP) for comparative studies. WPCs panels were made through melt compounding and hot-press moulding based on plastic type (HDPE and PP), plastic form (virgin, recycled), wood flour content and adding of MAPP coupling agent. Dimensional stability, mechanical properties and morphology of WPCs were investigated. Long-term water absorption and thickness swelling of WPCs with water immersion tests were also examined. Durability performances of WPCs were studied by exposing to accelerated freeze-thaw (FT) cycles and accelerated ultraviolet (UV) radiation, separately. Dimensional stability and mechanical properties of the WPCs were further investigated with incorporation of nanoclays in the WPC formulations. The major findings drawn form these studies are explained in subsequent sections. It has been fully aware that the recycled plastics have more variable properties than the virgin plastics. The virgin plastics were therefore selected with comparable melt flow index to the recycled plastics for the purpose of comparison study. From this study, it was found that the rPP and rHDPE with wood flour could be successfully used to produce stable and strong WPCs, which have properties similar or comparable to that made from virgin PP and HDPE matrices. Dimensional stability and strength properties of the composites can be improved by increasing the polymer content or by addition of coupling agent (MAPP). The experimental results further showed that the dimensional stability and the flexural properties of the rHDPE based WPCs could be optimised with an appropriate combination of the maleated polyethylene (MAPE) coupling agent and nanoclay content using melt blending. Therefore, WPCs with improved stability and mechanical properties have great potential to use as construction materials.

205
11.1.1 Performance of WPCs based on recycled PP and HDPE Both recycled HDPE and PP based composites exhibited excellent dimensional stability that are comparable to the virgin plastics (HDPE or PP) based composites. The water absorption and thickness swelling at 2 h and 24 h water immersion increased with the wood flour content for both recycled and virgin PP and HDPE based composites. The 24 h water absorption by rHDPE based composite with 30 wt. % wood flour content was 0.039%, while the corresponding values for the composites with 50 wt. % wood flour content was 4.1%, respectively. The tensile strength, the flexural strength and the flexural Young’s modulus (MOE) of the WPCs increased with decreasing of the wood flour content in the matrix. Dimensional stability and mechanical propertied of the WPCs, however, were improved with the addition of 3-5 wt. % MAPP coupling agent in the composite formulations. The 24 h water absorption and thickness swelling were reduced by 70% and 60%, respectively, with adding 5 wt. % MAPP in the composites with 50 wt. % wood flour and 45 wt. % rHDPE matrix. Similar trend was also observed by adding 5 wt. % MAPP to the rPP based composites with 50 wt. % wood flour and 45 wt. % rPP matrix. The MAPP coupled composites also showed improvements in the mechanical properties (tensile and flexural strength, and flexural MOE), however, the elongation at the breaking point was reduced with the coupling agent. With the addition of 3 wt. % MAPP, the tensile strength for the rHDPE and rPP based composites increased by 60% and 35 %, respectively for the WPCs made with 50 wt. % wood flour and 47 wt. % plastic matrix (rHDPE or rPP). These properties could be further improved with increasing the coupling agent from 3 to 5 wt. %. With the significant improvements by adding 3-5 wt. % coupling agent (MAPP), the composites made of 45-47 wt. % plastics (rHDPE or rPP) could have stability and mechanical properties equivalent to those of the composites made from 70 wt. % plastics without the coupling agent. The experimental results showed the similar and comparable trend in mechanical properties variation for the composites made from both recycled and virgin plastics (rHDPE or rPP) for similar formulation.
206
SEM images of the fractured surfaces of composites confirmed that an addition of the MAPP coupling agent improved the interfacial bonding between the polymer and the wood filler for both the rHDPE and the rPP based composites. Stability and mechanical properties of the WPCs can be achieved by increasing the plastic content or by addition of coupling agents. 11.1.2 Long-term water absorption behaviour Long-term water immersion tests (63 days) revealed that the water absorption and thickness swelling increased with wood content in composite formulations and immersion time for all of the WPCs irrespective of plastic type and form. However, the MAPP coupled composites showed lower water absorption and lower thickness swelling in a similar way as in the 2h and 24 h water immersion tests. Experimental results also showed that the long-term thickness swelling had positive and linear relationship with the water absorption. Water transport mechanism within the WPCs was found to follow the kinetics of Fickian diffusion. By fitting the diffusion equation to experimental data, the diffusion coefficient, thermodynamic solubility and permeability were all increased with the wood flour content, but reduced with the addition of the coupling agent (MAPP). The thickness-swelling model was found to be adequate to determine the swelling rate of the WPCs in the long-term water immersion. It is interesting to note that the WPCs made of recycled and virgin plastics have comparable behaviour in terms of long-term water absorption and thickness swelling. 11.1.3 Freeze thaw durability performance of WPCs In the accelerated freeze-thaw (FT) tests, changes in the properties of WPCs based on both HDPE and PP were investigated with 12 FT cycles. The properties investigated include surface colour, dimensional stability, flexural properties, interface microstructures and thermal properties. The results showed that the water absorption of the composites in 2h and 24h water immersion increased with the FT recycle and the extent of the increase was also a function of wood flour content and plastic type used in the formulation. The water absorption after FT weathering increased with increasing of the wood-flour content. The results also indicated that the addition of the coupling agent (MAPP) reduced the water absorption and the thickness swelling throughout the FT

207
cycling. It is most interesting to note that with FT cycling, the water absorption for the recycled plastic based composites tended to be lower than that of the composites using the virgin plastics at the same wood flour content. WPCs underwent colour changes (∆E) in the FT cycling with the change in lightness (L*) being more significant than that in chromaticity values (a* and b*). The overall colour change increased with wood flour content and number of FT cycles. The PP based composites experienced greater colour change compared to the HDPE based composites. The addition of the MAPP coupling agent did not have significant effect on the colour change with FT weathering although it tended to reduce the colour change. With FT weathering, flexural strength, stiffness and yield strength of the WPCs samples decreased, but elongation at break increased regardless of plastics type and wood flour content. The addition of MAPP (3 or 5 wt. %) to the composites did not show noticeable influence to reduce the property degradation rate with FT cycling, and the MAPP coupled composites actually exhibited greater decrease in the Young’s modulus when compared to the non-coupled composites. It was noticed that the WPCs made of recycled plastics (rHDPE and rPP) had a similar trend to those made of virgin plastics (vHDPE and vPP) in terms of the flexural property changes. SEM images of FT weathered samples showed weakening in the interface bonding between the wood flour and the polymer matrix with intact fibres being pulled out from the polymer matrices rather than fibre breakage. The extent of the weakening varied with the plastic type and addition of the coupling agent; however, MAPP coupled composites showed better result compared to non-coupled composites. This confirmed the changes in the stability and mechanical properties with the FT weathering. The Xc of the FT weathered composites made of both virgin and recycled PP and HDPE was increased except for rHDPE50W50. However, MAPP coupled composites for both PP and HDPE showed decrease in Xc. This decrease in Xc for the MAPP composite is presumably due to the degradation of interface bonding by repeated wetting and thawing of the composite samples. The exact cause of decrease in Xc by 10% was not known for the rHDPE50W50 as for all non-coupled composites showed increase in Xc.

208
11.1.4 UV durability of WPCs In the accelerated ultraviolet (UV) tests, changes in the WPC properties were also investigated including surface colour, dimensional stability, flexural properties, interface microstructures and thermal properties. After exposing to UV weathering for 2000 h, the water absorption and the thickness swelling of the composites in 2h and 24 h water immersion increased significantly compared to the corresponding control samples. Both of the water absorption and thickness swelling increased with the wood flour content. The MAPP addition to the composites did not significantly influence the changes in the water absorption and thickness swelling with the UV weathering although the values for the MAPP coupled composites tended to be lower than the non-coupled composites at the same wood content. The surface of the UV weathered composites experienced colour changes (∆E) mainly due to the lightening (∆L*) of the composite surface. The colour change also increased with the UV exposure time and wood filler content. The MAPP coupled composites exhibited a less colour change as compared to non-coupled composites. The PP based composites experienced greater colour changes (∆E) than the HDPE based composites with similar formulations. The flexural strength and MOE of the UV weathered composites decreased while the elongation at break increased irrespective of composite formulations. However, coupling agent (MAPP) improved the property degradation with the UV weathering. For the rPP based composites, the coupling agent improved the degradation of the flexural strength and MOE by 50% and 27%, respectively, as compared to non-coupled composites. The improvement for the rHDPE based composites was even more significant with corresponding degradation reduction by 75% and 64%, respectively for the flexural strength and MOE. SEM images of the fractured surfaces confirmed the decrease in interface bonding between the wood flour and the plastic matrix after the UV weathering. Fibre pullout was observed in the weathered composites, while the fibre fracture was dominant in the

209
control samples. These observations can explain the property variations with different composite formulations and the property changes with the UV weathering. Crystallanity (Xc) of the weathered neat PP sample was increased by 6%, while the PP composites showed a decrease both for the non-coupled and coupled composites irrespective of virgin or recycled PP. The MAPP coupled (5 wt. %) PP based composite exhibited 8.3% reduction in Xc after weathering. On the other hand, the Xc of the weathered neat HDPE sample was decreased by 6.4%, while the HDPE composites showed a decrease both for the non-coupled and coupled composites irrespective with virgin or recycled HDPE with weathering. The MAPP coupled (5 wt. %) composite exhibited greater reductions in Xc by 30% after UV weathering. It was observed that all of the property changes were similar and comparable for both virgin HDPE and rHDPE based composites after UV weathering. It was observed that overall property degradation was imminent when the WPCs were exposed to the UV weathering, but the MAPP coupled composites significantly improved to the degradation with UV weathering. 11.1.5 Performance of nanoclay incorporated WPCs The stability and the mechanical properties of the rHDPE based WPCs were further investigated with incorporation of nanoclay, coupling agent and lubricant in the WPC formulations. Experiments were conducted to examine the effects of processing method (direct dry blending and melt blending), and incorporation of maleated polyethylene (MAPE) coupling agent and nanoclay (Cloisite-15A and Cloisite-20A) on the stability and mechanical properties. From the results, incorporation of 1 wt. % nanoclay in the MAPE coupled nanocomposites did not reduce the water absorption at 2h and 24h water immersion, however, with increasing the nanoclay content to 5 wt. % the water absorption was significantly decreased irrespective of processing method (dry blending or melt blending). The nanocomposites made using dry blending exhibited better dimensional stability as compared to those using melt blending method. In this method, adding additional MAPE in the second compounding did not improve the dimensional stability of the nanocomposites.

210
The flexural strength and MOE of the melt-blended nanocomposites were increased with incorporation of the nanoclay while the corresponding properties were decreased for the dry blended nanocomposites with similar formulation. In melt blending, with both 5 wt. % MAPE and 5 wt. % nanoclay in the composite, the flexural strength and MOE were 27 % and 31% higher, respectively, than corresponding nanocomposites made by dry blending method. In addition, adding additional 2 wt. % MAPE in the second compounding, the flexural strength could be further increased. Distribution of the nanoclay in the composites was detected with SEM image of the composite surface, which did not show any large-scale particle agglomeration. DSC scanning tests showed that the Xc of the neat rHDPE was increased by 9.4% with an addition of 5 wt. % nanoclay, while Xc was reduced by 3.5% with an addition of 5 wt. % MAPE. The Xc of the rHDPE matrix was further increased by 17.5% with the addition of both 5 wt. % MAPE and 5 wt. % nanoclay together. The experimental results showed that the dimensional stability and the flexural properties of the nanocomposites could be optimised with an appropriate combination of the coupling agent and nanoclay contents using melt blending processing method. 11.1.6 Numerical simulation of hot pressing of WPCs In this work, a one-dimensional, hot press-moulding model was proposed based on transient heat conduction equation to predict the temperature profile of the WPCs during the hot pressing cycle. A MATLAB code was compiled to numerically solve the proposed model using finite difference method. The model has been employed for both of the PP based and the HDPE based composites, and the predicted core temperature distribution was compared with the experimental data measured in the composite hot press moulding. The results show that the model predictions are in close agreement with the experimental results. Therefore, the model can be employed to determine the pressing time for different WPC formulations. The model can also be used for design of optimised hot press operation of the wood flour – plastic composites. In order to improve the model prediction accuracy, the temperature dependent variables such as thermal conductivity and heat capacity of the composites should be investigated and incorporated in the present model.
211
11.2 Recommendations for future work The information provided in this study will help the development and manufacturing of the recycled plastic based WPCs, but there are still more work needed to quantify additional performances of the product in applications. From the study on the durability performance with accelerated FT cycling and UV weathering, it was found that the surface colour, stability and flexural properties of the MAPP coupled WPCs were better than the non-coupled WPCs. However, other coupling agents and photostabilizer additives should be further investigated to improve the WPC durability. Effect of incorporation of hindered amine light stabilizers (HALS) and UV absorbers (UVA) should be studied if UV degradation is important. In other cases where the WPCs are used in residential houses, fire retardants should be added. Form this study, it was observed that nanoclay incorporated WPCs have exhibited superior stability and mechanical properties. It is recommended that further work should be conducted to investigate the nanoclay dispersion mechanism (e.g. intercalated or exfoliated structure) in the nanocomposites processed by direct dry blending and melt blending methods by using transmission electron microscopy (TEM) and X-ray diffraction. In addition, the FT and UV durability of the nanoclay incorporated WPCs can be further investigated by addition of the photostabilizer additives as mentioned previously in the composite formulations. Study of the WPC material properties alone is not enough to promote the use of WPC materials, investigations should also be made in connection with studies on market requirements. To improve the accuracy of the hot press-moulding model, the thermo-physical properties of the WPCs and the nanoclay-incorporated WPCs should also be investigated. With the inclusion of the temperature dependent variables such as the thermal conductivity and the heat capacity of the constituent materials, and the heat release with the polymer in the heat source term, the model can be improved significantly.

212
APPENDIX 1: LIST OF PUBLICATIONS JOURNAL PAPERS
1. Kamal B. Adhikary, Shusheng Pang and Mark P. Staiger. Dimensional stability and mechanical behaviour of wood-plastic composites based on recycled and virgin high-density polyethylene. Composites Part B: Engineering, 39 (2008) 807–815.
2. Kamal B. Adhikary, Shusheng Pang and Mark P. Staiger. Long-term moisture absorption and thickness swelling behaviour of recycled thermoplastics reinforced with Pinus radiata sawdust. Chemical Engineering Journal, 142 (2008) 190–198.
3. Kamal B. Adhikary, Shusheng Pang and Mark P. Staiger. Accelerated ultraviolet weathering of recycled polypropylene sawdust composites. Journal of Thermoplastic Composite Material (Accepted).
4. Kamal B. Adhikary, Shusheng Pang and Mark P. Staiger. Effects of Accelerated Freeze-Thaw Cycling on Physical and Mechanical Properties of Wood flour-Recycled Thermoplastic Composites. Polymer Composites (Accepted).
CONFERENCE PAPERS
1. Kamal B. Adhikary, Shusheng Pang and Mark P. Staiger. Durability of wood flour-recycled thermoplastics composites under accelerated environmental conditions. 7th International Ecocity Conference, San Francisco, USA, April 22-23, 2008.
2. Kamal B. Adhikary, Shusheng Pang and Mark P. Staiger. Durability of wood flour-recycled thermoplastics composites under accelerated freeze-thaw cycles. 13th European Conference on Composite materials (ECCM-13), Stockholm, Sweden, June 2-5, 2008.
3. Kamal B. Adhikary, Shusheng Pang and Mark P. Staiger. Wood-recycled plastics composite: advantages in stability and durability. Increasing values of wood: New look at Radiata pine, new products and alternative species, Feb. 14-15, 2008, Wood Technology Research Centre, University of Canterbury, New Zealand.