development of the models to estimate particulate matter
TRANSCRIPT

ORIGINAL PAPER
Development of the models to estimate particulate matterfrom thermal infrared band of Landsat EnhancedThematic Mapper
J. Amanollahi • C. Tzanis • A. M. Abdullah •
M. F. Ramli • S. Pirasteh
Received: 16 December 2011 / Revised: 25 September 2012 / Accepted: 9 December 2012 / Published online: 9 January 2013
� CEERS, IAU 2013
Abstract Particulate matter concentration and assess-
ment of its movement pattern is crucial in air pollution
studies. However, no study has been conducted to deter-
mine the PM10 concentration using atmospheric correction
of thermal band by temperature of nearest dark pixels
group (TNDPG) of this band. For that purpose, 16 Landsat
Enhanced Thematic Mapper plus ETM? images for San-
andaj and Tehran in Iran were utilized to determine the
amount of PM10 concentration in the air. Thermal infrared
(band 6) of all images was also used to determine the
ground station temperature (GST b6) and temperature of
nearest dark pixels group. Based on atmospheric correction
of images using temperature retrieval from Landsat
ETM?, three empirical models were established. Non-
linear correlation coefficient with polynomial equation was
used to analyze the correlations between particulate matter
concentration and the ground station temperature for the
three models. Similar analyses were also undertaken for
three stations in Klang Valley, Malaysia, using 11 Landsat
ETM? images to show the effectiveness of the model in
different region. The data analysis indicated a good cor-
relation coefficient R = 0.89 and R = 0.91 between the
trend of the result of temperature of nearest dark pixels
group b6 - (GST b6 - GST) model and the trend of PM10
concentration in Iran and Malaysia, respectively. This
study reveals the applicability of the thermal band of
Landsat TM and ETM? to determine the PM10 concen-
tration over large areas.
Keywords Digital number � Dark pixel � Land surface
temperature � Atmospheric correction � Wind speed
Introduction
Suspended particulate matters (SPM) in the atmosphere
with solid and liquid physical states are produced by nat-
ural and anthropogenic sources. Sea salt from the oceans,
volcanic eruptions, and windblown dust are from the nat-
ural sources. Anthropogenic sources consist of heat and
power generation, motor vehicle exhaust, industrial pro-
cesses, and open burning activities (Kaufman et al. 2002).
However, the atmosphere transformation processes such
as NOX to nitrates (Wang et al. 2006) and SO2 to sul-
fates (Quan et al. 2008) at urban and industrial areas may
also cause SPM. The study of particulate matter (PM) is
important because of its effects on human health (Adamson
et al. 1999; Williams et al. 2003; WHO 2005), atmospheric
visibility (Seinfeld and Pandis 1998), climate change
(Haywood and Boucher 2000), satellite imagery (Hadji-
mitsis et al. 2004; Hadjimitsis and Clayton 2008), as well
as the nutrient balance and acidity of soil (Yun et al. 2002;
Odabasi and Bagiroz 2002). The PM with sizes of less
than 10 and 2.5 M10 and PM2.5, respectively (Krewski
et al. 2000). The study of PM concentration and other
atmospheric pollutants usually relies on spatial and tem-
poral data series measured in ground station sites in cities
J. Amanollahi (&) � A. M. Abdullah � M. F. Ramli
Department of Environment Sciences, Faculty of Environmental
Studies, Universiti Putra Malaysia, Serdang 43400, Malaysia
e-mail: [email protected]
C. Tzanis
Faculty of Physics, Division of Environmental Physics and
Meteorology, UoAthens Climate Research Group,
University of Athens, Athens, Greece
S. Pirasteh
Department of Geography and Environmental Management,
Faculty of Environment, University of Waterloo,
Waterloo, Canada
123
Int. J. Environ. Sci. Technol. (2013) 10:1245–1254
DOI 10.1007/s13762-012-0150-7

and rural areas (Al-Saadi et al. 2005). Ground site mea-
surements entail high installation and maintenance costs.
Furthermore, the data collected through these methods are
reliable only within the spatial coverage of only a few
meters around the station. High variability of air quality
and scarce distribution of ground station sites impede
mapping atmospheric pollution using ground monitor sta-
tions (Wald et al. 1999). The major benefit of air quality
monitoring by satellite sensors is that it yields accurate
observation of data from small and large areas (Hadjimitsis
et al. 2002). In the last decade, spectral and angular or
polarization properties of solar radiation by aerosol were
utilised to design several satellite sensors to measure global
aerosol concentration. Earth observation system-moderate
resolution imaging spectrograph (EOS-MODIS) uses
spectral properties (King et al. 1992), EOS-multi angle
imaging spectroradiometer (MISR) uses angular charac-
teristics (Martonchik and Diner 1992), while advance earth
observing system ocean-polarization and directionality of
earth’s reflectance (ADEOS-POLDER) uses polarization
measurements to measure aerosol concentration. The
method for MODIS aerosol optical thickness (AOT)
retrieval is based on dark surface targets in the blue and red
channel and uses the 2.2 lm channel for their detection
(Kaufman et al. 1997). In this method, it has been assumed
that the aerosol effect is negligible at 2.2 lm versus that at
the blue and red channels. Previous studies on the rela-
tionship between MODIS AOT and PM in troposphere
measured by ground stations (Chrysoulakis et al. 2003;
Wang and Christopher 2003; Sohrabinia and Khorshidd-
oust 2007; Kampe 2008), and MISR product and PM
(Mazzoni et al. 2007) have been undertaken. Some of the
limitations of using MODIS data include the big size of the
MODIS pixel aerosol product (level 2 AOT product has a
10 km resolution), variation of correlation coefficients
between MODIS product and PM concentration depending
on the location (Chrysoulakis et al. 2003), as well as weak
correlation coefficients between MODIS product and PM
concentration in some studies, e.g., R = 0.56 for Beijing
(Ling-jun et al. 2007), R = 0.48 for Sydney (Gupta et al.
2007), R = 0.46 for Sanandaj, Iran (Amanollahi et al.
2011b), and R = 0.33 for Kuala Lumpur (Amanollahi et al.
2011a). These results have led researchers to look for a
more suitable satellite. Landsat Thematic Mapper (TM)
band 1 with 30 m resolution was utilized to assess the air
pollution in Athens by testing the correlation of the AOT
and air pollutants (Retalis 1998; Retalis et al. 1999). Ha-
djimitsis and Clayton (2009) determined the AOI via
atmospheric correction for Landsat TM bands 1 and 2. This
method was based on water vapor absorption that is neg-
ligible in Landsat TM as bands 1 and 2 (Kaufman 1989). In
the last decade, some studies were undertaken to calibrate
long wavelength (thermal infrared) of Landsat TM and
Enhanced Thematic Mapper Plus (ETM?) which are used
to determine the land surface temperature (Schott et al.
2001; Barsi et al. 2007). Schott et al. (2001) as well as
Barsi et al. (2007) showed a 3 K temperature differences in
the onboard calibration of Landsat ETM?. Barsi et al.
2007 calibrated the TM thermal band and found 0.7 K at
300 K temperature differences. The assumption of this
study is that the calibration of the thermal infrared band of
Landsat ETM depends on the amount of PM in the air.
Thus, the objective of this study is to assess PM10 con-
centration in Iran and Malaysia using the calibration of
thermal infrared band of the Landsat ETM?.
Materials and methods
Study area
The study areas are located in Tehran and Sanandaj in Iran,
and Petaling Jaya, Shah Alam, and Cheras, Malaysia.
Iran
Tehran is Iran’s largest urban area and city (Fig. 1d) and as
the capital of Tehran province, it faces many serious air
pollution problems. Every year, air pollution in Tehran is
associated with deaths of many citizens (MHME 2010). In
November, December, and January every year, the inver-
sion phenomena over the city of Tehran increased air
pollution density and in most cases air pollution reached
alarming levels (MHME 2010). Consequently, the gov-
ernment declared public holiday in Tehran and citizens are
advised to stay at home with doors closed (MHME 2010).
Air pollution had incurred financial losses around
$3.3 billion in the current Iranian calendar year. Sanandaj,
the capital of Kurdistan province (Fig. 1c), is located in the
west of Iran (Fig. 1a). In the last few years, Sanandaj has
received dust storms from Iraq. Amanollahi et al. (2010b)
showed that wind erosion in desert of Northern Saudi
Arabia, Western Iraq, and Eastern Syria were responsible
for dust storms in this area. The severe dust storms that
occurred from 4 to 10 July 2009 increased the average
values of PM10 in Sanandaj from 107 to 2,976 lg m-3 on 3
and 5 July 2009, respectively (IDOE 2009). The maximum
PM10 concentration during this dust storm was
5,616 lg m-3 at 2 a.m. on 5 July 2009.
Malaysia
Petaling Jaya, Shah Alam, and Cheras are located in Klang
Valley, Malaysia. Klang Valley is a part of Selangor, and is
located in the central part of the west coast of Peninsular
Malaysia (Fig. 1b). Klang Valley covers an area of about
1246 Int. J. Environ. Sci. Technol. (2013) 10:1245–1254
123

2,826 km2 and it is geographically delineated by Strait of
Malacca to the west and the Titiwangsa Mountains to the
north and east, this region is located in a bowl-like
topography. Malaysian climate is classified into the rainy
season from October to January, and dry season from
February to September regarding the amount of humidity,
temperature, and rainfall (MMD 2009). Air pollution in
Klang Valley is higher than other areas in Malaysia due to
its geographical position, large-scale industrial and com-
mercial activities, densely populated areas, and high
vehicular traffic (EQR 2006).
Data and image
The data utilised in this study are ground stations data of
PM10 concentrations and ground station temperature (GST);
and the data retrieved from thermal band (band 6) of
Landsat ETM? images (GST b6) (Table 1) and tempera-
ture of nearest dark pixels group (TNDPG b6) retrieved
from thermal band (band 6) of Landsat ETM? images
(Table 1). The PM10 data for Tehran were acquired from
Urban Air Quality Assessment and Management (TM
2010), and for Sanandaj were obtained from Iranian
Department of Environment (IDOE 2010). The GST data
were provided from Iran Metrological Organization for both
areas (IMO 2010). PM10 and GST data for Klang Valley
were received From Malaysian Department of Environment
(MDOE 2010). The GST data which were acquired coin-
cided with the Landsat satellite acquisition over the study
areas. In order to obtain GST b6, the thermal band (band 6)
of 8, 8, and 11 ETM? images were used for Tehran, Sa-
nadaj, and Klang Valley area, respectively (Table 1).
Fig. 1 Color areas in a and b shows the study area in Iran, and Malaysia respectively. c and d shows the Sanandaj and Tehran cities in 8 July
and 1 Jun 2009, respectively. e shows the Klang valley area in 15 December 2006
Int. J. Environ. Sci. Technol. (2013) 10:1245–1254 1247
123
Band 4 of all images was utilized for qualification of
monitoring ground stations by linking the bands. Bands 5,
4, and 3 were used to show the true or false color (Fig. 1c,
d, e). Bands 6, 5, 4, and 3 of all images were rectified to
UTM projection system (datum WGS84, zone 38�N, 39�N)
for Iran and (datum WGS84, zone 47�N) for Malaysia and
were georeferenced using nearest neighbor resampling
algorithm (Li et al. 2009) based on a topographical map
(1:25,000) from National Cartographic Center of Iran and
Malaysia using 50 ground control points. The RMSEs for
each band rectification were lower than 1 pixel.
Retrieval of GST b6 from Landsat ETM?
The DNs of pixel were converted to spectral radiance
according to the sensor hand book (Landsat 7 Science Data
User Hand Book 2010):
Lk¼ ðLmax�LminÞ= QCalmax�QCalminÞð Þ�QCalð ÞþLmin
ð1Þ
where Lk = spectral radiance, QCalmax = 255, QCalmin =
1, QCal = DN, Lmax, Lmin = spectral radiance for band 6
at DN 255 and 1, respectively (W/m2 ster lm). As a
second step, Eq. (4) was used to convert the spectral
radiance of pixel to black body temperature:
T ¼ K2=Ln K1=Lkð Þ þ 1 ð2Þ
where T is the effective at satellite brightness temperature
in Kelvin; K1 = first calibration constant (W/m2 ster lm)
= 666.09, K2 = second calibration constant in Kelvin
= 1,282.7, and Lk = spectral radiance (W/m2 ster lm).
The GSTs b6 of ETM? images were subtracted from
273.15 for converting the Kelvin to Centigrade (Xu and
Chen 2004).
Results and discussion
Relationship between wind speed and GST, GST b6,
and PM10
The assumption of the method is that the thermal value
recorded at any pixel does not represent the true ground
radiant temperature where part of the temperature is con-
tributed by the atmospheric pollution (scattering and
absorption) especially SPM. The wind speed may also
affect the PM10 concentration (Jonsson et al. 2004) and
GST (Agarwal and Tandon 2010) which consequently may
affect GST b6 retrieval from images. In order to gain a
better understanding of the atmospheric condition during
the time when the images were taken, the relationship
between wind speed with GST, PM10 concentration and
GST b6 retrieval from images were analyzed using non-
linear correlation coefficient (NLCC) (Table 2).
The higher standard deviation (SD) in GST and GST b6
for Tehran compared to Sanandaj and Klang Valley was
probably due to the seasonal differences. The minimum SD
was obtained during winter (January) and the maximum
was in summer (August) (Table 1). The SD also may be
affected by the thickness of vegetation cover which is low
in winter and high in summer (Amanollahi et al. 2010a). In
contrast, in Sanandaj, the maximum and minimum amounts
of GST and GST b6 were obtained in summer (August) and
autumn (October) which were low. The high SD in PM10
concentration over Sanandaj could be attributed to the dust
storms from Iraq especially during summer (Amanollahi
et al. 2011b). This situation increased the PM10 concen-
trations within a short period. In tropical Klang Valley,
temperature is always between 20 and 36 �C along the year
which is similar to summer temperature. Thus, SD in GST
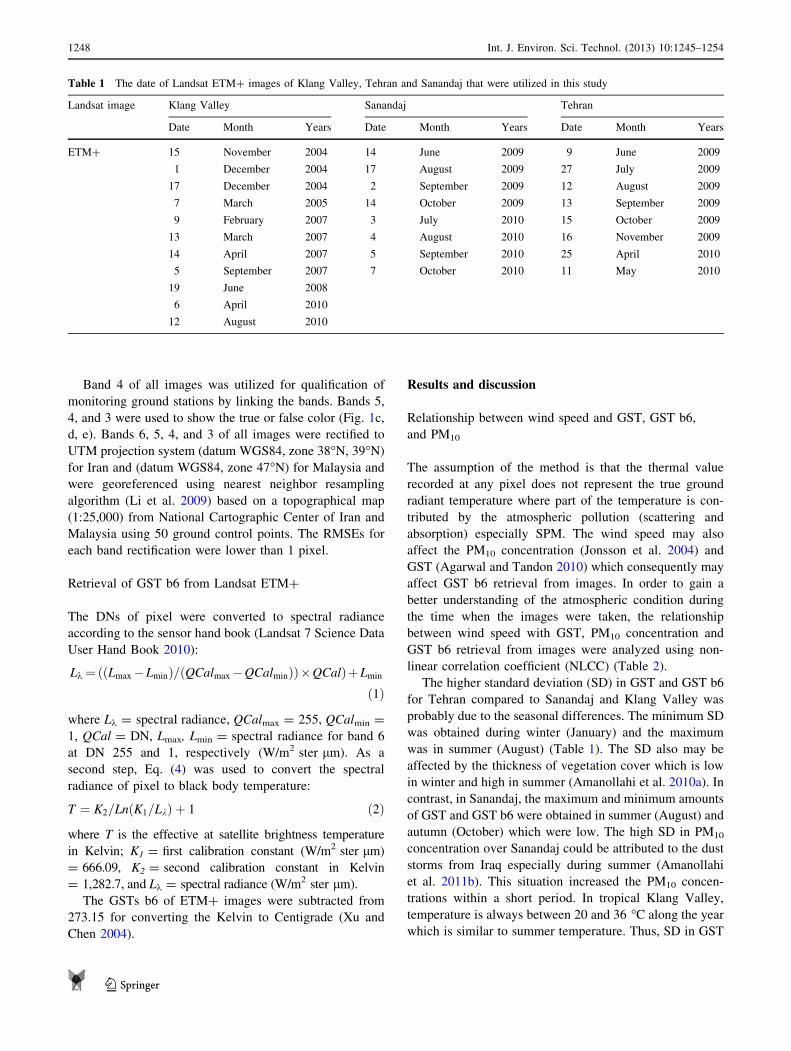
Table 1 The date of Landsat ETM? images of Klang Valley, Tehran and Sanandaj that were utilized in this study
Landsat image Klang Valley Sanandaj Tehran
Date Month Years Date Month Years Date Month Years
ETM? 15 November 2004 14 June 2009 9 June 2009
1 December 2004 17 August 2009 27 July 2009
17 December 2004 2 September 2009 12 August 2009
7 March 2005 14 October 2009 13 September 2009
9 February 2007 3 July 2010 15 October 2009
13 March 2007 4 August 2010 16 November 2009
14 April 2007 5 September 2010 25 April 2010
5 September 2007 7 October 2010 11 May 2010
19 June 2008
6 April 2010
12 August 2010
1248 Int. J. Environ. Sci. Technol. (2013) 10:1245–1254
123

and GST b6 was low. The correlation coefficients between
wind speed with GST, PM10 concentration, and GST b6
retrieved from images for all areas were low (Table 2) and
positive. These results are in contrast with the finding of
Jonsson et al. (2004) and Agarwal and Tandon (2010)
which is probably due to the low wind speed and stable
atmospheric condition during the image acquisition for all
the study areas. On the other hand, the mesoscale wind
produced by urban heat island increased the air pollution
by circulated the pollutants in upward direction (Agarwal
and Tandon 2010). This result emphasizes the fact that any
difference between GST b6 retrieval from images and GST
is due to an interaction of earth surface radiation with
atmospheric pollution, especially the PM.
Models development
The aim of atmospheric correction is to compensate the
atmospheric effect to the image (Hadjimitsis and Clayton
2009). Previous researchers used different ground targets
for removing atmospheric effects on band 6 such as lake
(Schott et al. 2001; Barsi et al. 2007) and rice crop (Coll
et al. 2010) due to their high homogeneity. Schott et al.
(2001) used water to increase the validation result of
thermal calibration of Landsat ETM?. The qualities of
water as a good thermal calibration are (1) thermal sta-
bility, (2) covering at least a few pixels, (3) a well-known
emissivity, and (4) homogeneity (Schott et al. 2001). Three
models were established to predict the PM10 concentration
in the atmosphere based on atmospheric correction method
of b6 of the study areas (Table 3). Pool in Eram Park for
Tehran, Vhadat Lake for Sanandaj, and the retention ponds
around the three stations in Klang Valley were used to
determine the TNDPG b6 in the images. In order to make
any model, the details of the parameters used in the model
should be known. Thus, GST b6 is the function of three
factors as follows:
GST b6 ¼ GSTþ AEEGS þ ES ð3Þ
where GST is the ground station temperature, AEEGS is
the atmospheric effect on emission of ground station, and
ES is the emissivity of station.
TNDPG b6 is the second parameter used in the models
and is a function of three factors as follows:
TNDPG b6 ¼ DPTþ AEEDP þ ED ð4Þ
where DPT is the dark pixel temperature, AEEDP is the
atmospheric effect on emission of dark pixel, and ED is the
emissivity of dark pixel which is 0.985 (Schott et al. 2001).
In order to determine the relationship between trends of
satellite temperature and PM10 concentration, three simple
models were empirically established based on GST b6,
GST, and TNDPG b6 (Eq. 5). The aim of the Eq. (5) is to
clarify the atmospheric effect of both emissions including
water and ground stations in the result. However, the ES
and DPT are also other parts of the result.
GST b6þ TNDPG b6�GST ¼ PMP ð5Þ
AEEGSþ GSTþ ESþ DPTþ AEEDPþ ED� GST ¼ PMP
AEEGSþ AEEDPþ 0:985þ ESþ DPT ¼ PMP
where PMP is PM predication. Eq. (6) is based on the
simple assumption that any differences between GST b6
and GST may be due to the atmospheric effects on
emission of the ground stations and also shows the AEEGS
and ES effects on the results.
GST b6�GST ¼ PMP ð6Þ
AEEGSþ GSTþ ES� GST ¼ PMP
AEEGSþ ES ¼ PMP
The aim of Eq. (7) is to eliminate the ES which depends
on the temperature, emission angle, and wavelength. For
that purpose, the AEEDP and DPT of TNDPG b6 are
subtracted from AEEGS and ES of GST b6.
TNDPG b6� GST b6�GSTð Þ ¼ PMP ð7ÞDPTþ AEEDPþ ED� AEEGSþ GSTþ ES� GSTð Þ ¼ PMP
DPTþ AEEDPþ 0:985� AEEGS� ES ¼ PMP
For a closer consideration of the trend of PM10, the
PM10 data were divided into three groups of 0–50, 50–100,
and 100 lg m-3 \PM. The results from the proposed
method were undertaken for all the data collected in
different areas in Iran and Malaysia separately. The trend
Table 2 Correlation statistics
between wind speed with GST
b6, GST, and PM10
concentration in, Petaling Jaya,
Shah Alam, and Cheras in
Malaysia as well as Sanandaj
and Tehran in Iran
Stations Wind speed GST (�C) PM10 (lg m-3) GST b6 (�C)
Min Max SD SD C.C (R) SD C.C (R) SD C.C (R)
Tehran 0 12 3.24 9.2 0.36 29 0.15 11.8 0.21
Sanandaj 0 5 1.33 5.0 0.28 120 0.16 3.8 0.29
Petaling Jaya 3.4 9 1.7 0.69 0.10 13.8 0.11 2.5 0.25
Shah Alam 4.9 14.5 3.4 1.40 0.14 19.2 0.33 3.5 0.35
Cheras 3.8 9.6 1.6 0.58 0.12 10.6 0.14 2.8 0.15
Int. J. Environ. Sci. Technol. (2013) 10:1245–1254 1249
123

Table 3 NLCC between
different empirical models of
temperature retrieval from
Landsat ETM? and PM10
concentrations over Sanandaj,
Tehran and Klang Valley
Models PM10 (lg m-3) in Iran PM10 (lg m-3) in Malaysia
0–50 50–100 100 \ PM10 0–50
(GST b6 ? TNDPG b6 - GST) 0.42 0.17 0.55 0.13
(GST b6 - GST) 0.60 0.39 0.63 0.17
TNDPG b6 - (GST b6 - GST) 0.61 0.82 0.67 0.52
Fig. 2 NLCC between
different empirical models of
temperature retrieval from
Landsat ETM? and PM10
concentrations in 50–100
(lg m-3) in Tehran Iran
Fig. 3 NLCC between different
empirical models of temperature
retrieval from Landsat ETM?
and PM10 concentrations in
50–100 (lg m-3) in Sanandaj,
Iran
1250 Int. J. Environ. Sci. Technol. (2013) 10:1245–1254
123

of NLCC for different amounts of PM10 concentration
depends on different models of GST retrieval shown in
Table 3 for all the study areas. The lowest and highest
NLCC values in the total result were obtained when (GST
b6 ? TNDPG b6 - GST) model with PM10 with
0–50 lg m-3 and TNDPG b6 - (GST b6 - GST) model
with PM10 with 0–50 lg m-3 were, respectively, used in
the analysis (Table 3).
The TNDPG b6 - (GST b6 - GST) model is found to
be more reliable compared to the other models (Table 3).
Correlation analyses were also performed to determine the
relationship between the trend of different models results
(Table 3) and PM10 concentrations (Figs. 2, 3, 4, 5, 6). The
purpose was to determine the correlation between variables
on different location. The PM10 concentrations in Iran
during the acquisition date in Sanandaj were higher than
50 lg m23 and they were lower than 50 and 100 (lg m23)
in Klang Valley and Tehran, respectively. Therefore, the
results of Table 3 for Iran in 0–50 lg m-3 and more than
100 lg m-3 of PM10 show the correlation analysis for
Fig. 4 NLCC between different
empirical models of temperature
retrieval from Landsat ETM?
and PM10 concentrations in
0–50 (lg m-3) in Petaling Jaya,
Malaysia
Fig. 5 NLCC between different
empirical models of temperature
retrieval from Landsat ETM?
and PM10 concentrations in
0–50 (lg m-3) in Shah Alam,
Malaysia
Int. J. Environ. Sci. Technol. (2013) 10:1245–1254 1251
123

Tehran and Sanandaj, respectively. Then, correlation
analyses were undertaken for PM10 concentrations in
50–100 lg m-3 for both areas in Iran (Figs. 2, 3) and
lower than 50 lg m-3 for three stations in Malaysia
(Figs. 4, 5, 6).
The highest NLCC between different models of GST
retrieval and PM10 concentrations in 50–100 lg m-3 in
Tehran was acquired when the GST b6 - (NDPT b6 - GST)
model was used in the analysis (Fig. 2). In Eq. (3), AEEGS
and ES had no effect on the result. Moreover, the different
value of AEEGS and ES in the Tehran stations (three
stations) decreased the result of Eq. (1) compared to the
result of this equation in Sanandaj (one station). This find-
ing was confirmed by the result of Table 3 for Malaysia.
As Table 3 shows, the overall result for the data of the
three stations in Eq. (1) was obtained low in Malaysia.
The highest NLCC values in three stations in Malaysia
were obtained the same for situations in Figs. 2 and 3 when
GST b6 - (NDPT b6 - GST) was used in the analysis
(Figs. 4, 5, 6). This result emphasizes that the GST b6 -
(NDPT b6 - GST) equation is more reliable than the other
two equations to predict PM10 concentration. Equation (3)
can be useful to eliminate the sensor problem of Landsat
ETM?. In Landsat ETM?, several lines of each swath are
systematically replaced by simulated values (Hadjimitsis
and Clayton 2009), which do not allow the researcher to
classify the images. However, by determining the some GT
point (depending on the study area size and assessment
accuracy of study) and using the suggested method in this
study, researchers will be able to remove the Landsat
ETM? problem. Converting the result of PM10 concen-
tration for each point with their coordinate system in the
Geographical Information System (GIS) allow the
researcher to map the distribution of PM10 concentration in
the atmosphere, as Sohrabinia and Khorshiddoust (2007)
with the help of GIS were able to map the distribution of
different ground pollution data.
Conclusion
Distribution and amount of PM concentration in atmo-
sphere have become the subjects of heated debate because
of their effect on environment and human health. In this
study, due to the limitations of MODIS products concern-
ing PM, the thermal infrared band of Landsat ETM? was
utilized to determine the PM10 concentration. Sanandaj for
its dust storms from Iraq and Tehran for its high population
and industrial points were selected as the study areas in
Iran. Three models of GST retrieval from images consist-
ing of GST b6 ? TNDPG b6 - GST, GST b6 - GST,
and TNDPG b6 - (GST b6 - GST) were used in the
analysis. PM10 concentrations were divided into three
sections including 0–50, 50–100, and 100 lg m-3\PM. In
order to prove the result of empirical equations for other
areas, three stations in the Klang Valley, Malaysia were
chosen. Results showed that the highest NLCC were
acquired when the trend of the result of TNDPG b6 -
(GST b6 - GST) and the trend of PM10 concentration in
50–100 and 0–50 lg m-3 were used in the analysis for Iran
Fig. 6 NLCC between
different empirical models of
temperature retrieval from
Landsat ETM? and PM10
concentrations in 0–50 (lg m-3)
in Cheras, Malaysia
1252 Int. J. Environ. Sci. Technol. (2013) 10:1245–1254
123
and Malaysia, respectively. The findings of this study led
the researchers to conclude that thermal band of Landsat
ETM? is useful and more reliable in determining its PM10
concentration and investigating its distribution. Using this
method and the GIS environment, researchers will be able
to overcome the Landsat ETM? problem in thermal band
about some swath with no DN.
Acknowledgments The researchers are grateful to Prof. Costas
Varotsos from University of Athens for his comments about mecha-
nism of emission and reflectance in remote sensing also we appreciate
Mrs. Kazhal Habibzadeh from Sanandaj Environment Protection
Organization for the hourly PM10 data.
References
Adamson I, Prieditis H, Vincent R (1999) Pulmonary toxicity of an
atmospheric particulate sample is due to the soluble fraction.
Toxicol Appl Pharmacol 157(1):43–50
Agarwal M, Tandon A (2010) Modeling of the urban heat island in
the form of mesoscale wind and of its effect on air pollution
dispersal. Appl Math Model 34(9):2520–2530
Al-saadi J, Szykman J, Pierce RB, Kittaka C, Neil D, Chu DA, Remer
L, Gumley L, Prins E, Weinstock L, Macdonald C, Wayland R,
Dimmick F, Fishman J (2005) Improving national air quality
forecasts with satellite aerosol observations. Bulletin of the
American Meteorological Society, 18 March 2005. American
Meteorology Society. Doi:10.1175/BAMS-86-9-1249
Amanollahi J, Abdullah AM, Ramli MF, Pirasteh S (2010a) Urban
heat island monitoring using Landsat satellite images processing,
Tehran, Iran. In: third international conference on geoinforma-
tion technology for natural disaster management and rehabilita-
tion. 19–20 October 2010, Chaiang Mai, Thailand
Amanollahi J, Kaboodvandpour SH, Abdullah AM (2010b) Evalua-
tion of the effect of heat and vegetation cover changes of Syria
desert in influences of on the recent dust storms in Iran using
Landsat satellite processing. In: 3rd international conference on
geoinformation technology for natural disaster management and
rehabilitation. 19–20 October 2010, Chaiang Mai, Thailand
Amanollahi J, Abdullah AM, Farzanmanesh R, Ramli MF, Pirasteh S
(2011a) PM10 distribution using remotely sensed data and GIS
techniques; Klang Valley, Malaysia. Environ Asia 4(1):47–52
Amanollahi J, Kaboodvandpour S, Abdullah AM, Ramli MF (2011b)
Accuracy assessment of moderate resolution image spectroradi-
ometer products before and during dust storms. Int J Environ Sci
Technol 8(2):373–380
Barsi JA, Hook SJ, Schott JR, Raqueno NG, Markham BL (2007)
Landsat-5 thematic mapper thermal band calibration update.
IEEE Geosci Remote Sens Soc Lett 4(4):552–555
Chrysoulakis N, Spiliotopoulos M, Domenikiotis C, Dalezios N
(2003). Towards monitoring of regional atmospheric instability
through MODIS/Aqua images. In: Proceedings of the Interna-
tional Symposium held at Volos, November
Coll C, Galve JM, Sanchez JM, Caselles V (2010) Validation of
Landsat-7/ETM? Thermal band calibration and atmospheric
correction with ground based measurements. IEEE Trans Geosci
Remote Sens 48(1):547–555
EQR (2006) Malaysia Environmental Quality Report 2006. Available
online at: http://www.doe.gov.my/en/content/environmental-
quality-report-eqr-2006
Gupta P, Christopher SA, Box MA, Box GP (2007) Multiyear satellite
remote sensing of particulate matter air quality over Sydney,
Australia. Int J Remote Sens 28(20):4483–4498
Hadjimitsis DG, Clayton CRI (2008) The use of an improved
atmospheric correction algorithm for removing atmospheric
effects from remotely sensed images using an atmosphere-
surface simulation and meteorological data. Meteorol Appl
15(3):381–387
Hadjimitsis DG, Clayton CLR (2009) Determination of aerosol
optical thickness through the derivation of an atmospheric
correction for short-wavelength Landsat TM and ASTER image
data: an application to areas located in the vicinity of airports at
UK and Cyprus. Appl Geomat 1(1–2):31–40
Hadjimitsis DG, Retalis A, Clayton CRI (2002) The assessment of
atmospheric pollution using satellite remote sensing technology
in large cities in the vicinity of airports. Water Air Soil Pollut
Focus 2(5–6):631–640
Hadjimitsis DG, Clayton CRI, Hope VS (2004) An assessment of the
effectiveness of atmospheric correction algorithms through the
remote sensing of some reservoirs. Int J Remote Sens
25(18):3651–3674
Haywood J, Boucher O (2000) Estimates of the direct and indirect
radiative forcing due to tropospheric aerosols: a review. Rev
Geophys 38(4):513–543
IDOE (2009) Iran Department of environmental. Available online at
http://kordestan.epo.ir/
IMO (2010) Iran meteorological organization. Available online at
http://www.weather.ir/farsi/
Jonsson P, Bennet C, Eliasson I, Selin LE (2004) Suspended
particulate matter and its relations to the urban climate in Dar
es Salaam, Tanzania. Atmos Environ 38(25):4175–4181
Kampe TU (2008) Data analysis from remote sensing to better
constrain emission and transport of carbonaceous aerosol and
carbon monoxide resulting from burning processes. PhD thesis,
Colorado University, p 272
Kaufman YJ (1989) The atmospheric effect on remote sensing and its
correction. In: Asrar G (ed) Theory and application of optical
remote sensing. Wiley, New York, pp 336–428
Kaufman YJ, Wald AE, Remer LA, Gao BC, Li RR, Luke F (1997)
The MODIS 2.1- m channel—correlation with visible reflectance
for use in remote sensing of aerosol. IEEE Trans Geosci Remote
Sens 35(5):1268–1298
Kaufman YJ, Tanre D, Boucher O (2002) A satellite view of aerosols
in climate systems. Nature 419:215–223
King MD, Kaufman YJ, Menzel P, Tanr ED (1992) Determination of
cloud, aerosol and water vapor properties from the moderate
resolution imaging spectrometer (MODIS). IEEE Trans Geosci
Remote Sens 30(1):2–27
Krewski D, Bumett RT, Goldberg MS, Hoover K, Siemiatycki J, Jerrett
M, Abrahamowicz A, White WH (2000) Reanalysis of the Harvard
six cities study and the American Cancer Society study of particulate
air pollution and mortality: a special report of the Institute’s Particle
Epidemiology Reanalysis Project. Health Effects Institute, Cam-
bridge. Available online at: http://pubs.healtheffects.org/getfile.php
Landsat 7 Science Data User Handbook (2010) Available online
at: http://Landsathandbook.gsfc.nasa.gov/handbook.html (Last
accessed 15 May 2010)
Li JJ, Wang XR, Wang XJ, Ma WC, Zhang H (2009) Remote sensing
evaluation of urban heat island and its spatial pattern of the
Shanghai metropolitan area, China. Ecol Complex 6(4):413–420
Ling-Jun L, Ying W, Qiang Z, Tong Y, Yue Z, Jun J (2007) Spatial
distribution of aerosol pollution based on MODIS data over
Beijing, China. J Environ Sci 19(8):955–960
Martonchik JV, Diner DJ (1992) Retrieval of aerosol and land surface
optical properties from multi-angle satellite imagery. IEEE Trans
Geosci Remote Sens 30(2):223–230
Mazzoni D, Logan J, Diner D, Kahn R, Tong L, Li Q (2007) A data-mining
approach to associating MISR smoke plume heights with MODIS fire
measurements. Remote Sens Environ 107(1–2):138–148
Int. J. Environ. Sci. Technol. (2013) 10:1245–1254 1253
123
MDOE (2010) Malaysian Department of Environment. Available
online at: http://www.doe.gov.my/portal/
MHME (2010) Ministry of health and Medical Education. Available
online at: http://behdasht.gov.ir//uploads/1_97_behdasht%2087
1004.pdf
MMD (2009) Malaysian Meteorological Department. Available
online at: http://www.met.gov.my/index.php?
Odabasi M, Bagiroz HO (2002) Sulfate dry deposition fluxes and
overall deposition velocities measured with a surrogate surface.
Sci Total Environ 297(1–3):193–201
Quan J, Zhang X, Zhang Q, Guo J, Vogt RD (2008) Importance of
sulfate emission to sulfur deposition at urban and rural sites in
China. Atmos Res 89(3):283–288
Retalis A (1998) Study of atmospheric pollution in large cities with
the use of satellite observations: development of an atmospheric
correction algorithm applied to polluted urban areas. PhD thesis,
Athens University, Athens
Retalis A, Cartalis C, Athanassiou E (1999) Assessment of the
distribution of aerosols in the area of Athens with the use of
Landsat Thematic Mapper. Int J Remote Sens 20(5):939–945
Schott JR, Barsi JA, Nordgren BL, Raqueno NG, Alwis DD (2001)
Calibration of Landsat thermal data and application to water
resource studies. Remote Sens Environ 78:108–117
Seinfeld JH, Pandis SN (1998) Atmospheric chemistry and physics-
from air pollution to climate change. Wiley, London, pp 1054–
1088
Sohrabinia M, Khorshiddoust AM (2007) Application of satellite data
and GIS in studying air pollution in Tehran. Habit Int 31(2):
268–275
TM (2010) Tehran municipality. Available online at: http://olden.
tehran.ir/
Wald L, Basly L, Balleynaud JM (1999) Satellite data for the air
pollution mapping. In: Nieeuwenhuis GJA, Vaugham RA,
Molenaar M (eds) Proceedings of the 18th EARseL symposium
on operational sensing for sustainable development, Enschede,
11–14 May 1998), pp 133–139
Wang J, Christopher SA (2003) Inter comparison between satellite-
derived aerosol optical thickness and PM 2.5 mass: implication
for air quality studies. Geophys Res Lett 30(21):2095–2099
Wang T, Li S, Jiang F, Gao L (2006) Investigations of main factors
affecting tropospheric nitrate aerosol using a coupling model.
China Particuol 4(6):336–341
WHO (2005) Air Quality Guidelines global update 2005. Report on a
Working Group meeting, 18–20 October, Bonn. Available online
at: http://www.euro.who.int/document/e87950
Williams R, Suggs J, Rea A, Leovic K, Vette A, Croghan C, Sheldon
L, Rodes Ch, Thomburg J, Ejire A, Herbst M, Sanders W (2003)
The research triangle park particulate matter panel study: PM
mass concentration relationships. Atmos Environ 37(38):5349–
5363
Xu HQ, Chen BQ (2004) Remote sensing of the urban heat island and
its changes in Xiamen City of SE China. J Environ Sci
16(2):276–281
Yun HJ, Yi SM, Kim YP (2002) Dry deposition fluxes of ambient
particulate heavy metals in a small city, Korea. Atmos Environ
36(35):5449–5458
1254 Int. J. Environ. Sci. Technol. (2013) 10:1245–1254
123