development of simulation based side airbag algorithm
TRANSCRIPT
7. LS-DYNA Anwenderforum, Bamberg 2008
© 2008 Copyright by DYNAmore GmbH
Development of Simulation Based Side Airbag Algorithm
Chin-Hsu Lin GM Research & Development
Warren, MI 48090 U.S.A.
Peter Erb, Thomas Kiefer, Steffen Frik
Adam Opel GmbH GME Engineering
IPC S1-01 D-65423 Ruesselsheim
Germany
Summary: The use of math-based tools has reduced the need for hardware prototyping and testing, which in turnreduces a vehicle’s development time and cost. LS-DYNA has been extensively utilized in the crashworthiness community to improve vehicle crashworthiness and to enhance occupant protectionto meet institutional regulations and in-house requirements. This side airbag sensing simulation study is a part of a sequence of pilot studies to determine the possibility of using LS-DYNA to aid in side airbag sensing system development. We adopted the modeling techniques identified from previous studies and identified additional necessary enhancements to generate a high fidelity finite element vehicle model. A single vehicle model was used to simulate a suite of side impact tests, andacceleration signals from the simulations were extracted. The simulated crash signals were processedto obtain acceleration in local coordinates and eliminate the signal aliasing issue. The processedacceleration data was then given to the sensor supplier to determine the side airbag deploymenttimes. Results from this analytical study strongly suggest that LS-DYNA may be used to aid in side airbag sensing system development. Keywords: Automotive, side impact, simulation, sensing calibration, airbag deployment
Passive Sicherheit II
E - II - 1

7. LS-DYNA Anwenderforum, Bamberg 2008
© 2008 Copyright by DYNAmore GmbH
1 Introduction Various forms of calculated [1] and filtered acceleration signals from side impact sensors and the sensing and diagnostic module can be used in the calibration process to determine the side airbag deployment times, which in general are much earlier than airbag deployment times in frontal impacts. Accelerations calculated from full vehicle finite element analysis have very different frequency contents from the tests, and it can be a challenging task to meet the requirements by using simulations. The side impact calibration crash matrix in this study covers all sensing algorithm calibration events. Some crash events had repeated tests for correlation. The impact events included the Euro-NCAP moving deformable barrier and pole impacts, rear lateral pole impact, side Danner impact, and car-to-car side impact at 900, 300, and 1500. The target airbag triggering times were determined by sensing performance engineers to ensure timely deployment of the airbag for occupant protection. Immunity tests, such as the door slam, hammer blow, bicycle hit, curb hit, etc., were not included in this study since they can be conducted more efficiently and economically in the test laboratories.
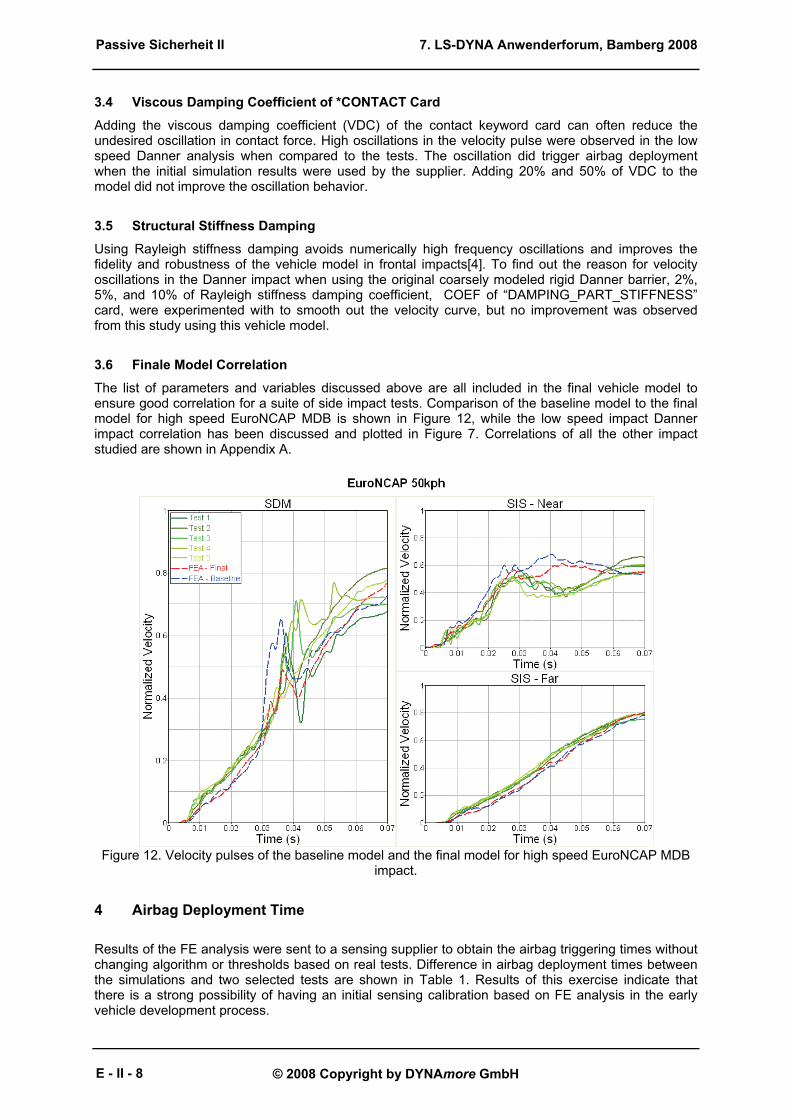
2 Baseline Vehicle Model The baseline FEA model, shown in Figure 1, was originally developed to evaluate structural and occupant performance for the regulatory tests. Analyses are completed using the LS-DYNA version 970.5434 on IBM high performance computers. To account for the thinning thickness and residual plastic strain from the stamping process, components shown in Figure 2 went through stamping analysis before being assembled for the full vehicle analysis. Velocity correlations at the SDM (Sensing and Diagnostic Module) and the SIS (Side Impact Sensor) locations of the original model were not conducted since it was specifically built to evaluate occupant and structure performances only. However, intruding velocity at the mid-section of the B-pillar and the front door were correlated with available tests, and the correlations were reasonably good. Correlations of the intruding velocity at those locations have significant effects on occupant injury indices since the intrusions are directly imposed on the occupant in the side impact tests. Vehicle pulses obtained from the impact test are mainly from accelerometers mounted on the vehicle. The accelerometer measures the accelerations or decelerations in a fixed local coordinate system that translates and rotates with the component that the accelerometer is mounted on. Accelerations from the model are extracted using two methods; one uses “ELEMENT_SEATBELT_ACCELEROMETER”, which has nodal acceleration output in the local coordinate system, and the other has nodal output from an adjacent node that has nodal history in the global coordinate system. For the nodal output in the global coordinate system, mathematical transformation [8] needs to be performed to generate the needed accelerations in the local coordinate system. Simulated velocity time history from the global coordinate system can not be compared directly with test results since the velocity from the tests is in the local coordinate system and erroneous conclusions may be reached from such a comparison. Specifically “velocity” from tests is calculated by integrating the local acceleration which is filtered through the SAE 180 class filter. The FEA velocity curves shown in this paper are properly processed as the tests. [I find the preceding sentence confusing. Perhaps you could more explicitly state what it means for the curves to be “properly processed as the tests.”] The simulation result of a 50kph MDB (Moving Deformable Barrier) impact using the original baseline model is plotted against the results of duplicate tests in Figure 3. Correlating to a single outlier or mistaken test without other reference tests can result in a waste of effort and incorrect conclusions. Observe that the simulated velocity is somewhat within the band of test variations before the required airbag deployment time. Also observe that the velocity at the SIS on the near impact side is slightly over predicted, and the SDM and SIS at the far side are slightly under predicted, when comparied with the tests. A standard numbering scheme for the possible sensor locations was established for ease of identification. Some possible sensor locations are shown in Figure 4, and the nodes encircled in red are the production sensor locations. Both left and right side impact sensors mounted at the lower B-
Passive Sicherheit II
E - II - 2
7. LS-DYNA Anwenderforum, Bamberg 2008
© 2008 Copyright by DYNAmore GmbH
pillar on the rocker panel and the SDM seated on the center tunnel are selected for correlating crash pulses with available tests.
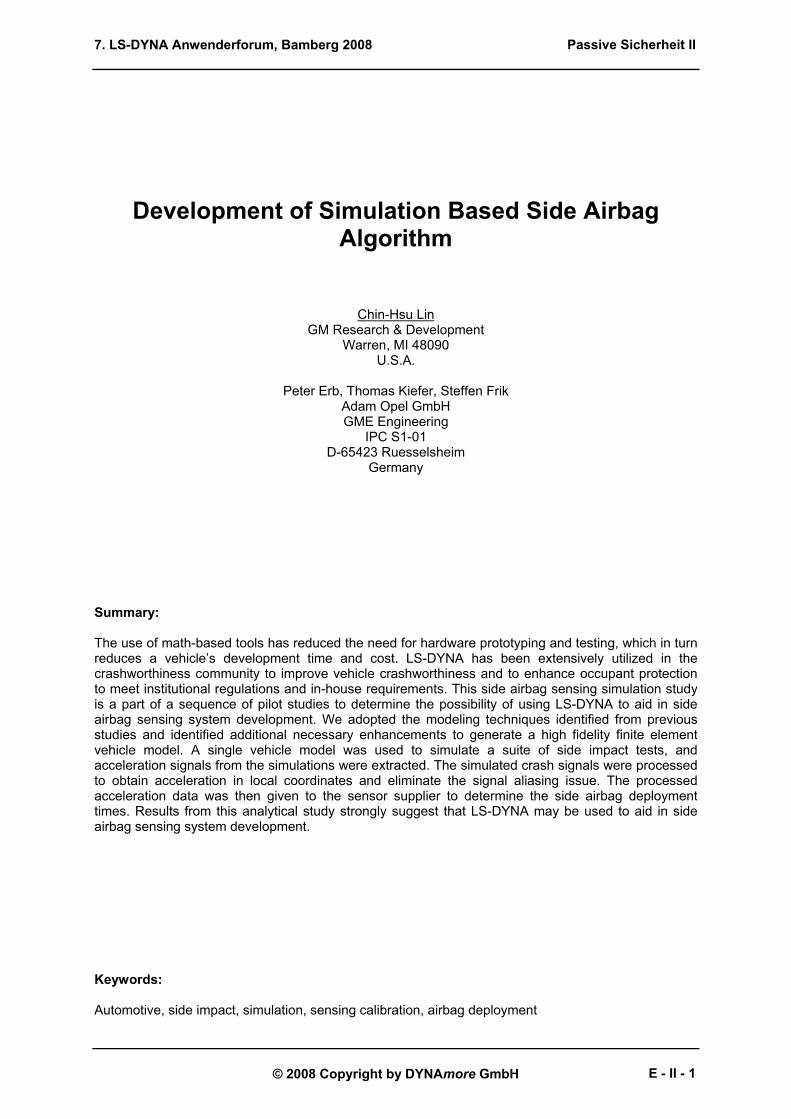
Figure 1. The baseline model.
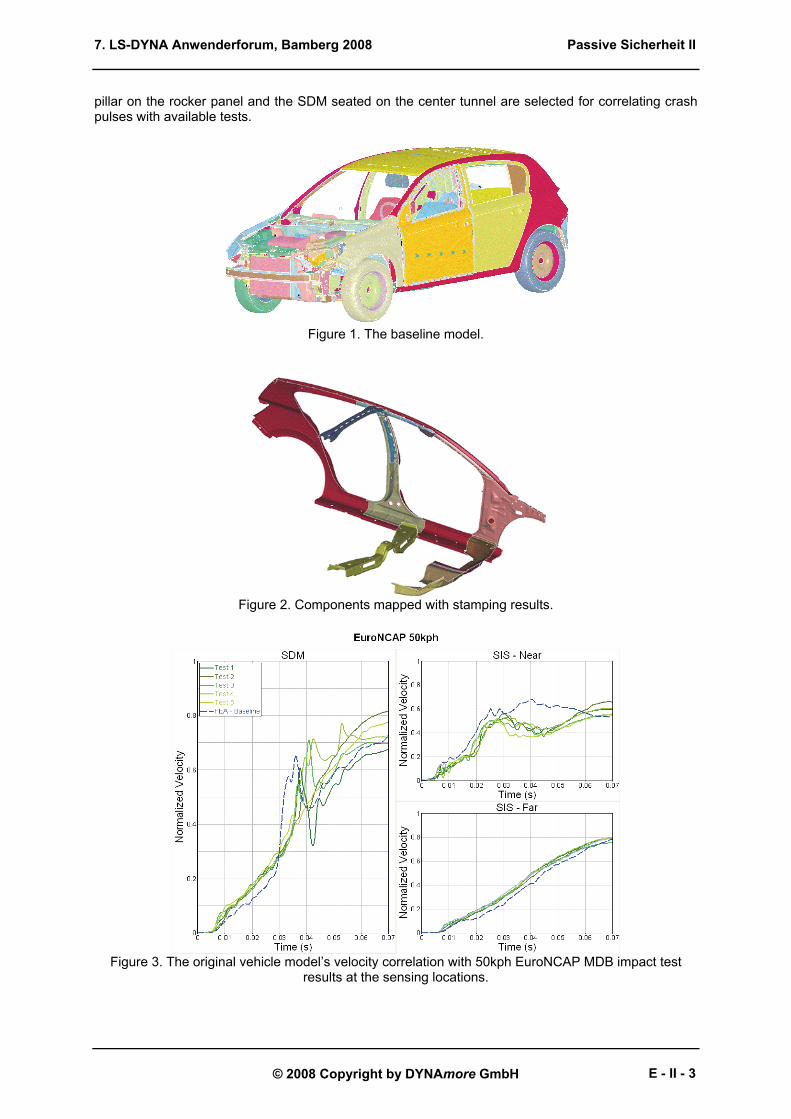
Figure 2. Components mapped with stamping results.
Figure 3. The original vehicle model’s velocity correlation with 50kph EuroNCAP MDB impact test
results at the sensing locations.
Passive Sicherheit II
E - II - 3

7. LS-DYNA Anwenderforum, Bamberg 2008
© 2008 Copyright by DYNAmore GmbH
Production sensor location
Figure 4. Sensor locations.
3 Model Enhancement For Side Impact Sensing Simulations The original vehicle model was built to evaluate occupant performance and structural integrity in a side impact, and we modified it for side impact sensing simulations based on previous lessons learned [2, 4, 5, 6, 7]. A suite of side barrier impact tests were simulated using the enhanced model, and the post-processed acceleration data from these simulations were sent to the sensing supplier to determine the side airbag deployment time for each event with the calibration installed in the production vehicle. It was found from this first exercise that the side Danner impact simulation triggered the airbag, while other impact events have comparable airbag deployment times with the physical tests. Further investigations revealed that the magnitude of the oscillations around 20 msec at the sensor location on the struck side was much bigger than the magnitude in the tests, as shown in Figure 5, and this noisy signal crossed a threshold determined from the physical tests and hence triggered the system.
Figure 5. Velocity correlation of side Danner impact of the first enhanced model.
The original rigid Danner model has a very coarse mesh to represent the flat surfaces and smaller element size for the regions with curvature, as shown in Figure 6(a). To reduce the amount of oscillation, it was decided that a finer and uniformly meshed side Danner barrier model, shown in Figure 6(b), may be necessary for sensing simulation. The coarse rigid Danner barrier, shown in Figure 6(a), was originally used in the rear Danner impact for evaluating structural performance, and the overly simplified mesh may cause un-evenly distributed contact forces in simulations and induce the oscillation seen in such a low speed impact. This coarse model has very few elements to represent the flat surfaces and a somewhat smaller element size for the regions with curvature. Simulation of this refined Danner rigid barrier model did lessen the previous oscillations at the two side impact sensors throughout the entire time history, as shown in Figure 6(c). A much improved low speed side Danner impact simulation is obtained and shown in Figure 7. Results of this improved
Passive Sicherheit II
E - II - 4

7. LS-DYNA Anwenderforum, Bamberg 2008
© 2008 Copyright by DYNAmore GmbH
simulation do not trigger the side airbag system as required for side sensing calibration. Effects of the change of these parameters on high speed crash or low speed impact simulations, Euro NCAP barrier or Danner Impacts, were studied in detail in the following sections.
(a) Non-uniformed coarse mesh model (b) Re-meshed uniformed model
(c) Velocity history at SIS for different mesh size Danner model
Figure 6. Smoother velocity pulse at the SIS from using Danner barrier with uniformed and smaller mesh size.
Figure 7. Velocity pulses of the baseline model and the final model for low speed Danner impact.
3.1 Variables in *CONTROL_SHELL
Shell type 16 is applied to a small set of a main side impact load carrying structure, while the majority of the structures use computational efficient Belytschko-Tsay (BT) element. The BT shell is very
Passive Sicherheit II
E - II - 5

7. LS-DYNA Anwenderforum, Bamberg 2008
© 2008 Copyright by DYNAmore GmbH
sensitive to warped elements, which tend to produce less accurate results. To add warping stiffness to BT elements and improve solution accuracy, the BWC is set to 1 to add the Belytschoko-Wong-Chiang warping stiffness. PROJ is set to 1 to use the full projection method to overcome the shortcoming of drill projection in rigid body rotations, and IRNXX is set to -2 to update the normal direction of a shell surface based on the nodal rotation. Change in shell thickness is also included by turning on ISTUPD. We found that the velocity at the left SIS improved slightly, as shown in Figure 8. In the plot, velocity time history in red is the baseline result and velocity time history in blue is the result from selecting the parameters described above.
Figure 8. Velocity histories for baseline model and model with more computational expensive
parameters of the keyword *CONTROL_SHELL.
3.2 Hourglass Control Formulation
For automotive crashworthiness analysis, the Flanagan-Beltyschko stiffness form hourglass control, by setting the parameter IHQ equals to 4 or 5 in *CONTROL_HOURGLASS, are recommended. The exact volume integration hourglass control types, IHQ=3, 5, or 6, pass the patch test[9], while 1, 2 and 4 do not. The use of exact volume integration for solid elements can improve analysis quality for irregular hexahedra elements or well meshed hexahedras which are going though large distortion. The parameter IHQ has been changed from 4 to 5 to study the effect of the change and some improvement is observed at the SIS location, shown in Fig. 9.
Figure 9. Velocity histories for baseline model with IHQ=4 and modification with IHQ=5.
Passive Sicherheit II
E - II - 6

7. LS-DYNA Anwenderforum, Bamberg 2008
© 2008 Copyright by DYNAmore GmbH
3.3 Parameter SOFT of *CONTACT Card
The use of the SOFT=2 option in the *CONTACT keyword card invokes a segment-based contact algorithm. With this selection, contact between segments is treated instead of the standard node-to-surface contact search. The segment based contact does not eliminate the initial penetration (same as IGNORE=1 of *CONTROL_CONTACT). By tracking the initial penetration as the baseline and referencing the penetration force to the baseline, a new baseline can be re-established if the segments move apart during the simulation. The use of the segment-based contact algorithm improves the correlation for SIS in general for the high speed Euro-NCAP barrier impact and SDM with the timing of the velocity spike around 35 msec, shown in Figure 10. However in another Euro-NCAP barrier vehicle simulation, the use of SOFT=2 for the Euro deformable barrier has caused unrealistic deformation behavior. The cause of such a deformation is not clear and requires further investigation. The use of SOFT=2 when including both the vehicle and rigid barrier models has greatly improved the velocity correlation and alleviated the numerical oscillations in the low speed Danner impact. The combination of the finer Danner model and this contact parameter selection contribute to the improvement shown in Figure 11, and the simulation results satisfied the calibration requirements. By using the SOFT=2 option, the computation time for the model increases by 26%.
Figure 10. Velocity histories for baseline model SOFT=1 and selection of SOFT=2
Figure 11. Velocity histories for baseline mode with SOFT=1 and SOFT=2
Passive Sicherheit II
E - II - 7
7. LS-DYNA Anwenderforum, Bamberg 2008
© 2008 Copyright by DYNAmore GmbH
3.4 Viscous Damping Coefficient of *CONTACT Card
Adding the viscous damping coefficient (VDC) of the contact keyword card can often reduce the undesired oscillation in contact force. High oscillations in the velocity pulse were observed in the low speed Danner analysis when compared to the tests. The oscillation did trigger airbag deployment when the initial simulation results were used by the supplier. Adding 20% and 50% of VDC to the model did not improve the oscillation behavior.
3.5 Structural Stiffness Damping
Using Rayleigh stiffness damping avoids numerically high frequency oscillations and improves the fidelity and robustness of the vehicle model in frontal impacts[4]. To find out the reason for velocity oscillations in the Danner impact when using the original coarsely modeled rigid Danner barrier, 2%, 5%, and 10% of Rayleigh stiffness damping coefficient, COEF of “DAMPING_PART_STIFFNESS” card, were experimented with to smooth out the velocity curve, but no improvement was observed from this study using this vehicle model.
3.6 Finale Model Correlation
The list of parameters and variables discussed above are all included in the final vehicle model to ensure good correlation for a suite of side impact tests. Comparison of the baseline model to the final model for high speed EuroNCAP MDB is shown in Figure 12, while the low speed impact Danner impact correlation has been discussed and plotted in Figure 7. Correlations of all the other impact studied are shown in Appendix A.
Figure 12. Velocity pulses of the baseline model and the final model for high speed EuroNCAP MDB
impact.
4 Airbag Deployment Time Results of the FE analysis were sent to a sensing supplier to obtain the airbag triggering times without changing algorithm or thresholds based on real tests. Difference in airbag deployment times between the simulations and two selected tests are shown in Table 1. Results of this exercise indicate that there is a strong possibility of having an initial sensing calibration based on FE analysis in the early vehicle development process.
Passive Sicherheit II
E - II - 8

7. LS-DYNA Anwenderforum, Bamberg 2008
© 2008 Copyright by DYNAmore GmbH
Table 1. Calibration results from supplier Airbag deployment time difference from real tests Test
Test A (msec) Test B (msec) Side Danner No Deployment Both No Trigger Both No Trigger Car-to-Car 900 Low Speed -14* No Trigger in Test Car-to-Car 900 Mid Speed +5** -7
Rear Lateral Pole -0.5 -1 EuroNCAP Side Pole -0.5 +2.5
Euro NCAP MDB 0 -0.5 Car-to-Car 1500 -7 -4 Car-to-Car 300 -1 +5
*: negative means that the simulation has the deployment time later than the test **: positive means that the simulation has the deployment time faster than the test
5 Conclusion The modeling techniques for building a high fidelity side sensing vehicle finite element model were presented and one single vehicle model was used to accurately simulate a suite of impact tests. The simulation results were then fed to a sensing calibration system to obtain airbag deployment times. Results from this numerical study suggest that it is very plausible to use finite element analysis to aid in the sensing development process. With the development of such a modeling capability, calibration of the side sensing system can be conducted earlier while some of the impact tests are not yet available during the integration phase. When the complete side sensing tests are available in the later phase of the vehicle program, the calibrated sensing system determined earlier can then be readjusted using the actual test data.
6 Acknowledgments Many colleagues, Matthias Graffe, Stanislaw Klimek, Thomas Kirch, Ralf Kippenberger, Dietmar Wagner, and Yi-Pen Cheng have been generous in giving us their valuable time to discuss the project and providing us with help in vehicle modeling and simulation. Their supports are greatly appreciated.
7 Literature [1] Sala, Dorel, Wang, J. T., Lin, Chin-Hsu and Neal, Mark O., “Dual Sensor Crash Sensing
System”, US Patent No. 6,756,889. [2] Lin, Chin-Hsu, Neal, Mark O., and Wang, J.T., “Can Finite Element Models be Used to aid in
Calibrating a Crash Sensing System”, ASME 2000 International Design Engineering Technical Conference.
[3] Chou, C.C., Le, J., Chen, P., and Bauch, D., “Development of CAE Simulated Crash Pulses for Airbag Sensor Algorithm/Calibration in Frontal Impacts,” 17th International Technical Conference on the Enhanced safety of Vehicles, Amsterdam, June 4-7, 2001.
[4] Lin, Chin-Hsu, Neal, Mark O., and Wang, J.T., “A Case Study of FEA-Based Crash Sensing System Calibration", International Journal of Vehicle Design, 2002, vol. 29, pp.269-287
[5] Lin, Chin-Hsu, Neal, Mark O., Wang, J.T., “Modeling And Simulations of Frontal Impact Crash Sensing Tests”, June, 2002. ASME International Mechanical Engineering Congress & Exposition, New Orleans, Lousiana, Nov. 17-22, 2002.
[6] Lin, Chin-Hsu and Wang, J.T., “Modeling and Simulation of Body-On-Frame Vehicles For Frontal Impact Sensing Tests”, ASME International Mechanical Engineering Congress & Exposition, Chicago, Nov. 4-10, 2006
[7] Lin, Chin-Hsu, “Modeling and Simulation of Van For Side Impact Sensing Tests”, 20th Enhanced Safety Vehicles Conference, Lyon, France, June18-22, 2007
[8] Thomas Kiefer, Peter Erb, Bernd Gosolits, and Radu Visinescu, Simulation of Airbag Sensing Signals Using Finite Element Method, LS-DYNA User Forum 2004, DYNAmore, Bamberg, Germany, 14-15 October, 2004.
[9] Leonard E. Schwer, Samuel W. Key, Thomas A. Pucik, Lee P. Bindeman, An assessment of the LS_DYNA Hourglass Formulations via the 3D Patch Test, 5th European LS-DYNA Users Conference, Birmingham, United Kingdom, May 25~26, 2005.
Passive Sicherheit II
E - II - 9

7. LS-DYNA Anwenderforum, Bamberg 2008
© 2008 Copyright by DYNAmore GmbH
8 Appendix A
Figure A1. Correlation of Euro NCAP moving deformable impact
Figure A2. Correlation of Euro NCAP pole impact
Figure A3. Correlation of rear lateral pole impact
Passive Sicherheit II
E - II - 10
7. LS-DYNA Anwenderforum, Bamberg 2008
© 2008 Copyright by DYNAmore GmbH
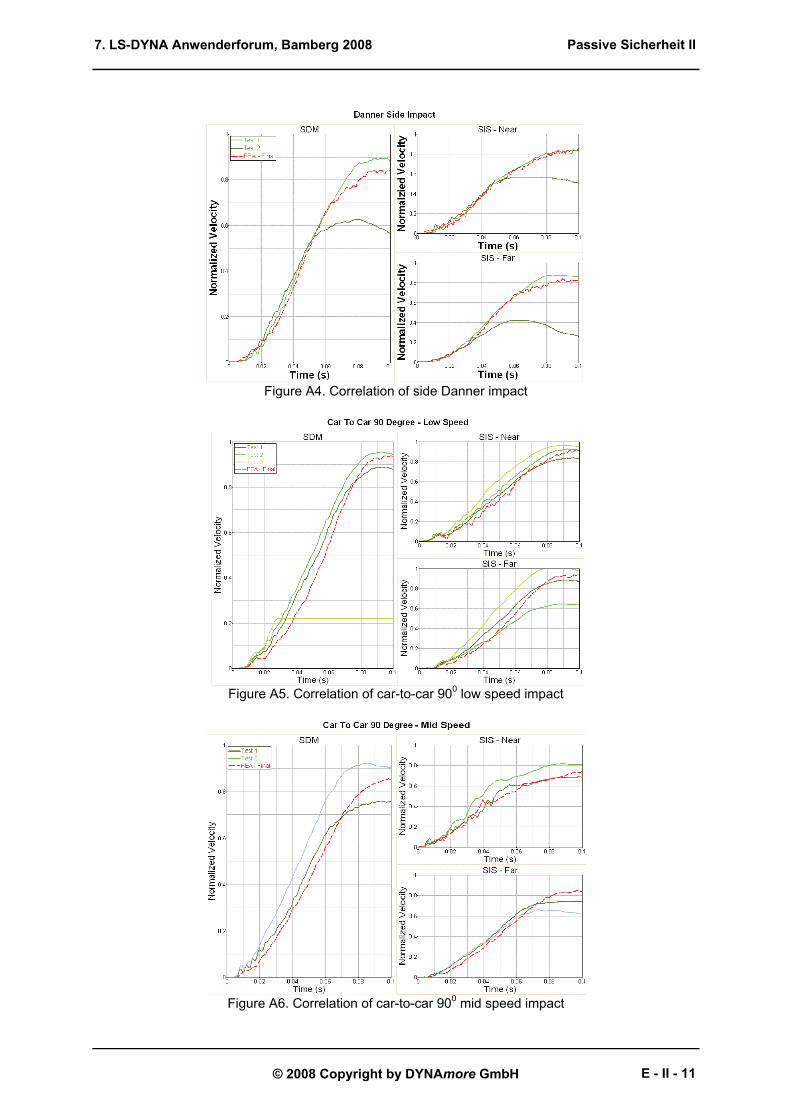
Figure A4. Correlation of side Danner impact
Figure A5. Correlation of car-to-car 900 low speed impact
Figure A6. Correlation of car-to-car 900 mid speed impact
Passive Sicherheit II
E - II - 11
7. LS-DYNA Anwenderforum, Bamberg 2008
© 2008 Copyright by DYNAmore GmbH
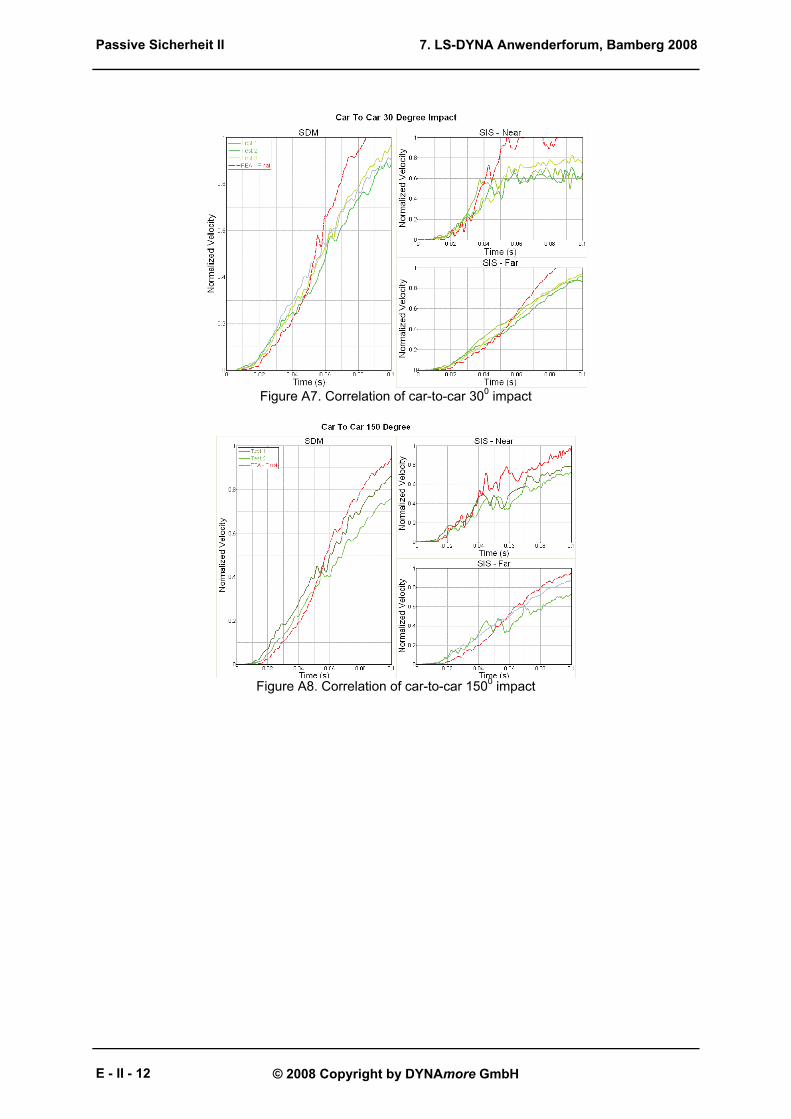
Figure A7. Correlation of car-to-car 300 impact
Figure A8. Correlation of car-to-car 1500 impact
Passive Sicherheit II
E - II - 12