development of refrigerant charge indicator and dirty air
TRANSCRIPT

ORNL/CON-489
Development of Refrigerant Charge Indicator and Dirty Air Filter Sensor
February 2003 Prepared by V. C. Mei F. C. Chen Z. Gao

ii
DEVELOPMENT OF REFRIGERANT CHARGE INDICATOR AND DIRTY AIR FILTER SENSOR
Viung C. Mei Fang C. Chen Zhiming Gao
February 2003
Prepared by OAK RIDGE NATIONAL LABORATORY
Oak Ridge, Tennessee 37831-6070 managed by
UT-BATTELLE, LLC for the
U.S. DEPARTMENT OF ENERGY under contract DE-AC05-00OR22725

iii
CONTENTS LIST OF FIGURES .................................................................................................................. v
ABSTRACT............................................................................................................................ vii
1. INTRODUCTION .............................................................................................................. 1
2. TECHNICAL OBJECTIVES ..............................................................................................3
3. ANTICIPATED BENEFITS ...............................................................................................3
4. TECHNICAL APPROACH.................................................................................................4
4.1. REFRIGERANT CHARGE INDICATOR ..................................................................4
4.2. DIRTY AIR FILTER INDICATOR.............................................................................8
5. LABORATORY TESTS .....................................................................................................9
5.1. COOLING MODE TESTS ...........................................................................................9
5.2. HEATING MODE TESTS ...........................................................................................9
6. TEST DATA AND DISCUSSION....................................................................................10
6.1. CHARGE INDICATOR TESTS- HEAT PUMP COOLING MODE OPERATION....
............................................................................................................................................10
6.2. CHARGE INDICATOR TESTS- HEAT PUMP HEATING MODE OPERATION
............................................................................................................................................13
6.2.1. Orifice Plate Expansion Devices on Outdoor Coil ..........................................16
6.2.2. Thermal Expansion Valve on Outdoor Coil ....................................................16
6.3. DIRTY AIR FILTER TESTS .....................................................................................17
7. CONCLUSIONS................................................................................................................22
8. SUGGESTED FUTURE WORK ......................................................................................23
iv
FIGURES
1. Pre-prototype charge indicator with analog technology..........................................................4
2. R-22 charge vs evaporator coil temperature for an off-the-shelf air conditioner .......................6
3. Cooling capacity as a function of outdoor temperature and refrigerant charge .........................7
4. A typical case of heat pump coil temperature as a function of refrigerant charge .....................8
5. A typical case of liquid subcooling as a function of refrigerant charge....................................8
6. A typical indoor coil temperature as a function of refrigerant charge, 95°F ambient,
80°F and 52% RH indoor , 800 cfm..................................................................................... 10
7. Error analysis of test data for liquid subcooling................................................................... 11
8. Indoor airflow ~ 800 cfm................................................................................................... 12
9. Indoor airflow ~ 600 cfm................................................................................................... 12
10. Outdoor coil temperature (section A coil) as a function of refrigerant charge at 800 cfm
and 47°F ambient............................................................................................................... 14
11. Liquid subcooling as a function of refrigerant charge at 800 cfm and 47°F ambient............... 14
12. Error analysis for heating mode operation with short-tube expansion device ......................... 15
13. Liquid subcooling as a function of refrigerant charge and outdoor temperature at 800 cfm..... 15
14. Typical heating mode operation with a TXV on outdoor coil, 800 cfm indoor air flow rate .... 16
15. Typical heating mode operation with a TXV on outdoor coil, 600 cfm indoor air flow rate .... 16
16. Typical heating mode operation with a TXV on outdoor coil, 400 cfm indoor air flow rate .... 17
17. Test data error analyses..................................................................................................... 18
18. Effect of indoor airflow rate on heat pump exit air temperature, heating mode, with TXV ..... 18
19. Effect of indoor airflow rate on heat pump exit air temperature, heating mode,
with orifice plate................................................................................................................ 19
20. Effect of indoor airflow rate on heat pump exit air temperature, cooling mode,
with orifice plate............................................................................................................... 19
21. Effect of indoor coil air flow rate on system heating capacity, with TXV.............................. 20
22. Effect of indoor coil air flow rate on system heating COP, with TXV................................... 20
23. Effect of indoor air flow rate on compressor pressure ratio, with TXV.................................. 21

v
ABSTRACT The most common problems affecting residential and light commercial heating, ventilation, and air-conditioning (HVAC) systems are slow refrigerant leaks and dirty air filters. Equipment users are usually not aware of a problem until most of the refrigerant has escaped or the air filter is clogged with dirt. While a dirty air filter can be detected with a technology based on the air pressure differential across the filter, such as a “whistling” indicator, it is not easy to incorporate this technology into existing HVAC diagnostic equipment. Oak Ridge National Laboratory is developing a low-cost, nonintrusive refrigerant charge indicator and dirty air filter detection sensor. The sensors, based on temperature measurements, will be inexpensive and easy to incorporate into existing heat pumps and air conditioners. The refrigerant charge indicator is based on the fact that when refrigerant starts to leak, the evaporator coil temperature starts to drop and the level of liquid subcooling drops. When the coil temperature or liquid subcooling drops below a preset reading, a signal, such as a yellow warning light, can be activated to warn the equipment user that the system is undercharged. A further drop of coil temperature or liquid subcooling below another preset reading would trigger a second warning signal, such as a red warning light, to warn the equipment user that the unit now detects a leak and immediate action should be taken. The warning light cannot be turned off until it is re-set by a refrigeration repairman. To detect clogged air filters, two additional temperature sensors can be applied, one each across the evaporator. When the air filter is accumulating buildup, the temperature differential across the evaporator will increase because of the reduced airflow. When the temperature differential reaches a pre-set reading, a signal will be sent to the equipment user that the air filter needs to be changed. A traditional refrigerant charge indicator requires intrusion into the system to measure the refrigerant high-side and low-side pressures. Once the pressures are known, based on the equipment’s refrigerant charging chart? or in most cases, based on the technician’s experience? the refrigerant charging status is determined. However, there is a catch: by the time a refrigeration technician is called, most of the refrigerant has already escaped into the atmosphere. The new technology provides a real-time warning so that when, say, 20% of the refrigerant has leaked, the equipment users will be warned, even though the equipment is still functioning properly at rated capacity. Temperature sensors are becoming very accurate and very low in cost, compared with pressure sensors. Using temperature sensors to detect refrigerant charge status is inherently nonintrusive, inexpensive, and accurate. With the addition of two temperature sensors for detecting dirty air filters, the capability of the diagnostic equipment is further enhanced with very little added cost. This report provides laboratory test data on the change of indoor coil refrigerant temperature and subcooling as a function of refrigerant charge for a 2-ton split heat pump system. The data can be used in designing the indicators for refrigerant loss and dirty air filter sensors.

vi
ACKNOWLEDGMENTS
We appreciate the support for this project and guidance provided by Esher Kweller, Terry Logee and Arun Vohra of the U.S. Department of Energy Office of Energy Efficiency and Renewable Energy. The project was conducted by Oak Ridge National Laboratory. Oak Ridge National Laboratory is managed by UT-Battelle, LLC for the U.S. Department of Energy under contract DE-AC05-00OR22725.

1
1. INTRODUCTION Despite advances made in the energy efficiency of systems used to heat, cool, and ventilate residential and commercial buildings in the United States, the primary energy consumption of these buildings continues to increase. From the period 1998 to 2000, primary energy consumption in residential buildings increased from 183 to 189 Mbtu/household; in commercial buildings, it increased from 251 to 254 kBtu/ft2 1. While much of this increase may be the result of growth in plug loads, it should be recognized that as plug loads increase, there is a corresponding increase in the energy needed for space conditioning (heating, ventilation, and air-conditioning, or HVAC), and it is therefore important to implement efficient HVAC equipment and keep it operating at design efficiencies. Efficient HVAC systems are available, and markets for them are growing; however, effective methods of making owners/occupants aware of decreases in system performance over the longer term are lacking. Even a poorly maintained HVAC system can continue to meet space conditioning loads, and often the occupant or building owner is unaware of a poorly-performing unit. However, the operating efficiency of this poorly performing unit is decreased so that it consumes much more electrical energy than it did when it was first installed. The methods and means to ensure that the “as- installed” efficiencies of HVAC systems continue to be realized over the lifetime of the system are an area that has been generally ignored by the industry and by the user community. The fact that about 30% of peak electrical power consumption is due to HVAC equipment in buildings means that improvements in maintaining HVAC equipment at peak efficiency would have major benefits in terms of reduced national energy consumption. Refrigerant undercharge and leaks and air filters clogged by accumulated lint and dust are among the most common problems that cause chiller and air-conditioning systems to operate inefficiently. A real- time warning device for such problems in their early stages could warn equipment users to take action and thus save energy and reduce refrigerant leakage to the atmosphere. There is a need, in the continuous commissioning of HVAC equipment, for a simple, accurate, nonintrusive, low-cost device that can be integrated into all new air-conditioning and refrigeration equipment or retrofitted onto existing equipment for verifying the status of the refrigerant charge and the cleanliness of the air filter. If equipment is undercharged, capacity and efficiency may be greatly reduced; the loss in efficiency can be 30% or more. However, most owners will not notice their air conditioners are not working properly until almost all the refrigerant has leaked out. Much of the difficulty stems from the time it takes to verify that the system is not properly charged, whether because the system was undercharged or because a leak has developed. An improper refrigerant charge is most obvious in window air conditioners, split-system types of air conditioners, and heat pumps for small buildings. A low-cost, nonintrusive charge indicator installed in the equipment has the potential to substantially reduce the impact of an improper charge by detecting it early, resulting in substantial energy savings. Environmental concerns associated with refrigerant leaking into the atmosphere will be alleviated as well.
1 A Look at Residential Energy Consumption in 1997. Energy information Administration. DOE/EIA-0632 (97). 1997.
2
Dirty air filters are often ignored by equipment users, particularly in the residential sector. A dirty filter can substantially reduce HVAC system efficiency; continuous cost-effective monitoring of the air filter will prevent an efficiency loss. The current technology for detecting a refrigerant undercharge or leak is to measure both the refrigerant liquid temperature and the suction superheat. Intrusion into the system is often required because refrigerant high-side and low-side pressure measurements are needed. Traditionally, there are three types of refrigerant leak detecting technologies: corona discharge, heated diode and ultra violet (UV). Corona discharge method uses an electric current to detect leaks. Anytime something crosses that current and breaks the current it sounds an alarm, thus detecting the leak. This technology is relatively inexpensive and can be reliable depending on the conditions under which it is used. The price to the end user for this technology is usually in the $150 to $200 range (2002 dollar). The drawback to this technology is that it can give false readings. Heated diode technology is more refrigerant sensitive. This technology uses a sensor that is looking for a specific type of component of refrigerant to set off an alarm. A pump is required to draw in the substance and because it is controlled by heat there is a certain amount of time required for warm-up. Among advantages of this technology, it is more accurate and more refrigerant specific. Among disadvantages, the user level cost ranges from $450 to $500 and there is additional time required for warm-up. The ultra violet light method for detecting leaks requires a special lamp designed for using ultra violet or black light that is looking for an oil-based dye that is highly active when the light shines on the dye. The dye is a compressor oil-based dye that is injected into an air conditioning system and circulated through the system via operation. If a leak is present, the dye will mist through at that point. Among advantages of this type of leak detection are even hard-to-find leaks will be noticeable and the dependability is better (there is no highly sophisticated technology to break down). Among disadvantages, injecting the dye can be sloppy and create false leak impressions, and not all the Original Equipment Manufacturers (OEMs) have approved the leak-detecting dyes for use with their components. The user price will vary from $300 to $400, depending on the type of kit purchased. Replacement dyes must also be purchased as needed because they are a disposable item. The aforementioned technologies, however, are used only when the users of equipment already know a leak has been developed. There is no warning in the early stage of leaks. There was one nonintrusive technology that was proposed2 for continuously monitoring the charge status. The technology was based on the dynamic measurement of the evaporator outlet refrigerant temperature, and correlates strongly with charge level. It was claimed that the measurement correlated well with the clutch cycling behavior. This technology was specifically developed for automobile application. The technology ORNL developed is to measure the evaporator coil two-phase refrigerant temperature (for window air conditioners), and/or measuring the liquid refrigerant subcooling (for split air conditioners and heat pumps). Because temperature measurement is accurate and low-cost, this technology could potentially cut the cost of detecting leaks and undercharge, and could be incorporated into the existing HVAC diagnostic sensors to expand their sensing functions.
2 Collins, C.D., N.R. Miller, and W.E. Dunn, 1997, “An Investigation of the Feasibility of Refrigerant Charge Loss Detection Using Low Cost Measurements,” SAE paper #970106, Society of Automotive Engineers, Inc.
3
2. TECHNICAL OBJECTIVES
The overall objective of this proposal is to develop a cost-effective nonintrusive refrigerant charge and air filter status indicator for air-conditioners and heat pumps to ensure that an optimal refrigerant charge is maintained and thus optimal system performance can be achieved over the life of the equipment. Other objectives are • To explore improvement in accuracy of the charge indicator by measuring the evaporator coil
two-phase refrigerant temperature, ambient temperature, and indoor air temperature • To study the soundness of the principle used to detect a dirty air filter • To study the final design of the indicator, analog or digital or any other concepts
3. ANTICIPATED BENEFITS There are many benefits of the new technology: • It is nonintrusive, simple in design, and low-cost. Because it is nonintrusive, it can
potentially be retrofitted to existing air-conditioning systems. • It is an on-the-unit feature. No knowledge of HVAC equipment is needed to use it. • It will provide one or two warning signals (or even three if an overcharged status is
desirable), through warning lights or other means, to warn the equipment user or maintenance contractor of a low system charge or leakage.
• It can provide additional signals to indicate a dirty air filter. • It can easily be incorporated into existing HVAC monitoring or diagnostic instruments
currently available on the market and has the potential to be a cost-cutting technology. • It can save energy by warning users and/or maintenance contractors to take early action
to maintain optimal refrigerant charge and clean air filters. • Air-conditioning systems usually contribute about 30% of the summer peak load of
utilities. The proposed technology has the potential to reduce the daily electricity peak load by keeping air-conditioning systems at optimum operating efficiencies.
• It provides an early indication of leaking refrigerant rather than allowing a system to lose all of its charge; therefore, it will reduce the release of refrigerant to atmosphere. Because most refrigerants have very high global warming potential, 3 it is environmentally desirable to reduce refrigerant emissions.
• It has the potential to keep electricity bills low for equipment users. • The cost of this indicator will be even lower if it is part of the air-conditioning system
(i.e., if it uses the functions of the existing control scheme on the system). This technology will make U.S.-made air-conditioners and heat pumps more competitive in
3 The warming potential for R-134A, for example, will be over 3000 times higher than that of carbon dioxide if integrated over a period of 20 years.

4
the United States and around the world, increasing employment opportunities in the United States.
4. TECHNICAL APPROACH The technical approach in this report is to develop cost-effective HVAC monitoring and diagnostic sensing technologies for residential and light commercial HVAC equipment. This approach will result in a new product for continuous commissioning to meet the needs of the HVAC field. 4.1. REFRIGERANT CHARGE INDICATOR A nonintrusive refrigerant charge indicator has been developed at ORNL (an invention disclosure and patent application have been filed). Figure 1 shows the pre-prototype charge indicator, which was based on analog technology. The principle for detecting the system refrigerant charge is simply to measure the indoor coil refrigerant two-phase temperature. When the system is properly charged, the coil temperature (in the two-phase region) will be maintained at around 45 to 50°F for summer operation. When the indoor coil temperature drops below 40°F, for example, the system is likely undercharged or possibly leaking. When the coil temperature drop sufficiently, a warning signal automatically turns on to alert the equipment user that the system has a problem. When the coil temperature drops to below 30°F (a point where about 20% of the refrigerant has been lost for a window air-conditioner), the system is likely leaking, and the cooling capacity also drops substantially. The system is operating very inefficiently at that point. Another warning signal comes on to alert the user that the equipment has a leak. Immediate attention will be needed at this stage before all the refrigerant leaks to the environment. This proof-of-concept has been successfully demonstrated on an off-the-shelf air-conditioner in the laboratory.
Fig. 1. Pre-prototype charge indicator with analog technology
5
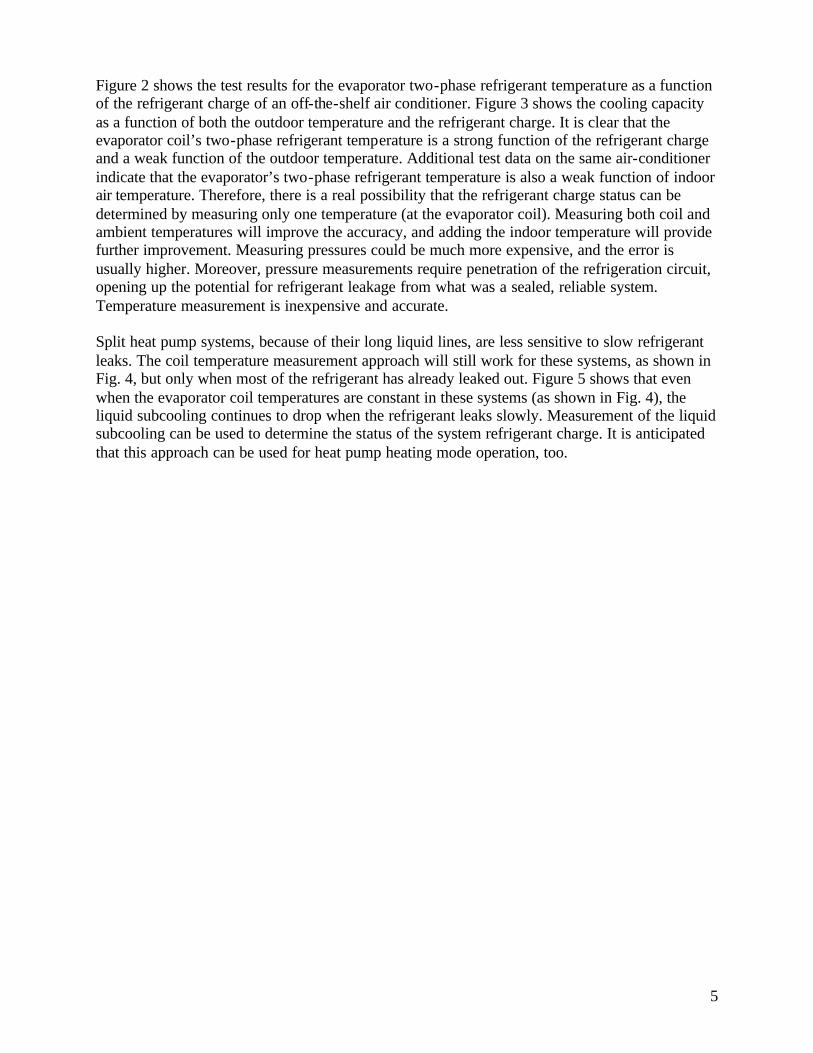
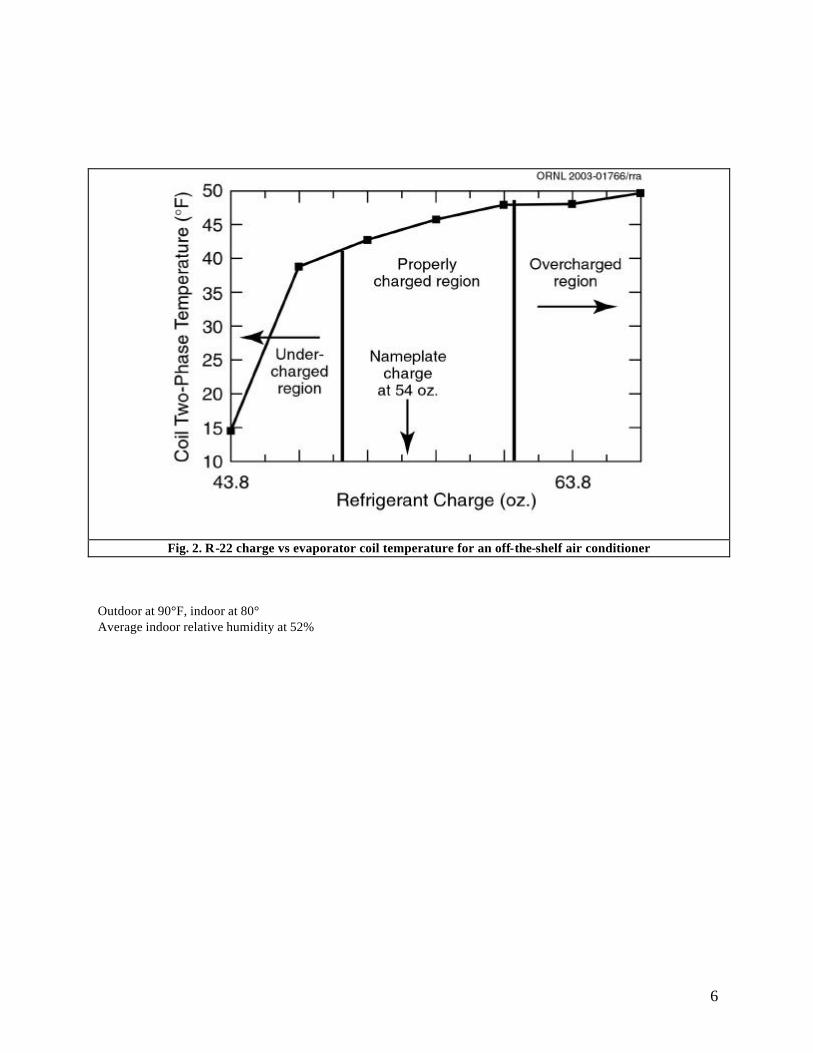
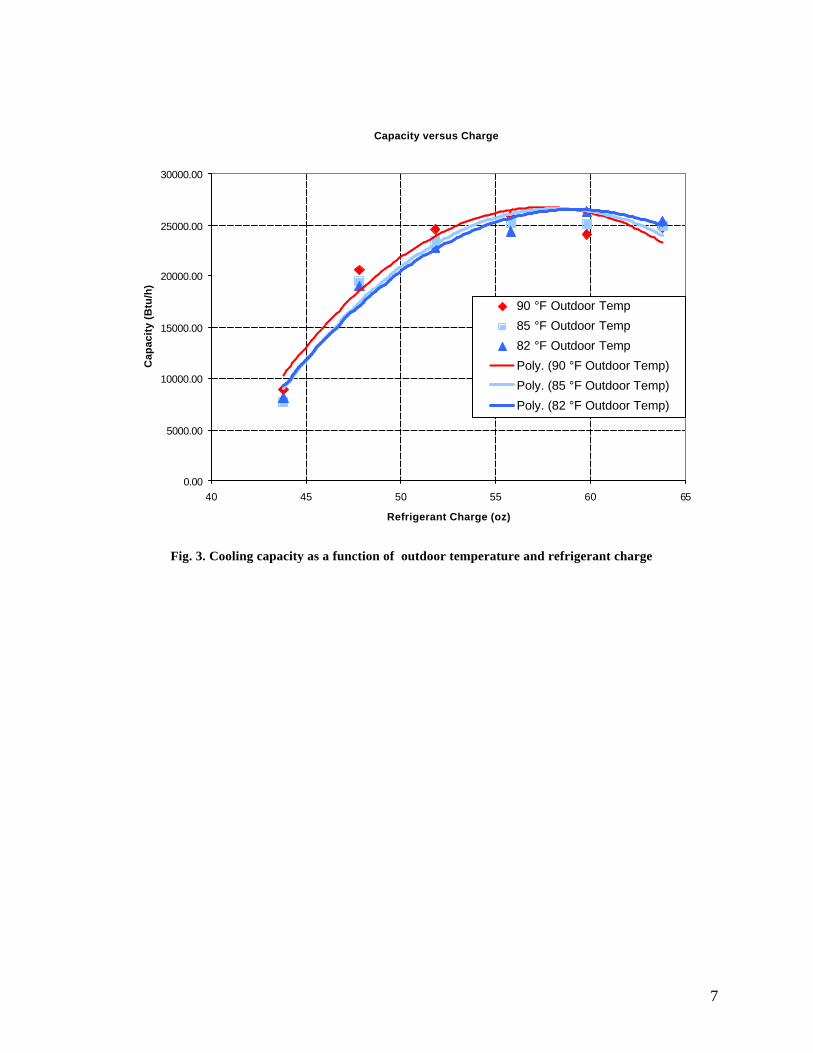
Figure 2 shows the test results for the evaporator two-phase refrigerant temperature as a function of the refrigerant charge of an off-the-shelf air conditioner. Figure 3 shows the cooling capacity as a function of both the outdoor temperature and the refrigerant charge. It is clear that the evaporator coil’s two-phase refrigerant temperature is a strong function of the refrigerant charge and a weak function of the outdoor temperature. Additional test data on the same air-conditioner indicate that the evaporator’s two-phase refrigerant temperature is also a weak function of indoor air temperature. Therefore, there is a real possibility that the refrigerant charge status can be determined by measuring only one temperature (at the evaporator coil). Measuring both coil and ambient temperatures will improve the accuracy, and adding the indoor temperature will provide further improvement. Measuring pressures could be much more expensive, and the error is usually higher. Moreover, pressure measurements require penetration of the refrigeration circuit, opening up the potential for refrigerant leakage from what was a sealed, reliable system. Temperature measurement is inexpensive and accurate. Split heat pump systems, because of their long liquid lines, are less sensitive to slow refrigerant leaks. The coil temperature measurement approach will still work for these systems, as shown in Fig. 4, but only when most of the refrigerant has already leaked out. Figure 5 shows that even when the evaporator coil temperatures are constant in these systems (as shown in Fig. 4), the liquid subcooling continues to drop when the refrigerant leaks slowly. Measurement of the liquid subcooling can be used to determine the status of the system refrigerant charge. It is anticipated that this approach can be used for heat pump heating mode operation, too.
6
Fig. 2. R-22 charge vs evaporator coil temperature for an off-the-shelf air conditioner
Outdoor at 90°F, indoor at 80° Average indoor relative humidity at 52%
7
Capacity versus Charge
0.00
5000.00
10000.00
15000.00
20000.00
25000.00
30000.00
40 45 50 55 60 65
Refrigerant Charge (oz)
Cap
acit
y (B
tu/h
)
90 °F Outdoor Temp
85 °F Outdoor Temp
82 °F Outdoor Temp
Poly. (90 °F Outdoor Temp)
Poly. (85 °F Outdoor Temp)
Poly. (82 °F Outdoor Temp)
Fig. 3. Cooling capacity as a function of outdoor temperature and refrigerant charge

8
Amana Heat Pump Charge Indicator TestingCoil C, Refrigerant Added #1, Airflow ~800 cfm
*note that airflow decreased as refrigerant was added
0
10
20
30
40
50
60
70
80
0 20 40 60 80 100 120
Total Charge (oz.)
Eva
pora
tor
Coi
l Tem
pera
ture
(°F
)
C1 C2 C3 C5 C6 C7 C8
Fig. 4. A typical case of heat pump coil temperature as a function of refrigerant charge at 82°F ambient,
800 cfm with indoor at 80°F and 52% RH
0
2
4
6
8
10
12
14
16
18
20
0 20 40 60 80 100 120
Total Charge (oz.)
Sub
cool
ing
(F)
4.2. DIRTY AIR FILTER INDICATOR
Fig. 5. A typical case of liquid subcooling as a function of refrigerant charge at 82°F ambient, 800 cfm, and indoor at 80°F and 52% RH

9
The status of the air filter can be detected with the addition of two temperature sensors, such as thermocouples, one each across the indoor coil. For normal operation at a set fan speed, the temperature differential across the indoor coil for summer cooling operation will be around 20 to 25°F. When the air filter is getting dirty, the airflow rate will start dropping. Two factors in the exit air stream will be changing: the air dry bulb temperature and the change of latent load percentage. The change in these two factors can be used to determine the air filter status. However, measuring the latent load could be troublesome because it involves measuring either the relative humidity or the air wet bulb temperature, either of which is difficult and inaccurate with conventional methods. Measuring the dry bulb temperature differential across the indoor coil is much easier and more accurate. When the temperature differential increases to, say, 30°F, the air filter probably is dirty. At 35°F, the filter probably is very dirty and should be replaced immediately. (Laboratory tests are needed to determine the proper temperature differential range.) A warning signal, such as a visual signal, can alert the equipment user that action is needed. This approach can also be used for heat pump heating mode operation or on gas furnaces, except that the temperature differential range might be different.
5. LABORATORY TESTS A two-ton split heat pump was used for the test. Both the indoor and the outdoor heat pump units have an orifice plate as the expansion device. However, the outdoor unit was retrofitted with a thermal expansion valve (TXV) and tested again. The tests were performed with the refrigerant fully charged at the beginning. The refrigerant was slowly bled back into the tank to simulate a slow leak. The amount of refrigerant charge was used as the base of the system performance. The following tests were performed. 5.1 COOLING MODE TESTS
1. Indoor airflow rate at 800 cfm and indoor dry bulb at 80°F. Outdoor ambient at 82, 85, 90, and 95 °F. The system was fully charged, 110 oz, at the beginning of the operation. The refrigerant was slowly drained back to the tank, 5 oz. each time, until the coil temperatures, or subcooling, started to drop sharply. Each test drained about 70% of the charge.
2. Repeated tests in step 1 with indoor airflow rates of 600 cfm and 400 cfm.
5.2 HEATING MODE TESTS
1. Indoor airflow rate at 800 cfm and indoor dry bulb at 70°F. Outdoor ambient at 47, 42, and 37 °F.
2. Repeated tests on step 3 with indoor airflow rates of 600 cfm and 400 cfm. 3. Outdoor orifice plate was replaced with a 2-ton TXV, and tests in steps 3 and 4 were
repeated.

10
The tests described were extensive. The test results will be used as the basis for the design of the charge indicator. The reduced airflow rate tests are designed to study the effect of a dirty air filter.
6. TEST DATA AND DISCUSSION The test data are extensive. However, they do show the viability of the concept of the charge indicator. 6.1. CHARGE INDICATOR TESTS - HEAT PUMP COOLING MODE OPERATION Figure 6 shows the evaporator coil temperatures at 95ºF ambient temperature and 80ºF and 52% relative humidity indoor conditions. The system was charged at the normal charge of 109 oz. It turned out that the coil temperature was not very sensitive to the refrigerant charge. The temperature of one section of the coil started dropping sharply after 60 oz of refrigerant was discharged, which corresponded to almost a 60% refrigerant loss, and that was not acceptable. Again, liquid subcooling should be measured to determine the charge status.
0
10
20
30
40
50
60
70
80
20 30 40 50 60 70 80 90 100 110
Total Charge (oz.)
Eva
pora
tor
Coi
l Tem
pera
ture
(°F
)
B1 B3 B4 B5 B6 B7 B8
Fig. 6. A typical indoor coil temperature as a function of refrigerant charge, 95ºF ambient, 80ºF and
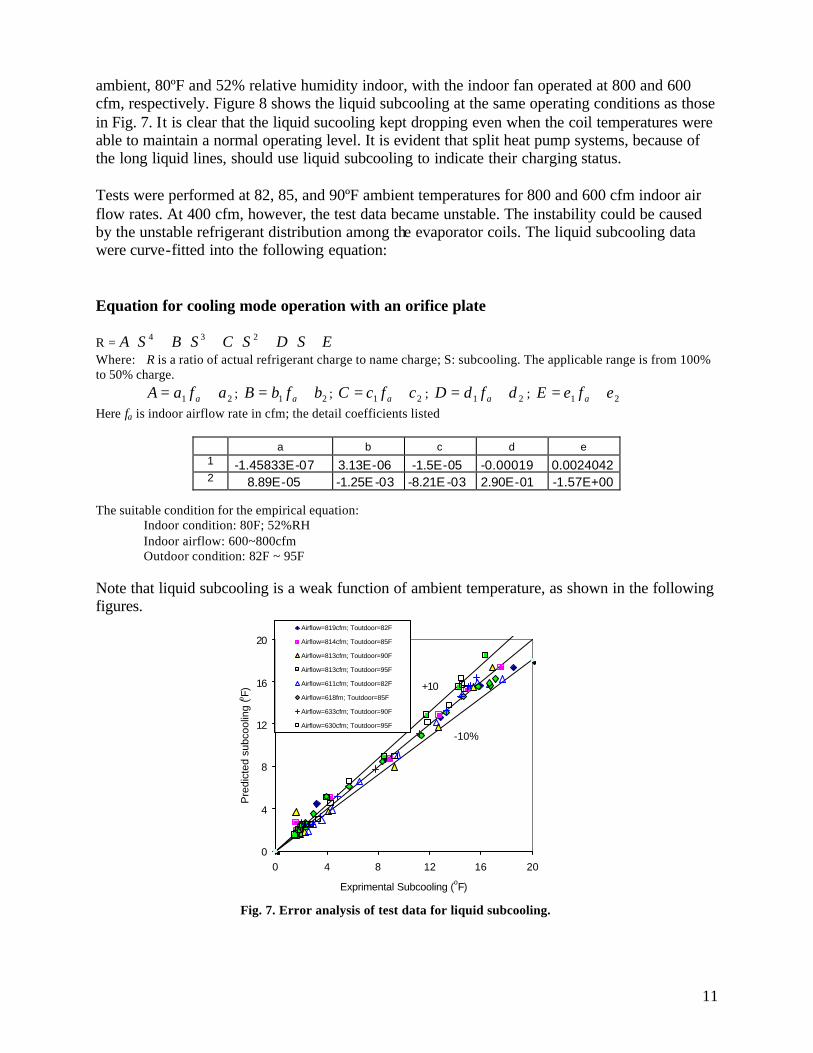
52% relative humidity indoor, 800 cfm Figures 7 shows the error analysis of the test data for liquid subcooling. It is clear that most of the data fall within the + 10% range, except at a very low liquid subcooling cooling level. Figures 8 and 9 show evaporator coil temperature as a function of refrigerant charge at 95ºF
11
ambient, 80ºF and 52% relative humidity indoor, with the indoor fan operated at 800 and 600 cfm, respectively. Figure 8 shows the liquid subcooling at the same operating conditions as those in Fig. 7. It is clear that the liquid sucooling kept dropping even when the coil temperatures were able to maintain a normal operating level. It is evident that split heat pump systems, because of the long liquid lines, should use liquid subcooling to indicate their charging status. Tests were performed at 82, 85, and 90ºF ambient temperatures for 800 and 600 cfm indoor air flow rates. At 400 cfm, however, the test data became unstable. The instability could be caused by the unstable refrigerant distribution among the evaporator coils. The liquid subcooling data were curve-fitted into the following equation: Equation for cooling mode operation with an orifice plate
R = ESDSCSBSA +⋅+⋅+⋅+⋅ 234 Where: R is a ratio of actual refrigerant charge to name charge; S: subcooling. The applicable range is from 100% to 50% charge.
21 afaA a += ; 21 bfbB a += ; 21 cfcC a += ; 21 dfdD a += ; 21 efeE a +=
Here fa is indoor airflow rate in cfm; the detail coefficients listed
a b c d e 1 -1.45833E-07 3.13E-06 -1.5E-05 -0.00019 0.0024042 2 8.89E-05 -1.25E -03 -8.21E -03 2.90E-01 -1.57E+00
The suitable condition for the empirical equation: Indoor condition: 80F; 52%RH Indoor airflow: 600~800cfm Outdoor condition: 82F ~ 95F Note that liquid subcooling is a weak function of ambient temperature, as shown in the following figures.
0
4
8
12
16
20
0 4 8 12 16 20
Exprimental Subcooling (oF)
Pre
dict
ed s
ubco
olin
g (o F)
Airflow=819cfm; Toutdoor=82F
Airflow=814cfm; Toutdoor=85F
Airflow=813cfm; Toutdoor=90F
Airflow=813cfm; Toutdoor=95F
Airflow=611cfm; Toutdoor=82F
Airflow=618fm; Toutdoor=85F
Airflow=633cfm; Toutdoor=90F
Airflow=630cfm; Toutdoor=95F
+10%
-10%
Fig. 7. Error analysis of test data for liquid subcooling.

12
0.0
4.0
8.0
12.0
16.0
20.0
0 0.2 0.4 0.6 0.8 1 1.2
Actual Charge/ Name Charge
Su
bco
olin
g (
o F)
82F85F90F95F
0.0
4.0
8.0
12.0
16.0
20.0
0 0.2 0.4 0.6 0.8 1 1.2
Actual Charge/Name Charge
Sub
cool
ing
(oF)
82F85F90F95F
Fig. 8. Indoor airflow ~ 800 cfm. Fig. 9. Indoor airflow ~ 600 cfm.
While liquid subcooling is a weak function of the ambient temperature, it is a strong function of the amount of refrigerant charge. The reason the level of liquid subcooling at a lower indoor air flow rate is not very sensitive to the refrigerant leak near full charge is that the reduced air flow rate causes the cooling capacity to be reduced, which also reduces the refrigerant flow rate. In other words, the system operates at a surplus of refrigerant charge at a lower airflow rate.

13
6.2 CHARGE INDICATOR TESTS - HEAT PUMP HEATING MODE OPERATION The original heat pump was equipped with an orifice short tube as the expansion device. The short tube is sturdy and gives the same performance as an expansion valve at the design point, but it is slightly less efficient at off-design operating conditions. After the tests were completed with the orifice plate, a TXV was installed as the outdoor coil expansion device for heating mode tests. The indoor chamber temperature was set at 70ºF. The outdoor ambient temperatures were set at 47, 42, and 37ºF. The indoor airflow rate ranged from 400 to 800 cfm to examine the effect on heating capacity and indoor air outlet temperature. It was found that when the outdoor ambient temperature was below 35ºF, frost started accumulating on the outdoor coil, which resulted in unstable heat pump performance. The ambient temperature was thus limited to 37ºF. It should also be noted that because the heat pump was charged for cooling mode operation in the Tennessee region, switching to heating mode operation would result in an excessive refrigerant charge. Under this overcharged operating condition, the system performance was not very sensitive to a refrigerant leak unless a substantial amount of refrigerant had escaped. 6.2.1 Orifice Plate Expansion Devices on Outdoor Coil Figure 10 shows typical test data with coil temperatures. Clearly the system performance was not affected by the refrigerant leak until 25% of the charge had leaked out, and then one part of the coil dried out and the coil temperature started increasing. This was not surprising because the system was overcharged to start with for heating mode operation. Figure 12 shows the error analysis for the heating mode test data. Most of the data points fall within ± 10% of the predicted values. Figure 13 shows a typical liquid subcooling measurement as a function of ambient temperature and refrigerant charge. As in cooling mode operation, the effect of ambient temperatures is relatively small. [No callout of discussion for Fig. 11.] With the effect of indoor airflow rate, the liquid subcooling, and the ambient temperature, the amount of refrigerant charge can be curve-fitted into the following equation: R = exp [(Subcooling –B)/A] Where R is a ratio of actual refrigerant charge to name charge
322
1 aTaTaA outdooroutdoor ++=
322
1 bTbTbB outdooroutdoor ++=
Here Toutdoor is outdoor temperature; fa is indoor airflow rate; the detail coefficients are as follows:
( )aa ffea log6306512.0246706.332236.11 ⋅−+⋅−= 25.1
2 4107.1072797.332345999.3 aa fefea ⋅−−−⋅−= 2
3 31605.1037328.193.112 aa fefa ⋅−+⋅−=
( )aa ffeb log5582497.0953461.230326999.11 ⋅+−⋅−−= 24161215.2
2 4275.2053967.8539.4 aa fefeb ⋅−−+⋅−=

14
24161215.23 36953.440530002.95453.140 aa fefeb ⋅−+⋅−−−=
The suitable condition for the empirical equation: Indoor condition: 70ºF; 50% relative humidity Indoor airflow: 400 ~ 800cfm Outdoor condition: 37 ~ 47ºF
Amana Heat Pump Charge Indicator TestingCoil A, Refrigerant Added #1, Airflow ~800 cfm
*note that airflow decreased as refrigerant was added
0
20
40
60
80
100
120
140
0 20 40 60 80 100 120
Total Charge (oz.)
Con
dens
er C
oil T
empe
ratu
re (
°F)
A1 A2 A3 A4 A5 A6 A7 A8
Fig 10. Outdoor coil temperature (section A coil) as a function of refrigerant charge at 800 cfm and 47ºF ambient. A1 to A8 are the “U” bends on evaporator coil section A (there are 4 coil sections on evaporator)
0
5
10
15
20
25
0 20 40 60 80 100 120
Total Charge (oz.)
Sub
cool
ing
(F)
Fig. 11. Liquid subcooling as a function of refrigerant charge at 800 cfm and 47ºF ambient.

15
0
5
10
15
20
25
30
0 5 10 15 20 25 30
Experimental Subcooling (oF)
Pre
dict
ed S
ubco
olin
g (o F)
Airflow=827cfm;Toutdoor=47F
Airflow=816cfm;Toutdoor=42F
Airflow=822cfm;Toutdoor=37F
Airflow=633cfm;Toutdoor=47
Airflow=632;Toutdoor=42F
Airflow=631cfm;Toutdoor=37F
Airflow=429;Toutdoor=47
Airflow=426;Toutdoor=42F
Airflow=431cfm;Toutdoor=37F
+10%
-10%
Fig. 12. Error analysis for heating mode operation with short-tube expansion device.
0
5
10
15
20
25
30
0 0.2 0.4 0.6 0.8 1 1.2
Actual Charge/Name Charge
Su
bco
olin
g (o F
)
47F
42F
37F
Fig. 13. Liquid subcooling as a function of refrigerant charge and outdoor temperature at 800 cfm.

16
6.2.2 Thermal Expansion Valve (TXV) on Outdoor Coil The heat pump was modified with a TXV as the outdoor coil expansion device for tests in heating mode. Systems with TXVs can tolerate a higher level of refrigerant loss and still perform well. The only way to measure the refrigerant loss is to measure the liquid subcooling, because subcooling is a function of charge regardless of the amount of refrigerant loss. Only the outdoor coil was retrofitted with a TXV to replace the original orifice plate expansion device. Figures 14, 15, and 16 show typical liquid subcooling values as a function of refrigerant charge at different indoor airflow rates.
0
10
20
30
40
50
60
70
0 0.2 0.4 0.6 0.8 1 1.2
Actual Charge/ Name Charge
Su
bco
oli
ng
(o
F)
47 F
42 F
37 F
Fig. 14. Typical heating mode operation with a TXV on outdoor coil, 800 cfm indoor airflow rate.
0
10
20
30
40
50
60
70
0 0.2 0.4 0.6 0.8 1 1.2
Actual Charge/Name Charge
Sub
cool
ing
(oF)
47 F
42 F
37 F
Fig. 15. Typical heating mode operation with a TXV on outdoor coil, 600 cfm indoor airflow rate.

17
0
10
20
30
40
50
60
70
80
0 0.2 0.4 0.6 0.8 1 1.2
Actual Charge/ Name Charge
Sub
cool
ing
(oF)
47 F
42 F
37 F
Fig. 16. Typical heating mode operation with a TXV on outdoor coil, 400 cfm indoor airflow rate.
When the airflow rate was low, frost started accumulating on the outdoor coil, which caused the performance to become unstable. An airflow rate of 400 cfm was the lowest the heat pump could tolerate without a fast accumulation of frost on the outdoor coil. Again, the test data indicate that the liquid subcooling is a weak function of the ambient temperature. The test data were curve-fitted into the following equation. R = SBA ⋅+ Where: R is a ration of actual refrigerant charge to name charge. S is subcooling. The applicable range is from 100% to 50% charge.
21 afaA a += ; 21 bfbB a +=
Here fa is indoor airflow rate in cfm; the detail coefficients listed
a b 1 1E-4 4E-6 2 0.3444 0.0066
The suitable condition for the empirical equation: Indoor condition 70; 50%RH Indoor airflow: 400~800cfm Outdoor condition: 37oF ~ 47oF 6.3 DIRTY AIR FILTER TESTS A dirty air filter will adversely affect heat pump performance. The way to simulate a dirty air filter is to reduce the airflow rate. In this study, airflow rates were tested at 800, 600, and 400 cfm for operation in both heating and cooling mode. No TXV was installed to replace the orifice plate during cooling mode because space was tight in the indoor coil area. However, both the TXV and the orifice place were tested for heating mode operation.

18
Figure 17 illustrates the test error analyses, which indicated the data were very reasonable. Figures 18, 19, and 20 show the indoor coil air exit temperatures as a function of indoor airflow rate. Clearly, the lower the flow rate, the higher the air exit temperature. Therefore, based on the air exit temperature, the level of air filter clogging can be estimated. For a properly charged heat pump, the air exit temperature should be around 105ºF at an ambient temperature of 47ºF, for example. If the measured air outlet temperature increases to 120ºF, the air filter is definitely dirty because it has reduced the airflow by 50% (Fig. 19).
0
100
200
300
400
500
600
700
800
900
0 100 200 300 400 500 600 700 800 900
Measured Air Flow (cfm)
Pre
dic
ted
Air
Flo
w (
cfm
)
TXV (Heating)
Fixed Orifice (Heating)
Fixed Orifice (Cooling)
Fig. 17. Test data error analyses.
y = 0.1772x + 111.83
y = 0.3756x + 89.228
y = 0.6271x + 88.166
100
105
110
115
120
125
30 35 40 45 50
Outdoor Temperature (oF)
Air
ou
tlet
Tem
per
atu
re (o F
) 400cfm
600cfm800cfm
Fig. 18. Effect of indoor airflow rate on heat pump exit air temperature, heating mode, with TXV

19
y = -0.7443x + 150.53
y = -0.3251x + 118.25
y = -0.5101x + 132.73
100
105
110
115
120
125
30 35 40 45 50
Outdoor Temperature (oF)
Air
ou
tlet
Tem
per
atu
re (o F
) 400cfm
600cfm
800cfm
Fig. 19. Effect of indoor airflow rate on heat pump exit air temperature, heating mode, with orifice plate
y = 0.0615x + 53.217
y = 0.0654x + 50.859
52
54
56
58
60
62
80 85 90 95 100
Outdoor Temperature (oF)
Air
ou
tlet
Tem
per
atu
re (o F
)
600cfm800cfm
Fig. 20. Effect of indoor airflow rate on heat pump exit air temperature, cooling mode, with orifice plate.
However, the indoor airflow rate should not be purposely reduced in order to achieve a higher exit air temperature. Figure 21 shows that at 50% of the nominal airflow rate of 800 cfm, the heating capacity was reduced by over 30%. Figure 22 shows that at 50% of the nominal airflow rate of 800 cfm, the heating COP dropped by over 50%. Even though the air outlet temperature could be raised by around 15ºF if the flow rate were cut from 800 to 400 cfm, reducing the flow rate is not the best way to improve indoor thermal comfort, from an energy efficiency viewpoint.

20
0.0
2.0
4.0
6.0
8.0
10.0
12.0
0 0.2 0.4 0.6 0.8 1 1.2
Actual Charge/ Name Charge
Hea
tin
g C
apac
ity
(KW
)37 F at 820cfm42 F at 824cfm
47 F at 820cfm
37 F at 644cfm
42 F at 613cfm
47 F at 614cfm
37 F at 433cfm
42 F at 426cfm
47 F at 429cfm
Fig. 21. Effect of indoor coil air flow rate on system heating capacity, with TXV.
0.0
0.5
1.0
1.5
2.0
2.5
3.0
3.5
4.0
0 0.2 0.4 0.6 0.8 1 1.2
Actual Charge/Name Charge
CO
P
37 F at 820cfm
42 F at 826cfm
47 F at 820cfm37 F at 644cfm
42 F at 613cfm
47 F at 614cfm37 F at 433cfm
42 F at 426cfm
47 F at 429cfm
Fig. 22. Effect of indoor coil air flow rate on system heating COP, with TXV.
Figure 23 shows the effect of indoor airflow rate on compressor pressure ratio. The ratio is a good indication of the compressor efficiency, thermodynamically. The lower the ratio, the higher the compressor efficiency is. Lower airflow rates, as shown in Fig. 23, indicate a higher compression ratio at a lower airflow rate; thus the heat pump’s energy efficiency is reduced.

21
4.0
5.0
6.0
7.0
8.0
9.0
10.0
11.0
0 0.2 0.4 0.6 0.8 1 1.2
Actual Charge/ Name Charge
Pre
ssu
re R
atio
37 F at 820cfm
42 F at 824cfm
47 F at 820cfm
37 F at 644cfm
42 F at 613cfm
47 F at 614cfm
37 F at 433cfm
42 F at 426cfm
47 F at 429cfm
Fig. 23. Effect of indoor air flow rate on compressor pressure ratio, with TXV.
The data can be curve-fitted into the following equations:
DTCTBTTAf exitoutdoorexitoutdoora +⋅+⋅+⋅=
Where fa is indoor airflow rate; Toutdoor is outdoor temperature; Texit is indoor airflow exit. The detail coefficients are as follows.
Mode A B C D TXV1 Heating −0.0123 11.49 −25.173 3014.4
Fixed orifice Heating 0.7970 −74.36 −61.005 6791.4 Fixed orifice Cooling 0.1738 −16.238 74.955 −3080.5
The suitable condition for the empirical equation: Heating Indoor condition: 70ºF; 50% relative humidity Indoor airflow: 400 ~ 800 cfm Outdoor condition: 37F ~ 47F Cooling Indoor condition 70)F; 52% relative humidity Indoor airflow: 600~800cfm Outdoor condition: 82 ~ 95oF The test data show that it is possible to use temperature measurements to detect dirty air filters, a method that is accurate, easy to implement, and low in cost. The temperature rise, if the system is equipped with variable speed compressor and fans, can potentially be used for the system control, if assuming the filter is clean.

22
7. CONCLUSIONS A slow refrigerant leak is one of the most common problems associated with air conditioning and refrigeration systems. A low refrigerant charge could result in energy efficiency degradation of 30% or more. The traditional way of checking the refrigerant charge status of a system involves measuring high-side and low-side pressures, along with ambient temperature. It requires the use of pressure gauges and at least one temperature sensor. However, most owners or users of HVAC equipment do not have the knowledge to interpret the results of the measurements, even if they have the proper measuring tools. A dirty air filter also can affect system performance adversely. A 50% reduction in airflow could result in a drop of more than 50% in system energy efficiency. A method of checking a refrigeration or air conditioning system refrigerant charge status by temperature measurements was conceived to resolve these issues. Temperature measurements are accurate, easy to implement, and inexpensive. The test data in this study prove that the concept of developing a refrigerant charge indicator by measuring temperatures on the heat exchanger coil is viable. With two additional temperature measurements at the indoor air inlet and outlet locations, it is possible to determine how clean an air filter is. The data presented in this report can be used to design a low-cost digital refrigerant charge indicator. A pre-prototype charge indicator was deve loped, based on test data for a window air conditioner presented in this report. The indicator will send out a signal to the owner or user of the equipment that the system is at proper charge or at low charge, or that a leak has developed. The indicator can send out a second warning signal that the system requires immediate service because the refrigerant charge is dangerously low. This approach can help the owner/user ensure that the system is always charged properly and operated at optimum system efficiency. The charge indicator will also be friendly to the environment, because prompt repair action will reduce the leakage of refrigerant to the surrounding environment to a minimum. Most important, this method will not require that equipment owners be knowledgeable about equipment operation. The indicator can also function as an air filter status sensor with the addition of two more temperature measurements. The test data presented in this report provide a database for the design of a low-cost sensor that will sense a low refrigerant charge and the level of dirt accumulation on an air filter.

23
8. SUGGESTED FUTURE WORK The report is an extensive experimental study of the development of a charge indicator. However, there are issues that have not been touched: 1. The combined effect of refrigerant loss and dirty air filter The current study for refrigerant loss was based on a clean air filter. And, the dirty air filter study was based on a properly charged heat pump, even though refrigerant loss was part of dirty air filter test. To combine the two factors together, the equations, which the refrigerant charge sensor design will be based on, will be more complicated but manageable. As the way it is, when the sensor shows a refrigerant loss, the owner will have to check the filter first. If the filter is clean, and the warning signal remains, the system is not charged properly. A leak has been developed. We can make the sensor smarter by shifting through the temperature measurements to determine whether the warning signal was caused by the refrigerant loss or by a dirty air filter, which the users of equipment do not have to second-guess the cause of the warning signal. 2. To build a charge indicator with digital technology Two analog version of the charge indicators have been built and tested. The concept of measuring temperatures at certain locations on a heat pump system has been proved. However, the digital version will be much smaller and more suitable for the real world application. 3. Field demonstration of the charge-dirty air filter indicator So far all the work was performed in the laboratory. It is important to prove the viability of the sensor. Successful test of the sensor at ORNL’s habitat house will be much more convincing to related industry for commercialization of this sensor.