development of new injury risk curves for the knee …
TRANSCRIPT

UMTRI-2009-08 June 2009
DEVELOPMENT OF NEW INJURY RISK CURVES FOR THE KNEE/DISTAL FEMUR AND THE HIP FOR
USE IN FRONTAL IMPACT TESTING
JONATHAN D. RUPP CAROL A.C. FLANNAGAN
SHASHI M. KUPPA
UMTRI-2009-08
Development of New Injury Risk Curves for the Knee/Distal Femur and the Hip for Use
in Frontal Impact Testing
Jonathan D. Rupp1 Carol A.C. Flannagan1
Shashi M. Kuppa2
1The University of Michigan Transportation Research Institute
Ann Arbor, MI 48109-2150 U.S.A.
2National Highway Traffic Safety Administration
1200 New Jersey Avenue, SE Washington, D.C. 20590
U.S.A.
June 2009
i
Technical Report Documentation Page
1. Report No.
UMTRI-2009-08 2. Government Accession No.
3. Recipientʼs Catalog No.
5. Report Date
June 2009 4. Title and Subtitle
Development of new injury risk curves for the knee/distal femur and the hip for use in frontal impact testing
6. Performing Organization Code
xxxxxx
7. Author(s) Rupp, J.D., Flannagan, C.A.C., and Kuppa, S.M.
8. Performing Organization Report No.
UMTRI-2009-08
10. Work Unit no. (TRAIS) 9. Performing Organization Name and Address
The University of Michigan Transportation Research Institute 2901 Baxter Road Ann Arbor, Michigan 48109-2150 U.S.A.
11. Contract or Grant No.
13. Type of Report and Period Covered
12. Sponsoring Agency Name and Address National Highway Traffic Safety Administration
14. Sponsoring Agency Code
15. Supplementary Notes
16. Abstract
This report describes how new injury risk curves for the knee/distal femur and the hip were developed through reanalyses of existing peak knee impact force data. New hip injury risk curves were developed using survival analysis with a lognormal distribution. This distribution was parameterized to account for the effect of stature, which was the only subject characteristic that had a statistically significant effect on the relationship between peak force applied to the hip and the risk of hip fracture. The empirically defined effects of hip flexion and abduction from a standardized seated driving posture on mean hip fracture force were also incorporated into the lognormal distribution as mean shifts. Injury risk curves for the midsize male crash test dummy were defined by applying the stature associated with this dummy and posture of 30˚ flexion and 15˚ abduction from a standard reference posture and the standard reference posture (0˚flexion, 0˚ adduction) to the lognormal distribution.
A new risk curve describing the relationship between peak force applied at the knee and the likelihood of knee/distal femur fracture was developed by applying survival analysis to an existing dataset in which there was uncensored, left censored, and right censored peak knee impact force data. This risk curve is similar to that currently used by the NHTSA to assess the risk of AIS 2+ KTH injury. Because the fracture forces in the dataset used to develop the new knee/distal femur risk curve were primarily from tests where rigid surfaces loaded the knees of elderly midsize male cadavers, the new risk curve only applies to rigid knee impacts and this segment of the occupant population. Future work should focus on developing knee/distal femur risk curves that apply to other segments of the driving population by characterizing and accounting for the effects of subject factors and impact surface rigidity on KTH fracture forces. 17. Key Words
pelvis, injury criteria, injury risk curves, FMVSS 208 18. Distribution Statement
Unlimited 19. Security Classification (of this report)
None 20. Security Classification (of this page)
None 21. No. of Pages
24 22. Price
ii

iii
1. Contents 2. List of Figures ............................................................................................................. iv 3. List of Tables ............................................................................................................... v 4. Introduction.................................................................................................................. 1 5. Methods........................................................................................................................ 2
5.1 Development of Hip Injury Risk Curves ............................................................... 2 5.2 Development of Knee/Distal Femur Injury Risk Curve ........................................ 3
6. Results.......................................................................................................................... 5 6.1 Hip Injury Risk Curves .......................................................................................... 5 6.2 Knee/Distal Femur Injury Risk Curve ................................................................... 6
7. Discussion .................................................................................................................... 8 7.1 Hip Injury Risk Curves .......................................................................................... 8 7.2 Knee/Distal Femur Injury Risk Curve ................................................................... 8 7.3 Future Research Needs .......................................................................................... 9
8. Conclusions................................................................................................................ 11 9. Appendix A................................................................................................................ 12 10. Glossary ..................................................................................................................... 15 11. Acknowledgements.................................................................................................... 16 12. References.................................................................................................................. 17

iv
2. List of Figures Figure 6.1. Fitted lognormal distribution and 95% confidence intervals on predicted
hip fracture/dislocation force. ____________________________________ 5 Figure 6.2. Hip injury risk curves for the midsize male in the standard automotive
posture and for a 30˚ flexed, 15˚ abducted posture.____________________ 6 Figure 6.3 Comparison of knee/distal femur risk curves reported by Kuppa et al. and
described by Equation 6.2._______________________________________ 7

v
3. List of Tables Table 5.1: Hip Fracture Force Data from Tests with the Hip Angles Corresponding to a
Standard Male Driving Posture ___________________________________ 3 Table 6.1. Fit of Lognormal Distribution to Hip Injury Force Data________________ 5
1
4. Introduction The process used to develop injury risk curves usually involves loading unembalmed cadavers in a manner that simulates the loading conditions that a human occupant experiences in a particular mode and severity of crash and measuring the applied loading and the resulting response and injury to the cadaver. These data are then statistically analyzed to identify an injury criterion and to develop a relationship between this criterion and the occurrence of a particular severity and type of injury.
Statistical methods that are commonly used to develop injury risk curves include logistic regression and survival analysis. Logistic regression is used when injury criteria are associated with a binary outcome. Survival analysis is used when the outcome is censored, i.e., the calculated injury criterion is either greater than or less than the value of the injury criterion that is associated with the occurrence of injury. For example, peak chest compression can be a censored injury criterion for rib fracture because rib fractures can occur prior to peak chest compression. Note that if a sensor, like a crack detection gage, is used to identify the time at which rib fractures occurs in a test, the chest compression associated with rib fracture can be determined and the association between chest compression and rib fracture is uncensored.
This report describes how injury risk curves for the hip and for the knee and distal femur were developed by reanalyzing existing datasets of forces associated with hip fracture and/or dislocation (Rupp et al. 2003 and Rupp 2006) and peak knee impact forces associated with knee and distal femur fractures (Kuppa et al. 2001). In development of both of these risk curves, survival analysis was used since the occurrence and type of censoring in the experimental datasets could be identified. Because the amount of uncensored data on hip fracture forces was large, experimental data were used to define how the risk of hip fracture varies with subject characteristics. Since the amount of uncensored data on knee and distal femur fracture was limited, it was not possible to account for the effects of subject characteristics on knee/distal femur injury risk.

2
5. Methods
5.1 Development of Hip Injury Risk Curves The peak force data and the associated subject characteristics used to develop hip injury risk curves were obtained from studies by Rupp et al. (2003) and Rupp (2006). In these studies, the knees of cadaver pelvis and lower-extremity specimens were sequentially loaded in tests where the pelvis was fixed in a controlled posture by gripping the iliac wings. Fixing the iliac wings allowed the effects of hip flexion and abduction from a standard driving posture on hip fracture force to be quantified. It also eliminated the inertially induced drop in force between the knee and the hip. Since all fixed-pelvis tests produced hip fractures or dislocations, and since there were no indications of macroscopic fracture prior to the time of peak applied force, the peak forces reported in these studies constitute an uncensored dataset of forces associated with hip injury.
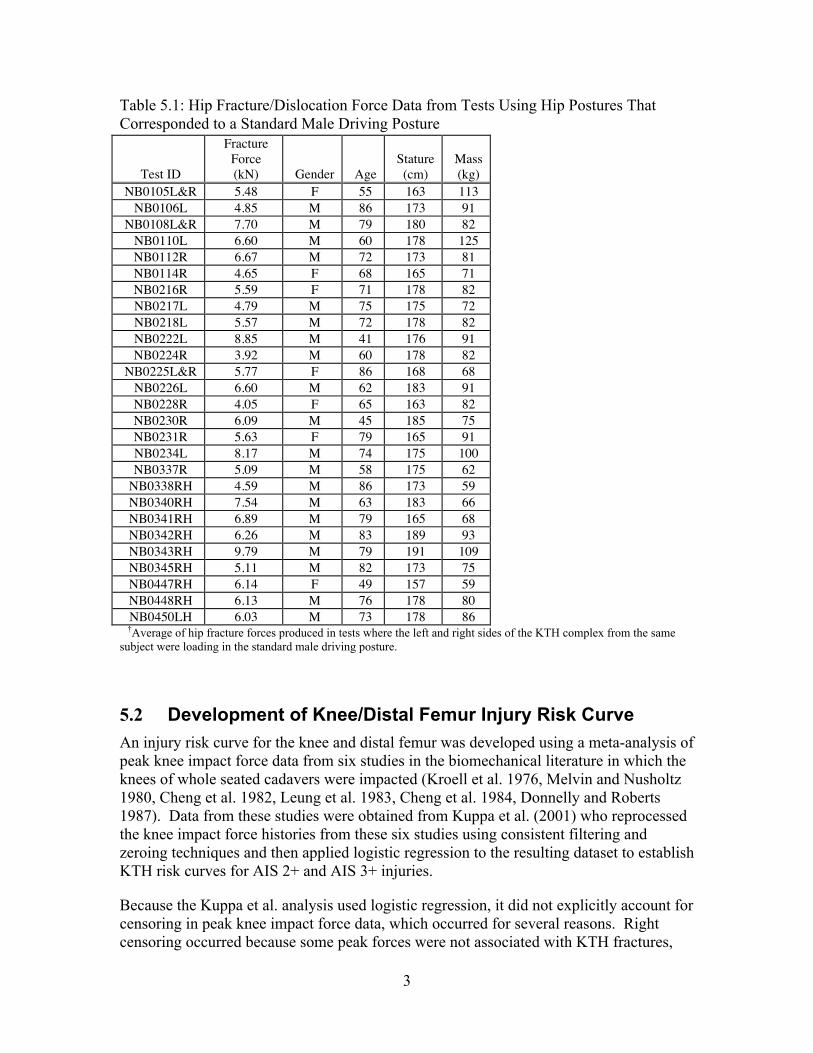
The peak forces associated with hip fracture/dislocation and the characteristics of the 27 cadavers from which specimens were obtained for fixed-pelvis tests are listed in Table 5.1. All of the fracture forces in Table 5.1 are associated with the standard driving posture for a midsize male defined by Schneider et al. (1983) because hip flexion and adduction/abduction from this posture have been shown to significantly alter hip fracture force (Rupp et al. 2003).
The data in Table 5.1 were analyzed using parametric survival analysis in SAS version 9.2 (SAS Institute Inc., Cary, N.C) with a lognormal distribution. All forces were treated as uncensored. Chi-squared tests were used to determine whether subject characteristics, including age, gender, stature, and mass, are significant predictors of the force required to produce hip fracture in the standard driving posture.
The effects of hip flexion and abduction on the force associated with hip injury were incorporated into the lognormal distribution produced by applying survival analysis to the data in Table 5.1 as mean shifts of 1% per degree of hip abduction and -1% per degree of hip flexion. These values are the effects of hip flexion and abduction from the standard automotive-seated posture on mean hip fracture/dislocation force that resulted from the fixed-pelvis tests described above.
An injury risk curve for the midsize male crash-test dummy hip was developed by applying the subject characteristics associated with this crash test dummy and a posture of 30˚ flexion and 15˚ abduction to the parametric hip injury risk curve developed from analysis of the data in Table 5.1. This posture was used because previous studies suggested that it was the approximate posture at the time of peak knee impact force in front-impact sled tests with airbag deployment (Rupp 2006, Rupp et al. 2008).
3
Table 5.1: Hip Fracture/Dislocation Force Data from Tests Using Hip Postures That Corresponded to a Standard Male Driving Posture
Test ID
Fracture Force (kN) Gender Age
Stature (cm)
Mass (kg)
NB0105L&R 5.48 F 55 163 113 NB0106L 4.85 M 86 173 91
NB0108L&R 7.70 M 79 180 82 NB0110L 6.60 M 60 178 125 NB0112R 6.67 M 72 173 81 NB0114R 4.65 F 68 165 71 NB0216R 5.59 F 71 178 82 NB0217L 4.79 M 75 175 72 NB0218L 5.57 M 72 178 82 NB0222L 8.85 M 41 176 91 NB0224R 3.92 M 60 178 82
NB0225L&R 5.77 F 86 168 68 NB0226L 6.60 M 62 183 91 NB0228R 4.05 F 65 163 82 NB0230R 6.09 M 45 185 75 NB0231R 5.63 F 79 165 91 NB0234L 8.17 M 74 175 100 NB0337R 5.09 M 58 175 62
NB0338RH 4.59 M 86 173 59 NB0340RH 7.54 M 63 183 66 NB0341RH 6.89 M 79 165 68 NB0342RH 6.26 M 83 189 93 NB0343RH 9.79 M 79 191 109 NB0345RH 5.11 M 82 173 75 NB0447RH 6.14 F 49 157 59 NB0448RH 6.13 M 76 178 80 NB0450LH 6.03 M 73 178 86
†Average of hip fracture forces produced in tests where the left and right sides of the KTH complex from the same subject were loading in the standard male driving posture.
5.2 Development of Knee/Distal Femur Injury Risk Curve An injury risk curve for the knee and distal femur was developed using a meta-analysis of peak knee impact force data from six studies in the biomechanical literature in which the knees of whole seated cadavers were impacted (Kroell et al. 1976, Melvin and Nusholtz 1980, Cheng et al. 1982, Leung et al. 1983, Cheng et al. 1984, Donnelly and Roberts 1987). Data from these studies were obtained from Kuppa et al. (2001) who reprocessed the knee impact force histories from these six studies using consistent filtering and zeroing techniques and then applied logistic regression to the resulting dataset to establish KTH risk curves for AIS 2+ and AIS 3+ injuries.
Because the Kuppa et al. analysis used logistic regression, it did not explicitly account for censoring in peak knee impact force data, which occurred for several reasons. Right censoring occurred because some peak forces were not associated with KTH fractures,
4
whereas left censoring occurred because some tests produced only patellar fractures, (which could occur prior to the time of peak force because the KTH can continue to resist loading after a patellar fracture).
In the current analysis, censoring in peak force data was accounted for by applying survival analysis with a Weibull distribution to peak-force data. All peak forces associated with tests that did not produce injury were treated as right censored, while tests that resulted in only patellar fractures were treated as left censored. Tests that only produced knee ligament injuries were treated as right censored, because these injuries have been shown to occur from posterior motion of the tibia relative to the femoral condyles rather than from peak force applied to the knee.
5
6. Results
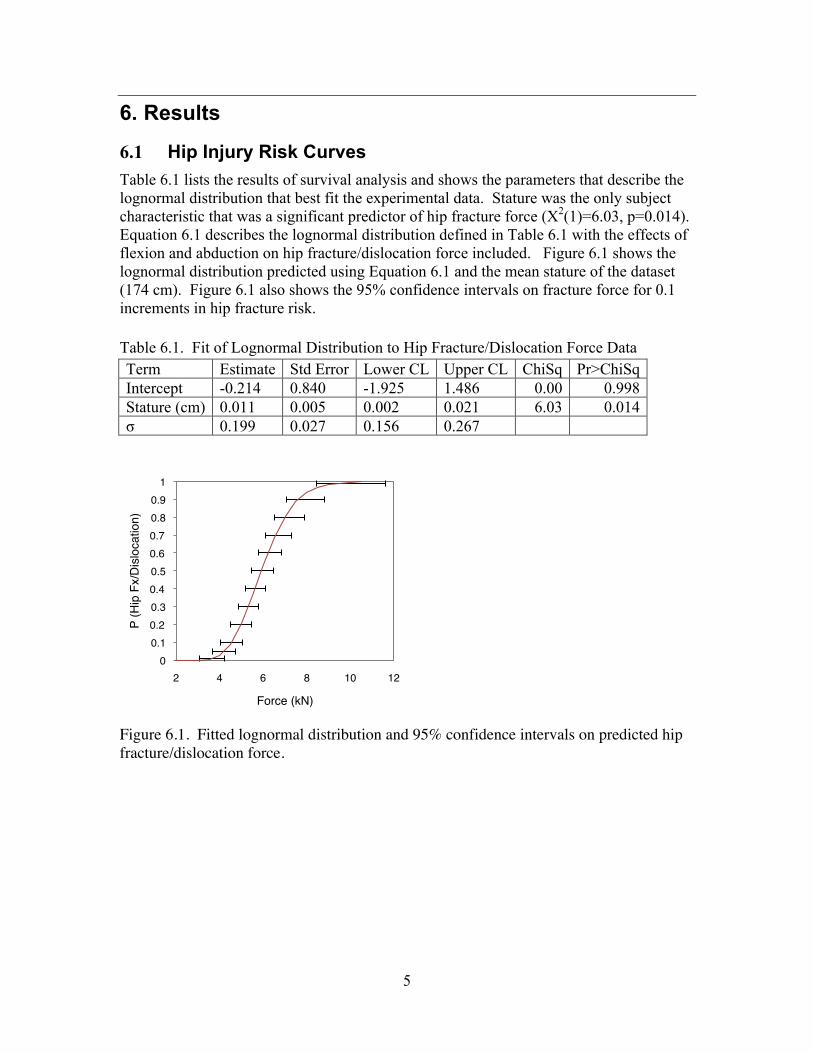
6.1 Hip Injury Risk Curves Table 6.1 lists the results of survival analysis and shows the parameters that describe the lognormal distribution that best fit the experimental data. Stature was the only subject characteristic that was a significant predictor of hip fracture force (X2(1)=6.03, p=0.014). Equation 6.1 describes the lognormal distribution defined in Table 6.1 with the effects of flexion and abduction on hip fracture/dislocation force included. Figure 6.1 shows the lognormal distribution predicted using Equation 6.1 and the mean stature of the dataset (174 cm). Figure 6.1 also shows the 95% confidence intervals on fracture force for 0.1 increments in hip fracture risk. Table 6.1. Fit of Lognormal Distribution to Hip Fracture/Dislocation Force Data Term Estimate Std Error Lower CL Upper CL ChiSq Pr>ChiSq Intercept -0.214 0.840 -1.925 1.486 0.00 0.998 Stature (cm) 0.011 0.005 0.002 0.021 6.03 0.014 σ 0.199 0.027 0.156 0.267
Figure 6.1. Fitted lognormal distribution and 95% confidence intervals on predicted hip fracture/dislocation force.
0!0.1!0.2!0.3!0.4!0.5!0.6!0.7!0.8!0.9!
1!
2! 4! 6! 8! 10! 12!
P (H
ip F
x/D
islo
catio
n)!
Force (kN)!

6
€
P(HipFX) =ΦLn[F ]− Ln[Exp[(0.2141− 0.0114s)]* (1− f + a) /100]
0.1991⎡
⎣ ⎢ ⎤
⎦ ⎥ [6.1]
where, Φ is the cumulative distribution function of the standard normal distribution, F is peak force transmitted to the hip in kN, s is the target stature, f is the hip flexion angle in degrees, and a is the hip abduction angle in degrees.
Figure 6.2 compares the midsize male hip injury risk curve in the standard automotive posture to the midsize male risk curve for a 30˚ flexed and 15˚ abducted posture.
Figure 6.2. Hip injury risk curves for the midsize male in the standard automotive posture and for a 30˚ flexed, 15˚ abducted posture.
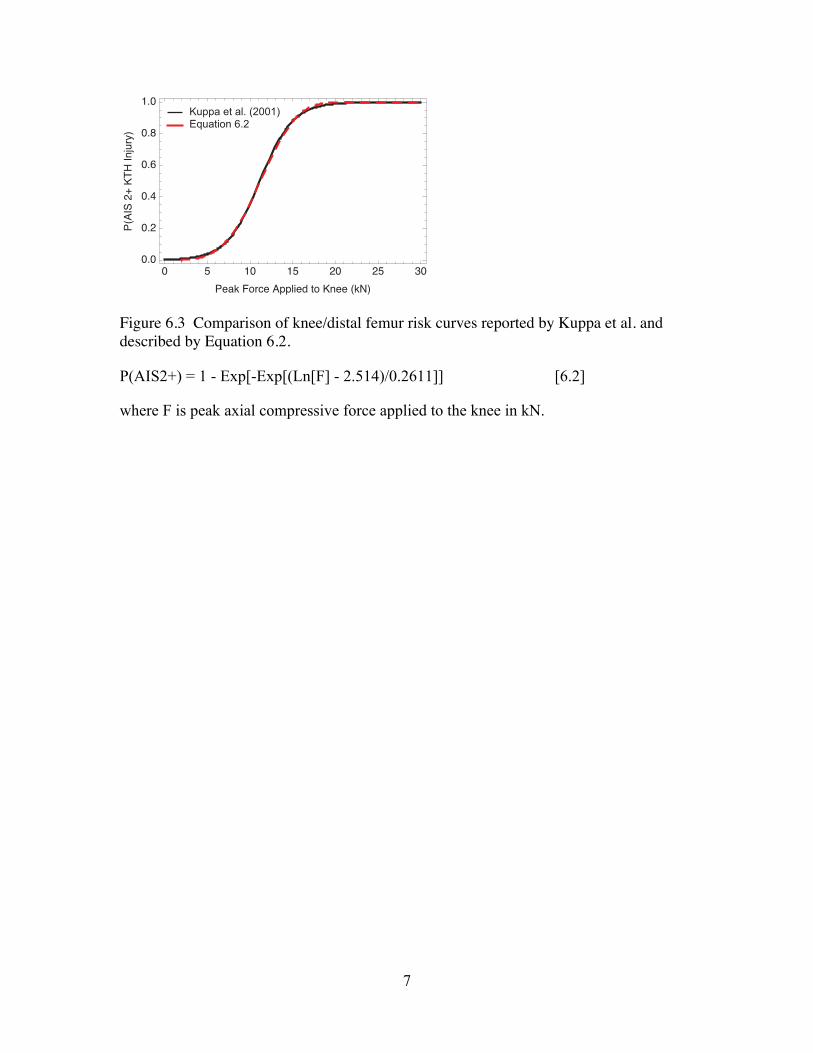
6.2 Knee/Distal Femur Injury Risk Curve Figure 6.3 compares the risk curve developed by applying survival analysis with a Weibull distribution to peak force data reported by Kuppa et al. (2001) to the Kuppa et al. risk curve developed using logistic regression on the same dataset. Equation 6.2 defines the Weibull distribution based risk curve. The two curves are almost identical, except of for small differences in the upper and lower quantiles of risk. In fact, both risk curves associate 10 kN with a 35% risk of AIS 2+ knee/distal femur injury.
0 2 4 6 8 10 120.0
0.2
0.4
0.6
0.8
1.0
Peak Force at Hip (kN)
Prob
abilit
y of H
ip FX
or D
isloc
ation
15˚ Flexed, 30˚ Abducted
0˚ Flexed, 0˚ Abducted
7
Figure 6.3 Comparison of knee/distal femur risk curves reported by Kuppa et al. and described by Equation 6.2.
P(AIS2+) = 1 - Exp[-Exp[(Ln[F] - 2.514)/0.2611]] [6.2]
where F is peak axial compressive force applied to the knee in kN.
0 5 10 15 20 25 300.0
0.2
0.4
0.6
0.8
1.0
Peak Force Applied to Knee (kN)
P(AI
S 2+
KTH
Injur
y)Kuppa et al. (2001)Equation 6.2

8
7. Discussion
7.1 Hip Injury Risk Curves Analyses of hip fracture/dislocation force data indicated that age, gender, or mass, were not significant predictors of hip fracture/dislocation force. The lack of an age effect is not surprising, since the presence of osteoporosis, which is one of the primary factors that would result in a decrease in fracture force with age, was used as an exclusion criterion in subject selection in the studies from which hip fracture force data were obtained. The lack of gender and mass effects is thought to be from an insufficient sample size to quantify these effects and is somewhat surprising since heavier people tend to have larger bones (Chumlea et al. 2001). Also, women tend to have acetabular surfaces that cover a greater portion of the surface area of the femoral head than similar sized men and should therefore experience lower acetabular stresses than men in a given posture and at a given level of acetabular loading (Wang et al. 2004).
There are several issues with the most commonly used adult frontal crash-test dummies, the Hybrid III midsize male and small female, which limit their ability to assess hip fracture risk using Equation 6.1. These include that Equation 6.1 expresses injury risk in terms of peak force at the hip while current crash test dummies only measure force in the shaft of the femur, which will always be greater than peak force at the hip because of inertial effects. Further, using Equation 6.1 to assess hip injury risk requires that crash test dummies and similar sized humans produce the similar acetabular forces under knee similar loading conditions. However, results of several studies suggest that this is not the case (Rupp et al. 2005, Rupp et al. 2009). Recent efforts are addressing these issues through the development of new adult crash-test dummies that measure acetabular force and have a more biofidelic knee impact response (e.g., Shams et al. 1999, Shams et al. 2002) as well as by developing methods that allow Hybrid III femur force histories to be used to assess hip injury risk (Rupp et al. 2009, Kuppa and Kirk 2009).
7.2 Knee/Distal Femur Injury Risk Curve A new risk curve for the knee and distal femur was developed by using survival analysis to reanalyze peak knee impact force data and the associated KTH injuries from multiple studies in the literature that were originally reported by Kuppa et al (2001). Because the injuries produced in these studies were almost exclusively knee and distal femur fractures, this new risk curve applies to the knee and distal femur and not the more proximal parts of the knee-thigh-hip complex. This is in contrast to the risk curve that Kuppa et al. generated by analyzing the same dataset, which was assumed to apply to the entire KTH complex. The new knee/distal femur injury risk curve was developed using a Weibull distribution because other choices of distribution produced risk curves that were not substantially different from that produced by the use of a Weibull distribution. Further, the use of the
9
Weibull distribution resulted in a risk curve that associated a peak force of 10 kN with a 35% risk of injury, similar to the current FMVSS 208 maximum femur force criterion. Although subject characteristics such as age, gender, stature, and mass are likely to affect the relationship between peak force applied to the knee and the probability of knee/distal femur fracture, these effects were not explored in any analyses because the variability of these parameters in the Kuppa et al. dataset (and particularly the subset of the data that contained uncensored fracture forces) was small. Assuming that subject characteristics affect injury outcome, then the knee and distal femur risk curve shown in Figure 6.3 only applies to subjects who are male and have the average stature, age, and mass of the Kuppa et al. dataset (i.e., 68 kg, 61 yrs., and ~173 cm). The effects of knee impact surface stiffness, which has been shown to affect the fracture tolerance of the knee (Atkinson et al. 1997, Meyer et al., 2003), were not explored in this study because of a lack of uncensored fracture force data from tests in which the knees were loaded with surfaces that were not rigid. Future work should focus on assembling a larger dataset of peak knee impact forces associated with KTH fracture that encompasses a greater range of subject characteristics and levels of impactor padding.
7.3 Future Research Needs The risk curves developed in this study relate forces in the KTH complex to the probabilities of hip and knee/distal femur injuries. However, hip, knee, and distal femur injuries account for only about two-thirds of all AIS 2+ KTH injuries in frontal crashes (Kirk and Kuppa 2009). The remaining third of KTH injuries are to the shaft of the femur. This suggests that further research is needed to develop a comprehensive injury criterion for the entire KTH complex that includes the femoral shaft as well as the hip and knee/distal femur. Because the femoral shaft most commonly fails in bending, such a criterion will likely need to consider peak bending moment in the femur. The effects of muscle tension on KTH injury will also need to be considered in any new comprehensive KTH injury criterion because results of computational modeling of knee impacts suggest that muscle tension increases the probability of femoral shaft fracture (Chang et al. 2008). The development of a comprehensive KTH injury criterion also requires additional research to characterize how subject characteristics and knee impact surface rigidity affect knee/distal femur fracture forces. Additional work is also needed to improve crash test dummy knee impact response biofidelity if the risk curves developed in this study are to be used to directly assess KTH injury risk in frontal crashes. In particular, for hip and knee/distal injury risk curves to be used with crash test dummies, the relationships between femur and acetabular forces measured by crash test dummies and forces produced at the human knee and hip needed to be determined. This is because hip injury risk curves are expressed in terms of peak force at the human hip and the knee/distal femur injury risk curve is based on peak force applied to the human knee. However, determining relationships between forces measured by crash test dummy KTH load cells and forces at the cadaver knee and hip is complicated by the fact that the relationship between forces measured by crash test

10
dummies and forces sustained by humans under similar knee loading conditions depends on the force-deflection characteristics of the surface loading the knee (Rupp 2006).
11
8. Conclusions Hip fracture/dislocation forces and the associated subject characteristics were analyzed using survival analysis to define a lognormal distribution that describes the relationship between peak force at the hip and the probability of hip fracture or dislocation. This distribution was parameterized to account for the effect subject stature, which was the only subject characteristic that significantly affected the relationship between peak force applied to the hip and the probability of hip fracture. This distribution was also parameterized to account for the effects of hip posture on the probability of hip fracture using data from the literature on the effects of posture on mean hip fracture force. Injury risk curves for midsize males in a standard automotive posture and posture in which the hip was 30˚ flexed and 15˚ abducted were defined by applying these postures to the parametric lognormal distribution.
A new knee/distal femur injury risk curve that accounts for the effects of censoring on the relationship between peak force applied at the knee and the probability of knee/distal femur fracture was developed by applying survival analysis with a Weibull distribution to peak knee impact force data from the literature that were associated with either AIS 2+ KTH injury or no KTH injury. This risk curve is similar to that reported by Kuppa et al. (2001).
12
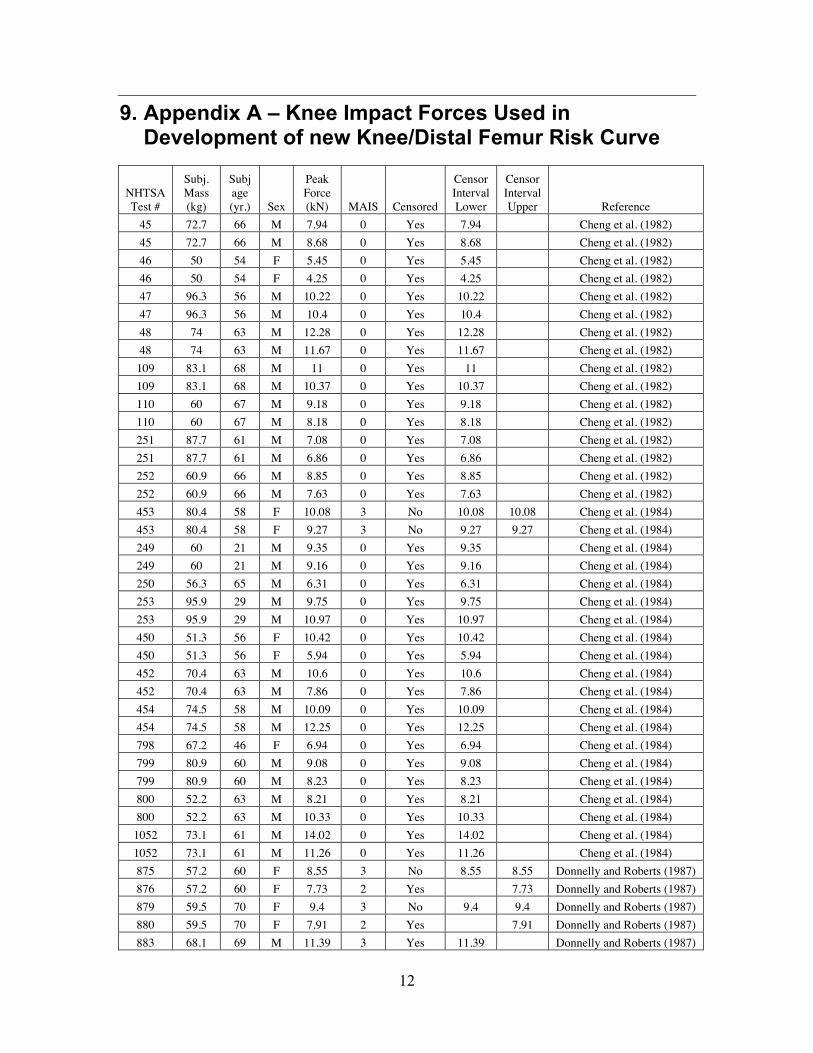
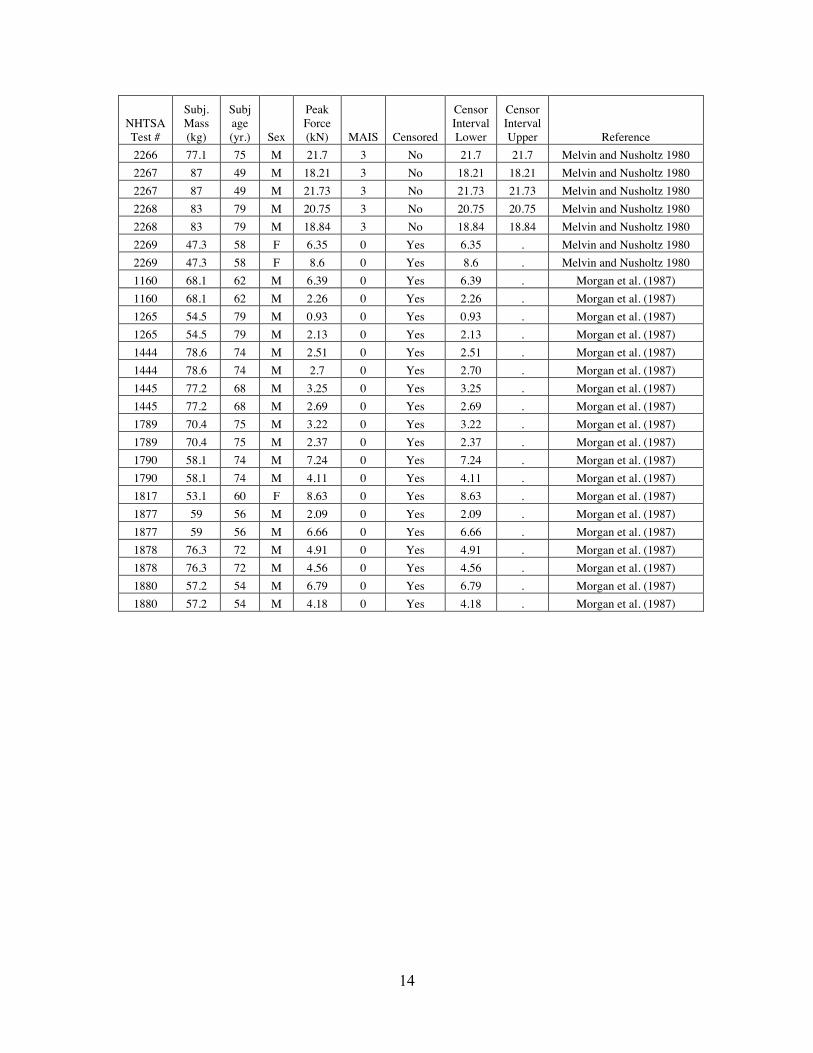
9. Appendix A – Knee Impact Forces Used in Development of new Knee/Distal Femur Risk Curve
NHTSA Test #
Subj. Mass (kg)
Subj age (yr.) Sex
Peak Force (kN) MAIS Censored
Censor Interval Lower
Censor Interval Upper Reference
45 72.7 66 M 7.94 0 Yes 7.94 Cheng et al. (1982) 45 72.7 66 M 8.68 0 Yes 8.68 Cheng et al. (1982) 46 50 54 F 5.45 0 Yes 5.45 Cheng et al. (1982) 46 50 54 F 4.25 0 Yes 4.25 Cheng et al. (1982) 47 96.3 56 M 10.22 0 Yes 10.22 Cheng et al. (1982) 47 96.3 56 M 10.4 0 Yes 10.4 Cheng et al. (1982) 48 74 63 M 12.28 0 Yes 12.28 Cheng et al. (1982) 48 74 63 M 11.67 0 Yes 11.67 Cheng et al. (1982) 109 83.1 68 M 11 0 Yes 11 Cheng et al. (1982) 109 83.1 68 M 10.37 0 Yes 10.37 Cheng et al. (1982) 110 60 67 M 9.18 0 Yes 9.18 Cheng et al. (1982) 110 60 67 M 8.18 0 Yes 8.18 Cheng et al. (1982) 251 87.7 61 M 7.08 0 Yes 7.08 Cheng et al. (1982) 251 87.7 61 M 6.86 0 Yes 6.86 Cheng et al. (1982) 252 60.9 66 M 8.85 0 Yes 8.85 Cheng et al. (1982) 252 60.9 66 M 7.63 0 Yes 7.63 Cheng et al. (1982) 453 80.4 58 F 10.08 3 No 10.08 10.08 Cheng et al. (1984) 453 80.4 58 F 9.27 3 No 9.27 9.27 Cheng et al. (1984) 249 60 21 M 9.35 0 Yes 9.35 Cheng et al. (1984) 249 60 21 M 9.16 0 Yes 9.16 Cheng et al. (1984) 250 56.3 65 M 6.31 0 Yes 6.31 Cheng et al. (1984) 253 95.9 29 M 9.75 0 Yes 9.75 Cheng et al. (1984) 253 95.9 29 M 10.97 0 Yes 10.97 Cheng et al. (1984) 450 51.3 56 F 10.42 0 Yes 10.42 Cheng et al. (1984) 450 51.3 56 F 5.94 0 Yes 5.94 Cheng et al. (1984) 452 70.4 63 M 10.6 0 Yes 10.6 Cheng et al. (1984) 452 70.4 63 M 7.86 0 Yes 7.86 Cheng et al. (1984) 454 74.5 58 M 10.09 0 Yes 10.09 Cheng et al. (1984) 454 74.5 58 M 12.25 0 Yes 12.25 Cheng et al. (1984) 798 67.2 46 F 6.94 0 Yes 6.94 Cheng et al. (1984) 799 80.9 60 M 9.08 0 Yes 9.08 Cheng et al. (1984) 799 80.9 60 M 8.23 0 Yes 8.23 Cheng et al. (1984) 800 52.2 63 M 8.21 0 Yes 8.21 Cheng et al. (1984) 800 52.2 63 M 10.33 0 Yes 10.33 Cheng et al. (1984) 1052 73.1 61 M 14.02 0 Yes 14.02 Cheng et al. (1984) 1052 73.1 61 M 11.26 0 Yes 11.26 Cheng et al. (1984) 875 57.2 60 F 8.55 3 No 8.55 8.55 Donnelly and Roberts (1987) 876 57.2 60 F 7.73 2 Yes 7.73 Donnelly and Roberts (1987) 879 59.5 70 F 9.4 3 No 9.4 9.4 Donnelly and Roberts (1987) 880 59.5 70 F 7.91 2 Yes 7.91 Donnelly and Roberts (1987) 883 68.1 69 M 11.39 3 Yes 11.39 Donnelly and Roberts (1987)

13
NHTSA Test #
Subj. Mass (kg)
Subj age (yr.) Sex
Peak Force (kN) MAIS Censored
Censor Interval Lower
Censor Interval Upper Reference
884 68.1 69 M 15.13 2 Yes 15.13 Donnelly and Roberts (1987) 887 72.7 61 M 17.18 2 Yes 17.18 Donnelly and Roberts (1987) 888 72.7 61 M 10.89 2 Yes 10.89 Donnelly and Roberts (1987) 902 68.6 71 M 9.33 0 No 9.33 9.33 Donnelly and Roberts (1987) 903 68.6 71 M 7.02 3 No 7.02 7.02 Donnelly and Roberts (1987) 906 84 66 M 18.66 2 Yes 18.66 Donnelly and Roberts (1987) 907 84 66 M 18.13 2 Yes 18.13 Donnelly and Roberts (1987) 910 64 55 M 21.06 2 Yes 21.06 Donnelly and Roberts (1987) 911 64 55 M 19.68 3 No 19.68 19.68 Donnelly and Roberts (1987) 918 73.1 57 M 13.29 2 Yes 13.29 Donnelly and Roberts (1987) 919 73.1 57 M 14.06 2 Yes 14.06 Donnelly and Roberts (1987) 922 46.8 57 F 9.34 2 Yes 9.34 Donnelly and Roberts (1987) 923 46.8 57 F 8.99 3 No 8.99 8.99 Donnelly and Roberts (1987) 1055 79.5 62 M 10.01 3 No 10.01 10.01 Donnelly and Roberts (1987) 1056 79.5 62 M 14.19 3 No 14.19 14.19 Donnelly and Roberts (1987) 1099 86.3 66 M 11.6 3 No 11.6 11.6 Donnelly and Roberts (1987) 1100 86.3 66 M 11.88 3 No 11.88 11.88 Donnelly and Roberts (1987) 2284 40 34 M 1.26 0 Yes 1.26 . Leung et al. 1983 2284 40 34 M 2.97 0 Yes 2.97 . Leung et al. 1983 2285 60.9 60 M 2.41 0 Yes 2.41 . Leung et al. 1983 2285 60 60 M 6.09 0 Yes 6.09 . Leung et al. 1983 2286 49 57 M 3.3 0 Yes 3.3 . Leung et al. 1983 2286 49 57 M 7.15 0 Yes 7.15 . Leung et al. 1983 2288 51.8 63 M 6 0 Yes 6 . Leung et al. 1983 2288 51.8 63 M 6.91 0 Yes 6.91 . Leung et al. 1983 2289 55.9 68 M 7.28 0 Yes 7.28 . Leung et al. 1983 2289 55.9 68 M 8.09 0 Yes 8.09 . Leung et al. 1983 2290 51.8 42 F 2.28 0 Yes 2.28 . Leung et al. 1983 2290 51.8 42 F 3.16 0 Yes 3.16 . Leung et al. 1983 2291 64 42 M 5.68 0 Yes 5.68 . Leung et al. 1983 2291 64 42 M 7.45 0 Yes 7.45 . Leung et al. 1983 2292 70.9 68 M 5.39 0 Yes 5.39 . Leung et al. 1983 2292 70.9 68 M 8.12 0 Yes 8.12 . Leung et al. 1983 2293 65.9 62 M 5.5 0 Yes 5.5 . Leung et al. 1983 2294 81.8 55 M 5.42 0 Yes 5.42 . Leung et al. 1983 2294 81.8 55 M 7.8 0 Yes 7.8 . Leung et al. 1983 2295 50 52 M 2.49 0 Yes 2.49 . Leung et al. 1983 2295 50 52 M 3.64 0 Yes 3.64 . Leung et al. 1983 2296 77.7 62 M 10.6 2 Yes 10.6 Leung et al. 1983 2296 77.7 62 M 12.53 3 No 12.53 12.53 Leung et al. 1983 2297 63.1 73 M 7.73 3 No 7.73 7.73 Leung et al. 1983 2297 63.1 73 M 9.1 2 Yes 9.1 Leung et al. 1983 2298 69 71 M 11.26 3 No 11.26 11.26 Leung et al. 1983 2298 69 71 M 11.56 0 Yes 11.56 Leung et al. 1983 2266 77.1 75 M 12.99 3 No 12.99 12.99 Melvin and Nusholtz 1980
14
NHTSA Test #
Subj. Mass (kg)
Subj age (yr.) Sex
Peak Force (kN) MAIS Censored
Censor Interval Lower
Censor Interval Upper Reference
2266 77.1 75 M 21.7 3 No 21.7 21.7 Melvin and Nusholtz 1980 2267 87 49 M 18.21 3 No 18.21 18.21 Melvin and Nusholtz 1980 2267 87 49 M 21.73 3 No 21.73 21.73 Melvin and Nusholtz 1980 2268 83 79 M 20.75 3 No 20.75 20.75 Melvin and Nusholtz 1980 2268 83 79 M 18.84 3 No 18.84 18.84 Melvin and Nusholtz 1980 2269 47.3 58 F 6.35 0 Yes 6.35 . Melvin and Nusholtz 1980 2269 47.3 58 F 8.6 0 Yes 8.6 . Melvin and Nusholtz 1980 1160 68.1 62 M 6.39 0 Yes 6.39 . Morgan et al. (1987) 1160 68.1 62 M 2.26 0 Yes 2.26 . Morgan et al. (1987) 1265 54.5 79 M 0.93 0 Yes 0.93 . Morgan et al. (1987) 1265 54.5 79 M 2.13 0 Yes 2.13 . Morgan et al. (1987) 1444 78.6 74 M 2.51 0 Yes 2.51 . Morgan et al. (1987) 1444 78.6 74 M 2.7 0 Yes 2.70 . Morgan et al. (1987) 1445 77.2 68 M 3.25 0 Yes 3.25 . Morgan et al. (1987) 1445 77.2 68 M 2.69 0 Yes 2.69 . Morgan et al. (1987) 1789 70.4 75 M 3.22 0 Yes 3.22 . Morgan et al. (1987) 1789 70.4 75 M 2.37 0 Yes 2.37 . Morgan et al. (1987) 1790 58.1 74 M 7.24 0 Yes 7.24 . Morgan et al. (1987) 1790 58.1 74 M 4.11 0 Yes 4.11 . Morgan et al. (1987) 1817 53.1 60 F 8.63 0 Yes 8.63 . Morgan et al. (1987) 1877 59 56 M 2.09 0 Yes 2.09 . Morgan et al. (1987) 1877 59 56 M 6.66 0 Yes 6.66 . Morgan et al. (1987) 1878 76.3 72 M 4.91 0 Yes 4.91 . Morgan et al. (1987) 1878 76.3 72 M 4.56 0 Yes 4.56 . Morgan et al. (1987) 1880 57.2 54 M 6.79 0 Yes 6.79 . Morgan et al. (1987) 1880 57.2 54 M 4.18 0 Yes 4.18 . Morgan et al. (1987)

15
10. Glossary Injury Risk Curve –A mathematical relationship between an injury criterion and the likelihood of injury to a human body region
Injury Criterion–A parameter determined to be a good prediction of the occurrence of a particular type and severity of injury.
16
11. Acknowledgements This research was supported by the National Highway Traffic Safety Administration under contract # DTN-H-22-05-01020.

17
12. References Atkinson, P.J., Garcia, J.J., Altiero, N.J., and Haut, R.C. (1997). The influence of impact interface on human knee injury: Implications for instrument panel design and the lower extremity injury criterion. Proceedings of the 41st Stapp Car Crash Conference, Paper No. 973327, pp. 167-180. Society of Automotive Engineers, Warrendale, PA.
Chang, C.Y. Rupp, J.D., Schneider, L.W., and Kikuchi, N. (2008). Development of a finite element model to study the effects of muscle forces on knee-thigh-hip injuries in frontal crashes. Stapp Car Crash Journal 52:475-504.
Cheng, R., Yang, K.H., Levine, R.S., and King, A.I. (1982). Dynamic impact loading of the femur under passive restrained condition. Proceedings of the Twenty-Sixth Stapp Car Crash Conference, Paper No. 821665, pp 101-118. Society of Automotive Engineers, Warrendale, PA.
Cheng, R., Yang, K.H., Levine, R.S., and King, A.I. (1984). Dynamic impact loading of the femur under passive restrained condition. Proceedings of the Twenty-Eighth Stapp Car Crash Conference, Paper No. 841665, pp 101-118. Society of Automotive Engineers, Warrendale, PA.
Chumlea, W.C, Wisemandle, W, Guo, S.S., and Sievogel, R.M, 2001. Relations between frame size and body composition and bone mineral status. Am J Clin Nutr 75:1012–6.
Donnelly, B.R. and Roberts, D.P. (1987). Comparison of cadaver and Hybrid III dummy response to axial impacts of the femur. Proceedings of the Thirty-First Stapp Car Crash Conference, Paper No. 872204, pp. 105-116. Society of Automotive Engineers, Warrendale, PA.
Kirk K. and Kuppa, S. (2009). Application and Evaluation of a Novel KTH Injury Criterion for the Hybrid III Dummy in Frontal Crash Test Environments. Paper #09-0196. Proceedings of the 21st International Technical Conference on the Enhances Safety of Vehicles. National Highway Traffic Safety Association, Washington DC.
Kuppa, S., Wang, J., Haffner, M., and Eppinger, R. (2001). Lower extremity injuries and associated injury criteria. Proceedings of the 17th International Technical Conference on the Enhanced Safety of Vehicles, Paper No. 457. National Highway Traffic Safety Administration, Washington, DC.
Kroell, C.K., Allen, S.D., Warnet, C.Y., Perl, T.R. (1986). Interrelationship of velocity of chest compression in blunt thoracic impact to swine II. In: Proceedings of the Thirtieth Stapp Car Crash Conference, Paper No. 861881, Society of Automotive Engineers, Warrendale, PA, pp. 99–121.
Leung, Y.C., Hue, B., Fayon, A., Tarrière, C., Harmon, H., Got, C., Patel, A., and Hureau, J. (1983). Study of “knee-thigh-hip” protection criterion. Proceedings of the Twenty-Seventh Stapp Car Crash Conference, Paper No. 831629, pp. 351-364. Society of Automotive Engineers, Warrendale, PA.
Melvin and Nusholtz (1980). Tolerance and response of the knee-femur-pelvis complex to axial impact-Sled tests. Report UM-HSRI-80-27. The University of Michigan, Highway Safety Research Institute, Ann Arbor, MI.
Meyer, E.A. and Haut, R.C. (2003). The effect of impact angle on knee tolerance to rigid impacts. Stapp Car Crash Journal 47:1-19.
Morgan, R.M., Marcus, J.H., Schneider, D.C., Awad, J, Eppinger, R.H., Dainty, D., Nahum, A.M., and Forrest, S. (1987). Interaction of Human Cadaver and Hybrid III Subjects with a Steering Assembly. Proceedings of the Thirty-First Stapp Car Crash Conference, Paper No. 872204, pp. 105-116. Society of Automotive Engineers, Warrendale, PA.

18
Rupp, J.D., Reed M.P., Jeffreys, T.J., and Schneider L.W (2003). Effects of hip posture on the frontal impact tolerance of the human hip joint. Stapp Car Crash Journal 47: 233.
Rupp J.D., Reed, M.P., Madura, N.H., Miller, C.S., Kuppa, S.M., and Schneider L.W., 2005. Comparison of the inertial response of the THOR-NT, Hybrid III, and unembalmed cadaver to simulated knee-to-knee-bolster impacts. Proceedings of the 19th International Technical Conference on the Enhanced Safety of Vehicles, Paper 05-0086. National Highway Traffic Safety Administration, Washington, DC.
Rupp, J.D. (2006). Biomechanics of hip fractures in frontal motor-vehicle crashes. Ph.D. Dissertation. The University of Michigan, Ann Arbor, MI.
Rupp, J.D., Miller, C.S., Madura, N.H., Reed, M.P., Klinich, K.D., and Schneider L.W. (2008.) Characterization of Knee-Thigh-Hip Response in Frontal Impacts Using Biomechanical Testing and Computational Simulation. Stapp Car Crash Journal 52
Rupp, J.D., Reed, M.P., Miller, C.S., Madura, N.H, Klinich, K.D., Schneider, L.W., and Kuppa, S.M.. (2009). Development of New Criteria For Assessing the Risk of Knee-Thigh-Hip injury In Frontal Impacts Using Hybrid III Femur Force Measurements. Proceedings of the 21st International Conference on the Enhanced Safety of Vehicles. Paper 09-0306. National Highway Traffic Safety Administration, Washington D.C.
Schneider, L.W., Robbins, D.H., Pflüg, M.A., and Snyder, R.G. (1983) Development of anthropometrically based design specifications for an advanced adult anthropomorphic dummy family, Volume 1. Report No. DOT-HS-806-715. U.S. Department of Transportation, National Highway Traffic Safety Administration, Washington, D.C.
Shams, T., Beach, D., White, R.P., Rangarajan, N., Haffner, M., Eppinger, R., Pritz, H., Kuppa, S., Beebe, M. (1999) Development and Design of Thor-Lx: The Thor Lower Extremity. Proc. 43rd Stapp Car Crash Conference.
Shams, T., Beach, D., Huang, T., Rangaranjan, N., and Hafner, M. (2002). Development of THOR-FLx: A Biofidelic Lower Extremity for Use with 5th Percentile Female Crash-test dummies. Stapp Car Crash Journal 46: 267-283.
Wang, S.C., Brede, C., Lange, D., Poster, C.S., Lange, A.W, Kohoyda-Inglis, C., Sochor, M.R., Ipaktchi, K., Rowe, S.A., Patel S., Garton, H., 2004. Gender Differences in Hip Anatomy: Possible Implications for Injury Tolerance in Frontal Collisions. Annual Proceedings of the Association for the Advancement of Automotive Medicine 48:287-301.