development of job matching algorithm …eprints.utar.edu.my/833/1/mcs-2013-0909172-1.pdfii abstract...
TRANSCRIPT

DEVELOPMENT OF JOB MATCHING ALGORITHM WITH
COLLECTIVE LEARNING
By
CHENG KAM CING
MASTER OF COMPUTER SCIENCE
AMaster’s thesis submitted to the Department of Institute of Postgraduate
Studies and Research (IPSR),
Faculty of Engineering and Science,
UniversitiTunku Abdul Rahman,
in partial fulfillment of the requirements for the degree of
Master of Computer Science
August 2013

ii
ABSTRACT
DEVELOPMENT OF JOB MATCHING ALGORITHM WITH
COLLECTIVE LEARNING
CHENG KAM CHING
In the world of web 2.0 with increasing building-up of job seeker database, it is
necessary to develop and use knowledge engineering tools to acquire more job
seeker information and derive knowledge from the collective learning of the
general behavior of a similar group of job seekers. In addition, the ever
changing needs of finding suitable expertise with adequate skill set and
experience to fill the post in the globalized world also pose new challenges in
the rethinking of effective ways of matching the candidates to the job positions.
As the jobs provided by employers contain a variety of information with
different levels of details, a possible approach will be to focus on several
important criteria coupled with collective learning methods for better matching
results. In addition, the matching should have the mechanism to predict and
propose suitable jobs based on knowledge derived from the personal track
record and choice pattern. The combination of these approaches can give a
framework with possible efficient implementation and effective matching

iii
results. The real data from an online recruitment company were used in the
study to validate the proposed method with result analysis.
In this thesis, the Job Latent Semantic Indexing (JLSI) method is first proposed
as an initial approach. Basically, the JLSI uses Latent SemanticIndexing as a
basis for information retrieval in the job matching area. This is an adaptation of
existing technology in applying to new area of job matching. The job matching
algorithm is then further improved as the Job Enhanced Latent Semantic
Indexing (JELSI) method by incorporating Term Frequency Inverse Document
Frequency. JELSI considers the local weight and the global weight of the term
frequency throughout the job collections. This has improved the results. On the
other hand, the matrix used is large and sparse and in this case, the matrix
computation is time-consuming. Due to this fact, Row Reduction technique has
been introduced to reduce the unimportant terms (row vectors) in the matrix.
The Row Reduction technique has successfully increased the overall matrix
computation speed.
Lastly, the algorithm is further enhanced by incorporating the feedbacks from
the job seekers to offer a better job matching mechanism. The feedbacks from
the job seekers are in terms of job application behaviors. Generally, the
feedbacks refine the algorithm query in each pass based on the results of
previous queries. This exhibits the benefits of Collective Learning (CL) where
a group of job seekers helps make decisions. The collective feedbacks are
inserted into the algorithm and the results have improved even better. In
summary, three methods namely the Job Latent Semantic Indexing (JLSI)

iv
method, the Job Enhanced Latent Semantic Indexing (JELSI) method and the
Job Enhanced Latent Semantic Indexing with Collective Learning (JELSI-CL)
method have been developed and tested on actual job data from an online
recruitment company. The testing results show that JELSI-CL performed the
best in matching the similar jobs.

v
ACKNOWLEDGEMENTS
I am deeply grateful to the support and help of my friends and family members
for making it possible for me to complete this thesis.
First and foremost I would like to express my heartfelt gratitude to Prof. Ewe
Hong Tat, my thesis supervisor, for being a constant source of motivation and
guiding me through this thesis. He always shares with me the spirit of doing
research and innovative ideas in overcoming problems faced in the study.
In addition, million thanks to Dr. Albert Wong and Mr. Tan Hung Chye from
Jobstreet.com who provide support and advice throughout my master's degree
project. Without their help, I would not have completed my project as planned.
I wish to thank UniversitiTunku Abdul Rahman (UTAR), by giving me the
chance to be involved in this amazing research project to explore new things
and continue my studies. I also would like to express my special thanks to
UTAR's lecturers, my siblings, my wife Ms. Yap Kai Ling, and my friends
who have been particularly supportive.
Last but not least, and most importantly, I wish to thank my parents, Mr. Cheng
Fatt and Ms. Lee Yoke Chin. I am grateful to them for their unconditional love,
support and everything. To all of you, I dedicate this thesis.

vi
APPROVAL SHEET
This thesis entitled “DEVELOPMENT OF JOB MATCHING
ALGORITHM WITH COLLECTIVE LEARNING” was prepared by
CHENG KAM CHING and submitted as partial fulfillment of the requirements
for the degree of Master of Computer Science at UniversitiTunku Abdul
Rahman.
Approved by:
_____________________
(Prof. Dr. Ewe Hong Tat) Date: ……………
Supervisor
Department of Internet Engineering and Computer Science
Faculty of Engineering and Science
UniversitiTunku Abdul Rahman

vii
SUBMISSION SHEET
FACULTY OF ENGINEERING AND SCIENCE
UNIVERSITI TUNKU ABDUL RAHMAN
Date: 5thJuly 2013
SUBMISSION OF THESIS
It is hereby certified that Cheng KamChing (ID No: 09UEM09172) has
completed this thesis entitled “Development of Job Matching Algorithm with
Collective Learning” under the supervision of Prof. Dr. Ewe Hong Tat from the
Department of Internet Engineering and Computer Science, Faculty of
Engineering and Science.
I understand that the University will upload softcopy of my thesis in PDF
format into the UTAR Institutional Repository, which may be made accessible
to UTAR community and the public
Yours truly,
________________________
CHENG KAM CHING

viii
DECLARATION
I _________CHENG KAM CHING__________ hereby declare that the
Master’s thesis is based on my original work except for quotations and
citations which have been duly acknowledged. I also declare that it has not
been previously or concurrently submitted for any other degree at UTAR or
other institutions.

ix
LIST OF TABLES
Table 2.1: User-book Purchase Matrix Table Classified into 3-Points Scales 23
Table 2.2: The Similarity Scores of the Book 3 to All the Books 24
Table 2.3: The User Rating of User 3 for the Books 24
Table 2.4: Pros and Cons of Collaborative Filtering 26
Table 4.1: Sample of Term-Job Matrix 64
Table 4.2: A Sample of top-N Ranked Jobs 76
Table 4.3: Matching Results of Four Job Groups Based on JLSI Method 79
Table 5.1: Sample of TFIDF Calculation 86
Table 5.2: Matching Results of Four Job Groups with JELSI Method 88
Table 5.3: Matching Results of Four Job Groups Based on JELSI-CL Method
96
Table 5.4: Comparison of the Matching Results JLSI, JELSI and JELSI-CL
Methods 97
Table 5.5: Performance of Operations in MATLAB Platform 99

x
LIST OF FIGURES
Figure 2.1: Taxonomy of clustering approaches (Anil K. Jain, 1999) 13
Figure 2.2: Dendrogram (Michikazu Kikugawa, 2010) 14
Figure 2.3: Methods to decide clustering in hierarchical clustering 15
Figure 2.4: Sample of non-hierarchical clustering 16
Figure 2.5: K-means clustering flowchart (Matthias Schonlau, 2002) 18
Figure 2.6: Job element “Knowledge” with percentage of importance 19
Figure 2.7: Job element “Education” with percentage of respondents 20
Figure 2.8: Grouping of Rated Items and Similarity Calculation 23
Figure 2.9: Sample of Concepts 31
Figure 2.10: Matrix ‘A’ Decomposition 33
Figure 2.11: The Best Approximation to the Data Points 35
Figure 2.12: Lesser Variations Approximation to the Data Points. 36
Figure 2.13: Vectors in Different Angles 39
Figure 3.1: Assessment of the DCG6 54
Figure 3.2: Assessment of the iDCG6 55
Figure 3.3: Final Results Computed for nDCG6 for Ideal Case where the
Algorithm Predicts the Same as that of Human Experts 55
Figure 4.1: Block Diagram of JLSI Method 59
Figure 4.2: Unstructured Data of Job Requirements and Responsibility 69
Figure 4.3: Portion of the Preprocessed Sample Text with Each Paragraph
Representing a Job 71
Figure 4.4: Screen Shot of the Interface of the Matrix Parser 72
Figure 4.5: Term Frequency Matrix 73

xi
Figure 4.6: Sample of Scree Plot 74
Figure 4.7: A Sample of Similarity Score Table of the Jobs 75
Figure 4.8: Sample of a Query Job 77
Figure 4.9: Matching Results of Four Jobs Groups with JLSI Method in Line
Graph 80
Figure 5.1: Sample of Long Job Responsibilities and Requirements 82
Figure 5.2: Sample of Short Job Responsibility and Requirements 83
Figure 5.3: Block diagram of JELSI method 84
Figure 5.4: Matching Results of Four Job Groups with JELSI Method in Line
Graph 88
Figure 5.5: Block Diagram of JELSI-CL Method 90
Figure 5.6: Matching Results of Four Job Groups with JELSI-CL Method in
Line Graph 96

xii
LIST OF EQUATIONS
Equation 2.1: Distance measurement between data points in clusters 18
Equation 2.2: Weighted sum and predicted rating for Book 3 25
Equation 2.3: Singular Value Decomposition 38
Equation 2.4: Computes Query Coordinate Points 38
Equation 2.5: Similarity Measurement for Task 1 and Query q38
Equation 2.6: Similarity Measurement for Task 2 and Query q 38
Equation 2.7: Similarity Measurement for Task 3 and Query q 38
Equation 2.8: Cosine-based Similarity Measurement 40
Equation 3.1: Recall Measurement 51
Equation 3.2: Precision Measurement 51
Equation 3.3: Cumulative Gain (CG) 54
Equation 3.4: Discounted Cumulative Gain (DCG) 54
Equation 3.5: Normalized Discounted Cumulative Gain (nDCG) 54

xiii
LIST OF ABBREVIATIONS
LSA – Latent Semantic Analysis
LSI – Latent Semantic Indexing
JLSI – Job Latent Semantic Indexing
JELSI – Job Enhanced Latent Semantic Indexing
CL – Collective Learning
CI – Collective Intelligence
JELSI-CL – Job Enhanced Latent Semantic Indexing with Collective Learning Method
IR – Information Retrieval
UTAR – UniversitiTunku Abdul Rahman
IT – Information Technology
CF – Collaborative Filtering
TFIDF – Term Frequency Inverse Document Frequency
VSM – Vector Space Model
SVD – Singular Value Decomposition
iDCG – Ideal Discounted Cumulative Gain
O*NET – Occupational Information Network
USDOL – United States Department of Labor
ETA – Employment Training Administration
NLP – Natural Language Processing
P@k – Precision at k
DCG – Discounted Cumulative Gain
nDCG – Normalized Discounted Cumulative Gain

xiv
TABLE OF CONTENTS
ABSTRACT ii
ACKNOWLEDGEMENTS v
APPROVAL SHEET vi
SUBMISSION SHEET vii
DECLARATION vii
LIST OF TABLES ix
LIST OF FIGURES x
LIST OF EQUATIONS xii
LIST OF ABBREVIATIONS xiii
CHAPTER 1 1
1.0 INTRODUCTION 1
1.1 Motivation 2
1.2 Problem Statement 3
1.3 Objectives 5
1.4 Outlines of the Thesis 6
CHAPTER 2 7
2.0 LITERATURE SURVEY AND RELATED RESEARCH 7
2.1 Introduction 7
2.2 Online Recruitment 7
2.3 Information Retrieval (IR) 9
2.4 Context 9
2.5 Related Research 10
2.6 Clustering 13
2.7 Categorizing by job elements 19
2.8 Collaborative Filtering 21
2.9 Latent Semantic Analysis 27
2.10 Group Knowledge 40
2.11 Summary 44
CHAPTER 3 48
3.0 DATASETS AND EVALUATION 48
3.1 Introduction 48
3.2 Datasets 49

xv
3.3 User Evaluation Method 50
3.4 Recall and Precision 50
3.5 Graded Relevance 52
3.6 Problems and Limitation 56
3.7 Summary 56
CHAPTER 4 57
4.0 JOB LATENT SEMANTIC INDEXING (JLSI) METHOD 57
4.1 Introduction 57
4.2 Block Diagram of the Proposed JLSI Method 57
4.3 Job Database 60
4.4 Pre-processor 60
4.5 Matrix Parser 62
4.6 Matrix Dimensionality Reducer 65
4.7 Semantic Indexer 67
4.8 Ranker 68
4.9 Design and Implementation 69
4.10 Results and Analysis 77
4.11 Summary 80
CHAPTER 5 81
5.0 JOB ENHANCED LATENT SEMANTIC INDEXING (JLSI) METHOD WITH COLLECTIVE LEARNING 81
5.1 Introduction 81
5.2 Job Enhanced Latent Semantic Indexing (JELSI) Method 84
5.3 Enhancement with Collective Learning Method 89
5.4 Job Enhanced Latent Semantic Indexing with Collective Learning (JELSI-CL) Method 90
5.5 Comparison of JLSI, JELSI and JELSI-CL Methods 97
5.6 Performance Review 99
5.7 Summary 100
CHAPTER 6 101
6.0 CONCLUSTION 101
6.1 Summary 101
6.2 Future Works 103
REFERENCES 105
Appendix A 114

xvi
Appendix B 119
Appendix C 121
Appendix D 123
Appendix E 124
Appendix F 125
1
CHAPTER 1
1.0 INTRODUCTION
In hiring, recommending a suitable job for a job seeker is not an easy task. The
traditional online recruiting applications1normally use only simple Boolean
operations to compare the basic requirement of jobs offered by employers and
basic qualification information of job seekers to generate matched job results
for job seekers. Therefore, it is quite often that irrelevant jobs are matched or
too many “hits” are obtained which are not really suitable (Supjarerndee et al.,
2002). Besides, job seekers must browse through a long list of job
advertisements in a given query to select (Smyth et al., 2002) and they also
need to fill up massive form-based basic information. For those questions that
they need to answer, sometimes the choices given may be too broad or not
clear and it is difficult for them to determine and this leads to inaccurate data
entry. In addition, the online recruiting application is expected to not only
provide matched job but also to explore and discover relevant jobs for
recommendation to the job seekers. Job seekers would like to see a range of
suitable jobs that match his or her working profiles, qualifications and own
interests. However, with different job requirement and specifications from the
employers, it is always a challenging task to group similar jobs together. This
is the area addressed by this research project described in this thesis where
improved methods of job matching algorithm are proposed. The primary
1 Online recruiting application uses online websites for submission of job advertisement, posting of resume and matching of them using basic algorithm to match the jobs and job applicants.

2
objective of this research is to offer an intelligent job matching mechanism that
groups similar jobs together and also incorporates the feedback from the job
seekers. Real data (job title, job descriptions and job requirements of 3000 job
advertisements) from an online recruitment company will be used with detailed
analysis for the validation of the proposed methods.
1.1 Motivation
Information Technology (IT) has become a part of our daily activities. It helps
us do tasks seamlessly. Systems are able to keep track of vast information
changes in the database. Due to increased information, more analysis can be
conducted to solve problems. Meanwhile, the latest development in networking
technology especially the Internet Technology has constructed a network of
connecting people globally for faster communication in reduced time and cost.
One of the fast growing fields is the online job matching.
Currently, these are some popular online recruitment websites such as
“Monster", "Jobstreet.com", "JobsDB.com", "JenJOBS" and "JobsCentral" in
this region of the world. Samples of snapshot of these websites are shown in
Appendix A. Although there have been fast increases of computation speed of
servers and also more convenience in online job matching, these online
recruitment websites still strive to seek improvement for their job matching
applications for better performance in matching accuracy and relevancy. This
will improve the process of hiring and reduce the hiring time and cost for
companies.

3
However, due to the following factors such as
a) A wide variety of jobs,
b) A different job requirements specified by employers,
c) Different resume with a wide range of qualification, working
experience, job profile, and expectations of job seekers, and
d) Others special consideration in job matching,
It is therefore a challenging task to perform a good matching of jobs and job
seekers. One possible approach is to group similar jobs together so that job
seekers can be recommended with most suitable jobs for him or her, which he
or she is not aware of. In addition, with the advancement in information
analysis and comparison technology, as well as a Collective Learning process it
is possible to develop an algorithm to better group similar jobs together for the
job matching purpose with the incorporation of feedback from job seekers
through their job browsing and selection history.
1.2 Problem Statement
Online recruitment websites connect people who are looking for jobs and
companies that are looking for potential employees with suitable skill sets and
requirements over the Internet. It is a common way to match jobs. One study
found that 50 million Americans have used the online recruitment websites
(Wanarsup et al., 2008). It is an effective and efficient way to bring them
together quickly and easily for job seeking.

4
However, these online recruitment websites are still working on to do the job
matching more effectively. A successful example of the other field is the
Amazon.com website. The Amazon.com is a giant electronic commerce (E-
Commerce) website that provides online sales services globally. It keeps track
of customer browsing behaviors and purchasing habits to recommend items for
their customers. One of the methods used by the Amazon.com is called
Collaborative Filtering (CF) method 2(Wikipedia, 2008; Liang et al., 2010;
Takács et al., 2009). In contrast, the common online recruitment applications
are still lacking of such feature that consider job seeker personalization with
suitable retrieval strategy.
Some of the common job matching methods currently used are still based on
quite a basic approach. That is, the application processes the query of job
matching by comparing the basic information provided by job seekers and the
job requirements provided by employers through basic matching methods such
as Boolean operations, condition matching and keyword matching. The basic
information used for matching are salary, job name, position level, skill sets,
fields, education background and locations, keywords and others. The
searching may require a lot of information to be input from the job seekers.
However, these human inputs may not be accurate and will cause problems
resulting in an irrelevant job recommendation. It usually does not distinguish
synonym, polysemy and the context of the job matching. Currently, the job
matching results still need further improvement. For example, a job "Business
2 Collaborative Filtering (CF) is the process of filtering for information or patterns using techniques involving collaboration among multiple agents, viewpoints, data sources, etc. [Wikipedia]

5
Analyst" advertised by an employer can be matched with a job seeker who has
worked as a "Document Consultant" in business form although both the resume
and the job description may not share common terms (words).
Furthermore, filling the choices posed by the questions in online recruitment
websites can be difficult to decide. For example, the Position Level in the
online recruitment websites could be Senior Manager, Manager, Senior
Executive, Junior Executive, Entry Level and Non-Executive. It is difficult to
decide which jobs are referring to these as different companies may have
different definitions. Thus, quite often inaccurate choices are chosen by the job
seekers. As a result, the job recommendation provided by online job websites
which are solely based on these levels choices may not be accurate or relevant.
This is also because different people will have a different understanding of the
terms expressed in the choices given, and hence they provide wrong
information through the choices taken and affect the job matching results. In
short, there is a need to develop improved algorithms that can better propose
suitable jobs for job seekers based on the collection and analysis of information
collected from job seekers.
1.3 Objectives
This research focuses on the following:
1. To conduct literature research inthe area of job matching.
2. To design improved algorithm for job matching with information
retrieval and matching technique.
3. To develop and implement the job matching algorithm and verify the
results through real online jobs.

6
1.4 Outlines of the Thesis
This thesis is organized into the following chapters. Chapter 1 introduces the
job matching problem in online recruitment, inspiration of this research project
and the objectives of the thesis. In the background of the traditional online
recruitment websites and information retrieval methods these will be discussed
and related researches in this area are surveyed and discussed in Chapter 2.
Chapter 3 includes the discussion about the evaluation methods and data sets
used in this research. Chapter 4 describes the job matching algorithm proposed
for this research project, which is Job Latent Semantic Indexing (JLSI). The
design and implementation of the proposed methods are also included. For
Chapter 5, the JLSI is enhanced with Term Frequency Inverse Document
Frequency (TFIDF) method and Collective Learning method. Lastly, Chapter 6
presents the conclusion and proposed future works.

7
CHAPTER 2
2.0 LITERATURE SURVEY AND RELATED RESEARCH
This chapter presents the background information of information retrieval and
related works that inspire the online job matching area.
2.1 Introduction
Recruitment is the process of attracting prospective applicants for a specific job.
The applicant selection starts by conducting the qualification screening, tests
and interview. The result is a pool of applicants with proper qualification that
we can select. In short, recruitment refers to the process of finding the right
people for the right job at the right time. The recruitment process is undertaken
by the recruiters, job agencies, or headhunters. Advertising is the early stage of
the recruiting process and it can be done via online, career fair, newspapers,
campus announcements and more. In this Internet era, online recruitment or e-
recruitment has become popular and is commonly used by companies to recruit
new employees.
2.2 Online Recruitment
In recent years, the Internet has revolutionized the recruitment process in the
human resource field. The companies have increasingly relied on computer
technology, intelligent system and the Internet for online recruitment (Georgios
et al., 2003; Drigas et al., 2004). Job applicants can easily find a range of
vacancies from different employers with only a few clicks on the Internet

8
webpages. Likewise, the availability of the Internet has made it easier for
online hiring process for the employers.
Most employers have adopted online recruitment into their hiring process to
increase efficiency and effectiveness of the recruitment process. The Internet
has enabled people to apply for their dream job anywhere and anytime. There
are several advantages to use online recruitment over the traditional
recruitment process.
First, online recruitment has improved the response of job applications and
reduced hiring expenses in the long run. Companies save more cost and time.
Secondly, the computerized system allows less use of paper and reduces
manual administrative workload. Thirdly, companies can have more control
over the information as the centralized platform collects candidate information
in a standard format. Also, it can combine data from multiple recruitment
sources and share the information with all the members in real-time. Fourth,
the candidate pool is properly maintained in a centralized database. Last but
not least, the report generation is automated and it is ready to be shared with
the entire organization (Othman & Musa, 2007).
In fact, online recruitment also provides access to passive job seekers. This
makes online recruitment a powerful hiring tool compared with the others. The
hiring process is much faster in terms of posting of jobs, applicant response and
processing of resumes.

9
2.3 Information Retrieval (IR)
“Information retrieval (IR) is concerned with representing, searching, and
manipulating large collections of electronic text and other human-language
data”, said Stefan Buttcher(Büttcher, 2010). Similarly, information retrieval is
about the storage and organization of the information for easy access provided
to users who are interested in the data (Baeza-Yates et al., 1999; Manning,
2008). There is something in common from these authors where information
retrieval processes a large collection of data and provides personalized useful
information needed by the users. For online job matching, information retrieval
is an important technique to be applied for proper implementation of online job
application, searching and matching.
2.4 Context
For a better representation of job, it is necessary for us to consider how it can
be represented by job context. Generally, context refers to the circumstances
that are based on a particular setting or situation. Context is a common term
used by many other fields. “Context is any information that can be used to
characterize the situation of an entity. An entity is a person, place, or object
that is considered relevant to the interaction between a user and an application,
including the user and applications themselves” said researcher Dey(Dey,
2001). In the information retrieval perspective, context is the situational
implicit information that helps us understand the communication that is based
on the situation and setting we are in. When human interacts to each other we
are able to understand the information that we want to convey based on the
situation. However, human-computer interaction is difficult as the computer
does not understand human language directly. Hence, context plays an

10
important role in refining the communication between human and computer
interaction. This allows more accurate and personalized service.
We consider a job to be associated with multiple contexts. A job can have more
than one context associated with it. For instance, a job can have a combination
of business administration and computer engineering with different skill sets
from different fields. Therefore, in matching a job we should consider the
context and not keywords.
2.5 Related Research
We will discuss about the application of different methods for job matching. In
the following sub-sections, retrieval strategies will be discussed and this will be
followed by discussion of the application of, the vector space model (VSM)
and Boolean retrieval in matching. After that, a study on non-hierarchical
clustering, k-means clustering, categorizing by job elements and collaborative
filtering will be presented.
2.5.1 Retrieval Strategy
A retrieval strategy is an algorithm that can identify the similarity between a
set of documents and a query (JinxiXu, 2002; Govindaraju et al., 2009). The
degree of similarity between the query and the documents is normally assigned
by the similarity measurement like cosine similarity measurement (Madylova,
2009; Zhu et al., 2010; Nyein, 2011) and correlation coefficient methods
(Yilmaz et al., 2008). This can be based on the common parts that exist in both
the documents and the queries to determine their similarity. Generally, the
more terms shared between the documents and the query, the more relevant it

11
will likely be. Moreover, some strategies are tailored to solve the ambiguities
in human languages such as synonyms and polysemy. For example, Starbuck
and coffee may refer to the same concept depending on the information we
want to compare.
2.5.2 Vector Space Model
Vector space model (VSM) was a method developed by Gerald Salton in 1975
(Salton et al., 1975). It is an ideal model for ranking retrieval3. In VSM, both
the queries and the documents are represented as vectors in higher dimensional
space. The vector may consist of two or more terms. In this case, the terms in
the vector are used to represent the meaning of a document. If one can
represent the terms in the documents as vectors, it is possible to compare the
documents and the queries to determine how similar they are.
Usually, the similarity of the vectors is determined by calculating the angle
between the vectors in higher dimensional space. That is, the smaller the angle
between the vectors, the more relevant the match. The calculation is performed
by using the cosine similarity measurement or dot product.
For instance, consider a document collection with only three distinct terms
Alpha, Beta and Gamma. So, all vectors contain only three components. The
first component represents the count of the occurrences of the term Alpha
(frequency of the term in the document), and the second component represents
the count of the occurrences of the term Beta and lastly the term Gamma. The
3Ranking Retrieval: Information retrieval system retrieves a set of results in response of query. The results are to be calculated and ranked based on its relevance to the query.

12
count of the occurrences for the components is represented by positive integer
only. For instance, assume that a document consists of 0occurrence of the term
Alpha, 2occurrences of the term Beta and 1 occurrence of the term Gamma.
Then, the vector can be represented as <0, 2, 1> (Grossman, 2004).
Once the vectors have been used to represent the documents and query, we can
calculate similarity between the documents and the query. We are required to
calculate the angle between these vectors to determine the similarity between
them.
2.5.3 Boolean Retrieval
Boolean retrieval is a model that is based on the set theory or Boolean algebra.
It is a well-known model used by many people in past years due to its
simplicity. Boolean retrieval (Charles & Gordon, 2000; Pohl et al., 2011) uses
the binary decision criterion to decide if this is either match or not a match.
This makes Boolean retrieval a straight forward data retrieval method.
Boolean retrieval returns sets of results and not ranked lists. Common online
recruitment websites use this model quite widely. In this model, we retrieve
documents by using the index terms. In this case, the query is composed of the
index terms linked by the standard Boolean operators AND, NOT and OR.
The results of the retrieval are either matched or not matched. There is no
partial relevant due to the Boolean expression used by the query. The Boolean
expression could be simple or complicated. We can combine and repeat the
Boolean operators in constructing the query without limits. We might have too

13
many “hits” when the query constructed is too simple. For instance, we could
have a simple query like (“Java” OR “Dot Net”) AND “programmer”. To
construct an advanced and effective Boolean query, this may be time
consuming, complicated and challenging.
2.6 Clustering
Figure 2.1: Taxonomy of clustering approaches (Anil K. Jain, 1999)
One other approach is to do clustering of information first. Clustering is able to
group data objects solely on the information derived from the data that describe
the objects and their relationships. The main goal of clustering is to group
objects that are similar together and they are different from the objects in other
groups.
Generally, clustering can be divided into 2 main categories namely hierarchical
and non-hierarchical clustering or partitioning clusteringas shown in Figure
2.1(Jain et al., 1999). Hierarchical clustering will group objects into a set of
nested clusters in the form of a hierarchical tree of different similarity levels

14
and this graph we call it as a dendrogram4 as shown in Figure 2.2(Kikugawa et
al., 2010). Hierarchical clustering can be further divided into 2 different
algorithmic structures which is either bottom-up (agglomerative) or top-down
(divisive). Agglomerative clustering combines the similar ones from the
bottom into groups until there is only one group remaining or a specified
termination condition is satisfied. In contrast, divisive clustering will separate
the largest group from the top into small distinctive groups based on their
similarity to the bottom.
Figure 2.2: Dendrogram(MichikazuKikugawa, 2010)
There are a few methods to do the hierarchical clustering. Among the methods
are single-linkage (nearest neighbor) and complete-linkage” (furthest neighbor)
(Hastie et al., 2009). In single-linkage method, the distance between two
clusters is determined by the distance of two closest objects in the different
clusters (distances between all pairs of patterns). In the complete-linkage
method, the distances between two clusters is determined by the greatest 4Dendrogram: It is a tree diagram where attributes or elements are merged recursively (Clusters within clusters).

15
distance between any two objects in different clusters. The single-linkage
method is more suitable to generate the resulting clusters that represent a
“chain” such as string objects. On the other hand, the complete-linkage method
is more suitable to generate the resulting clusters that represent the naturally
distinct “clumps”. An illustration of different methods to determine clustering
in hierarchical clustering is shown in Figure 2.3.
Figure 2.3: Methods to decide clustering in hierarchical clustering
The process of hierarchical clustering can be performed in four steps. Initially,
each item is assigned to a cluster. Secondly, we find the closest pair of clusters
(distances) and merge them into a single cluster so that you have lesser cluster.
Then, the distance is again computed based on the new clusters and old clusters.
Finally, repeat step 2 and step 3 until all the clusters are merged into a single
cluster.

16
On the other hand, non-hierarchical clustering is also known as partitioning
clustering. It is because non-hierarchical clustering partitions the data objects
into globular clusters5 hence there are no overlapping subsets. A sample of
non-hierarchical clustering is shown in Figure 2.4. Each of the clusters is
exactly one subset. Generally, non-hierarchical clustering has better
performance for large data sets(Schonlau, 2002; Al-kofahi et al., 2005). This is
because it is computationally prohibitive for hierarchical clustering to build the
dendrogram. It is difficult to choose the number of clusters at the beginning.
The number of clusters is normally a user-defined input parameter, before the
clustering process starts.
Figure 2.4: Sample of non-hierarchical clustering
5 Globular cluster: Generally refers to spherical and non-overlapping groups

17
In fact, there are pros and cons for both the clustering methods. We need to
build dendrogram for the hierarchical clustering and it is time-consuming.
Once the dendrogram is built it cannot be undone. For the non-hierarchical
clustering, it is suitable for large data sets especially for isotropic cluster.
However, when there are outliers, the clustering results may not be good and
we normally need to determine the initial number of clusters as input parameter
for the non-hierarchical clustering to carry out.
2.6.1 K-means clustering
K-means clustering is one of the most widely used non-hierarchical algorithms
due to its efficiency. It is based on unsupervised learning because it is able to
find the hidden structure in unlabeled data or makes natural grouping. K-means
employed a squared error method. Squared error for a clustering L of a pattern
set X (containing K clusters) is given by the formula below, where )( jix is the
thi pattern belonging to the thj cluster and jc is the centroid of the thj cluster.
This technique aims at minimizing an objective function where 2)( |||| jj
i cx is a
chosen distance measure between a data point )( jix and the cluster centre jc , it is
an indicator of the distance of the n data points from their respective cluster
centres(Likas et al., 2003). The distance measurement between data points and
cluster and the k-means flowchart is shown in Equation 2.1 and Figure
2.5(Richards et al., 2008).

18
jn
ij
ji
K
ij
cx1
2)(
1,1
||||
Equation 2.1: Distance measurement between data points in clusters
Figure 2.5: K-means clustering flowchart (Matthias Schonlau, 2002)

19
2.7 Categorizing by job elements
Normally a job description contains a number of job elements that represent it.
These elements can range from the physical abilities to education backgrounds,
social abilities, skill sets and working experiences. The job elements are
important to define the real meaning of the job and help us find and
differentiate one from another.
The occupational information network (O*NET) is an online database
(http://www.onetonline.org/) under the sponsorship of the United States
Department of Labor and Employment Training Administration (USDOL/ETA)
that provides occupational information and is accessible to the public over the
Internet at no cost (USDOL, 2010). Besides, O*NET has a database containing
information on hundreds of standardized and occupational-specific elements.
For instance, the job element of “Knowledge” may contain many sub-elements
as shown in Figure 2.6 (USDOL/ETA, 2010). It helps us organize the job
categories in detail.
Figure 2.6: Job element “Knowledge” with percentage of importance

20
Figure 2.7: Job element “Education” with percentage of respondents
Figure 2.6 and Figure 2.7 are samples of job elements that can be used to
represent a job category. For example, the importance of knowledge in jobs in
computers and electronics industry is 94% (figure 2.6). We can create various
types of job categories by benchmarking the occupational information and job
elements from O*NET database. The retrieved jobs from the online
recruitment database can now be matched to each other to find their similarities.
For this to work, we need to define the thresholds for the job elements for each
of the job categories. It has almost 250 over job elements. Then we can know
the job similarity by checking the difference between the jobs through the
comparison of their job elements derived from the job categories.
There are pros and cons to use this method. We could have an occupational
information library to start with and then categorizing the jobs in a proper way.
The O*NET database will act as a matching framework to compare and match
all the jobs from the online recruitment database. This makes the job matching
process an easy task. However, it would need a lot of manual work in order to
define the thresholds for all the job categories based on the job elements that
are benchmarked from the O*NET.

21
2.8 Collaborative Filtering
In e-commerce context, a recommender system applies the data analysis
techniques to predict and recommend items to customer. The recommendation
is to predict the top-N most similar items to customers who has previously
purchased. It uses the customer past purchasing behaviors, habits, overall top-
selling items, or user preferences to recommend items to customer.
Collaborative Filtering (CF) is proven as a successful predictive model as a
recommender system to date. The e-commerce Amazon website is one of the
examples (Linden et al., 2003).
Generally, collaborative filtering could be divided into two main categories as
memory-based collaborative filtering and model-based collaborative filtering
(Su & Taghi Khoshgoftaar, 2009). Memory-based collaborative filtering
operates the entire user-item database to generate the prediction for item
recommendation. It extensively uses the statistical techniques to predict and
recommend comparison results such as user similarity. Once the similarity is
found, the top-N items could be recommended to the entire active users. The
commonly used method of memory-based collaborative filtering is also-called
the user-to-user collaborative filtering. In contrast, the model-based
collaborative filtering provides item recommendation by first generating a
model such as user rating model based on the user purchased items. It makes
use of the probabilistic approach for the prediction based on the user rating on
the purchased items. The model-based collaborative filtering could be
performed by clustering, Bayesian network, and rule-based methods.

22
2.8.1 Content-based Collaborative Filtering
Content-based collaborative filtering (Meteren et al., 2000; Li et al., 2003) is a
hybrid approach of memory-based and model-based collaborative filtering. It is
also called as social filtering. It filters analyzethe content of the items and
creates customer profiles that are a real representation of a user's interest in
terms of keywords, phrases, and features (Julashokri, 2010). Then, the items
would be recommended to the user based on the content that matches their
interests. For instance, a book may contain author, genre, and publication and
these information details are used to match with the user preferences and
interests to do the prediction and the recommendation.
In this method, each of the users is treated independently. The item
recommendation is provided solely depending on the purchase information of a
user. For instance, a user “A” has purchased a book by the author's name of
Edison and this will be used for the item recommendation.
2.8.2 Item-based Collaborative Filtering
Item-based collaborative filteringcompares the user’s purchased items and a
rated item to similar items from the database and then compile these similar
items into a recommendation list. Matrix of similar item pairs is constructed by
calculating the similarity computation. There are a number of methods to
compute the similarity between items. Normally Pearson correlation or cosine-
based similarity is used. Figure 2.8 illustrates the process of item-based
collaborative filtering in isolating the user co-rated items and performing
similarity computation (Sarwar et al., 2001).

23
Figure 2.8: Grouping of Rated Items and Similarity Calculation(Khalid Al-
kofahi& Jack G. Conrad, 2005)
For simpler illustration, Table 2.1 shows the item-to-item collaborative
filtering. We assume that we would like to find the prediction of the rating by
User 3 on Book 3. Generally, a matrix of similarity between items should first
be constructed for the comparison purpose.
Table 2.1: User-book Purchase Matrix Table Classified into 3-PointsScales
Book 1 Book 2 Book 3 Book 4 Book 5 Book 6 Book 7
User 1 3 2 2 2
User 2 3 2 1 2
User 3 3 3 ? 2 3
User 4 2 1 2 2 3 2
User 5 3 2 2 2 3
User 6 2 2 3
The similarity between items can be calculated based on many methods and
formulas. In this example, cosine-based similarity calculation is used to

24
calculate the similarity between Book 1 and Book 3. Initially, we compute the
dot product to build the similarity scores table. Then, we could generate the
prediction for Book 3 from the ‘k’ most similar items rating and their weighted
sum. The symbol Pu,irefers to the predicted rating for a user ufor an item i
where Si is the similarity score for an item i and Ru represents the rating of user
u.By referring to Table 2.2, Table 2.3 and Equation 2.2, the predicted rating for
Book 3 is 2.8.
Table 2.2: The Similarity Scores of the Book 3 toAll the Books
Book 3 Similarity Scores
Book 3
Book 1 0.6
Book 2 0.8
Book 3 1.0
Book 4 0.4
Book 5 0.4
Book 6 0.3
Book 7 0.3
Table 2.3: The User Rating of User 3 for the Books

25
User 3 book ratings
User 3
Book 1 3
Book 2 3
Book 3
Book 4 2
Book 5
Book 6 3
Book 7
)(
)(
,,
,,,,
NiNitemssimilarall
NuNiNitemssimilaralliu S
RSP
8.23.04.08.06.0
33.024.038.036.0
Equation 2.2: Weighted sum and predicted rating for Book 3
2.8.3 User-based Collaborative Filtering
This method computes the similarity between the users instead of the similarity
between the items. The users who are similar in terms of their preferences,
interests and profiles would be compiled into the recommendation list. In this
case, the similar users are grouped as the “neighbors” and this is computed
according to their past rating on the items. Any unrated item from the users
would be recommended based on neighborhood past rating.
2.8.4 Pros and Cons of Collaborative Filtering (CF)

26
Table 2.4 shows the pros and cons of Collaborative Filtering (CF). In general,
CF requires user ratings to make the prediction. A model of user ratings needs
to be created first in order to do further manipulation like link analysis and
clustering. Building a model of user ratings is time consuming and there is a
cold-start problem where the item without user rating could not be
recommended.Moreover, online recruitment websites do not maintain user
ratings hence CF is not suitable for job matching.
Table 2.4: Pros and Cons of Collaborative Filtering
CF Category
Memory-Based Model-Based Hybrid
CF
Technique
User-based or item-
based method (Utilize
the whole user-item
database)
Link analysis or
clustering (Create a
model of user ratings
first and then do
prediction)
Content filtering
method or
combination of
memory-based and
model-based methods
Pros - It can be done easily
- Content / information
from users or items is
not required
- Scalable
incrementally
- Increase prediction
performance for
recommendations
- Increase scalability
- Address sparsity and
cold-start problems
- Improve prediction
performance of
memory-based and
model-based CF
-Solves CF limitations
like sparsity, cold-
start and gray
sheep(Claypool et al.,
1999)
Cons - Cold-start issue
(There is no
recommendation for
new user / new items)
- Sparse database
hinders good
recommendation
- Need human ratings
- It is expensive and
time consuming to
build a model
- Complex and
expensive
implementation

27
2.9 Latent Semantic Analysis
Currently, online recruitment websites are still facing challenges in
recommending suitable jobs for job seekers. Due to various backgrounds,
working experience and different expectations of job seekers, the matching
may need to be further improved to provide better recommendation to the job
seekers.
A promising approach to overcome these limitations is the Latent Semantic
Analysis (LSA). The LSA is a high dimensional linear associative model
(algebraic model) that automatically learns and analyzes a large corpus of
terms or words to produce semantic similarity of terms and sentences
(Landauer et al., 2007). Besides, Latent Semantic Indexing (LSI) is often used
to imply the application of LSA in information retrieval (IR) context as a
retrieval strategy.
Latent Semantic Indexing (David et al., 2004; Baeza-Yates, 1999) and the
underlying method used by LSI called Singular Value Decomposition (SVD)
(Konstantinos et al., 2005; Ientilucci, 2003)allows us to find the latent or the
semantic structures in sentences (Deerwester et al., 1999). Meaning or
semantic can be retrieved by this method where a corpus of words is being
queried and this is called concept searches. In addition, normally it is used to
search for a set of documents. Documents that have similar concepts based on
the query criteria will be returned even if the results do not share common
terms.

28
2.9.1 Theory of Meaning
LSI is derived and evolved from the theory of meaning. Initially, many thinkers
like Plato, Chomsky, and Pinker have considered the assumption that a
computer with only input from raw subsets of natural language, prima facie6
can generate things like humans do is merely impossible. There are multiple
explanations of the word “meaning” by philosophers, novelists, poets,
theologians, linguists and humanists. Some claimed that meaning is derived
from abstract concepts or properties of the world prior to and independently of
any language-dependent representation. Hence, there is an assumption that
computer cannot create meaning from the data itself, ipso facto7(Landauer,
2007).
However, according to Thomas K. Landauer, LSI is able to match natural
language quite successfully without the requirement of human interventions.
People would be assumed to imply an understanding of the meaning of words
and sentences. This is achieved when the collections of words are mapped into
the concept space. Imagine that the collections of words are mapped into two
or higher dimensional spaces, the entire relations are represented by its location
in the high dimensional space (Landauer et al., 1998). Therefore, this gives the
word meaning by this computational model. A more thorough explanation
about concept will be discussed at a later stage.
6 Prima facie (prīmā faciē) – First justification, first sight or first encounter (Robert Audi, 2003)7Ipso facto – It’s a Latin expression meaning “by the fact itself” (William J. Dominik, 2006)

29
On the other hand, LSI is neither physical objects nor human brain. It is just a
mapping technique that mimics what a brain does. Also, LSI implementation
does not take into account word order in the sentences. However, it reflects as a
theory of meaning due to its capabilities of comprehension, acquisition and
manifestation of meaning. It is able to accomplish tasks like a human does with
some level of success. Therefore, LSI is used to differentiate and categorize
documents like human experts (Michael, 2004).
2.9.2 Concept-based Framework
The capabilities of comprehension, acquisition and manifestation of meaning
are closely related to Concept. In other words, grouping or mapping. How to
determine the similar ones from a set of documents or job resumes? There are
many ways of doing it, by examining documents manually, classifying the
documents, clustering and many more. For job matching, one way is to try to
find concepts in common between the jobs (documents). Latent Semantic
Indexing (LSI) is attached to a concept-based approach and we will explain
how it works in detail later. The LSI representative words and jobs in a high-
dimensional space allowing relationships between terms (words) and jobs to be
exploited during searching. We actually use mathematical properties of a term-
job matrix and determine the concepts by matrix computation.
Concept-based approach is a more suitable method for job matching compared
to conventional method. For instance, keyword matching is a straightforward
method to determine similarity of two entities in the text where job seekers'
input data will be used as an input query to find similar jobs from all the job
contents based on certain keywords that are matched. However, there is a

30
problem in this job retrieval that is solely based on input query and job content
because different companies may have different perspectives onthe job position.
Also, different job descriptions may be used to refer to the same job position.
That is where the concept-based approach comes into the picture. This
approach does a very good job in job matching based on context regardless of
the job content or the job description. In other words, we do not need to
understand every single word in job content in order to find a similar job. Thus,
a broader range of job can be retrieved compared to keyword matching.
Employers do not need to write and describe their job position only for the
purpose of easy retrieval. The employer can now describe a job with different
words and different naming. These are some of the reasons why a concept-
based approach is suitable for job matching.
Basically, a concept is an intangible and additional layer in between input
query and targeted jobs. This additional layer introduces job context rather than
job content and it is used to map a query to jobs and vice versa. Concepts are
not predetermined and fixed. These are generated based on the semantic
relationships between them.

31
Figure 2.9:Sample of Concepts
The idea of concept is illustrated in Figure 9. For instance, the term apple can
refer to different concepts depending on the context. When the term apple, iOS
and Developer concurrently appears in job responsibilities, this may imply the
Apple Computer Inc. Similarly, when the term apple, mango and farm
concurrently appear in the job responsibilities and this may imply something
related to fruit farm or industry. Therefore, the first job concept can refer to
iOS Developer or Mobile Device Engineer and the second job concept can
refer to Farm Supervisor. Besides, two or more concepts can be combined
together to create different combinations of them. For example, combination of
Concept 4 and Concept 5 is shown in Figure 2.9. One of these advantages is
the ability to take benefits of latent relationships among concepts in finding
relevant documents. Job similarity can be identified as long as the concepts are
captured.

32
2.9.3 Dimensionality Reduction
In general, the matrix generated by including the terms and frequency found in
documents or job descriptions is sparse and dimensionality reduction is a
common technique used to address this. Dimensionality reduction serves as an
extremely powerful technique especially in a very large and sparse matrix that
represents the terms and sentences. A proper dimensionality reduction keeps
the important information and reduces the noise.
If we have enough variables, every object is different in characteristics. For
example, vector A consists of |1 2 8 9| and vector B consists of |1 2 3 4|. Here if
we trim the two rector digits behind each of them respectively and they are
totally alike. If we trim only one digit behind of them respectively, they look
different in characteristics.
Normally additional dimensions may not necessarily provide more information
and they can introduce noise. It is important to keep the important ones to the
extent where it is enough to differentiate the similarity between the objects and
throw away the unwanted ones. Dimensionality reduction technique is an
essential approach and it is also used in LSI.
2.9.4 Similarity Matching by Matrix Decomposition
The matrix decomposition in LSI is done through Singular Value
Decomposition (SVD) and is defined by A = U�VT. In which, U is the
orthogonal matrix to represent row space of word vector, � is the diagonal
matrix with singular values spanning from largest to smaller or zero magnitude
across the diagonal entries. The top k values of singular values are selected as a

33
means of developing a “latent semantic” representation of the A matrix.
Singular values are also used to determine the “signal” dimension or “noise”
dimension of the matrix A. It further strengthens the similar ones more and
weakens the dissimilar ones. Hence, the low rank approximation, k is
employed to reduce the noise portions. The reduced dimensionality of the
matrix factorization decomposition now can be written as Ak = Uk�kVkT.
Figure 2.10 is a pictorial representation of matrix decomposition of A with
dimensionality reduction. This process will eliminate the additional noise in the
matrix by increasing the matching effectiveness (to alleviate the polysemy and
synonymy problems). Therefore, choosing a good value of k is crucial. There is
no fixed method to define the k value and usually it is determined empirically.
However, we have proposed a dimensionality reducer that is able to predict
optimum number of dimensionality reduction. Last but not least, the VT is the
orthogonal matrix to represent the column space of job vector. UTU= I and
VTV= I where I is identity matrix. The columns of U are orthonormal
eigenvectors of AAT and the columns of V are orthonormal eigenvectors of
ATA (Strang, 2006).
Figure 2.10: Matrix ‘A’ Decomposition

34
Thus far, the matrix A has been decomposed into respective term and job
vectors and singular values. Normally, a query matching is done in 2 steps,
projection and matching. First step is to map the input queries (job vector) q
into the matrix Uk corresponding with the singular values �k, which is, Q =
qTUk�k-1. Then, subsequently the computed Q is used in the similarity measure
(Cosine-based – Dot Product) with VkT, such as the angle between a job and
query vector indicates the similarity between the two. Once the similarity
measurement is calculated then we can actually know how similar a job with
another job in terms of vector form.
2.9.5 Singular Value Decomposition (SVD)
Singular Value Decomposition (SVD) is commonly used in image processing,
recommender system, document clustering and more(Langville A. N., 2006;
Iakovaki et al., 2004; Celebi et al., 2009; Gee, 2003; Ito et al., 2004). Therefore,
it is a common tool in linear algebra application (Michael et al., 1995).
Firstly, SVD could be a method of transforming correlated variables into a set
of uncorrelated ones that better expose the various relationships among the
original data items. Secondly, SVD is claimed to be able to order the
dimensions so that data points exhibit in the most variation. Then, it is possible
to find the best approximation of the original data points using fewer
dimensions. We called this as data reduction. For better understanding, we
illustrate the idea above in a Cartesian coordinate plane with some data points.

35
Figure 2.11: The Best Approximation to theData Points (Baker, 2005)
As we observe above in Figure 2.11, we could draw a perpendicular line to fit
between each of the data points to best approximate the reduced representation
of the original data points plotted in two-dimension. On the other hand, this
could be done in other poorer way. Imagine that if we draw another line cutting
through the first regression line, and it tries to coveras much of the scattered
datainthe second-dimension based onthe original data set. However, it does a
poorer job of approximating the original data compared to the first
representation because it corresponds to a dimension exhibiting lesser
variations as shown in Figure 2.12.

36
Figure 2.12:Lesser Variations Approximationtothe DataPoints (Baker, 2005).
In short, SVD is a dimensionality reduction technique that takes a high
dimensional variable set of data points and reduce it into a lower dimensional
space. This reduced representation exhibits the most important substructures of
the original data points. The other variations can be ignored, in which, below a
certain threshold and it is known as noises. These noises contribute
insignificantly to the overall relationships and substructures. To demonstrate
Latent Semantic Indexing (LSI) by Singular Value Decomposition (SVD), we
use the following sample Query, Task 1, Task 2 and Task 3 where these tasks
are taken from job descriptions.

37
A term-job table is constructed based on this example and a matrix A is
obtained from the numeric columns in the term-job table as shown in Appendix
C. The initial step is to compute the SVD on the matrix Aas shown in Equation
2.3 and Appendix D. In this case, the ‘k’ is a representation of the
dimensionality reduction where k = 2. In other words, we only keep two
dimensions and ignore the rest. Next, we convert the query, q (software quality
assurance) into a vector (1 1 0 0 0 0 0 0 0 0 0 0 0 0 1 0 0 0 0 0 0 0 0 0 0 0 0 0 0
0 0 0 0 0 0 0 0 0 0 0 0 0 0 0 0 0 0 0 0 0 0 0 0 0 0 0 0 0 0 0 0 0 0 0 0 0 0 0) and
computes its coordinate points based on the formula as shown both in Equation
2.4 and Appendix E. Then, this calculation is continued by calculating
similarity measurement of task 1 (-0.7924, 0.1582), task 2 (-0.5706, 0.1493),
and task 3 (-0.2157, -0.9761)toquery, q (-0.0640, 0.0572)as shown in Equation
2.5, Equation 2.6, and Equation 2.7 respectively.
Query, q: "software quality assurance"
Task 1: “Software Quality Manager provides analysis and consulting on highly complex software development projects related to quality assurance, work processes, and compliance with standards and methodologies. Manage and lead a team of software quality engineers for the development and execution of software test plans and procedures.”
Task 2: “Software QA Engineer Define and evolve quality assurance / test strategy and associated process and tools. Create test plans and execute test cycles to ensure high-quality and successful software release.”
Task 3: “Customer Service Executive needs to answer all customer interactions by phone on product related enquiries and product features. Customer oriented and has the ability to work independently under minimum supervision.”

38
Tkkk VU
Equation 2.3: Singular Value Decomposition
1 kkTUqQ
Equation 2.4: Computes Query Coordinate Points
Finally, the similarity value of query q and Task 2 has the highest value which
is 0.8901. This concludes that Task 2 is the best match of query q whereas
Task 1 is also highly related and Task 3 is considered as less relevant.
8618.0)1582.0()7924.0()0572.0()0640.0(
)1582.0)(0572.0()7924.0)(0640.0(22221
Task
Equation 2.5: Similarity Measurement for Task 1 and Queryq
8901.0)1493.0()5706.0()0572.0()0640.0(
)1493.0)(0572.0()5706.0)(0640.0(22222
Task
Equation 2.6: Similarity Measurement for Task 2 and Queryq
4890.0)9761.0()2157.0()0572.0()0640.0(
)9761.0)(0572.0()2157.0)(0640.0(22223
Task
Equation 2.7: Similarity Measurement for Task 3 and Queryq

39
2.9.6 Similarity Measurement
The similarity measurement enables us to measure similarity between two
items by measuring the difference. The commonly used methods are Pearson-r
correlation or Cosine-based (dot product) similarity measurement (Su &
Khoshgoftaar, 2009). In Equation 2.5, Equation 2.6 and Equation 2.7, they
were calculated by Cosine-based similarity measurement. It is measuring
cosine angle between the two vectors. Thus, it determines whether the two
vectors are pointing in roughly the same direction. The maximum cosine
similarity is 1 which means their unit vectors are exactly identical to each other.
We can observe from the picture below, the closer the angle between two
vectors the more similar of them from each other. Then, we can visualize it as
similar topic, category or group as shown in Figure 2.13.
Figure 2.13: Vectors in Different Angles

40
The mathematical formula of cosine-based similarity for an x-y coordinate
system is as shown in Equation 2.8(Madylova, 2009):
22 ||||*||||),cos(),(
ji
jijijisim
)22()11(
)2*1()2*1(2222 yxyx
yyxx
Equation 2.8: Cosine-based Similarity Measurement
2.10 Group Knowledge
To provide better job matching results. One way is to include group knowledge
in the algorithm. Normally, groups could perform better than an individual
where such groups mutually share knowledge interactively. These groups do
enable learning and gain more knowledge over the time and we call it
collective learning. Rafael says “Collective Learning (CL) opens a new
dimension of solutions to address problems that appeal for gradual adaptation
in dynamic and unpredictable environments” (Rafael & Neto, 2007). In short,
CL is able to sum the individuals’ collective effort to solve a complex problem.
2.10.1 Collective Learning
In cognitive science, researchers normally focus more on individual learning
rather than the groups. Human is collective learner themselves, however, it is
too complex to analyze the key of success in the collective learning process in
reality. In contrast, the interaction of animals is rather simple and exhibit
collective learning behaviors. The idea of social insects that is derived from the

41
swarm intelligence concept is part of the collective learning and closely related
to the insects, ants. Basically, ants communicate to each other based on the
pheromone trials. For instance, the ants found the shortest path in the food
source based on the strongest pheromone left behind from the other ants. There
was an algorithm developed based on this idea namely Ant Colony
Optimization (ACO)(Kennedy, 2006; Doerr et al., 2012). Similarly, school of
fishes could be another source of inspiration where fishes move under the
water flawlessly. In general, a particle has the information of its own position
and velocity,the relative position and the other particles with the rules for
updating the position and velocity. In this sense, a particle can be a
replacement of a fish and Particle Swarm Optimization (PSO) algorithm was
developed(Abraham et al., 2008). In short, the interaction in a group is closely
related to the stimulus and the response and these are the success factors of the
collective learning.
In social science, Collective Learning (CL) (Backström, 2004; Gambarotto et
al., 2001) is a social process that combines two or more minds together to solve
a problem. Usually this involves collective ideas and knowledge produced by a
group of people. This group of people can be a society, an organization or the
Internet users. In addition, collective learning is often referred to large
voluntary group and its collaboration toward solving of a problem.

42
The focus of collective learning is on intellectual synergy that emerges in
interaction between the individuals. In simpler terms, a group that makes better
decisions than its individual members is considered to exhibit collective
learning. This takes into consideration that none of us is able to know
everything oneself as a group is more than the sum of its parts. The complex
problems can be solved when a group of people from different backgrounds
and disciplines solve it together.
On the other hand, collective learning is also called collective intelligence (CI)
(Klein, 2007; Maleewong et al., 2008). Normally, collective intelligence can
exploit the network technology and the Internet to channel many minds of the
Internet users to solve a problem. Moreover, Massachusetts Institute of
Technology (MIT) Center for Collective Intelligence describes CI as “group of
individuals doing things collectively that seem intelligent” (Malone, 2006).
Tools like e-mail, communication messenger, forums, blogs, and software can
be used to collaborate with CI. On the other hand, crowdsourcing, swarm,
wikinomics and smart mobs are some of the examples of CI.
CL will stimulate the whole group so that it becomes more knowledgeable and
informed about the issue in its entirety as a result of mutual exploration and
feedback from the individuals over the time. Therefore, CL can adapt to
context easily and improve problem solving quality with the help of group
decisions (Kukla, 2008; Hinchey et al., 2007; Berg et al., 2005). Again, all
these are dependent to the stimulus given to and the response from the

43
groupwhere they have the common problem to be solved.The feedbacks and
the solutions are the outputs from the group.
2.10.2 Relevance Feedback
On the other hand, collective learning is a recurring process and it would not
work without multiple loops and continuous interaction. A popular IR utility is
relevance feedback (Xu et al., 2008; Wang et al., 2010). The basic premise is to
enrich the user’s initial query and to implement retrieval in multiple passes.
Normally, new terms are added to the initial query based on certain criteria
such as top ranked documents that are relevant. This process can be done with
manual (required human intervention where the user needs to select relevant
documents) or automatic (assumption of top-N documents are relevant)
operation. That is, the user’s initial query is modified according to this selected
feedback and it is re-executed. Therefore, it is an effective method for
improving retrieval performance.
There are several types of relevance feedback such as explicit feedback,
implicit feedback, pseudo feedback, positive feedback and negative feedback
(Fu et al., 2011; Shen et al., 2005). Generally, it is about the intentionality of
the user’s behavior. For explicit feedback, it is for the user to provide relevancy
judgment. Users indicate relevance explicitly from a set of retrieved documents
using a binary or a graded relevance technique. The Relevancy between
documents and query is measured on a scale in graded relevance feedback such
as “Highly Relevant”, “Marginal Relevant” or “Not Relevant”. For implicit
feedback, it is related to the user’s behavior and they are not necessarily
informed for feedback selection. For instance, we may assess on theduration

44
spent to view a job advertisement and browsing history, whether they do or do
not select a job for viewing and their job application behavior.
Besides, pseudo feedback is also called blind feedback. This kind of feedback
is used to automate the manual part of relevance feedback. We assume top N
ranked documents are relevant where N is a numeric value. These documents
will be used for query modification bythesefeedbacks. Thenwecan improve the
retrieval performance without human interaction. In addition, when a set of
relevant documents are retrieved, it is referred as positive feedback. In contrast,
when a set of not relevant documents are retrieved it is referred as negative
feedback. In this thesis, pseudo feedback and positive feedback will be used to
integrate with collective learning method.
2.11 Summary
In this chapter, different types of information retrieval techniques are discussed.
The basic retrieval strategies such as Boolean retrieval and Vector Space
Model (VSM) are straight forward and simple methods. Therefore, it is still
widely used but a lot of improvements could be made to these methods in order
to increase its effectiveness on information retrieval. On the other hand,
clustering is a heuristic algorithm8 that is suitable to be applied to large data
sets in various fields such as image processing, market segmentation, computer
vision and geostatistics. Anyway, there is no guarantee that it will converge to
the best solution and the result may depend on the number of clusters used and
this is a major drawback.
8Heuristic Algorithm: In computer science perspective, heuristic algorithm is a computational approach that is used to find the best approximations to the solution of specific problems.

45
Besides, categorizing job by job elements is a useful method for recruitment
field. A job may consist of a combination of elements like knowledge, skills,
work attitude, abilities, interests and more. Each of these core elements may
also consist of sub elements and all are estimated in different length of
measurement (in percentage) corresponding to a number of jobs. We could also
use the O*NET library as reference for all the job elements to possibly describe
most of the job types currently available in recruitment websites. It is good for
future developments especially in the recruitment area because we could
benchmark all the possible job types. Unfortunately, it requires a lot of human
work before it is being used practically. All the elements that are belong to a
job type need to be predefined. Basically, we need to estimate and define these
elements manually for all job types available in the recruitment websites. Since
different people may think differently, the definition of job elements is not
feasible and lack efficiency.
Next, collaborative filtering is a successful model that is used in Amazon.com
as a useful recommender system. This suggests the possible use of the database
or the customer behavioral data with suitable data mining techniques or
predictive models to generate more accurate recommendations to the customers.
However, one of the weaknesses of collaborative filtering method is that it
depends on human ratings. It is part of the inputs ofthe prediction process for
collaborative filtering to enable accurate information retrieval. It requires user's
human intervention in order to construct a rating model which is troublesome
and time consuming. Besides, retrieval efficiency decreases when data get
sparse and this is especially true for items sold over the Internet.

46
Latent Semantic Indexing (LSI) is an information retrieval method that uses a
linear algebraic technique namely Singular Value Decomposition (SVD) to
analyze and to identify semantic relationships, patterns and commonality that
are contained in an unstructured corpus of terms. Normally the meaning
derived by semantic relationships from this corpus of terms we call it as the
context or the concept because it has captured almost all the vital information.
Practically, it is helpful to increase job matching effectiveness and efficiency in
terms of matching accuracy and broader job range. With this feature, system is
no longer limited by query matching through by keywords, synonymy and
polysemy. However, it needs more time to build the working model due to its
complexity.
In addition, a complicated problem could also be resolved by depending on
feedbacks from a group of people from different backgrounds and disciplines.
This takes into account that a person may havelimited knowledge and
experience. In such case, information sharing and knowledge sharing exhibit
collective learning as a synergy of decisions. Collective learning takes many
minds together to solve problems. Therefore, the more people involved, the
better decisions can possibly be made. The main disadvantage of collective
learning is that it is dependent on the amount of information interacted and
shared. When there is no information being shared in between the job seekers,
this will hinder the collective learning processfrom succeeding in solving
complex job matching problems.

47
We could make an assumption that LSI is an algorithm that tries to imitate a
human brain in solving problems. However, an individual has very limited
resources in solving complex issues. In contrast, a group of job seekers may be
helpful to make decisions such as solving complex job matching problems
instead of an individual alone. Therefore, in chapter 5 we have proposed a
hybrid algorithm which is the combination of Job Enhanced Latent Semantic
Indexing (JELSI) method with collective learning method (CL).

48
CHAPTER 3
3.0 DATASETS AND EVALUATION
In this chapter, we will discuss the datasets used, evaluation methods, and
limitations.
3.1 Introduction
The main purpose of evaluation is to measure how well information retrieval
methods achieve their targeted goal. To estimate the effectiveness of an
information retrieval technique it must be given a situation and then compare it
against a different method with the same situation.
The conventional evaluation methodologies have served to prove the
effectiveness of many techniques like probabilistic model, the language model
and pseudo-relevance feedback (Büttcher et al., 2010). However, due to larger
collections of data and some recent new demands, these conventional
techniques may not be adequate in actual application. Such demands include
the need for graded relevance assessments, the need of handling missing
judgments and the need to accommodate novelty and diversity.
Furthermore, usually the assessments of effectiveness are not just the matter of
match or not match. It’s more on ranked the results from the top (most similar
match) to the bottom. Therefore, in this chapter more will be discussed in the
methods suitable for this case.

49
3.2 Datasets
The data used in this research project were provided by Jobstreet.com, a
leading regional online recruitment company with 10 millions of users.
Jobstreet.com offices are based in Malaysia, Singapore, Philippines, Indonesia,
Thailand, Vietnam, India, Japan and Hong Kong. Jobstreet.com allows job
seekersto find their dream jobs and top companies to find their talent.
A total of 3089 job collections was retrieved from the Jobstreet.com database
servers. Basically the content of the raw data consists of Job ID, Server ID,
position title, company name, URL, job requirement and job responsibility. Job
ID is a numeric value that is used to identify a job uniquely, whereas Server ID
is a numeric value that is used to identify which server that the raw data is to be
retrieved from. Then, position title, company name, job requirement and job
responsibility show the details of a job based on Job ID that are to be retrieved
from a number of servers. In the research project, we analyze the datasets
based on company descriptions, position title, company name, job requirement
and job responsibility.
We have proposed fourmajor job groups to be tested and evaluated against
3089 job collections in JLSI, JELSI and JELSI-CL methods which are (i)
Communication Manager, (ii) Construction / Site-Engineer / Supervisor, (iii)
VB .Net / VB 6 / PHP Software Developer and (iv) Finance Manager /
Accountant. These four job groups will be used so that the experiment is able
to carry out and test in full coverage of all the specific and general jobs
available in 3089 job collections. Jobs queryis created and represented in terms
of the vector form (extracted from a corpus of terms) that is to be generated for

50
each job group.Thesejobqueries are used to evaluate and test against 3089 job
collections with the proposed job matching methods.
3.3 User Evaluation Method
In user evaluation, measurement of effectiveness for information retrieval
relies on the real users’ opinions about the relevancy of the retrieval. We can
have experts specializing in the field to check on the results of the retrieval
based on feedbacks from a group of job seekers. This approach is potentially
capable of verifying whether the information retrieval satisfies its users’ needs.
However, there are still some disadvantages of using this approach. First of all,
the user’s expertise and level of a user’s experience with information retrieval
may affect the quality of the evaluation. Secondly, this kind of evaluation
usually cannot be performed automatically and requires human intervention.
3.4 Recall and Precision
Recall and Precision are commonly used to measure the effectiveness of a
retrieval method (Equation 3.1 and Equation 3.2). We often determine the
effectiveness of a Boolean query by recall and precision (Raghavan et al.,
1989). For instance, a user might formulate a Boolean query ((“analyst” AND
“programmer”) OR “developer”) AND (“database”). In this case, users may
judge the result whether it is relevant or not relevant by considering a binary
assessment.

51
cumentsrelevantDo
ocumentsretrievedDcumentsrelevantDorecall
Equation 3.1: Recall Measurement
ocumentsretrievedD
ocumentsretrievedDcumentsrelevantDoprecision
Equation 3.2: Precision Measurement
Recall indicates the fraction of relevant documents that appears in the result set
and Precision indicates the fraction of the result set that is relevant. For both
recall and precision, a value which is close to the numeric “1” refers to a highly
relevant result, whereas the numeric “0” refers to a not relevant result.

52
3.5 Graded Relevance
Modern Web 2.0 tends to overwhelm users with vast information especially
retrieval environment like search engine. Since not all documents are equally
relevant, the highly relevant documents should be identified and ranked first
for better presentation. We need to have this kind of evaluation method first in
order to develop a proper information retrieval technique towards this direction.
The graded relevance (Kekäläinen, 2005) evaluation method is one of these.
Graded relevance is a non-traditional effectiveness measure. Instead of binary
relevance9, graded relevance expresses varying quality of documents to satisfy
the needs of different users. We could judge the quality of the documents bythe
four-point scale of “Highly Relevant”, “Relevant”, “Marginal Relevant”or
“Not Relevant”. This is particularly useful in mixed navigational or
information search task like search engine as there is no exact right or wrong.
Users would like to look for the information that is as much identical as to their
preferences. To prevent information overloading, we could always rank the
retrieval to top k. One of the common graded relevance methods is Normalized
Discounted Cumulative Gain (nDCG) (McClean et al., 2007). It operates by
comparing the relevant values of a ranked result list with the “ideal” result that
would be achieved by rank all the most relevant documents first in descending
order.
9Binary relevance: Evaluation method that gives equal credit for a retrieval technique for retrieving highly and marginally relevant documents.

53
To simplify the explanation, only 6 documents are used. To illustrate the idea
in detail, assume that we have top 6 documentsthat are returned by an
algorithm in this order D1, D2, D3, D4, D5, and D6. D1 is the most relevant, and
D6 is the least relevant, as decided by the algorithm. We use the four-point
scale as[10 – highly relevant, 5 – relevant, 1– marginally relevant, 0 – not
relevant] to do the document assessment. Initially, the Jobstreet.com experts in
this area have assessed the relevancy of documents to the query as (10, 5, 10, 0,
1, 5) for these documents. Please note that the assessment of relevancy may
vary depending on the expert experience level. Ideally an algorithm which is
comparable to human expert should return the order of documents in this
sequence (10, 10, 5, 5, 1, 0) in terms of relevancy, and it is called as ideal
Discounted Cumulative Gain (iDCG). We need to calculate the Discounted
Cumulative Gain (DCG)and iDCGfirst, for these two sets of rating to gain the
final result by comparing them (Refer to Figure 3.1 and Figure 3.2). The
symbol i represents the order of the documents and the symbol reli indicates
the relevance of each document to the query for the assessment. The formulae
are shown in Equation 3.3, Equation 3.4 and Equation 3.5. Cumulative Gain
(CG) is the predecessor of DCG where it does not include the position of a
result in the consideration of its importance and relevancy. It is the sum of the
graded relevance in rank position P in the result sets. However, in DCG, log of
base 2 is used to include the position of a result in the consideration of its
importance of using the logarithmic scale for reduction where this will
emphasize the highly relevant documents appearing early in the result sets.

54
P
iiP relCG
1
Equation 3.3: Cumulative Gain (CG)
P
i
iiP i
relrelDCG
2 2log
Equation 3.4: Discounted Cumulative Gain (DCG)
p
pP iDCG
DCGnDCG
Equation 3.5: Normalized Discounted Cumulative Gain (nDCG)
Figure 3.1:Assessment of the DCG6

55
Figure 3.2:Assessment of the iDCG6
Figure 3.3:Final Results Computed for nDCG6for Ideal Case where the
Algorithm Predicts the Same as that of Human Experts
Finally, we could obtain the nDCG6 as 0.91 by dividing both sets of DCG’s
rating DCG6 / iDCG6 (Figure 3.3). The result shows that the retrieved
documents are highly relevant in this example. We can always compute
whichever ranked retrieval that is to be rated, in this case, ranked 6 (nDCG6 or
nDCG@6). Also,this will be referred asnDCG@K where K=6 throughout this
thesis. There is no fix K, we proposed that it can be up to K=60 throughout the
experiment and implementation.If user would like to have only one highly

56
matched result then K=1 will be suitable. In job matching field, practically
K=20 or above is expected from job seekers because they would like to have a
range of jobs to be selected. This is because ranked retrieval will rank highly
matched results first and then this is followed by marginal and irrelevant
matched results.
Also, note that the value of four-point scale could be modified
accordinglybased on users’ preferences and we will use this to analyze the job
matching results in Chapter 4 and Chapter 5.
3.6 Problems and Limitation
The nDCG method also has its limitations. First of all, the expert evaluation is
much dependent on the expert’s experience level, expertise and domain
understanding. Besides, it is time-consuming and difficult for automatic
implementation as this requires human evaluation and intervention.
3.7 Summary
We have presented several evaluation methods with descriptions of their
advantages and disadvantages. In the modern large database environment, we
should consider the evaluation method and information retrieval technique that
is able to retrieve highly relevant documents as well as marginally relevant
documents. This is particular true when users need varying relevancy of
matching the quality of documents and options. Therefore, nDCG would be our
choice of evaluation method.

57
CHAPTER 4
4.0 JOB LATENT SEMANTIC INDEXING (JLSI) METHOD
In this chapter, the Job Latent Semantic Indexing (JLSI) method is proposed.
This is an extension and adaptation of the Latent Semantic Indexing (LSI)
technique in job matching problem.
4.1 Introduction
In general, the LSI is used to find similar documents based on a query in a
search engine or document matching. At present, this is a novel attempt for the
application of LSI in the job matching area. That is, initially collections of a
corpus of terms are collected from company descriptions, job title, job
responsibilities or job requirements provided by recruitment databases. For this
implementation, we focus more on the job-to-job similarity matching rather
than resume-to-resume or job-to-resume matching. Therefore, we only do a
comparison of job similarity from job collections and the comparison results
will be used to find similar candidates based on patterns and threshold. We
called this Job Latent Semantic Indexing (JLSI) method.
4.2 Block Diagram of the Proposed JLSI Method
Figure 4.1 shows the block diagram of JLSI method. We will explain this
diagram in detail in coming sections where each of the processes has its unique
functionality and purposes. In overview, job database is represented as an input
of datasets to this algorithm for further processing and the data are passed
through the subsequent processes. These processes are Pre-processor, Matrix

58
Parser, Matrix Dimensionality Reducer, Semantic Indexer and Ranker. Each
output from an earlier process will be an input for another process in a
sequential way. For example, Figure 4.1, output “pre-processed text for jobs”of
Pre-processor will be an input to Matrix Parser. Also, each process may contain
one or more sub processes like Tokenization, Stemming and Stop words in Pre-
processor. The final output of this algorithm is a list of similar jobsto be
recommended for job seekers.

59
Figure 4.1: Block Diagram of JLSI Method
Job database 1. Pre-processor
a. Stemmingb. Stop Wordsc. Tokenization
Pre-processed text for jobs
2. Matrix Parsera. Row Reduction
Term-to-job Frequency Matrix
3. Matrix Dimensionality Reducer
The optimum number for dimensionality
reduction
4. Semantic Indexer
Job-to-job Similarity Scores
5. Ranker A list of similar top ranked-N jobs
Descriptions:

60
4.3 Job Database
Online recruitment websites offer a great number of jobs for job seekers by
employers. These websites contain all the related data and information from
individuals and companies included, but not limited to job title, company
descriptions, job descriptions, job responsibilities and candidate job application
behaviors. All these information will be stored on and retrieved from job
database servers. Online recruitment websites allow us to refine our search
with keywords, update latest employment information and offer different tools
that provide value added services on the recruitment process. Hence, job
databases possess all the information required for detailed job analysis,
industry information and user usage behaviors. Therefore, raw data that is to be
used in the experiments will be retrieved from job database.
4.4 Pre-processor
Before the job database can be used in the job matching process, the raw
datasets need to be pre-processed as raw datasetscontained unanalyzed data.
Pre-processor is a program that allows data cleaning and data filtering so that
the irrelevant and duplicate datasets can be screened and purged before running
an analysis. It also transforms the data sets into more representative and easy
access format. This is the earliest stage that helps system to capture and
manipulate datasets into the proper forms so that the JLSI computation could
be carried out smoothly.

61
4.4.1 Stemming
Stemming is part of the steps in Pre-processor. Frequently, user refers stem as
the root word. Root word is the portion of a word which is left after the
removal of its affixes10(Popović, 2009). Stemming considers the morphology
of words and reduces each word to its root form. A typical example of a stem is
the word ‘walk’ which is the stem for the variants ‘walks’ and ‘walking’.
Retrieval performance can be improved by stemming as variants of word are
summarized to root words. On the other hand, the size of the indexing structure
is significantly reduced as the number of the distinct index words has reduced.
The practical application of the stemming chosen in this research is Porter
Stemmer,which is one of the popular stemming algorithms developed by
Martin Porter in late 1970s (Porter, 1997).
4.4.2 Stop Words
Similarly, Stop words are part of the steps in Pre-processor. During the pre-
processing stage, stopping or stop word is normally used to filter word which is
not significant to overall context and text comprehension (Al-Shargabi et al.,
2011). In search engine perspective, function words are preventing a good
search because they are generally less useful in searching. These are words
such as, the, is, on, which, a, and an. Similarly, it is also applied in the job
matching area. We remove words that have no significant influence in job
matching. There is no fix set of stop words. It is flexible as the stop words list
10An affix is a morpheme that is attached to a word stem to form a new word. Affixes may be derivational, like English -ness and pre-, or inflectional, like English plural -s and past tense -ed. They are bound morphemes by definition; prefixes and suffixes may be separable affixes. Affixation is, thus, the linguistic process speakers use to form different words by adding morphemes (affixes) at the beginning (prefixation), the middle (infixation) or the end (suffixation) of words. (Wikipedia, 2005)

62
can grow over the time. Also, a good stopping must be empirically tested for
their usage in the particular context and field. Logically, stop words are used to
increase the searching accuracy and improve the matching. Besides, the
performance also increases as a result of the reduction in total words of the
overall context compared to the original ones.
4.4.3 Tokenization
In the experiment, tokenization is the last step of the pre-processing stage.
Tokenization is a process of discovering specific patterns in raw datasets and
then breaking them into a stream of text or terms so that they are more
manageable. Normally the tokenization patterns are created from raw data sets
provided from job database. The real implementation will be illustrated in the
coming Design and Implementation section. In this case, the datasets from job
database were preprocessed with stemming, stop words and tokenization.
Finally, its output will be passed on to Matrix Parser for further processing.
4.5 Matrix Parser
Subsequently, Matrix parser will receive the previous preprocessed data sets
that are produced from the Pre-processor in an easy access format. Then, the
Matrix Parser will parse it into a frequency matrix that consists of rows and
columns and we call it as a term-to-job frequency matrix. This matrix is
basically a collection of vectors with row vectors and column vectors. In detail,
rows represent terms and columns represent jobs. In this case, the term-to-job
matrix shows the number of times a particular term occurs in the jobs
(documents). Hence, the job similarity can be revealed if we are able to capture
concepts between terms and jobs in that sense. For instance, assume that we

63
have two job documents as illustrated in the sample (Job A and Job B retrieved
from Jobstreet.com) and we could construct such matrix from these documents.
First, we tokenize the sentences from the job documents, and then calculate
each of every term’s frequency derived from the results of tokenization. Next,
we arrange the term’s frequency in tabular form where the row represents the
terms and the column represents the job documents as shown in Table 4.1.
JOB A
System Analyst TesterResponsibility: Play a major role in testing efforts on multiple and simultaneous projects which includes performing functional testing, system integration testing, user acceptance testing and regression testing.
JOB B
System Analyst Tester
Responsibility:
Design and prepare test case documents from business requirements, system and functional testing.

64
Table 4.1: Sample of Term-Job Matrix
Job A Job B
system 2 1
analyst 1 0
tester 1 1
responsibilities 1 1
play 1 0
major 1 0
role 1 0
testing 5 1
efforts 1 0
multiple 1 0
simultaneous 1 0
projects 1 0
includes 1 0
performing 1 0
functional 1 1
integration 1 0
user 1 0
acceptance 1 0
regression 1 0
design 0 1
prepare 0 1
case 0 1
test 0 1
documents 0 1
business 0 1
requirements 0 1

65
4.5.1 Row Reduction
Usually, a sparse matrix can be large in size especially for commercial datasets
as it contains thousands of rows and columns that can increase the processing
time of the Job Latent Semantic Indexing (JLSI) method. As such, the Row
Reduction process serves as a function to reduce the row dimension in a sparse
matrix. For instance, a word may appear frequently in the collection of job
documents. Indirectly, this indicates that this word could not distinguish each
of every unique job. Therefore, this word is not helping in the matching. For
this approach, we examine the standard deviation of the distribution of
frequency of a term in different job documents of every row in frequency
matrix. Every row where such standard deviation is below a threshold is
considered not so useful and it will be deleted. For the experiments the
threshold is fixed at 0.01.Row Reductionprovidesflexibilityto identify the
insignificant term dynamicallyand stop words fix onlypredefined terms. This is
to be done at term-to-job frequency matrix by the Matrix Parser as shown in
Figure 4.1 and Figure 4.5.Itserves as a technique to reduce the number of rows
in a sparse matrix to increase computation efficiency and to help improve
matching relevancy (by eliminating unimportant terms) when Singular Value
Decomposition (SVD) is carried out.
4.6 Matrix Dimensionality Reducer
The output from Matrix Dimensionality Reducer will be used as an input for
the Semantic Indexer process. It is prerequisite to identify the optimum number
of dimensions in orderto perform the dimensionality reduction technique,
Semantic Indexer. Usually, a sparse frequency matrix with a lot of dimensions
is very difficult to interpret by human eyes. Having said that, thismay consist

66
of noises in which the data may not be so helpful and also may not necessarily
provide more information. It prevents the job matching process to be
performed in optimum manners. In such case, dimension reduction technique is
introduced to reduce the datasets in the high-dimensional space to lower
dimensional space and thatwill be performed in the coming stage. This
dimension reduction technique serves as a function to keep all the important
factors of the datasets in reduced dimensional space. It is also useful to
downsize a sparse matrix in job matching. Hence, choosing the suitable amount
of dimension reduction is vital.The main objective of Matrix Dimensionality
Reducer is to determine the optimum number of dimensions to be used and
pass it toSemantic Indexer.For example, we may keep only 3 dimensions out of
50 dimensions in a sample matrix. In this case, the optimum number of
dimensionality reduction is 3. This numeric number needs to be explicitly
determined and we proposed a method called scree test to determine the
suitable number of dimension reduction.
4.6.1 Scree Test
Withthe dimensionality reduction technique, correlated factorsare combined to
capture most of the important features only. For example, we would like to
survey student satisfactionabout their university. We design a student survey
questionnaire with a number of questions.We asked how satisfied they are with
theteaching of lecturers and also about the student relationships with their
lecturers.Most likely the responses to these two questions are highly correlated
with each other. In other words, we can consider that these questions
(factors)can be redundant or not independent from each other.Hence, these two
questionscould be combinedinto one. ScreeTest proposed by Cattell(Cattell,

67
1966; Praus et al., 2009) could be one of the methods used toinferthese
redundant relationships and determine a suitable number of factors to retain
from a set of items. In the experiment,we can plot a line graphof Eigenvalues
(y-axis)againstComponents (x-axis).Eigenvalueswere derived from the
computation of matrix decomposition in SVD (refers to Appendix B for more
information). On the other hand, Componentsare represented by existing
number of jobs at term-to-job matrix (column). Eigenvalues will be plotted in
their decreasingorderof their magnitude against their factor numbers
(Components) across the x-axis. The break between the steep slope and a
leveling off implies the number of meaningful Components to be retained,as
proposed byCattell.Implementation and experiment will be explained further in
Section 4.9.
4.7 Semantic Indexer
Datasets are well-processed and well-formatted after several stages of the
processes. It is then passed on to the Semantic Indexer to do job matching
processing by Singular Value Decomposition (SVD). Unlike Row Reduction
technique that physically reduces the size of a matrix, it is a linear algebra
statistical approach and the calculations are computed by matrix factorization.
The purpose of SVD is to reduce the original datasets (entire original matrix) in
the high-dimensional space to lower-dimensional space while still keep all the
important factors in the original datasets. In the experiments, datasets will be
processed in the Semantic Indexer and it makes good use of similarity
measurement methods to generate job-to-job similarity scores for every job.

68
4.8 Ranker
The output from the Semantic Indexer will be used as an input for the Ranker.
It ranks all the jobs from highly relevant to least relevant. The degree of job
similarity is determined based on job-to-job similarity scores derived from
previous process. Every job where such score is above a threshold is
considered relevant. Therefore, we will recommend top ranked-N jobs to job
seekers according to the threshold. In the experiments the threshold is fixed at
0.50.

69
4.9 Design and Implementation
A total of 3089 job collections was retrieved from the Jobstreet.com online
recruitment database servers. Shown in Figure 4.2 is one of the short samples
of unstructured data derived from a job where there are also many long job
descriptions. Generally this includes the job position, job responsibilities, job
requirements and they contain alphanumeric, special characters like HTML11
tags and others.
Job_id server_id position_title company_name url job_requirement
job_responsibility
"1149791" "10" "ACCOUNTS EXECUTIVE" "Parlo Tours SdnBhd"
"2010/9/default/10/1141225.htm" "<ul>
\ <li>
\ \ Diploma/Degree in Accounting</li>
\ <li>
\ \ Min. 2 to 3 years of experience in accounts or finance department.</li>
\ <li>
\ \ Able to handle full set of accounts and meet deadlines.</li>
\ <li>
\ \ Computer literate.</li>
\ <li>
\ \ Job scope: Tour finalization and General Ledger</li>
</ul>
" ""
Figure 4.2: Unstructured Data of Job Requirements and Responsibility
11Hyper Text Markup Language (HTML): is the main markup language for web pages.

70
In order to process the data correctly, we need to go through the pre-processing
step by deleting unwanted characters (raw data). Java programming codes were
written to trim unwanted characters and keep useful data only. Then, it will be
processed and output to another text file with appropriate and easy to access
format and this process we call it tokenization. A portion of the preprocessed
sample text file with each paragraph representing a job before stemming and
stopping is shown in Figure 4.3.
In this file, every single paragraph represents a job with job position, job
responsibilities and job requirements. Removingstemming and stop words are
part of the pre-processing stage after tokenization. Subsequently, this
preprocessed data will be used as an input for Matrix Parser in the next process.

71
ACCOUNTS EXECUTIVE Parlo Tours SdnBhd" Diploma Degree in Accounting Min. 2 to
3 years experience in accounts or finance department. Able to handle full set of accounts and
meet deadlines. Computer literate. Job scope: Tour finalization and General Ledger"
SALES MANAGER OfficeCare SdnBhd " Candidate must possess at least a Higher
Secondary STPM A Level Pre - U, Professional Certificate, Diploma, Advanced Higher
Graduate Diploma, Business Studies Administration Management, Commerce, Marketing or
equivalent. At least 1 year(s) of working experience in the related field is required for this
position. Applicants must be willing to work in USJ Subang Jaya. Preferably Managers,
Senior Executives specializing in Sales - Retail General, Sales - Telesales Telemarketing or
equivalent. Full - Time positions available."
Internship for Computer / IT Students Theta Edge Berhad (fksLityan Holdings Berhad),
programming, Candidate must possess or currently pursuing a Bachelor s Degree in Computer
Science Information Technology or equivalent. Required skill(s): programming, Java, Oracle.
5 Internship position(s) for duration of 6 month(s). Programming & coding using
development languages and application documentation
Senior Mechanical Engineer Company Confidential " Bachelor of Engineering
(Mechanical); Minimum 3 years of working experience, Hands on working experience
with Boilers (all types), Pumps (all types), Mechanical Seal (all types), Air Compressor, Air
Dryers, Columns, Heat Exchangers, Chillers; Must have excellent maintenance knowledge
and be familiar with the operational aspects of waste heat recovery (Energy Conservation);
Experience working with vendors, contractors and plant personnel necessary; Must be able
to diagnose, problem solve, plan and execute the maintenance of plant equipment (trouble
shooting); Conversant with ISO, HACCP and GMP standards and practices and able to train
the down line on the said practices;" " Identify opportunities to reduce operations cost and
enhance operational efficiency; To inspect the installation, modification and commissioning
of mechanical systems at industrial or project sites. Plan and executive preventive and
predictive maintenance; Develop maintenance standards, schedules and programs and
provide guidance to industrial maintenance areas; General maintenance including
scheduling personnel for services, maintaining spare parts inventory, process monitoring,
managing, evaluating and mentoring subordinates; Technical and functional supervision of
staff and contractors. "
Figure 4.3:Portion of the Preprocessed Sample Text with Each Paragraph Representing aJob

72
In order to perform job similarity calculations, the preprocessed data must be
converted to a matrix first. We developeda tool called Matrix Parser to perform
this (Figure 4.4). The preprocessed data will be used as an input for Matrix
Parser. Next, the output of the data which is a large sparse matrix will be
exported to another file. The sample of the output data is shown in Figure 4.5
where terms are represented by rows (vertical) and job vectors are represented
by columns (horizontal) in term frequency matrix.The size of this matrix is
very sparse and large (about 30 millions of entries) that consists of about
10,000 rows and 3089 columns. InFigure 4.5 only a very smallsubset of
existing term frequency matricesis shown and the dotted line “….” is used to
illustrate thatthere are much more data in the matrix in actual case.
Figure 4.4:Screen Shot of the Interface of the Matrix Parser

73
Figure 4.5: TermFrequency Matrix
Before we proceed to further calculate similarity values between jobs in the
Semantic Indexer, we need to determine the optimum values or factors to retain
for dimensionality reduction. One of the methods is called scree test by

74
Cattell.“Scree” refers to the debris fallen from a mountain and lying at its base.
In this case, we plot all the Eigenvalues in their decreasing order of
magnitudeagainst Components (number of factors) and the plot looks like the
side of the mountain. So, the Scree Test proposes to stop analysis at the point
the mountain ends and the debris (error) begins(Plagianakos et al., 2005).Based
on the rationale explained by Cattell, in Figure 4.6, example of suitable
dimensionality reduction is numeric value 60. This is performed by a Matrix
Dimensionality Reducer module (Section 4.6) in the experiment.
Figure 4.6:Sample of Scree Plot
Enlarged from Figure 4.6

75
This process will continue to further calculate the similarity values between
jobs with the frequency matrix that was previously generated. That is, the
Semantic Indexer is used to capture these relationships. In addition, the whole
project is implemented in MATLAB platform, where various modules in the
block diagram were developed like Semantic Indexer. Standard libraries and
mathematical tool were also used in the development.
After the processing in Semantic Indexer, job-to-job similarity score table will
be generated and an example is shown in Figure 4.7. This Figure showsa subset
of similarity score between each of every job in the job collections and dotted
line “….” is used to illustrate that there are more results in actual case. Note
that same identical jobs will always result in 1, lower similarity score (below
0.6) indicates less relevant jobs and the higher similarity score (above 0.6)
indicates highly similar jobs.We will use these similarity scores to rank all the
similar jobs and it is done by the Ranker module in the experiment. A list of
top-N ranked jobs will be retrieved (Refer to the sample in Table4.2). Now, we
can provide and recommend a list of jobs based on a given query.
Figure 4.7: A Sample of Similarity Score Table of the Jobs
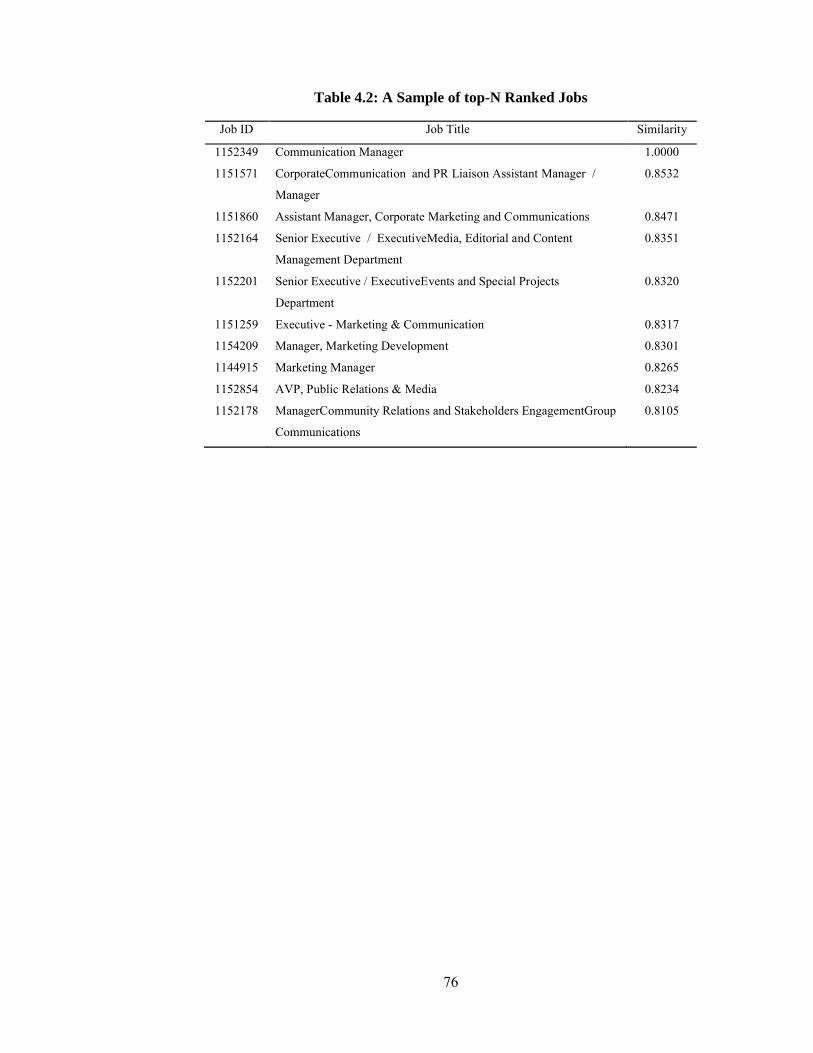
76
Table 4.2: A Sample of top-N Ranked Jobs
Job ID Job Title Similarity
1152349 Communication Manager 1.0000
1151571 CorporateCommunication and PR Liaison Assistant Manager /
Manager
0.8532
1151860 Assistant Manager, Corporate Marketing and Communications 0.8471
1152164 Senior Executive / ExecutiveMedia, Editorial and Content
Management Department
0.8351
1152201 Senior Executive / ExecutiveEvents and Special Projects
Department
0.8320
1151259 Executive - Marketing & Communication 0.8317
1154209 Manager, Marketing Development 0.8301
1144915 Marketing Manager 0.8265
1152854 AVP, Public Relations & Media 0.8234
1152178 ManagerCommunity Relations and Stakeholders EngagementGroup
Communications
0.8105

77
4.10 Results and Analysis
Four job groups are used to do the testing and evaluation which are (i)
Communication Manager, (ii) Construction / Site-Engineer / Supervisor, (iii)
VB .Net / VB 6 / PHP Software Developer and (iv) Finance Manager /
Accountant. These job groups are used because they have covered the general
and specific aspects of the job. For example, Communication Manager is a
general job position. In contrast, Site-Engineer is a very specific job position.
Each of the jobs will be picked from these four job groups respectively as the
query job. These query jobs will be used to do the testing in the proposed
methods and generate evaluation results. Sample of a query job is shown in
Figure 4.8.
Figure 4.8: Sample of aQuery Job

78
We have proposed the graded relevance (JaanaKekäläinen, 2005) approach as
the evaluation method in this research project. This evaluation technique is a
novel application in the job matching area since it is effective in measuring job
retrieval results based on the relevancy and approximation. The evaluation
method is called normalized discounted cumulative gain (nDCG). For
illustration purpose, nDCG@10 is used to indicate the rank retrieval for first 10
most relevant jobs recommended as corresponding to its retrieval relevancy
measured by nDCG.
Besides, experts from Jobstreet.com are assigned to help in the evaluation
process since we are using a 4-point scale in nDCG evaluation method which
are “not relevant – 0”, “marginally relevant – 1”, “relevant – 5” and “highly
relevant – 10”. The job retrieval results are initially evaluated by them and the
outputs are measured by nDCG method subsequently. Then, the evaluated
results of these four job types will be averaged to produce the final results as
shown in coming sections of results and analysis part of the proposed methods.
4.10.1 Results and Analysis of JLSI Method
Before going into detail, we have configured dimensionality reduction of 60
that will be used during the experiment for the proposed JLSI method in Matrix
Dimensionality Reducer. A threshold of 0.01 will be used for Row Reduction.
Also, we fixed the similarity measurement score of 0.6 and above to be
considered as cases for relevant matched jobs.
Then, the results were generated by the proposed JLSI method based on the
datasets of four job groups. They are analyzed and separated in four different

79
perspectives which are JLSI method, JLSI method with the application of
stemming, and JLSI method with the application of stop words and JLSI
method with the application of both stemming and stop words. This is to
identify the impact of these approaches toward the quality of job matching and
retrieval relevancy.
As shown in Table 4.3 andFigure 4.9, the JLSI method with the application of
stemming and stop-words has the best retrieval results where nDCG@5 is 0.81
and nDCG@10 is 0.83. In contrast, the JLSI method without stemming and
stop-words (normal) have the worst retrieval results where nDCG@1 is 0.50
and no other retrieval at all for other rank. This has proven that stemming and
stop words are helpful in reducingnoise and improving job retrieval results.
However, a combination of both the stemming and the stop words has played
only a minor role to have return of more relevant jobs. In the comparison of
both the stemming and the stop words, stemming is able to return more
relevant jobs. This is because stop words reduce the unimportant terms during
the pre-processing phase whereas stemming is used to group different terms
into its root term and hence it increases the term frequency.
Table 4.3: Matching Results of Four Job Groups Based on JLSI Method
nDCG@K
Rank, K Normal Stemming Stop words Stemming & Stop words
Rank 1 0.50 1.00 1.00 1.00
Rank 5 - 0.76 - 0.81
Rank 10 - 0.79 - 0.83
Symbol ‘-’: No retrieved results in this particular ranking

80
Figure 4.9:Matching Results of Four Jobs Groups with JLSI Method in Line Graph
4.11 Summary
Based on the results and analysis of the proposed the JLSI method, it is able to
discover similar jobs from a query job (job responsibilities and job
requirements in the form of terms) without the needs of human intervention.
The JLSI method could be the replacement of the human brain in doing the
matching task. On the other hand, with the additional implementation of
different approaches like stop words and stemming, it can perform even better
with more number of returns of the similar jobs.
0.00
0.20
0.40
0.60
0.80
1.00
1.20
1 5 10
nDCG
@K
Rank, K
JLSI Method
Normal
Stemming
Stopwords
Stemming & Stopwords

81
CHAPTER 5
5.0 JOB ENHANCED LATENT SEMANTIC INDEXING (JLSI)
METHOD WITH COLLECTIVE LEARNING
In this Chapter, enhancements to JLSI method are proposed and implemented.
Two methods are proposed namely Job Enhanced Latent Semantic Indexing
(JELSI) and Job Enhanced Latent Semantic Indexing with Collective Learning
(JELSI-CL) method. In detail, the JLSI method could be enhanced even better
in the sense that it is able to balance the important and unimportant terms
equally. The other enhancements are the collective learning method where
choices of a group of job seekers help make decisions in job matching.
5.1 Introduction
Some job responsibilities and job requirements are longer in length, others are
shorter in length. These job responsibilities and job requirements are rarely
equal in length in the comparison of two jobs. Figure 5.1 and Figure 5.2 are
some of the examples long and short job responsibilities and requirements. In
addition, they are often written in general terms and specific terms together in
the job responsibilities and requirements. All these factors will prevent the job
matching to have good results. Hence, we need a method that is able to perform
in all situations. Term Frequency Inverse Document Frequency (TFIDF) has
been introduced to replace the normal term frequency measure in JLSI method.
In this case, Term Frequency Normalizer will be added as an extension to the
JLSI method and it is called the JELSI method.

82
Figure 5.1:Sample of LongJob Responsibilities and Requirements

83
Figure 5.2:Sample ofShort Job Responsibility and Requirements

84
5.2 Job Enhanced Latent Semantic Indexing (JELSI) Method
Figure 5.3: Block diagram of JELSI method
Job database
1. Pre-processor
a. Tokenizationb. Stemmingc. Stop-words
Pre-processed text for jobs
2. Matrix Parsera. Row Reduction
Term-to-job Frequency Matrix
3. Term Frequency Normalizer
Normalized Term-to-job
Frequency Matrix
4. Matrix Dimensionality Reducer
Acquired the optimum number for dimensionality
reduction
6. RankerA list of similar top
ranked-N jobs
5. Semantic Indexer
Job-to-job Similarity Scores
Descriptions:

85
The block diagram of Job Enhanced Latent Semantic Indexing (JELSI) method
is shown in Figure 5.3. There is an additional module added into the JLSI
method which is Term Frequency Normalizer. Its main function is to provide
normalization to all the values of the frequency matrix.
5.2.1 Term Frequency Normalizer
For JELSI, the values of the frequency matrix will be normalized as this is to
balance the infrequent terms and common terms. In other words, it is the
important terms that normally influence the similarity measurement and
usually unimportant terms bring less or no values to the overall context. An
infrequent or different term should weigh more heavily than common term in
the comparison of job responsibilities and requirements as it helps differentiate
the job responsibilities and requirements. Consider the case where a term that
appears only 4% in the document collection should probably be weighted more
heavily than a common term that appears 90% in the document collection.
Hence, the Term Frequency Inverse Document Frequency (TFIDF) method
that has been incorporated in Term Frequency Normalizer is an approach that
will provide such normalization function(Jones, 2004).
Term Frequency Inverse Document Frequency can be divided into two parts. It
is the product or multiplication of a function of the term frequency and a
function of the inverse document frequency (TFIDF). For the first part, the
function term frequency is about the terms that are found in a job or document.
Higher weights should be given to the term that has occurred frequently for
that particular job. Inthe second part, the function of inverse document
frequency is about the term that has appeared across all the jobs in the

86
collection. The terms that appear commonly throughout the whole job
collection should be given lower weights than other different terms that only
appear in a number of jobs.
To illustrate the above in detail, an example is given where we have a total of
46 terms in each job and a total of 3 jobs in the job collection. So, the TFIDF
for this example could be calculated and the calculated values are 0.326, 0.065
and 0.152 respectively as shown in the calculation in the Table 5.1. All the
numeric values in this example have been normalized based on its importance
and its frequency of appearance.
Table 5.1: Sample of TFIDF Calculation
Term Term
Occurrence
Total
number
of terms
TF Total
number
of jobs
Number of job
documents
where this term
is found
IDF TFIDF
Airplane 5 46 5/46 =
0.109
3 1 3/1
= 3
0.326
Blue 1 46 1/46 =
0.022
3 1 3/1
= 3
0.065
Chair 7 46 7/46 =
0.152
3 3 3/3
= 1
0.152

87
5.2.2 Results and Analysis of JELSI Method
For this enhancement, we are still configuring dimensionality reduction of 60
that will be used during the experiment for this proposed JELSI method in
Matrix Dimensionality Reducer. A threshold of 0.01 will be used for Row
Reduction. Lastly, we fixed the similarity measurement score of 0.6 and above
to be considered as cases ofrelevant matched jobs.
The results were generated by the proposed JELSI method based on the
datasets of four job groups (Refers to Chapter 4 section 4.10). In this
implementation, they are also analyzed and separated in four different
perspectives which are JELSI method, a JELSI method with the application of
stemming, and JELSI method with the application of stop words and JELSI
method with the application of both stemming and stop words. The purpose of
doing this is to identify the impact of these approaches against the
enhancement feature in the JELSI method.
As shown in Table 5.2 and Figure 5.4, The JELSI method without the
stemming or the stop words (Normal) has the best retrieval results and
accuracy where nDCG@30 is 0.88 and nDCG@60 is 0.92. The JELSI method
with the combination of stemming and stop words has slightly decreased value
in nDCG compared to the JELSI (Normal) possibly due to the duplicate
function of this enhancement against stemming and stop words. The TFIDF
approach in the enhancement serves as an automatic filtering feature that could
possibly replace the function of the stemming and the stop words. On the other
hand, it is noticed that we have more returns from the matching retrieval. This
is because the TFIDF approach has averaged the term frequency in the whole

88
job collections. The comparison of the jobs now is even more accurate. This is
also considered as an automatic normalization of the term’s frequency that is
without human intervention. Therefore, we can retrieve more relevant jobs and
give more returns in the retrieval.
Table 5.2: Matching Results of Four Job Groups with JELSI Method
nDCG@K
Rank, K Normal Stemming Stop words Stemming & Stop words
Rank 1 1.00 1.00 0.75 0.75
Rank 5 0.86 0.86 0.82 0.75
Rank 10 0.82 0.80 0.78 0.66
Rank 15 0.84 0.79 0.81 0.74
Rank 20 0.87 0.83 0.84 0.78
Rank 30 0.88 0.87 0.86 0.81
Rank 60 0.92 - 0.90 -
Symbol ‘-’: No retrieved results in this particular ranking
Figure 5.4: Matching Results of Four Job Groups with JELSI Method in Line Graph
0.00
0.20
0.40
0.60
0.80
1.00
1.20
1 5 10 15 20 30 60
nDCG
@K
Rank, K
JELSI Method
Normal
Stemming
Stopwords
Stemming & Stopwords

89
5.3 Enhancement with Collective Learning Method
Previously we have already introduced enhancement to JLSI by implementing
JELSI. This has improved the algorithm even better in term of normalization
and better balancing of term weights in the job collections. There is extra room
to improve the algorithm even better. We can further enhance this algorithm
with Collective Learning (CL) method. This novel module namely Collective
Feedback Provider is incorporated to JELSI method to increase job matching
quality as shown in Figure 5.5. Collective Feedback Provider integrates the
relevance feedback technique with CL where implicit feedback, positive
feedback and pseudo feedback will be used. It is derived from the job seekers’
collective decisions and feedbacks based on job application patterns and
behaviors.The improved method is called the Job Enhanced Latent Semantic
Indexing with Collective Learning (JELSI-CL) method.

90
5.4 Job Enhanced Latent Semantic Indexing with Collective Learning (JELSI-CL) Method
Figure 5.5: Block Diagram of JELSI-CL Method
Job database Pre-processed text for jobs
1. Pre-processor a. Tokenization b. Stemming c. Stop-words
2. Matrix Parser a. Row Reduction
Term-to-job Frequency Matrix
4. Matrix Dimensionality Reducer
5. Semantic Indexer
Job-to-job Similarity Scores
Acquired the optimum number for dimensionality
reduction
6. Ranker
A list of similar top ranked-N jobs
7. Collective FeedbackProvider
Normalized Term-to-job
Frequency Matrix
3. Term Frequency Normalizer
Descriptions:

91
5.4.1 Collective Learning Provider
Consider the case where a group of job seekers applied to a number of jobs on
online recruitment website. We assume that two jobs will be considered as
similar to each other only when more than a certain number (NCL) of job
seekers also have applied to both of them. In this case, their common job
application behaviors would indirectly tell us a list of similar jobs. Hence, we
can get a list of similar jobs easily from candidates’ job application history
where this phenomenon is collectively performed by all candidates. Then, we
will calculate the mean of term frequency for each of the jobs and this mean of
term frequency will be generated and used as a new query (relevance feedback)
based on this group of candidates who have applied to the jobs. Finally, this
new query will be re-executed to get a new similarity scores table between jobs
and followed by a list of top-N ranked jobs.To illustrate this in detail, we use
the example of Query jobsshown below.
Initial Query: "software quality assurance"
Job X: “Software Quality Manager provides analysis and consulting on highly complex
software development projects related to quality assurance, work processes, and compliance
with standards and methodologies. Manage and lead a team of software quality engineers
for the development and execution of software test plans and procedures.”
Job Y: “Software QA Engineer Define and evolve quality assurance / test strategy and
associated process and tools. Create test plans and execute test cycles to ensure high-quality
and successful software release.”
Job A: “Customer Service Executive needs to answer all customer interactions by phone on
product related enquiries and product features. Customer oriented and has the ability to
work independently under minimum supervision.”

92
An initial Query is created with the terms “software quality assurance” and
they are constructed in matrix vector, which is vector<1, 1, 0, 0, 0, 0, 0, 0, 0, 0,
0, 0, 0, 0, 1, 0, 0, 0, 0, 0, 0, 0, 0, 0, 0, 0, 0, 0, 0, 0, 0, 0, 0, 0, 0, 0, 0, 0, 0, 0, 0, 0,
0, 0, 0, 0, 0, 0, 0, 0, 0, 0, 0, 0, 0, 0, 0, 0, 0, 0, 0, 0, 0, 0, 0, 0, 0, 0>. This vector
is constructed based on all the combination terms from sample job collections.
In this example, “software” - 1, “quality” – 1, “manager” – 0, “provides” – 0
wherewe counted the term occurrencesof everytermthat appeared in the job
collectionsto derive the above vector. For instance, we make assumptions that a
number of jobs were retrieved (Job X, Job Y and Job A) and assumed some of
them matched to this initial Query.
In the experiment, we choose ten to setthe threshold value (NCL) for job
commonality. Then, again we assume from initial Query there are more than
ten (10) candidates who have applied to both Job X and Job Y and they have
met the threshold requirement. Their vector of term occurrenceswill be
constructed respectively and these vectors will be combined with initialQuery
vector to demonstrate Collective Learning features by the Relevance Feedback
method. So, to apply this we will get the mean of vectors of term occurrences
from Job X, Job Y and initial Query which are <1, 1, 0, 0, 0, 0, 0, 0, 0, 0, 0, 0,
0, 0, 1, 0, 0, 0, 0, 0, 0, 0, 0, 0, 0, 0, 0, 0, 0, 0, 0, 0, 0, 0, 0, 0, 0, 0, 0, 0, 0, 0, 0, 0,
0, 0, 0, 0, 0, 0, 0, 0, 0, 0, 0, 0, 0, 0, 0, 0, 0, 0, 0, 0, 0, 0, 0, 0>, <4, 2, 1, 1, 1, 6, 1,
1, 1, 1, 2, 1, 1, 1, 1, 1, 1, 1, 1, 1, 1, 1, 1, 1, 1, 2, 1, 1, 1, 1, 1, 1, 1, 0, 0, 0, 0, 0, 0,
0, 0, 0, 0, 0, 0, 0, 0, 0, 0, 0, 0, 0, 0, 0, 0, 0, 0, 0, 0, 0, 0, 0, 0, 0, 0, 0, 0, 0> and<2,
2, 0, 0, 0, 5, 0, 0, 0, 0, 0, 0, 0, 1, 1, 0, 0, 0, 0, 0, 0, 0, 0, 0, 0, 0, 0, 0, 0, 0, 3, 1, 0,
1, 1, 1, 1, 1, 1, 1, 1, 1, 1, 1, 1, 1, 1, 1, 0, 0, 0, 0, 0, 0, 0, 0, 0, 0, 0, 0, 0, 0, 0, 0, 0,

93
0, 0, 0>. Hence, the mean of their vectors of term occurrences(Job X, Job Y
and initial Query) is<2.33, 1.67, 0.33, 0.33, 0.33, 3.67, 0.33, 0.33, 0.33, 0.33,
0.67, 0.33, 0.33, 0.67, 1.00, 0.33, 0.33, 0.33, 0.33, 0.33, 0.33, 0.33, 0.33, 0.33,
0.33, 0.67, 0.33, 0.33, 0.33, 0.33, 1.33, 0.67, 0.33, 0.33, 0.33, 0.33, 0.33, 0.33,
0.33, 0.33, 0.33, 0.33, 0.33, 0.33, 0.33, 0.33, 0.33, 0.33, 0.00, 0.00, 0.00, 0.00,
0.00, 0.00, 0.00, 0.00, 0.00, 0.00, 0.00, 0.00, 0.00, 0.00, 0.00, 0.00, 0.00, 0.00,
0.00, 0.00>. Subsequently, this new Query vector will be used to replace the
initial Query and re-execute in the next query process. Alist ofsimilar jobs will
be retrieved based on this new Query vector that possibly consists of the
combination features of Job X, Job Y and initial Query. Therefore, job
matching could improve through this processwith better and broader results.
This method can be easily generalized for different cases with the job seekers’
activity record from the online recruitment website.
5.4.2 Results and Analysis of JELSI-CL Method
For JELSI-CL method, similarly we have configured dimensionality reduction
of 60 that will be used to fit in Matrix Dimensionality Reducer during the
experiment. A threshold of 0.01 will be used for Row Reduction. We fixed the
similarity measurement score of 0.6 and above to be considered as cases of
relevant matched jobs. Last but not least, NCL of 10 as a threshold for candidate
co-occurrences will be used.
The results were generated by the proposed JELSI-CL method based on the
datasets of four job groups which are (i) Communication Manager, (ii)
Construction / Site-Engineer / Supervisor, (iii) VB .Net / VB 6 / PHP Software
Developer and (iv) Finance Manager / Accountant. Each of the jobs will be

94
picked from these four job groups respectively as the query job. These query
jobs will be used to do the testing against 3089 job collections with the
proposed method and generate evaluation results. These datasets were similar
from the datasets that were used in JLSI method and JELSI method (Chapter 4
and Chapter 4.10).
In addition, a Collective Learning approach is used in this method where the
results are manipulated by the candidates’ job application behaviors. This
information is to be retrieved from Jobstreet.com database servers. With this
amount of information, a number of similar jobs can be determined based on
the co-occurrence of candidates in the job application history. A predetermined
threshold value (NCL) is used to get the common jobs. Then, the term’s
frequencies of these common jobs are averaged and feedback on the query job
in the next cycle to improve the retrieval results. In the experiment, job groups
used in the evaluation and testing are the subsets of 3089 job collections.
Hence, the co-occurrence of candidates can be determined from the job
collections.A group of similar jobs can be identified from the co-occurrence of
candidates and this will be used as group’s collective input to revisethe initial
job query as a brand new job query in next loop. Over the time, multiple loops
and combinations of query generated from collective efforts from co-
occurrence of candidatethat exhibits collective learning behaviors can be used
for the improvement of results.
Similarly, in this implementation, they are also analyzed and separated in four
different perspectives which are JELSI-CL method, JELSI-CL method with the

95
application of stemming, and JELSI-CL method with the application of stop
words and JELSI-CL method with the application of both stemming and stop
words. The JELSI-CL method (Normal) has the best retrieval results
wherenDCG@60 is 0.93. The number of returns from the retrieval is about the
same as compared to the JELSI method but the results have overall improved
even better as shown in Table 5.3 and Figure 5.6. By comparing Table 5.3 with
Table 5.2, JELSI-CL method supersedes JELSI method in terms of all ranking
by different perspectives.In comparison, JELSI-CLmethod (normal) had a
better result for nDCG@1 and nDCG@5 and slowly increases and improved at
nDCG@60. Similarly, the JELSI-CL method (stemming) with nDCG@30 is
0.90 compared to the JELSI method (stemming) with nDCG@30 is 0.87 in
Table 5.2. JELSI-CL method (Stop words) with nDCG@30 is 0.88 compared
to the JELSI method (Stop words) with nDCG@30 is 0.86. Lastly, the JELSI-
CL method (Stemming & Stop words) with nDCG@30 is 0.87 compared to the
JELSI method (Stemming & Stop words) with nDCG@30 is 0.81 only.By
referring to Figure 5.6, JELSI-CL method (normal) produced more quality
matched results up to Rank 60 whereas JELSI-CL method (Stemming) only up
to Rank 30.

96
Table 5.3: Matching Results of Four Job Groups Based on JELSI-CL
Method
nDCG@K
Rank, K Normal Stemming Stop words Stemming & Stop words
Rank 1 1.00 1.00 0.75 0.75
Rank 5 0.94 0.91 0.93 0.86
Rank 10 0.83 0.82 0.83 0.79
Rank 15 0.83 0.84 0.82 0.79
Rank 20 0.85 0.87 0.85 0.80
Rank 30 0.87 0.90 0.88 0.87
Rank 60 0.93 - 0.92 -
Symbol ‘-’: No retrieved results in this particular ranking
Figure 5.6:Matching Results of Four Job Groups with JELSI-CL
Method in Line Graph
0.00
0.20
0.40
0.60
0.80
1.00
1.20
1 5 10 15 20 30 60
nDCG
@K
Rank, K
JELSI Method
Normal
Stemming
Stopwords
Stemming & Stopwords

97
5.5 Comparison of JLSI, JELSI and JELSI-CL Methods
Table 5.4: Comparison of the Matching Results JLSI, JELSI and JELSI-CL Methods
nDCG@K
Rank,
K
Normal Stemming Stop words Stemming &
Stop words
J1 J2 J3 J1 J2 J3 J1 J2 J3 J1 J2 J3
R 1 0.50 1.00 1.00 1.00 1.00 1.00 1.00 0.75 0.75 1.00 0.75 0.75
R 5 - 0.86 0.94 0.76 0.86 0.91 - 0.82 0.93 0.81 0.75 0.86
R 10 - 0.82 0.83 0.79 0.80 0.82 - 0.78 0.83 0.83 0.66 0.79
R 15 - 0.84 0.83 - 0.79 0.84 - 0.81 0.82 - 0.74 0.79
R 20 - 0.87 0.85 - 0.83 0.87 - 0.84 0.85 - 0.78 0.80
R 30 - 0.88 0.87 - 0.87 0.90 - 0.86 0.88 - 0.81 0.87
R 60 - 0.92 0.93 - - - - 0.90 0.92 - - -
J1 Job Latent Semantic Indexing (JLSI) MethodJ2: Job Enhanced Latent Semantic Indexing (JELSI) MethodJ3: Job Enhanced Latent Semantic Indexing with Collective Learning (JELSI-CL) MethodR: RankSymbol ‘-’: No retrieved results in this particular ranking
According to Table 5.4, in the comparison of these methods, the JELSI-CL
method was able to provide the most relevant matching results compared to the
other methods. The best relevancy score is 0.93 at rank 60 and the worst
relevancy score is 0.83 at rank 10 and rank 15 respectively in the JELSI-CL
method throughout the different approaches. Also, there is a quite high number
of retrieval in all approaches with at least a return of 30. On the other hand,
JELSI method is not as good asthe JELSI-CL method in terms of matching
relevancy. However, the number of retrievals out of these two methods is more
or less the same in all four approaches – normal, stemming, stop words and
stemming &Stop words. The JLSI method performed poorer compared to the
JELSI and JELSI-CL methods where the higher matching relevancy is only

98
0.83 at rank 10 with both the stemming and the stop words. There are lesser
number of retrievals because the highest number of retrievals stops at rank 10
in this experiment.
The JELSI-CL method is better because the enhancement has taken into
consideration of the group decisions of a number of job seekers in common.
These positive feedbacks have increased the overall matching relevancy and
the matching results. The matching relevancy and results will improve over the
time based on common job seekers’ feedbacks.
In comparison of the JLSI and the JELSI methods, the JELSI method is
considerably better. This is due to the enhancement of the Term Normalizer in
the job matching method. There are problems because different length of job
responsibilities and job requirements, appearances of common terms, and the
meaningless terms will prevent job matching to perform better. In this case,
Term Normalizer was able to normalize and evenly distribute all the term
frequency based on the term-job frequency matrix hence improves the
matching relevancy and increase the number of retrievals.
It is also noticed that, stop words and stemming have substantially increased
the matching results of the JLSI method. In contrast, the stop words and
stemming do not affect the JELSI and the JELSI-CL methods that much. In
other words, the enhancements of JELSI and JELSI-CL methods could be used
to replace the functionalities in stop words and stemming. For the JLSI method,
stemming and stop word help improve the performance as shown in Table 4.3

99
and Figure 4.9. For the JELSI and the JELSI-CL methods, stemming word still
has its effect though smaller as compared with TFIDF. For stop word, as these
are mostly common words in English like ‘the, on, a, an’, and they appear in
most documents, thus the TFIDF calculation will also lower its importance and
thus has included the same effect of stop word. Thus, although the stemming
and stop words are included in the JELSI and the JELSI-CL methods, their
effects are relatively small. Overall, the JELSI-CL method has all the
combinations and obtained the best results.
5.6 Performance Review
Table 5.5: Performance ofOperations in MATLAB Platform
Performance (Seconds)
Operation Normal StemmingStop
WordsStemming & Stop Words
- Import Term-Job Matrix 17.62 11.43 15.95 11.02
- ConvertingTerm-job
Matrix with TFIDF
approach
1027.02 537.25 978.18 515.95
- Computation of JLSI 181.60 164.45 176.81 151.73
- Computation of JELSI 178.46 160.24 177.38 154.83
There are a number of operations performed inthe program are developed in
the MATLAB platform as shown in Table 5.5 and their performances are
measured inseconds. The operations included the time used to import a term-
job matrix, the time used to incorporate TFIDF approach into a term-job matrix,
the computation time of the JLSI and the JELSI methods in the
MATLABplatform.As we can observe, the time used to import a term-job

100
matrix reducesin seconds when we used the stemming and stop words
approaches as the number of rows and the number of columns in the matrix can
be reduced. Similarly, the time used to convert a term-job matrix with TFIDF,
computation time used to perform the JLSI and the JELSI methods are reduced
with the application of both stop words and stemming. In the comparison
between stop words and stemming, stemming tends to reduce the computation
timebetter than stop words because stemming reduces the term-job matrix size
in terms of row and column by changing all the terms of its root term.
5.7 Summary
For the JELSI method, the enhancement takes into the consideration of the
distribution of term frequency and normalization of term frequency. For
JELSI-CL method, it is incorporated with collective learning method where a
group of common job seekers’ decisions are used to feedback the system. The
common job seekers are the candidates with similar interests. Therefore, the
feedbacks from them will provide more improvements to the job matching
method. In conclusion, two novel application job matching methods namely the
JELSI method and the JELSI-CL method are developed. It is an enhancement
of previously proposed method, JLSI. These new methods are integrated with a
few additional features such as TFIDF, relevance feedback and collective
learning mechanisms. As a result, the proposed methods improve even better in
terms of matching quality and relevancy. Also, the number of retrievals
increase dramatically compared to the initial proposed JLSI method.

101
CHAPTER 6
6.0 CONCLUSTION
6.1 Summary
In conclusion, we have proposed a novel application of the Job Latent
Semantic Indexing method in the job matching area. It is then enhanced by
TFIDF and collective learning approaches through JELSI and JELSI-CL. The
results of these methods have been described in Chapters4 and 5.
In addition to that, various new modules have been designed and developed to
implement the methods. They are:
Integration of a Pre-processor into LSI in early stage. Raw text is processed
by stemming algorithm and stop words in order to delete the meaningless
terms that contribute nothing in the overall processing.
Integration of a Matrix Parser into LSI method in second stage. It is used to
parse the pre-processed text into term-to-job frequency matrix and increase
the overall algorithm processing speed. We have proposed a novel row
reduction method that is able to reduce the size of a sparse matrix
effectively. This approach basically examines the term frequency
distribution. Insignificant parts will be deleted and this can greatly reduce
the size of a sparse matrix.
Integration of a Normalizer into LSI in third stage. We have proposed the
application of Term Frequency Inverse Document Frequency (TFIDF)

102
method to normalize the frequency distribution of a matrix. With this
feature, the important terms can be emphasized and the meaningless terms
will be ignored. Nonetheless, the normalization serves as a function to
balance all the terms in weight. Hence, different lengths in the text are not a
problem for comparison.
Integration of the Matrix Dimensionality Reducer onto the LSI method is in
the fourth stage. A novel application of Scree Test statistical method to
predict a suitable number of dimensionality reductions in LSI was
implemented. Normally, dimensionality reduction is determined by trial and
may differ in different applications. Hence, this scree test method provides a
simple solution to predict a suitable number of dimensionality reductions.
Integration of a Collective Learner at last stage. We have proposed a
feedback mechanism by collective learning method. Based on job seekers’
activity record.

103
6.2 Future Works
The results presented in this thesis have demonstrated the effectiveness of the
proposed job matching methods. However, it could be further enhanced in a
few ways:
6.2.1 Extension of the Job Matching Algorithm by Incorporating Job Seekers’ Behaviors
In this proposed approach, more job application behaviors of job seekers will
be utilized.Job seekers’ behaviors in the online recruitment website like
browsing habits, the amount of time used to view a particular job
advertisement, and their frequency to view a specific job group may give us
insight for better job matching in terms of better personalization. This could be
part of the extension.
6.2.2 Extension of the Job Matching Algorithm to include Resume Text of Job Applicants
The proposed algorithm takes into account only the job text in terms of job title,
job responsibilities and job requirements that are derived from all the job
advertisements. Similarly, we could use resume text to give more insightful
information in different perspectives especially job analysis and job
recommendations. Perhaps by combining job text and resume text, we could
obtain more reliable results. This would lead to a better job matching
performance.

104
6.2.3 Extensionof the Row Reducer to Work with Other Row Reduction Techniques
Size of a matrix could be reduced almost 50% from its original size and also
retain all its important elements with Row Reduction technique of the proposed
job matching algorithm. In this invention, as Row Reduction technique is using
the term’s frequency distribution to check the importance of each row (or each
term), the unimportant terms will be deleted to form a brand new matrix in a
reasonable reduced size. In future, other theoretically proven methods could be
employed here and combined with this existing method to increase
effectiveness and efficiency in dimension reduction

105
REFERENCES
USDOL, 2010. O*NET Online. [Online] Available at: http://www.onetonline.org/link/details/15-1132.00.
Abraham, A., Das, S. & Roy, S., 2008. Swarm Intelligence Algorithms for Data Clustering. In In Proceedings of Soft Computing for KnowledgeDiscovery and Data Mining., 2008.
Al-kofahi, K. & Conrad, J.G., 2005. Effective Document Clustering for Large Heterogeneous Law Firm Collections. In ICAIL '05 Proceedings of the 10th international conference on Artificial intelligence and law. New York, USA, 2005.
Al-Shargabi, B., Al-Romimah, W. & Olayah, F., 2011. A comparative study for Arabic text classification algorithms based on stop words elimination. In ISWSA '11: Proceedings of the 2011 International Conference on Intelligent Semantic Web-Services and Applications. New York, NY, USA, 2011.
Ampazis, N. & Iakovaki, H., 2004. Cross-language information retrieval using latent semantic indexing and self-organizing maps. In Neural Networks, 2004. Proceedings. 2004 IEEE International Joint Conference., 2004.
Backström, T., 2004. Collective learning: A way over the ridge to a new organizational attractor. The Learning Organization, 11(6), pp.466 - 477.
Baeza-Yates, R., 1999. Latent Semantic Indexing Model. In Ricardo Baeza-Yates, B.R.-N. Modern Information Retrieval. New York, United States: Pearson, Addison Wesley. Ch. 2. p.44.
Baeza-Yates, R. & Ribeiro-Neto, B., 1999. Modern Information Retrieval. New York, USA: ACM Press and Pearson, Addison Wesley.
Berg, B.V.d. et al., 2005. Swarm-based Sequencing Recommendations in E-learning. In ISDA '05 Proceedings of the 5th International Conference on Intelligent Systems Design and Applications. Washington, DC, USA, 2005.

106
Büttcher, S., 2010. What is Information Retrieval. In M.I.o.T. (MIT), ed. Information Retrieval: Implementing and Evaluating Search Engines. New York, USA: The MIT Press. Ch. 1. pp.86 - 91.
Büttcher, S., Clarke, C. & Cormack, G., 2010. Measuring Effectiveness. In T.M. Press, ed. Information Retrieval: Implementing and Evaluating Search Engines. United States of America: Massachusetts Institute of Technology (MIT). Ch. 12. p.406.
Cattell, R.B., 1966. The Scree Test For The Number Of Factors. Multivariate Behavioral Research, 1(2), pp.245-76.
Celebi, E., Sen, B. & Gunel, B., 2009. Turkish — English cross language information retrieval using LSI. In Computer and Information Sciences, 2009. ISCIS 2009. 24th International Symposium on. Guzelyurt, 2009.
Charles, C.L.A. & Gordon, C.V., 2000. Shortest-substring retrieval and ranking. ACM Transactions on Information Systems (TOIS), 18(1), pp.44-78.
Claypool, M. et al., 1999. Combining Content-Based and Collaborative Filters in an Online Newspaper. In Proceedings of the ACM SIGIR '99 Workshop on Recommender Systems: Algorithms and Evaluation. Berkeley, California, 1999.
David, G.A. & Frieder, O., 2004. Latent Semantic Indexing. In W.B. Croft, ed. Information Retrieval: Algorithms and Heuristics. 2nd ed. Chicago, USA: Springer. Ch. 2. pp.70 - 73.
Deerwester, S. et al., 1999. Indexing by latent semantic analysis. Journal of the American Society for Information Science, 41(6), pp.391 - 407.
Dey, A.K., 2001. Understanding and Using Context. Personal and Ubiquitous Computing, 5(1), pp.4-7.
Doerr, B., Hota, A. & Kötzing, T., 2012. Ants easily solve stochastic shortest path problems. In Soule, T., ed. GECCO '12 Proceedings of the fourteenth international conference on Genetic and evolutionary computation. New York, 2012. ACM New York.
Drigas, A. et al., 2004. An expert system for job matching of the unemployed. Expert Systems with Applications, 26(2), pp.217-24.

107
Fu, B., Brennan, R. & O'Sullivan, D., 2011. Using pseudo feedback to improve cross-lingual ontology mapping. In ESWC'11 Proceedings of the 8th extended semantic web conference on The semantic web: research and applications -Volume Part I. Berlin, Heidelberg, 2011.
Gambarotto, F., Rangone, M. & Solari, S., 2001. Collective Learning: A Systemic Framework And Some Evidence From Two Local Systems. In Italian association for regional science (Aisre). Venezia, 2001.
Gee, K.R., 2003. Using Latent Semantic Indexing to Filter Spam. In In Proceedings of the 2003 ACM symposium on Applied computing. New York, USA, 2003.
Georgios, D.A., Athanasios, N.N. & Turega, M., 2003. E-Services in the Internet Job Market. In Proceedings of the 36th Annual Hawaii International Conference on System Sciences (HICSS'03). IEEE Computer Society Washington, DC, USA, 2003.
Govindaraju, V., Cao, H. & Bhardwaj, A., 2009. Handwritten document retrieval strategies. In Proceedings of The Third Workshop on Analytics for Noisy Unstructured Text Data. New York, USA, 2009.
Hastie, T., Tibshirani, R. & Friedman, J., 2009. Hierarchical Clustering. In T. Hastie, R.T.J.F. The Elements of Statistical Learning: Data Mining, Inference, and Prediction. Standford, California: Springer. Ch. 14. p.520.
Hinchey, M.G., Sterritt, R. & Rouff, C., 2007. Swarms and Swarm Intelligence. Computer, 40(4), pp.111 - 113.
Ientilucci, E.J., 2003. Using the Singular Value Decomposition. Technical Report. New York, United States: Chester F. Carlson Center for Imaging Science, Rochester Institute of Technology.
Ito, H. & Koshimizu, H., 2004. Keyword and face image retrieval based on latent semantic indexing. In Systems, Man and Cybernetics, 2004 IEEE International Conference on. The Hague, Netherlands, 2004.
Jain, A.K., Murty, M.N. & Flynn, P.J., 1999. Data Clustering: A Review. ACM Computing Surveys (CSUR), 31(3), pp.264-323.

108
Jinxi Xu, A.F.R.W., 2002. Empirical Studies in Strategies for Arabic Retrieval. In Proceedings of the 25th annual international ACM SIGIR conference on Research and development in information retrieval. New York, USA, 2002.
Jones, K.S., 2004. A statistical interpretation of term specificity and its application in retrieval. Journal of Documentation, 60(5), pp.493 - 502.
Jones, K.S., 2004. IDF term weighting and IR research lessons. Journal of Documentation, 60(5), pp.521 - 523.
Kekäläinen, J., 2005. Binary and graded relevance in IR evaluations: comparison of the effects on ranking of IR systems. Information Processing and Management: an International Journal, 41(5), pp.1019 - 1033.
Kennedy, J., 2006. Swarm Intelligence. In A.Y. Zomaya, ed. Handbook of Nature-Inspired and Innovative Computing. USA: Springer. pp.187-214.
Kikugawa, M., Won-Du, C., Soonwook, H. & Shin, J., 2010. A fast shape retrieval using dendrogram. In Neural Networks (IJCNN), The 2010 International Joint Conference on. Barcelona, 2010.
Klein, M., 2007. Achieving Collective Intelligence via Large-Scale On-line Argumentation. In Internet and Web Applications and Services, 2007. ICIW '07. Second International Conference on. Morne, 2007.
Kukla, E., 2008. Application of Swarm Intelligence in E-Learning Systems. In Proceedings of the 2008 conference on New Trends in Multimedia and Network Information Systems. Netherlands, 2008.
Landauer, T.K., 2007. The Traditional Antilearning Argument. In Thomas K. Landauer, D.S.M.S.D.W.K. Handbook of Latent Semantic Analysis. Mahwah, New Jersey, London: Lawrence Erlbaum Associations, Inc. Ch. 1. pp.5 - 8.
Landauer, T.K., Foltz, P.W. & Laham, D., 1998. An introduction to latent semantic analysis. Discourse Processes, 25(2), pp.259 - 284.
Landauer, T.K., Mcnamara, D.S., Dennis, S. & Kintsch, W., 2007. Handbook of Latent Semantic Analysis. New Jersey, London: Lawrence Erlbaum Association, Inc.

109
Liang, H. et al., 2010. Connecting users and items with weighted tags for personalized item recommendations. In Proceedings of the 21st ACM conference on Hypertext and hypermedia. New York, NY, USA, 2010.
Likas, A., Vlassis, N. & Jakob, V.J., 2003. The global k-means clustering algorithm. The Journal of The Pattern Recognition Society, 36(2), pp.451 - 461.
Li, Q. & Kim, B.M., 2003. Clustering Approach for Hybrid Recommender System. In WI '03 Proceedings of the 2003 IEEE / WIC International Conference on Web Intelligence. Washington, DC, USA, 2003.
Linden, G., Smith, B. & York, J., 2003. Amazon.com Recommendations: Item-to-item Collaborative Filtering. Internet Computing, IEEE, 7(1), pp.76 - 80.
Madylova, A., 2009. A taxonomy based semantic similarity of documents using the cosine measure. In Computer and Information Sciences, 2009. ISCIS 2009. 24th International Symposium on. Guzelyurt, 2009.
Madylova, A., 2009. A Taxonomy based Semantic Similarity of Documents using the Cosine Measure. In Computer and Information Sciences, ISCIS 2009, 24th International Symposium on. Guzelyurt, 2009.
Maleewong, K., Anutariya, C. & Wuwongse, V., 2008. A Collective Intelligence Approach to Collaborative Knowledge Creation. In Semantics, Knowledge and Grid, 2008. SKG '08. Fourth International Conference on. Beijing, 2008.
Malone, T.W., 2006. What is collective intelligence and what will we do about it? [Online] Available at: http://cci.mit.edu/about/MaloneLaunchRemarks.html[Accessed 2 January 2012].
Manning, C.D., 2008. Introduction to Information Retrieval. USA: Cambridge University Press.
Manolis, V.G. & Konstantinos, M.G., 2005. Applying SVD on Item-based Filtering. In ISDA '05 Proceedings of the 5th International Conference on Intelligent Systems Design and Applications. Washington, DC, USA, 2005.

110
McClean, Wu, S. & Sally, 2007. Several methods of ranking retrieval systems withpartial relevance judgment. In Digital Information Management, 2007. ICDIW '07. 2nd International Conference., 2007.
Meteren, R.V. & Someren, M.V., 2000. Using content-based filtering for recommendation. Computer and Information Science, 184(1), pp.47 - 56.
Michael, B.W., 2004. Latent Semantic Indexing (LSI). In Berry, M.W. Survey of Text Mining: Clustering, Classification, and Retrieval. New York, United States: Springer. Ch. 5. pp.107 - 108.
Michael, B.W., Susan, D.T. & Gavin, O.W., 1995. Using linear algebra for intelligent information retrieval. Society for Industrial and Applied Mathematics, 37(4), pp.573 - 595.
Nyein, S.S., 11-13 March 2011. Mining contents in Web page using cosine similarity. In Computer Research and Development (ICCRD), 2011 3rd International Conference on. Shanghai, 11-13 March 2011.
Othman, R.M. & Musa, N., 2007. E-recruitment practice: pros vs. cons. Public Sector ICT Management Review, 1.
Plagianakos, V.P., Tasoulis, D.K. & Vrahatis, M.N., 2005. Computational intelligence techniques for acute leukemia gene expression data classification. In Neural Networks, 2005. IJCNN '05. Proceedings. 2005 IEEE International Joint Conference on. Montreal, Que., 2005.
Pohl, S., Moffat, A. & Zobel, J., 2011. Efficient Extended Boolean Retrieval. Knowledge and Data Engineering, IEEE Transactions on, PP(99), pp.1-1.
Popović, M., 2009. Machine Translation: Statistical Approach with Additional Linguistic Knowledge. Dissertation. Belgrad, Serbien: RWTH Aachen University.
Porter, M.F., 1997. Readings in information retrieval. San Francisco, CA, USA: Morgan Kaufmann Publishers Inc.
Praus, P. & Praks, P., 2009. Automatic retrieval within water-related pictures database using Latent Semantic Indexing method. GeoScience Enginering, 2009(2), pp.19 - 28.

111
Langville, A. N., M.C.D., 2006.Introduction to Web Search Engine. In 2. Princeton University Press.Google's PageRank and Beyond. 2nd ed. New Jersey, United Kingdom: Princeton. Ch. 1. p.16.
Rafael, P. & Neto, J.P., 2007. Multi-agent learning: how to interact to improve collective results. In EPIA'07 Proceedings of the aritficial intelligence 13th Portuguese conference on Progress in artificial intelligence. Heidelberg, 2007.
Raghavan, V., Bollmann, P. & Jung, G.S., 1989. A critical investigation of recall and precision as measures of retrieval system performance. ACM Transactions on Information Systems (TOIS), 7(3), pp.205 - 229.
Richards, A.L., Holmans, P., Donovan, M. & Jones, L., 2008. A comparison of four clustering methods for brain expression. BMC Bioinformatics 2008, 9(1), p.490.
Salton, G., Wong, A. & Yang, C.S., 1975. A vector space model for automatic indexing. Communications of the ACM, 18(11), pp.613 - 620.
Sarwar, B., Karypis, G., Konstank, J. & Riedl, J., 2001. Item-based collaborative filtering recommendation algorithms. In WWW '01 Proceedings of the 10th international conference on World Wide Web. New York, NY, USA, 2001.
Schonlau, M., 2002. The clustergram: A graph for visualizing hierarchical and nonhierarchical cluster analyses. The Stata Journal, 2(4), pp.391-402.
Shen, X., Tan, B. & Zhai, C., 2005. Context-sensitive information retrieval using implicit feedback. In SIGIR '05 Proceedings of the 28th annual international ACM SIGIR conference on Research and development in information retrieval. New York, USA, 2005.
Smyth, B., Bradley, K. & Rafter, R., 2002. Personalization Techniques for Online Recruitment Services. Communications of the ACM, 45(5), pp.39-40.
Strang, G., 2006. Computations of Matrices. In Strang, G. Linear Algebra and Its Applications. United States, America: Thomson Learning. Ch. 7. pp.351 -367.

112
Su, X. & Khoshgoftaar, T.M., 2009. A survey of collaborative filtering techniques. Advances in Artificial Intelligence, 2009(4).
Supjarerndee, S., Temtanapat, Y. & Phalavonk, U., 2002. Recruitment Filtering with Personality-Job Fit Model. In Proceedings of the International Conference on Information Technology: Coding and Computing. Bangkok, Thailand, 2002.
Su, X. & Taghi Khoshgoftaar, M., 2009. A Survey of Collaborative Filtering Techniques. Advances in Artificial Intelligence, 2009, p.19.
Takács, G., Pilászy, I., Németh, B. & Tikk, D., 2009. Scalable Collaborative Filtering Approaches for Large Recommender Systems. The Journal of Machine Learning Research, 10, pp.623-56.
USDOL, 2010. O*NET Online. [Online] Available at: http://www.onetonline.org/.
Wanarsup, W., Pattamavorakun, S. & Pattamavorakun, S., 2008. Intelligence Personalization Job Web Site. In Ninth ACIS International Conference on Software Engineering, Artificial Intelligence, Networking, and Parallel/Distributed Computing. Washington, DC, USA, 2008.
Wang, J.-y. & Ye, X.-m., 2010. The study of methods for language model based positive and negative relevance feedback in information retrieval. In Intelligent Computing and Intelligent Systems (ICIS), 2010 IEEE International Conference on. Xiamen, 2010.
Wikipedia, 2008. Collaborative Filtering - Wikipedia The Free Encyclopedia. [Online] Available at: http://en.wikipedia.org/wiki/Collaborative_filtering.
Xu, Z. & Akella, R., 2008. Active relevance feedback for difficult queries. In CIKM '08 Proceedings of the 17th ACM conference on Information and knowledge management. New York, NY, USA, 2008.
Yilmaz, E., Aslam, J.A. & Robertson, S., 2008. A new rank correlation coefficient for information retrieval. In Proceedings of the 31st annual international ACM SIGIR conference on Research and development in information retrieval. New York, USA, 2008.

113
Zhu, S., Wu, J., Xia, G. & Li, L., 30 June 2010. TOP-MATA: A Max-First traversal method for top-K cosine similarity search. In Service Systems and Service Management (ICSSSM), 2010 7th International Conference on. Tokyo, Japan, 30 June 2010.
Baker, K., 2005. Kirk Baker Papers. [Online] Available at: www.ling.ohio-state.edu/./Singular_Value_Decomposition_Tutorial.pdf [Accessed 21 May 2011].
Wikipedia, 2005.Affix. [Online] Available at: http://en.wikipedia.org/wiki/Affix [Accessed 21 May 2010].
Grossman, D.A. &Frieder, O., 2004.Retrieval Strategies.In C.W. B., ed. Information Retrieval. 2nd ed. Netherlands: Springer. pp.9-74.
Julashokri, M., Fathian, M. &Gholamian, M.R., 2010.Improving customer's profile in recommender systems using time context and group preferences.In 5th International Conference on Computer Sciences and Convergence Information Technology (ICCIT).Seoul, 2010.IEEE.

114
Appendix A
Sample of the Online Recruitment websites
Jobs Central: http://jobscentral.com.my/

115
JobsDB.com: http://my.jobsdb.com/my

116
Jobstreet.com: http://www.jobstreet.com.my/

117
Monster: http://www.jobstreet.com.my/

118
Screen shots of the job listing and alerts newsletterfrom job websites:

SVD is related to eigenvectors and eigenvalues. It must
.Scalar
solve the equation by treating the matrix A as a system of linear equations and
solving for the values of the variables that compose the components of the
eigenvector. In fact vector x has the property that its direction is not changed
by the transformation of matrix A. However, it is scaled by a factor of scalar
The scaling can be that each eigenvector is associated with a specific
eigenvalue or one eigenvalue as
eigenvectors.
On the other hand, there are cases where vectors x will not satisfy such an
equation – change direction when acted by A. Therefore, we are only
in those specific eigenvector (s) and eigenvalue (s).
119
Appendix B
Eigenvectors and Eigenvalues
SVD is related to eigenvectors and eigenvalues. It must satisfy the equation of
.Scalar λ is eigenvalue of A corresponding to eigenvector x. We can
solve the equation by treating the matrix A as a system of linear equations and
solving for the values of the variables that compose the components of the
or. In fact vector x has the property that its direction is not changed
by the transformation of matrix A. However, it is scaled by a factor of scalar
The scaling can be that each eigenvector is associated with a specific
eigenvalue or one eigenvalue associated with multiple (infinite) numbers of
Vector X is scaled by a factor of scalar λ
On the other hand, there are cases where vectors x will not satisfy such an
change direction when acted by A. Therefore, we are only
in those specific eigenvector (s) and eigenvalue (s).
satisfy the equation of
corresponding to eigenvector x. We can
solve the equation by treating the matrix A as a system of linear equations and
solving for the values of the variables that compose the components of the
or. In fact vector x has the property that its direction is not changed
by the transformation of matrix A. However, it is scaled by a factor of scalar λ.
The scaling can be that each eigenvector is associated with a specific
sociated with multiple (infinite) numbers of
On the other hand, there are cases where vectors x will not satisfy such an
change direction when acted by A. Therefore, we are only interested

120
For illustration purpose, assume that matrix A is:
21
12A
In this case, by applying the equation:
2
1
2
1
21
12
x
x
x
xxAx
Then, we have to solve the equations:
1212 xxx 0)2( 21 xx
221 2 xxx 0)2( 21 xx
A necessary and sufficient condition for this system to have a nonzero vector
21 xx is that the determinant of the coefficient matrix
)2(1
1)2(
where,
0)2(1
1)2(
011)2)(2(
0342 0)1)(3( 31 12
In this case, we have found the eigenvalues of matrix A which are ‘3’ and ‘1’.
The eigenvectors can be found by substituting the eigenvalues into the
equations above and solving for the x’s. Therefore, the eigenvectors are [-1, 1]
and [1, 1].

121
Appendix C
A Sample of Matrix A
Different Tasks
Term Task 1 Task 2 Task 3
Software 4 2 0
Quality 2 2 0
Manager 1 0 0
Provides 1 0 0
Analysis 1 0 0
And 6 5 2
Consulting 1 0 0
On 1 0 1
Highly 1 0 0
Complex 1 0 0
development 2 0 0
projects 1 0 0
Related 1 0 0
To 1 1 2
assurance 1 1 0
Work 1 0 1
processes 1 0 0
compliance 1 0 0
With 1 0 0
standards 1 0 0
methodologies 1 0 0
Manage 1 0 0
Lead 1 0 0
a 1 0 0
team 1 0 0
of 2 0 0
engineers 1 0 0
For 1 0 0
The 1 0 1
execution 1 0 0
Test 1 3 0

122
Plans 1 1 0
procedures 1 0 0
QA 0 1 0
Engineer 0 1 0
Define 0 1 0
Evolve 0 1 0
Strategy 0 1 0
Associated 0 1 0
Process 0 1 0
Tools 0 1 0
Create 0 1 0
Execute 0 1 0
Cycles 0 1 0
Ensure 0 1 0
High 0 1 0
Successful 0 1 0
Release 0 1 0
This 0 0 1
Individual 0 0 1
needs 0 0 1
answer 0 0 1
All 0 0 1
Customer 0 0 2
Interactions 0 0 1
By 0 0 1
Phone 0 0 1
Product 0 0 2
Related 0 0 1
Enquiries 0 0 1
Features 0 0 1
Oriented 0 0 1
Has 0 0 1
Ability 0 0 1
Independently 0 0 1
Under 0 0 1
Minimum 0 0 1
Supervision 0 0 1

123
Appendix D
Matrix Decomposition of A = Uk�kVkT
4 2 0
2 2 0
1 0 0
1 0 0
1 0 0
6 5 2
1 0 0
1 0 1
1 0 0
1 0 0
2 0 0
1 0 0
1 0 0
1 1 2
1 1 0
1 0 1
1 0 0
1 0 0
1 0 0
1 0 0
1 0 0
1 0 0
1 0 0
1 0 0
1 0 0
2 0 0
1 0 0
1 0 0
1 0 1
1 0 0
1 3 0
1 1 0
1 0 0
0 1 0
0 1 0
0 1 0
0 1 0
0 1 0
0 1 0
0 1 0
0 1 0
0 1 0
0 1 0
0 1 0
0 1 0
0 1 0
0 1 0
0 1 0
0 0 1
0 0 1
0 0 1
0 0 1
0 0 1
0 0 2
0 0 1
0 0 1
0 0 1
0 0 2
0 0 1
0 0 1
0 0 1
0 0 1
0 0 1
0 0 1
0 0 1
0 0 1
0 0 1
0 0 1
-0.3764 0.1636 -0.1471
-0.2380 0.1080 0.0867
-0.0692 0.0278 -0.1169
-0.0692 0.0278 -0.1169
-0.0692 0.0278 -0.1169
-0.7018 -0.0451 0.1109
-0.0692 0.0278 -0.1169
-0.0880 -0.1437 -0.1113
-0.0692 0.0278 -0.1169
-0.0692 0.0278 -0.1169
-0.1384 0.0556 -0.2338
-0.0692 0.0278 -0.1169
-0.0692 0.0278 -0.1169
-0.1567 -0.2889 0.0544
-0.1190 0.0540 0.0433
-0.0880 -0.1437 -0.1113
-0.0692 0.0278 -0.1169
-0.0692 0.0278 -0.1169
-0.0692 0.0278 -0.1169
-0.0692 0.0278 -0.1169
-0.0692 0.0278 -0.1169
-0.0692 0.0278 -0.1169
-0.0692 0.0278 -0.1169
-0.0692 0.0278 -0.1169
-0.0692 0.0278 -0.1169
-0.1384 0.0556 -0.2338
-0.0692 0.0278 -0.1169
-0.0692 0.0278 -0.1169
-0.0880 -0.1437 -0.1113
-0.0692 0.0278 -0.1169
-0.2186 0.1065 0.3638
-0.1190 0.0540 0.0433
-0.0692 0.0278 -0.1169
-0.0498 0.0262 0.1602
-0.0498 0.0262 0.1602
-0.0498 0.0262 0.1602
-0.0498 0.0262 0.1602
-0.0498 0.0262 0.1602
-0.0498 0.0262 0.1602
-0.0498 0.0262 0.1602
-0.0498 0.0262 0.1602
-0.0498 0.0262 0.1602
-0.0498 0.0262 0.1602
-0.0498 0.0262 0.1602
-0.0498 0.0262 0.1602
-0.0498 0.0262 0.1602
-0.0498 0.0262 0.1602
-0.0498 0.0262 0.1602
-0.0188 -0.1715 0.0056
-0.0188 -0.1715 0.0056
-0.0188 -0.1715 0.0056
-0.0188 -0.1715 0.0056
-0.0188 -0.1715 0.0056
-0.0377 -0.3429 0.0111
-0.0188 -0.1715 0.0056
-0.0188 -0.1715 0.0056
-0.0188 -0.1715 0.0056
-0.0377 -0.3429 0.0111
-0.0188 -0.1715 0.0056
-0.0188 -0.1715 0.0056
-0.0188 -0.1715 0.0056
-0.0188 -0.1715 0.0056
-0.0188 -0.1715 0.0056
-0.0188 -0.1715 0.0056
-0.0188 -0.1715 0.0056
-0.0188 -0.1715 0.0056
-0.0188 -0.1715 0.0056
-0.0188 -0.1715 0.0056
11.454 0 0
0 5.6929 0
0 0 5.0396
-0.7924 0.1582 -0.5891
-0.5706 0.1493 0.8075
-0.2157 -0.9761 0.028

124
Appendix E
Compute the Query q, qTUk�k-1
1
1
0
0
0
0
0
0
0
0
0
0
0
0
1
0
0
0
0
0
0
0
0
0
0
0
0
0
0
0
0
0
0
0
0
0
0
0
0
0
0
0
0
0
0
0
0
0
0
0
0
0
0
0
0
0
0
0
0
0
0
0
0
0
0
0
0
0
-0.3764 0.1636 -0.1471
-0.2380 0.1080 0.0867
-0.0692 0.0278 -0.1169
-0.0692 0.0278 -0.1169
-0.0692 0.0278 -0.1169
-0.7018 -0.0451 0.1109
-0.0692 0.0278 -0.1169
-0.0880 -0.1437 -0.1113
-0.0692 0.0278 -0.1169
-0.0692 0.0278 -0.1169
-0.1384 0.0556 -0.2338
-0.0692 0.0278 -0.1169
-0.0692 0.0278 -0.1169
-0.1567 -0.2889 0.0544
-0.1190 0.0540 0.0433
-0.0880 -0.1437 -0.1113
-0.0692 0.0278 -0.1169
-0.0692 0.0278 -0.1169
-0.0692 0.0278 -0.1169
-0.0692 0.0278 -0.1169
-0.0692 0.0278 -0.1169
-0.0692 0.0278 -0.1169
-0.0692 0.0278 -0.1169
-0.0692 0.0278 -0.1169
-0.0692 0.0278 -0.1169
-0.1384 0.0556 -0.2338
-0.0692 0.0278 -0.1169
-0.0692 0.0278 -0.1169
-0.0880 -0.1437 -0.1113
-0.0692 0.0278 -0.1169
-0.2186 0.1065 0.3638
-0.1190 0.0540 0.0433
-0.0692 0.0278 -0.1169
-0.0498 0.0262 0.1602
-0.0498 0.0262 0.1602
-0.0498 0.0262 0.1602
-0.0498 0.0262 0.1602
-0.0498 0.0262 0.1602
-0.0498 0.0262 0.1602
-0.0498 0.0262 0.1602
-0.0498 0.0262 0.1602
-0.0498 0.0262 0.1602
-0.0498 0.0262 0.1602
-0.0498 0.0262 0.1602
-0.0498 0.0262 0.1602
-0.0498 0.0262 0.1602
-0.0498 0.0262 0.1602
-0.0498 0.0262 0.1602
-0.0188 -0.1715 0.0056
-0.0188 -0.1715 0.0056
-0.0188 -0.1715 0.0056
-0.0188 -0.1715 0.0056
-0.0188 -0.1715 0.0056
-0.0377 -0.3429 0.0111
-0.0188 -0.1715 0.0056
-0.0188 -0.1715 0.0056
-0.0188 -0.1715 0.0056
-0.0377 -0.3429 0.0111
-0.0188 -0.1715 0.0056
-0.0188 -0.1715 0.0056
-0.0188 -0.1715 0.0056
-0.0188 -0.1715 0.0056
-0.0188 -0.1715 0.0056
-0.0188 -0.1715 0.0056
-0.0188 -0.1715 0.0056
-0.0188 -0.1715 0.0056
-0.0188 -0.1715 0.0056
-0.0188 -0.1715 0.0056
11.454 0 0
0 5.6929 0
0 0 5.0396
Query’s Coordinates (-0.0640, 0.0572)

125
Appendix F
Sample of a matrixand construction of a new query with Collective Learning
Feedback Provider
JOBS
Initial Query Term Job X Job Y New Query
1 Software 4 2 2.33
1 Quality 2 2 1.67
0 Manager 1 0 0.33
0 Provides 1 0 0.33
0 Analysis 1 0 0.33
0 And 6 5 3.67
0 Consulting 1 0 0.33
0 On 1 0 0.33
0 Highly 1 0 0.33
0 Complex 1 0 0.33
0 development 2 0 0.67
0 projects 1 0 0.33
0 Related 1 0 0.33
0 To 1 1 0.67
1 assurance 1 1 1.00
0 Work 1 0 0.33
0 processes 1 0 0.33
0 compliance 1 0 0.33
0 With 1 0 0.33
0 standards 1 0 0.33
0 methodologies 1 0 0.33
0 Manage 1 0 0.33

126
0 Lead 1 0 0.33
0 a 1 0 0.33
0 team 1 0 0.33
0 of 2 0 0.67
0 engineers 1 0 0.33
0 For 1 0 0.33
0 The 1 0 0.33
0 execution 1 0 0.33
0 Test 1 3 1.33
0 Plans 1 1 0.67
0 procedures 1 0 0.33
0 QA 0 1 0.33
0 Engineer 0 1 0.33
0 Define 0 1 0.33
0 Evolve 0 1 0.33
0 Strategy 0 1 0.33
0 Associated 0 1 0.33
0 Process 0 1 0.33
0 Tools 0 1 0.33
0 Create 0 1 0.33
0 Execute 0 1 0.33
0 Cycles 0 1 0.33
0 Ensure 0 1 0.33
0 High 0 1 0.33
0 Successful 0 1 0.33
0 Release 0 1 0.33
0 This 0 0 0.00
0 Individual 0 0 0.00
0 needs 0 0 0.00
0 answer 0 0 0.00

127
0 All 0 0 0.00
0 Customer 0 0 0.00
0 Interactions 0 0 0.00
0 By 0 0 0.00
0 Phone 0 0 0.00
0 Product 0 0 0.00
0 Related 0 0 0.00
0 Enquiries 0 0 0.00
0 Features 0 0 0.00
0 Oriented 0 0 0.00
0 Has 0 0 0.00
0 Ability 0 0 0.00
0 Independently 0 0 0.00
0 Under 0 0 0.00
0 Minimum 0 0 0.00
0 Supervision 0 0 0.00