development of extruded functional snack foods from … · introduction it has been ... protein...
TRANSCRIPT

Research ArticleVolume 7 Issue 4 - August 2018DOI: 10.19080/JDVS.2018.07.555717
Dairy and Vet Sci JCopyright © All rights are reserved by Mangaraj S
Development of Extruded Functional Snack Foods from Plants and Dairy Ingredients
Employing Response Surface Methodology
Mangaraj S*1, Sachidananda Swain2 and Deshpande SS1
1Senior scientist, and Principal Scientist, Bhopal2Scientist, Division of NRM, ICAR-Central Islands Agricultural Research Institute (CIARI), Bhopal
Submission: June 20, 2018; Published: August 29, 2018
*Corresponding author: Mangaraj S, Senior scientist, and Principal Scientist, respectively ICAR-CIAE, Bhopal, Email:
Dairy and Vet Sci J 7(4): JDVS.MS.ID.555717 (2018) 001
Introduction
It has been estimated that 800 million malnourished people exist in developing countries. Development of nutritious foods has been suggested by FAO to combat malnutrition among children for maintaining good health. Snacks contribute an important part of daily nutrient and calorie intake for many consumers. Extruded snack foods have been increasingly gained popularity for provid-ing safe, nutritious, and wholesome food for poor and undernour-ished populations for the developing world [1-3]. Reasonably low protein content (2.44 to 11.06%) in market snacks has been re-ported by several workers. Thus, high consumption of such snacks could lead to malnutrition in children and obesity, which leads to several diseases in adults [4]. Consumption of snacks as a meal could be applicable if it could either provides protein of 2.5–3.0 g per 100Kcal; or if 10–12% of total calories are obtained from pro tein; or if the calories gained from consuming the snack was from
carbohydrate (55–65%), fat (20–30%) and protein10–15%). One means for rendering fast food items more nutritious is to fortify them with protein, vitamins, minerals etc. [5].
Cereals mainly rice flour have been popular raw materials for extrusion for food uses mainly because of functional properties, low cost, bland taste, attractive white color, hypoallergenicity and ease of digestion [6]. However, rice is limiting in lysine, the essential amino acid needed for growth but is high in methionine and cystine availability. In contrast, soy protein is high in lysine but low in methionine and cystine. Soy protein contains essential amino acids, most of which are present in amounts that closely match those required for humans. Owing to high protein content, soybean can be effectively utilized for nutritional improvement of cereal based extruded foods [7,8]. Currently, there is considerable and increasing interest in the health benefits of soy-containing
Journal of
Dairy & Veterinary SciencesISSN: 2573-2196
Abstract
Although food fortification has been practiced for many years in some countries in the Asian region, notably the more affluent ones, national food-fortification programmed have yet to be fully implemented in areas where this problem abounds. In this paper, we highlighted the development of extruded products based on ICMR recommendations for school going children of age 9-18 year to combat hunger deficiency related disorder. In this regard, corn and rice flour, Defatted soy flour (DFSF), Soy protein isolate (SPI), dairy whitener (DW), mango and spinach were taken as raw materials for the study. The result indicated that there was significant difference between protein, fat, carbohydrate and energy content of extruded products. Protein content increased being maximum (24.5%) at 20% of DFSF for DW based product at constant amount of SPI and DW. The significant changes in fat content may be attributed to defatting soy flour that increased the protein solubility and water and oil absorption capacities of the extruded products. High degree of starch gelatinisation at pre-setted machine parameters may be resulted in formation of large insoluble complexes or Maillard compounds causing lesser availability of carbohydrate compounds at higher level of rice and corn flour. Upon model fitting, all the independent variables followed linear model (P<0.001) except carbohydrate content for mango. High R2 values (R2>0.92) and non-significant lack of fit between variables and responses indicated good fits and adequacy for the models. Storage study revealed that there was non-significant increase in moisture and hardness of extruded products.
Keywords: Hardness; Cohesiveness; Stickiness; Springiness; Chewiness; Gumminess; Adhesiveness; Carbohydrates; Proteins; Fat; Minerals; Archidonic acid; Linolenic acid; Obesity; Spinach powder; Mango; Papaya; Calcium
Abbreviations: DFSF: Defatted Soy Flour; SPI: Soy Protein Isolate; DW: Dairy Whitener; FFSF: Full Fat Soy Flour; CIAE: Central Institute of Agricultural Engineering

How to cite this article: Mangaraj S, Sachidananda S, Deshpande S. Development of Extruded Functional Snack Foods from Plants and Dairy Ingredients Employing Response Surface Methodology. Dairy and Vet Sci J. 2018; 7(4): 555717. DOI: 10.19080/JDVS.2018.07.555717.
002
Journal of Dairy & Veterinary Sciences
foods; in the role of soy protein in lowering the incidence of certain cancers. Several food products were developed to add up protein content by a combination of cereal and soybean flour [9]. Hence, an optimal incorporation of full fat soy flour (FFSF, 43.6% protein, 18% fat) or defatted soy flour (DFSF, 47.2% protein, 1.0% fat) in snacks could increase protein quality [10,11]. Several researchers developed ready-to-eat fortified products by blending cereals with vegetables and fruits. The incorporation of cauliflower trimmings into ready-to-eat expanded products up to 10% level was suggest-ed by Stojceska et al. [12]. Altan et al. [13,14] processed the blends of barley flour and tomato pomace; barley flour and grape pom-ace, corn flour and tomato pomace in a co-rotating twin-screw ex-truder. Upadhyay et al. [15,16] reported the use of carrot pomace, gram flour and rice flour-based formulation for extrusion studies. However, the range of process variable was too wide.
Among fruits, mangoes contain 10-20 percent sugar and are an important source of vitamin A. Among vegetables, spinach is much richer in protein than other vegetables and it also has high vitamin A content. It is a good source of minerals, but the high con-tent of oxalate leaves the calcium unavailable in diets. So, enabling calcium richness in fortified products, milk is one of the alterna-tives as a major source of calcium besides other useful properties like easy in digestibility, protein content, linoleic acid (2.1%), lino-lenic acid (0.5%) and archidonic acid (0.14%).
The main objective of the present investigation is to provide soy-based protein-rich, low-fat nutritious snacks and food. The products have been designed and developed based on ICMR rec-ommendations for school going children of age 9-18 years. This study will provide an additional source of utilization of soy flour in
extruded food formulations. The products developed would pro-vide an opportunity for enhancing the use of quality soy protein through popular snack/food products for the school children.
Materials and Methods
Raw Materials
Corn, rice and wheat flour, oil, skim milk powder and salt were procured from local market of Bhopal. Soy flour (DFSF, FFSF, SPI) were prepared at ICAR-Central Institute of Agricultural Engineer-ing (CIAE), Bhopal. Mango, papaya, and spinach powder were pre-pared in food processing laboratory of CIAE. The raw materials were cleaned by sieving and proper amount of the materials were taken by weights. Required amount of water was added to make the feed moisture to required level (10-15%). All the materials were mixed properly after addition of salt. The mixture was kept 1 hr for pre-conditioning. The twin screw extruder (make BPTL Kolkata) was set with screw speed 400 rpm and temperature of heaters at 70 °C and 120 °C for extruder barrel and die. The pres-sure was maintained between 2059 and 4119 kg/cm2. The mix-ture was feed and extruded after which the product was kept in dryer for 1.5h to remove moisture. The raw material combinations and their proportions were selected by design expert 7.6 software for different treatment combination of extruded products. Three types of extruded products were extruded based on DW, fruit (mango) and vegetable (spinach) keeping another variables con-stant in each product.
Some important chemical composition (nutritional values) of all these raw materials taken for the development of extruded snack foods and noodles are given in Table 1.
Table 1: Chemical composition of raw materials used for the development of extruded snack.
Raw materials Moisture (%) Protein (%) Fat (%) CHO (%) Energy (kcal/100 g)
Corn flour 14.9 11.0 3.6 66.0 342
Rice flour 13.7 6.8 0.5 78.0 345
Wheat flour 12.2 12.1 1.7 69.0 341
Soybean 10.0 40.0 20.0 30.0 446
DFSF 7.0 50.0 1.0 47.5 430
Guava 77.0 1.1 0.2 14.4 68
Papaya 90.7 0.5 0.3 11.0 43
Mango 81.0 0.6 0.4 15.0 60
Carrot 86.0 0.9 0.3 9.6 41
Spinach 92.1 2.9 0.5 3.6 23
Dairy whiteners 4.1 38.0 0.1 51.0 357
SPI - 90.0 0.1 6.0 411
Refined wheat flour - 11.0 0.9 73.9 349
Response Surface Methodology
Response surface methodology (RSM: Mixture Design) was employed to evaluate the effect of different combination with pro-portion of raw ingredients and their interaction on the nutritional qualities parameters namely protein, fat, carbohydrate and energy
content of the extruded snack foods. Corn flour, rice flour, soy flour (DFSF, FFSF, SPI), dairy whitener, mango, papaya, spinach powder etc. were taken as independent (input factor) and quality attri-butes such as protein content, fat, carbohydrate and energy were considered as dependent parameters.

How to cite this article: Mangaraj S, Sachidananda S, Deshpande S. Development of Extruded Functional Snack Foods from Plants and Dairy Ingredients Employing Response Surface Methodology. Dairy and Vet Sci J. 2018; 7(4): 555717. DOI: 10.19080/JDVS.2018.07.555717.
003
Journal of Dairy & Veterinary Sciences
Accordingly, mathematical models would be developed to pre-dict the quality parameters of extruded snack foods and noodles under different inputs parameters. Mathematically this can be represented as shown in equation (1)
( 1, 2 )y f x x xn= − − − (1)
Where ‘f ’ is the response surface function, ‘y’ is dependent variable (quality parameters) and x1, x2, ….xn are input factors.
To approximate the function ‘f ’, second order polynomial equation of the following form was assumed (equation 2).
2 20 1 1 2 2 11 1 22 2 12 1 2y = b + b x + b x + b x + b x + b x x (2)
Where, y is the predicted response (dependent variables); b0, b1, b2, b11, b12 and b22 are the regression coefficients; and x1, x2, ……xn are the coded value of independent variables which are linearly related by the following equation (3) with the original val-ues [17-19].
( )mi i
i di
2 X - Xx =
X
(3)
Where, Xi is actual value in original units, Xim is mean of max-imum and minimum values, Xid is the difference between maxi-
mum and minimum values, xi is the coded values of independent variables.
Mixture Design for Development of Extruded Products
Mixture design was used for optimization of different propor-tion of raw materials namely corn flour, rice flour, DFSF, SPI, fruits, vegetable and dairy whiteners for development of extruded func-tional food. The range of the percentage of materials taken mix-ture design has been given in Table 2.
Table 2: Range of independent parameters.
ConstraintsLower Limit Upper Limit
Name Goal
A: Corn is in range 30 50
B: Rice is in range 30 50
C: DFSF is in range 10 20
D: SPI is in range 5 10
Fruits, Vegetable, DW is in range 5 15
Extrusion Process
Figure 1: Flow chart for the development of extruded food product.
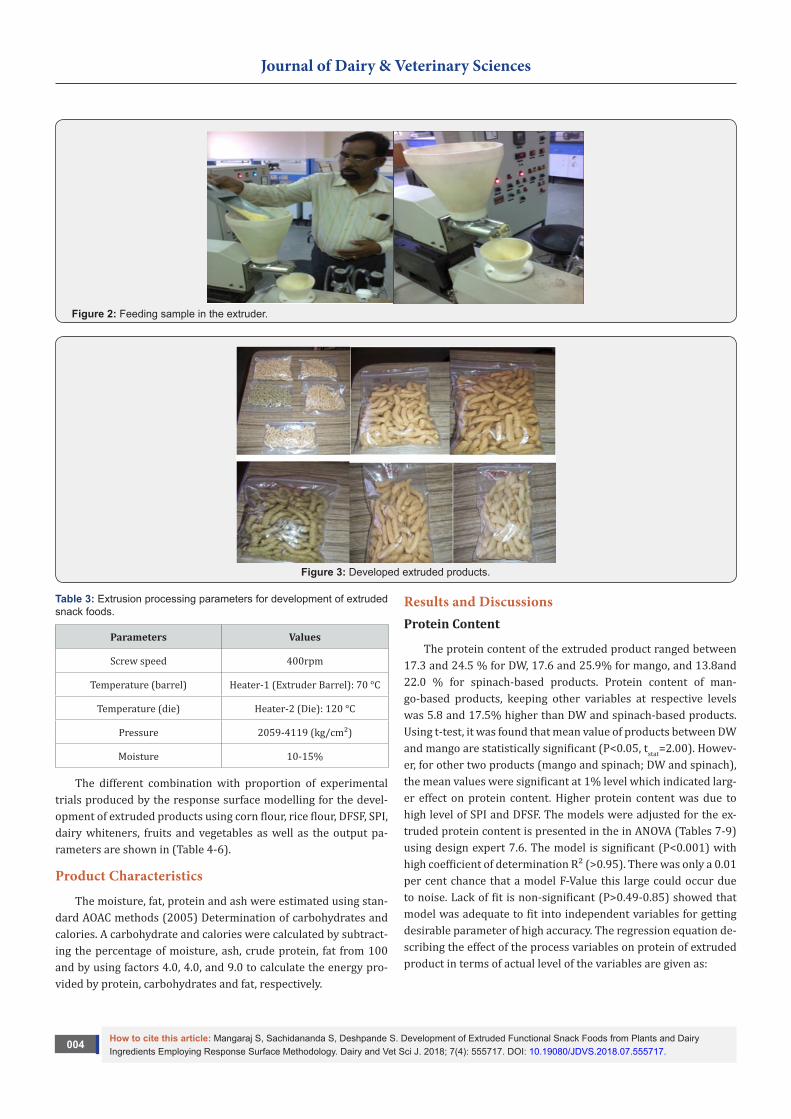
The twin screw extruder (make BPTL Kolkata) was started 1 h before the start of experimentation to heat the barrel and die. The flow chart is given in Figure 1. The mixture was fed to the extruder and extruded (Figure 2). The product obtained was kept in dryer for one a half hour to remove moisture. The feed rate was calculated by dividing the raw material fed through feeder and the amount of material fed in 1 min is collected. The extruded prod-
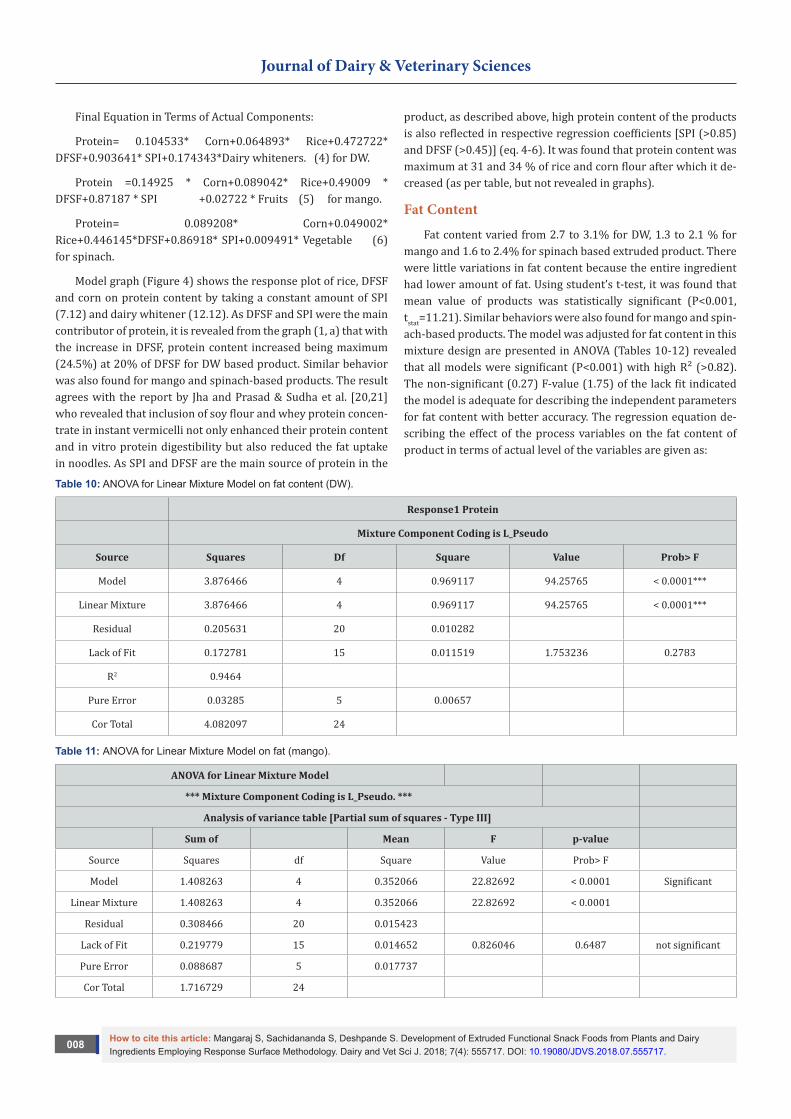
ucts developed using various combination and proportion of raw ingredients (S-1: corn + rice + DFSF + DW + SPI; S-2: corn + rice + DFSF + carrot + SPI; S-3: corn + rice + DFSF +spinach + SPI; S-4: corn + rice + DFSF + mango + SPI and control: corn + rice) are shown in Figure 3. The extrusion processing parameters were set to produce extruded functional foods is mentioned in Table 3.
How to cite this article: Mangaraj S, Sachidananda S, Deshpande S. Development of Extruded Functional Snack Foods from Plants and Dairy Ingredients Employing Response Surface Methodology. Dairy and Vet Sci J. 2018; 7(4): 555717. DOI: 10.19080/JDVS.2018.07.555717.
004
Journal of Dairy & Veterinary Sciences
Figure 2: Feeding sample in the extruder.
Figure 3: Developed extruded products.
Table 3: Extrusion processing parameters for development of extruded snack foods.
Parameters Values
Screw speed 400rpm
Temperature (barrel) Heater-1 (Extruder Barrel): 70 °C
Temperature (die) Heater-2 (Die): 120 °C
Pressure 2059-4119 (kg/cm²)
Moisture 10-15%
The different combination with proportion of experimental trials produced by the response surface modelling for the devel-opment of extruded products using corn flour, rice flour, DFSF, SPI, dairy whiteners, fruits and vegetables as well as the output pa-rameters are shown in (Table 4-6).
Product Characteristics
The moisture, fat, protein and ash were estimated using stan-dard AOAC methods (2005) Determination of carbohydrates and calories. A carbohydrate and calories were calculated by subtract-ing the percentage of moisture, ash, crude protein, fat from 100 and by using factors 4.0, 4.0, and 9.0 to calculate the energy pro-vided by protein, carbohydrates and fat, respectively.
Results and DiscussionsProtein Content
The protein content of the extruded product ranged between 17.3 and 24.5 % for DW, 17.6 and 25.9% for mango, and 13.8and 22.0 % for spinach-based products. Protein content of man-go-based products, keeping other variables at respective levels was 5.8 and 17.5% higher than DW and spinach-based products. Using t-test, it was found that mean value of products between DW and mango are statistically significant (P<0.05, tstat=2.00). Howev-er, for other two products (mango and spinach; DW and spinach), the mean values were significant at 1% level which indicated larg-er effect on protein content. Higher protein content was due to high level of SPI and DFSF. The models were adjusted for the ex-truded protein content is presented in the in ANOVA (Tables 7-9) using design expert 7.6. The model is significant (P<0.001) with high coefficient of determination R² (>0.95). There was only a 0.01 per cent chance that a model F-Value this large could occur due to noise. Lack of fit is non-significant (P>0.49-0.85) showed that model was adequate to fit into independent variables for getting desirable parameter of high accuracy. The regression equation de-scribing the effect of the process variables on protein of extruded product in terms of actual level of the variables are given as:

How to cite this article: Mangaraj S, Sachidananda S, Deshpande S. Development of Extruded Functional Snack Foods from Plants and Dairy Ingredients Employing Response Surface Methodology. Dairy and Vet Sci J. 2018; 7(4): 555717. DOI: 10.19080/JDVS.2018.07.555717.
005
Journal of Dairy & Veterinary Sciences
Table 4: Treatment combinations using Design Expert 7.6 (DW based combinations).
Input parameter Output parameter
Corn (g) Rice (g) DFSF (g) SPI (g) Dairy Whiteners (DW) Protein (g) Fat (g) CHO (g) Energy kcal
30.00 39.68 15.30 5.00 10.00 19.31 2.16 65.19 357.54
30.84 30.20 20.00 8.93 10.03 24.50 2.22 60.15 358.58
30.00 36.62 13.45 9.92 10.00 22.66 2.14 62.09 358.21
41.10 30.00 10.00 8.89 10.00 20.89 2.46 62.93 357.45
30.00 30.02 19.98 5.00 14.99 21.73 3.12 62.03 363.18
35.77 30.00 19.22 5.00 10.00 20.98 2.374 62.94 357.09
30.00 42.97 10.00 7.02 10.00 18.71 2.12 65.73 356.86
30.00 42.24 10.00 5.00 12.76 17.41 2.64 66.59 359.76
44.99 30.00 10.00 5.00 10.00 17.68 2.87 65.51 358.62
30.00 35.48 15.37 6.75 12.39 20.97 2.88 63.18 362.56
30.00 37.69 10.00 9.17 13.14 20.93 2.97 63.22 363.42
30.77 34.87 11.42 7.93 15.00 20.65 3.35 63.05 365.08
30.77 34.87 11.42 7.93 15.00 20.65 3.35 63.05 365.08
35.11 34.06 10.27 10.00 10.54 21.49 2.65 62.53 359.97
42.00 30 10.00 5.00 12.98 17.85 3.28 65.09 361.35
30.00 30 15.93 9.98 14.07 24.02 3.13 59.98 364.26
33.12 38.29 11.00 7.56 10.00 19.60 2.45 64.52 358.60
35.92 31.94 13.85 5.49 12.78 19.52 3.08 63.95 361.67
38.91 33.68 10.46 5.08 11.84 17.82 2.98 65.50 360.16
30.00 30.01 19.98 5.00 14.99 21.62 3.35 62.03 364.85
37.11 37.87 10.00 5.00 10.00 17.30 2.58 66.45 358.28
42.15 30 12.83 5.00 10.00 18.66 2.75 64.72 358.35
30.00 30 15.93 9.98 14.07 24.09 3.13 59.98 364.54
30.00 42.24 10.00 5.00 12.75 17.37 2.71 66.59 360.36
30.00 39.68 15.30 5.00 10.00 19.13 2.24 65.19 357.54
Table 5: Treatment combinations using Design Expert 7.6 (mango based combinations).
Input parameter Output parameter
Corn Rice DFSF SPI Mango Protein Fat CHO Energy kcal
32.81 31.52 10.66 10.00 14.99 21.96 1.42 60.67 343.41
30.00 43.72 10.00 5.00 11.26 17.65 1.35 67.46 352.74
30.00 42.31 14.46 5.00 8.22 19.63 1.39 67.56 361.33
30.15 30.10 20.00 9.99 9.73 25.93 1.41 60.50 358.47
31.04 38.38 20.00 5.33 5.23 22.36 1.46 66.80 369.87
30.00 38.77 16.66 9.55 5.00 24.50 1.39 65.09 370.97
30.01 30.00 19.98 5.00 14.99 21.87 1.40 61.21 344.98
30.01 30.00 19.98 5.00 14.99 21.58 1.40 60.46 340.84
32.81 31.52 10.66 10.00 14.99 22.12 1.40 59.92 340.84
30.94 35.29 13.78 9.65 10.32 23.29 1.37 62.04 353.76
36.07 34.11 16.29 7.01 6.50 22.56 1.56 64.83 363.70
40.77 33.39 10.74 10.00 5.07 23.11 1.66 65.01 367.49
40.77 33.39 10.74 10.00 5.07 23.11 2.00 65.01 370.57
30.00 49.98 10.00 5.00 5.00 18.19 1.68 67.56 358.22
35.24 39.38 11.94 7.384 6.035 21.12 1.85 65.66 363.81
39.41 30.00 12.34 7.49 10.74 21.26 1.97 62.02 350.98
30.00 41.29 10.00 9.70 8.99 21.86 1.66 63.43 356.17

How to cite this article: Mangaraj S, Sachidananda S, Deshpande S. Development of Extruded Functional Snack Foods from Plants and Dairy Ingredients Employing Response Surface Methodology. Dairy and Vet Sci J. 2018; 7(4): 555717. DOI: 10.19080/JDVS.2018.07.555717.
006
Journal of Dairy & Veterinary Sciences
49.18 30.00 10.00 5.80 5.00 20.12 2.178 66.63 366.63
45.78 30.00 10.00 5.00 9.20 19.05 2.07 65.09 355.22
31.03 34.61 18.45 8.16 7.73 24.53 1.66 61.92 360.80
41.30 38.69 10.00 5.00 5.00 19.11 1.93 69.50 371.93
30.00 43.721 10.00 5.00 11.26 18.24 1.58 67.01 355.30
39.56 30.40 20.00 5.00 5.02 23.06 1.95 65.71 372.69
30.00 49.98 10.00 5.00 5.00 18.63 1.58 68.85 364.25
44.57 30.00 15.41 5.00 5.00 21.43 2.07 66.95 372.25
Table 6: Treatment combinations using Design Expert 7.6 (spinach based combinations).
Input parameter Output parameter
Corn Rice DFSF SPI Spinach Protein Fat CHO Energy kcal
44.38 35.59 10.02 5.00 5.00 14.77 2.15 68.20 351.31
30.00 30.00 20.00 5.00 14.98 17.69 1.80 58.43 320.72
30.00 45.30 10.00 9.67 5.00 18.04 1.69 66.27 352.49
36.33 32.72 10.79 5.15 15.00 14.38 1.93 61.21 319.79
30.24 30.00 16.72 8.29 14.73 19.13 1.98 57.32 323.69
37.74 42.25 10.00 5.00 5.00 14.48 2.16 69.00 353.41
38.50 35.20 13.49 5.00 7.80 15.65 2.21 65.42 344.22
39.97 30.00 10.00 9.99 10.01 18.36 2.21 61.05 337.66
30.00 47.29 10.00 5.00 7.69 13.89 1.92 67.90 344.54
32.77 33.84 13.99 7.63 11.74 17.61 2.03 60.87 332.30
30.00 38.45 15.06 5.00 11.47 15.75 1.96 63.04 332.90
45.08 30.00 10.00 5.00 9.90 14.43 2.3 64.43 337.04
36.61 30.00 15.79 7.89 9.69 18.81 2.11 61.04 338.47
39.97 30.00 10.00 9.99 10.01 18.36 2.17 61.05 337.23
49.13 30.00 10.00 5.85 5.00 15.34 2.46 66.97 351.42
32.00 32.60 20.00 9.99 5.39 22.05 1.98 61.51 352.15
36.33 32.72 10.79 5.15 15.00 14.04 2.09 61.21 319.89
30.00 45.30 10.00 9.67 5.00 17.69 1.85 66.27 352.58
30.00 45.76 14.21 5.00 5.00 15.51 1.90 68.25 352.16
30.33 34.51 10.15 9.99 15.00 17.56 1.88 58.40 320.81
32.70 40.86 10.00 7.31 9.11 15.66 1.87 64.70 338.32
45.08 30.00 10.00 5.00 9.90 14.23 2.26 64.43 335.06
34.58 32.94 20.00 6.73 5.73 19.44 1.99 63.50 349.73
45.04 30.00 14.95 5.00 5.00 16.45 2.28 66.16 351.09
32.00 32.60 20.00 9.99 5.39 22.06 1.90 61.51 351.44Table 7: ANOVA for Linear Mixture Model (DW).
Response 1 Protein
Mixture Component Coding is L_Pseudo
Source Squares Df Square F-Value Prob> F
Model 111.8898 4 27.97245 5392.277 < 0.0001***
Linear Mixture 111.8898 4 27.97245 5392.277 < 0.0001***
Residual 0.10375 20 0.005188
Lack of Fit 0.07965 15 0.00531 1.10166 0.4983
Pure Error 0.0241 5 0.00482
Cor Total 111.9935 24

How to cite this article: Mangaraj S, Sachidananda S, Deshpande S. Development of Extruded Functional Snack Foods from Plants and Dairy Ingredients Employing Response Surface Methodology. Dairy and Vet Sci J. 2018; 7(4): 555717. DOI: 10.19080/JDVS.2018.07.555717.
007
Journal of Dairy & Veterinary Sciences
*** Significant at 1% level
Table 8: ANOVA for Linear Mixture Model on protein content (Mango).
ANOVA for Linear Mixture Model
*** Mixture Component Coding is L_Pseudo. ***
Analysis of variance table [Partial sum of squares - Type III]
Sum of Mean F p-value
Source Squares Df Square Value Prob> F
Model 112.3298 4 28.08244 682.0435 < 0.0001 Significant
Linear Mixture 112.3298 4 28.08244 682.0435 < 0.0001
Residual 0.823479 20 0.041174
Lack of Fit 0.501625 15 0.033442 0.519517 0.8504 not significant
Pure Error 0.321854 5 0.064371
Cor. Total 113.1532 24
Table 9: ANOVA for Linear Mixture Model on protein content (Spinach).
*** Mixture Component Coding is L_Pseudo. ***
Analysis of variance table [Partial sum of squares - Type III]
Sum of Mean F p-value
Source Squares Df Square Value Prob> F
Model 131.6551 4 32.91377 1535.909 < 0.0001 Significant
Linear Mixture 131.6551 4 32.91377 1535.909 < 0.0001
Residual 0.42859 20 0.02143
Lack of Fit 0.292059 15 0.019471 0.713043 0.7210 not significant
R2
Pure Error 0.136532 5 0.027306
Cor Total 132.0837 24
Figure 4: Effect of rice, DFSF and corn on protein content of extruded product.
How to cite this article: Mangaraj S, Sachidananda S, Deshpande S. Development of Extruded Functional Snack Foods from Plants and Dairy Ingredients Employing Response Surface Methodology. Dairy and Vet Sci J. 2018; 7(4): 555717. DOI: 10.19080/JDVS.2018.07.555717.
008
Journal of Dairy & Veterinary Sciences
Final Equation in Terms of Actual Components:
Protein= 0.104533* Corn+0.064893* Rice+0.472722* DFSF+0.903641* SPI+0.174343*Dairy whiteners. (4) for DW.
Protein =0.14925 * Corn+0.089042* Rice+0.49009 * DFSF+0.87187 * SPI +0.02722 * Fruits (5) for mango.
Protein= 0.089208* Corn+0.049002* Rice+0.446145*DFSF+0.86918* SPI+0.009491* Vegetable (6) for spinach.
Model graph (Figure 4) shows the response plot of rice, DFSF and corn on protein content by taking a constant amount of SPI (7.12) and dairy whitener (12.12). As DFSF and SPI were the main contributor of protein, it is revealed from the graph (1, a) that with the increase in DFSF, protein content increased being maximum (24.5%) at 20% of DFSF for DW based product. Similar behavior was also found for mango and spinach-based products. The result agrees with the report by Jha and Prasad & Sudha et al. [20,21] who revealed that inclusion of soy flour and whey protein concen-trate in instant vermicelli not only enhanced their protein content and in vitro protein digestibility but also reduced the fat uptake in noodles. As SPI and DFSF are the main source of protein in the
product, as described above, high protein content of the products is also reflected in respective regression coefficients [SPI (>0.85) and DFSF (>0.45)] (eq. 4-6). It was found that protein content was maximum at 31 and 34 % of rice and corn flour after which it de-creased (as per table, but not revealed in graphs).
Fat Content
Fat content varied from 2.7 to 3.1% for DW, 1.3 to 2.1 % for mango and 1.6 to 2.4% for spinach based extruded product. There were little variations in fat content because the entire ingredient had lower amount of fat. Using student’s t-test, it was found that mean value of products was statistically significant (P<0.001, tstat=11.21). Similar behaviors were also found for mango and spin-ach-based products. The model was adjusted for fat content in this mixture design are presented in ANOVA (Tables 10-12) revealed that all models were significant (P<0.001) with high R² (>0.82). The non-significant (0.27) F-value (1.75) of the lack fit indicated the model is adequate for describing the independent parameters for fat content with better accuracy. The regression equation de-scribing the effect of the process variables on the fat content of product in terms of actual level of the variables are given as:
Table 10: ANOVA for Linear Mixture Model on fat content (DW).
Response1 Protein
Mixture Component Coding is L_Pseudo
Source Squares Df Square Value Prob> F
Model 3.876466 4 0.969117 94.25765 < 0.0001***
Linear Mixture 3.876466 4 0.969117 94.25765 < 0.0001***
Residual 0.205631 20 0.010282
Lack of Fit 0.172781 15 0.011519 1.753236 0.2783
R2 0.9464
Pure Error 0.03285 5 0.00657
Cor Total 4.082097 24
Table 11: ANOVA for Linear Mixture Model on fat (mango).
ANOVA for Linear Mixture Model
*** Mixture Component Coding is L_Pseudo. ***
Analysis of variance table [Partial sum of squares - Type III]
Sum of Mean F p-value
Source Squares df Square Value Prob> F
Model 1.408263 4 0.352066 22.82692 < 0.0001 Significant
Linear Mixture 1.408263 4 0.352066 22.82692 < 0.0001
Residual 0.308466 20 0.015423
Lack of Fit 0.219779 15 0.014652 0.826046 0.6487 not significant
Pure Error 0.088687 5 0.017737
Cor Total 1.716729 24
How to cite this article: Mangaraj S, Sachidananda S, Deshpande S. Development of Extruded Functional Snack Foods from Plants and Dairy Ingredients Employing Response Surface Methodology. Dairy and Vet Sci J. 2018; 7(4): 555717. DOI: 10.19080/JDVS.2018.07.555717.
009
Journal of Dairy & Veterinary Sciences
Table 12: ANOVA for Linear Mixture Model on fat content (spinach).
Response 3 Fat
ANOVA for Linear Mixture Model
*** Mixture Component Coding is L_Pseudo. ***
Analysis of variance table [Partial sum of squares - Type III]
Sum of Mean F p-value
Source Squares Df Square Value Prob> F
Model 0.740237 4 0.185059 27.35852 < 0.0001 Significant
Linear Mixture 0.740237 4 0.185059 27.35852 < 0.0001
Residual 0.135284 20 0.006764
Lack of Fit 0.095863 15 0.006391 0.810596 0.6583 not significant
Pure Error 0.039421 5 0.007884
Cor Total 0.875521 24
Final equation in terms of actual components:
Fat=0.029013* Corn-0.01306* Rice-0.01349 * DFSF-0.00466* SPI+0.206028* Dairy whiteners. (7) for DW
Fat=0.041727* Corn+0.007691* Rice+0.001702DFSF-0.00603* SPI-0.00622*Fruits (8) for mango
Fat=0.039179* Corn+0.008926* Rice+0.012931*DFSF+0.007637* SPI+0.011969* Vegetable (9) for spinach
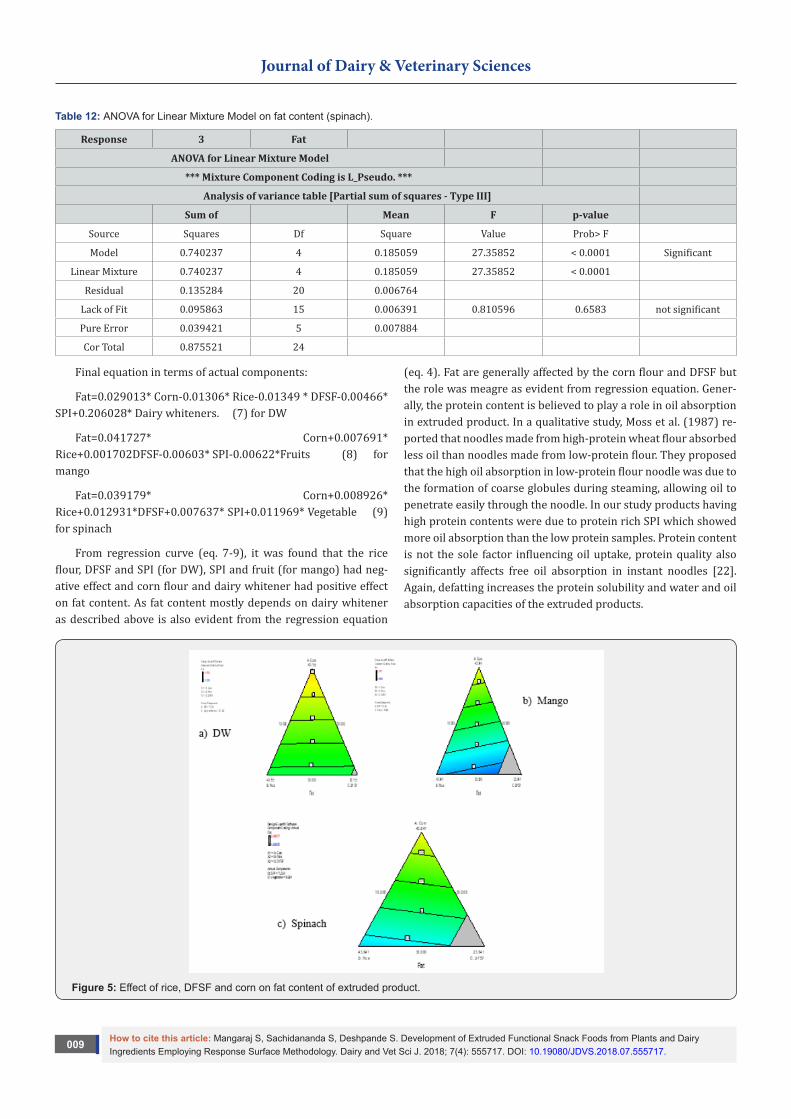
From regression curve (eq. 7-9), it was found that the rice flour, DFSF and SPI (for DW), SPI and fruit (for mango) had neg-ative effect and corn flour and dairy whitener had positive effect on fat content. As fat content mostly depends on dairy whitener as described above is also evident from the regression equation
(eq. 4). Fat are generally affected by the corn flour and DFSF but the role was meagre as evident from regression equation. Gener-ally, the protein content is believed to play a role in oil absorption in extruded product. In a qualitative study, Moss et al. (1987) re-ported that noodles made from high-protein wheat flour absorbed less oil than noodles made from low-protein flour. They proposed that the high oil absorption in low-protein flour noodle was due to the formation of coarse globules during steaming, allowing oil to penetrate easily through the noodle. In our study products having high protein contents were due to protein rich SPI which showed more oil absorption than the low protein samples. Protein content is not the sole factor influencing oil uptake, protein quality also significantly affects free oil absorption in instant noodles [22]. Again, defatting increases the protein solubility and water and oil absorption capacities of the extruded products.
Figure 5: Effect of rice, DFSF and corn on fat content of extruded product.
How to cite this article: Mangaraj S, Sachidananda S, Deshpande S. Development of Extruded Functional Snack Foods from Plants and Dairy Ingredients Employing Response Surface Methodology. Dairy and Vet Sci J. 2018; 7(4): 555717. DOI: 10.19080/JDVS.2018.07.555717.
0010
Journal of Dairy & Veterinary Sciences
The capacity of protein to absorb water and oil is determined by its polar and non-polar amino acids composition, respectively [23]. At high moisture content, the viscosity of the starch would be low, allowing for extensive internal mixing and uniform heat-ing which, in turn, would account for enhanced starch gelatiniza-tion; it also may lead to increased water absorption causing high fat absorption also. The high mechanical shear caused breakdown of macromolecules to small molecules with higher solubility. It is clear from the response surface (Figure 5) that oil content in rice, corn and DFSF simultaneously increased the fat content in the products and the extent was more than the individual effects, indicating a synergy. This agrees with the report by Murthy. While elasticity may be critical for finished product qualities, it causes issues in industrial production of dough products, where large heaps of doughs are shaped into thin sheets using sheeting rolls. Increasing the ratio of starch to protein leads to formation of a continuous starch matrix that enables water vapour to expand because starch melt viscosity is lower than protein melt viscosi-ty [24-26]. During moisture removal process, the spaces of water
vapour may filled by fat globules causing more fat content in ex-truded products.
Energy Content
The energy content of the products ranged from 356 to 365 kcal/100g for DW, 340 to 372 kcal/100g for mango and 319 and 353 kcal/100g for the extruded product. Using student’st-test, it was found that mean energy content of products using DW and mango were statistically non-significant (P<0.61, tstat= 0.5) while the same was significant using DW and spinach(P<0.001, tstat= 8.36) and spinach and mango (P<0.001, tstat= 6.25).This indicated that mango could be used as energy replacer for DW with reduced cost of final product as the unit cost of DW is much higher than mango. For all the mixtures whatever the level, energy content was significant (<0.001) as shown in (Tables 13-15) with high co-efficient of determination R² (>0.92). The non-significant (P>0.22) indicated good accuracy of chosen model. The regression equation describing the effect of the process variables on energy content in terms of actual level of the variables are given as:
Table 13: ANOVA for Linear Mixture Model on energy content (DW).
Response1 Protein
Mixture Component Coding is L_Pseudo
Source Squares Df Square Value Prob> F
Model 180.0435 4 45.01088 78.34945 < 0.0001
Linear Mixture 180.0435 4 45.01088 78.34945 < 0.0001***
Residual 11.48977 20 0.574489
Lack of Fit 9.876124 15 0.658408 2.040121 0.2214
Pure Error 1.61365 5 0.32273
Cor Total 191.5333 24
*** Significant at 1% level
Table 14: ANOVA for Linear Mixture Model on energy content (mango).
Response 2 Calorie
ANOVA for Linear Mixture Model
*** Mixture Component Coding is L_Pseudo. ***
Analysis of variance table [Partial sum of squares - Type III]
Sum of Mean F p-value
Source Squares Df Square Value Prob> F
Model 2216.672 4 554.1679 60.97904 < 0.0001 Significant
Linear Mixture 2216.672 4 554.1679 60.97904 < 0.0001
Residual 181.7569 20 9.087843
Lack of Fit 143.6609 15 9.577392 1.257008 0.4305 not significant
Pure Error 38.09598 5 7.619195
Cor Total 2398.429 24

How to cite this article: Mangaraj S, Sachidananda S, Deshpande S. Development of Extruded Functional Snack Foods from Plants and Dairy Ingredients Employing Response Surface Methodology. Dairy and Vet Sci J. 2018; 7(4): 555717. DOI: 10.19080/JDVS.2018.07.555717.
0011
Journal of Dairy & Veterinary Sciences
Table 15: ANOVA for Linear Mixture Model on energy content.
ANOVA for Linear Mixture Model
*** Mixture Component Coding is L_Pseudo. ***
Analysis of variance table [Partial sum of squares - Type III]
Sum of Mean F p-value
Source Squares Df Square Value Prob> F
Model 3399.636 4 849.9089 1107.479 < 0.0001 Significant
Linear Mixture 3399.636 4 849.9089 1107.479 < 0.0001
Residual 15.34853 20 0.767427
Lack of Fit 13.03031 15 0.868688 1.873612 0.2523 not significant
Pure Error 2.318217 5 0.463643
Cor Total 3414.984 24
Final equation in terms of actual components:
Energy =3.455244* Corn+3.398012* Rice+3.433454 * DFSF+3.700634* SPI+4.767625* Dairy whiteners (10) for DW
Energy=3.846363* Corn+3.693403* Rice+4.073597* DFSF+3.817815* SPI+1.168505* Fruits (11) for mango
Energy=3.637284* Corn+3.684187* Rice+3.716799* DFSF+3.825296* SPI+0.541524* Vegetable (12) for spinach
From the regression equation (7), regression coefficient is
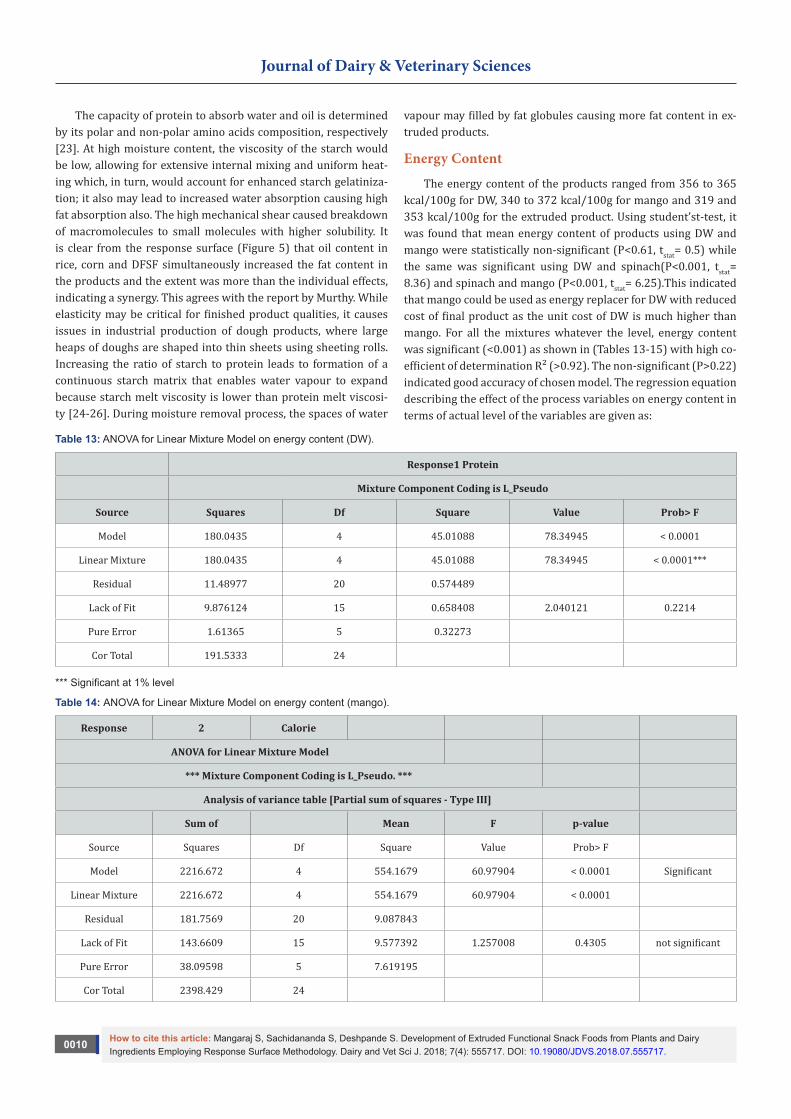
highest for DW (4.767) indicating its larger effect on energy con-tent of the DW which is also corroborated to its high fat content. However, mango-based products; DFSF (4.073) had more effect on energy value rather than mango. While for spinach-based product, except spinach all variable ad almost equal importance for energy value of the products (regression coefficient: 3.63-3.82). From the response plot (Figure 6), it may be seen that energy content was highest at 30, 34 and 11.42% of corn flour, rice flour and DFSF beyond which the value decreased.
Figure 6: Effect of rice, DFSF and corn on fat content of extruded product.

How to cite this article: Mangaraj S, Sachidananda S, Deshpande S. Development of Extruded Functional Snack Foods from Plants and Dairy Ingredients Employing Response Surface Methodology. Dairy and Vet Sci J. 2018; 7(4): 555717. DOI: 10.19080/JDVS.2018.07.555717.
0012
Journal of Dairy & Veterinary Sciences
Carbohydrate
Generally, carbohydrate content depends on corn flour and rice flour where its value ranged between 59.95 and 66.59% for DW, 59.92 and 69.50% for mango, and57.32and 69.00% for spin-ach-based products. Using student’s t-test, it was found that mean carbohydrate content of all products was statistically non-signif-icant (P<0.19, tstat= 1.3). Carbohydrate contents of the products were highly affected by corn flour and rice flour because corn rice was major source of carbohydrate. To fit the response, quadrat-
ic model for mango and linear model for DW and spinach-based products are well represented as shown in ANOVA (Tables 16-18). The model was significant (p<0.001) with highest coefficient of determination (R2>0.99) of all the dependent parameters. From Table 16, it is observed that the interaction of corn*rice, corn*S-PI, rice* DFSF, rice*SPI, DFSF*SPI and SPI*spinach are significant (P<0.05). The regression equation describing the effect of the pro-cess variables on the carbohydrate content of product in terms of actual level of the variables are given as:
Table 16: ANOVA for Linear Mixture Model on carbohydrate content.
Response 4 Carbohydrate
ANOVA for Quadratic Mixture Model
*** Mixture Component Coding is L_Pseudo. ***
Analysis of variance table [Partial sum of squares - Type III]
Sum of Mean F p-value
Source Squares Df Square Value Prob> F
Model 192.9912 14 13.78508 50.95376 < 0.0001 Significant
Linear Mixture 180.2058 4 45.05146 166.5236 < 0.0001
Corn*Rice 2.074498 1 2.074498 7.667959 0.0198
Corn*DFSF 0.477679 1 0.477679 1.765642 0.2134
Corn*SPI 2.721585 1 2.721585 10.05979 0.0100
Corn*spinach 0.704806 1 0.704806 2.605173 0.1376
Rice* DFSF 1.496217 1 1.496217 5.530461 0.0405
Rice*SPI 2.952919 1 2.952919 10.91487 0.0080
Rice*spinach 0.000447 1 0.000447 0.001651 0.9684
DFSF*SPI 1.818544 1 1.818544 6.721879 0.0268
DFSF*spinach 0.124259 1 0.124259 0.459299 0.5133
SPI*spinach 3.703789 1 3.703789 13.6903 0.0041
Residual 2.70541 10 0.270541
Lack of Fit 1.202254 5 0.240451 0.79982 0.5938 not significant
Pure Error 1.503156 5 0.300631
Cor Total 195.6966 24
Table 17: ANOVA for Linear Mixture Model on carbohydrate content.
*** Mixture Component Coding is L_Pseudo. ***
Analysis of variance table [Partial sum of squares - Type III]
Sum of Mean F p-value
Source Squares Df Square Value Prob> F
Model 95.2794 4 23.81985 63660000 < 0.0001 significant
Linear Mixture 95.2794 4 23.81985 63660000 < 0.0001
Residual 0 20 0
Lack of Fit 0 15 0
Pure Error 0 5 0
Cor Total 95.2794 24

How to cite this article: Mangaraj S, Sachidananda S, Deshpande S. Development of Extruded Functional Snack Foods from Plants and Dairy Ingredients Employing Response Surface Methodology. Dairy and Vet Sci J. 2018; 7(4): 555717. DOI: 10.19080/JDVS.2018.07.555717.
0013
Journal of Dairy & Veterinary Sciences
Table 18: ANOva for Linear Mixture Model on carbohydrate content.
Response 4 Carbohydrate
ANOVA for Linear Mixture Model
*** Mixture Component Coding is L_Pseudo. ***
Analysis of variance table [Partial sum of squares - Type III]
Sum of Mean F p-value
Source Squares Df Square Value Prob> F
Model 268.912 4 67.228 63660000 < 0.0001 Significant
Linear Mixture 268.912 4 67.228 63660000 < 0.0001
Residual 0 20 0
Lack of Fit 0 15 0
Pure Error 0 5 0
Cor Total 268.912 24
Final equation in terms of actual components:
Carbohydrate=0.694* Corn+0.814 * Rice+0.416DFSF+0.032* SPI+0.554* Dairy whiteners (13) for DW
Final Equation in Terms of Actual Components:
Carbohydrate=0.56164* Corn+0.352119* Rice-0.9141*DFS-F+16.50373Fruits+0.015566* Corn * Rice+0.018329* Corn * DFSF-0.1889* Corn * SPI-0.02553* Corn * Fruits+0.032215* Rice *
DFSF-0.1944* Rice * SPI+0.000582 * Rice * Fruits-0.15248* DFSF * SPI-0.01602* DFSF * Fruits-0.22741* SPI * Fruits
(14) for mango
Final Equation in Terms of Actual Components:
Carbohydrate= 0.73196*Corn+0.85196*Rice+0.45396*DFS-F+0.06996*SPI+0.09896* Vegetable (15) for spinach
Figure 7: Effect of rice, DFSF and corn on carbohydrate content of extruded product.

How to cite this article: Mangaraj S, Sachidananda S, Deshpande S. Development of Extruded Functional Snack Foods from Plants and Dairy Ingredients Employing Response Surface Methodology. Dairy and Vet Sci J. 2018; 7(4): 555717. DOI: 10.19080/JDVS.2018.07.555717.
0014
Journal of Dairy & Veterinary Sciences
From eq. 13, the regression coefficients of interaction terms corn * SPI, corn * fruits, rice * SPI, DFSF * fruits and SPI * fruits are negative suggested that increase and decrease of these process pa-rameters resulted in decrease and increase of carbohydrate con-tent .it is found that From the response surface graph (Figure 7), it may be seen that increase in corn flour and rice flour enhanced the carbohydrate content, being maximum at 41.8, 31.6 and 10.0 % of corn flour, rice flour and DFSF keeping a constant amount of DFSF and SPI at 12.122 and 7.12 % level indicating minimum car-bohydrate content with the combined increase of above variables. The reason may be due to high degree of starch gelatinisation at pre-setted machine parameters beyond which larger fragments of fibre molecules from starch of this flour may be sheared off during extrusion [27] and the fragments could unite to form large insolu-
ble complexes or Maillard compounds generally termed as lignin causing lesser availability of carbohydrate compounds. A similar behaviour was also found for mango and spinach-based products.
Specific Case of Most Acceptable Combinations of Extruded Products
Soy fortified function extruded products were developed us-ing rice flour, corn flour, DFSF, fruit powder, vegetable powder, SPI and dairy whiteners with optimum combination using response surface modeling. Many combinations of the developed products were found acceptable to the consumers; however, some most acceptable combinations from the above ingredients (Table 19) were taken for further analysis and storage study. Addition of 10% moisture was found optimum.
Table 19: Some most acceptable combination of extruded products.
Trial No Combinations of raw materials Ratio Sample
1. Corn: Rice: DFSF: DW: SPI 35: 35:15:10:5 S-1
2. Corn: Rice: DFSF: Carrot: SPI 40: 30:15:10:5 S-2
3. Corn: Rice: DFSF: Spinach: SPI 35: 40:10:10:5 S-3
4. Corn: Rice: DFSF: Mango: SPI 38: 32:15:10:5 S-4
5. Control: Corn: Rice 50:50 C
Nutritive Value of Soy Extruded Snacks based on Chemical Composition
The snacks prepared with different levels of soybean was analyzed for protein, fat, carbohydrates, moisture content, Ash content, and energy values (Table 20).
Table 20: Nutritive values of accepted extruded snack products.
Trial No. Protein (%) Fat (%) MC (%), db Ash (%) Carbohydrate (%) Energy (kcal)
S-1 19.95 7.15 1.8 5.5 61.12 432.18
S-2 18.05 5.32 1.9 6.5 63.22 418.05
S-3 16.45 8.40 1.8 4.5 61.95 451.57
S-4 19.25 4.69 2.1 5 64.29 414.90
Control 10.85 6.55 2.1 4 70.05 440.60
Protein
The observation in respect to protein content of soy extrud-ed snacks is tabulated and graphically represented Fig. 8. It is revealed that, there was increase in protein level by addition the DFSF and SPI level in snacks. Soy powder blended extruded snacks recorded maximum protein 19.95 percent in S-1 sample and min-imum protein of 10.85 per cent in control sample.
Fat
The observation in respect to fat content of extruded soy-snacks is presented in Table 20. It is evident that there was in-crease in fat level by oil frying in snacks. Soy fortified snacks re-corded maximum 8% in S-3 sample and 6.55 % in control sample.
Carbohydrates
The observation in respect to carbohydrate content of extrud-ed snacks is presented in Table 20. It is evident that there was de-crease in carbohydrate level by increasing the DFSF and SPI level in snacks. The soy fortified snacks recorded minimum 61.12 % in S-1 sample and maximum carbohydrate of 70.05% in control sample. Increased in the carbohydrate was found in S-2 and S-4 sample by adding DFSF and SPI.
Energy value
The data pertaining to energy value content of extruded soy-snacks are presented in the Table 20. It is observed that there was increase in energy value by increasing the soy flour level in snacks. Soy powder blended snacks recorded maximum 451.18 Kcal in

How to cite this article: Mangaraj S, Sachidananda S, Deshpande S. Development of Extruded Functional Snack Foods from Plants and Dairy Ingredients Employing Response Surface Methodology. Dairy and Vet Sci J. 2018; 7(4): 555717. DOI: 10.19080/JDVS.2018.07.555717.
0015
Journal of Dairy & Veterinary Sciences
S-3 sample and minimum energy of 414.9 Kcal in S-4 sample. In-creased in the calorie by adding the DFSF and SPI were found in the samples.
Moisture content
From Table 20, It is evident that the moisture content ranges of the samples are varied between 1.8 to 2.1%. Moisture content of product is affected by ingredients.
Ash Content
From Table 20, it is revealed that as the quantity of DFSF add-ed, ash content also was increased. Ash content recorded maxi-mum 6.5% in S-2 sample and minimum 4 % in control sample. The graphical representation of protein, fat, carbohydrate content, energy-value, moisture-content and ash content of different treat-ments are represented in Figures 8-12.
Figure 8: Protein content of extruded soy-snacks.
Figure 9: Carbohydrate content of extruded soy-snacks.
Figure 10: Energy/Calorie value of extruded soy-snacks.

How to cite this article: Mangaraj S, Sachidananda S, Deshpande S. Development of Extruded Functional Snack Foods from Plants and Dairy Ingredients Employing Response Surface Methodology. Dairy and Vet Sci J. 2018; 7(4): 555717. DOI: 10.19080/JDVS.2018.07.555717.
0016
Journal of Dairy & Veterinary Sciences
Figure 11: Moisture content of extruded soy-snacks.
Figure 12: Ash content of extruded soy-snacks. Sensory evaluation of extruded snacks foods.
Sensory Evaluation of Extruded Snacks FoodsTable 21: Mean score for different characteristics of extruded snack products.
CharactersCombinations,
Control S-1 S-2 S-3 S-4
Taste 7.0±05 6.9±0.5 7.0±0.98 6.7±0.71 6.7±0.5
Texture 7.4±0.69 7.2±0.69 7.1±0.98 7.3±1.14 6.9±0.57
Flavour 7.1±0.41 6.8±0.26 6.7±0.57 6.5±1.1 6.4±0.57
Colour 6.9±0.14 7.0±0.98 6.4±0.12 6.8±1.41 6.9±0.57
Appearance 7.1±05 6.9±.07 6.8±1.64 6.6±0.63 6.5±0.85
Overall acceptability 7.1±0.69 7.0±0.88 6.8±.03 6.7±1.71 6.5±1.06
After seasoning coating the snack with roasted in different flavors, the snack samples were subjected to sensory evaluation. The samples of extruded soy-snacks were evaluated by using the standard scorecard. The assessment was done by studying the characters like color, flavor, taste and overall acceptability. Results revealed that with increase in the level of DFSF and SPI there is variation in sensory score related to colour, flavour, taste, texture/
mouth feel and overall acceptability [28-30]. Amongst various lev-els of DFSF, and SPI used in blend for the preparation of snacks, the highest overall score obtained was 7.0 for snacks prepared with the level of 10 per cent DFSF and 5 per cent SPI (S-1). The results show that the utilization of soy powder at 10 % DFSF and 5 % SPI level reported maximum scores with respect to all sensory characters (Table 21). The substitution of all soy protein sources
How to cite this article: Mangaraj S, Sachidananda S, Deshpande S. Development of Extruded Functional Snack Foods from Plants and Dairy Ingredients Employing Response Surface Methodology. Dairy and Vet Sci J. 2018; 7(4): 555717. DOI: 10.19080/JDVS.2018.07.555717.
0017
Journal of Dairy & Veterinary Sciences
in snacks gave significant difference (P≤0.05) in terms of gener-al appearance suitability of colour and overall acceptability from control formula. On the other hand, there were no significance difference (P≤0.05) among control sample and DFSF, and SPI for-mulas in terms of texture/ mouth feel, respectively. The general appearance of soy protein enriched extruded snacks showed no significant difference (P ≤ 0.05) among snacks with any soy pro-tein source.
Textural Properties Analysis of Extruded Snack Products
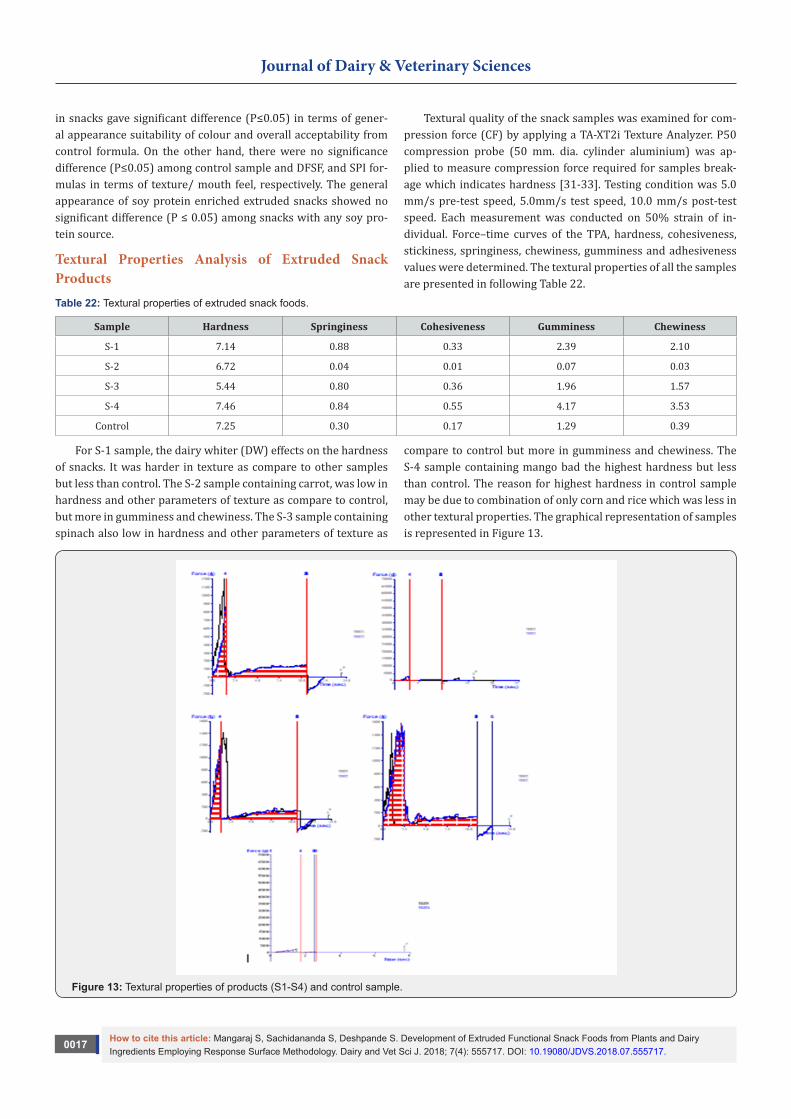
Textural quality of the snack samples was examined for com-pression force (CF) by applying a TA-XT2i Texture Analyzer. P50 compression probe (50 mm. dia. cylinder aluminium) was ap-plied to measure compression force required for samples break-age which indicates hardness [31-33]. Testing condition was 5.0 mm/s pre-test speed, 5.0mm/s test speed, 10.0 mm/s post-test speed. Each measurement was conducted on 50% strain of in-dividual. Force–time curves of the TPA, hardness, cohesiveness, stickiness, springiness, chewiness, gumminess and adhesiveness values were determined. The textural properties of all the samples are presented in following Table 22.
Table 22: Textural properties of extruded snack foods.
Sample Hardness Springiness Cohesiveness Gumminess Chewiness
S-1 7.14 0.88 0.33 2.39 2.10
S-2 6.72 0.04 0.01 0.07 0.03
S-3 5.44 0.80 0.36 1.96 1.57
S-4 7.46 0.84 0.55 4.17 3.53
Control 7.25 0.30 0.17 1.29 0.39
For S-1 sample, the dairy whiter (DW) effects on the hardness of snacks. It was harder in texture as compare to other samples but less than control. The S-2 sample containing carrot, was low in hardness and other parameters of texture as compare to control, but more in gumminess and chewiness. The S-3 sample containing spinach also low in hardness and other parameters of texture as
compare to control but more in gumminess and chewiness. The S-4 sample containing mango bad the highest hardness but less than control. The reason for highest hardness in control sample may be due to combination of only corn and rice which was less in other textural properties. The graphical representation of samples is represented in Figure 13.
Figure 13: Textural properties of products (S1-S4) and control sample.

How to cite this article: Mangaraj S, Sachidananda S, Deshpande S. Development of Extruded Functional Snack Foods from Plants and Dairy Ingredients Employing Response Surface Methodology. Dairy and Vet Sci J. 2018; 7(4): 555717. DOI: 10.19080/JDVS.2018.07.555717.
0018
Journal of Dairy & Veterinary Sciences
The developed extruded snack foods rich in protein (20% - 87% increase) and low in fat are good protein supplement for school children and others. The products were evaluated using sensory chart with a panel of judges and the panel liked the prod-uct very much in terms of its texture, color, crispiness, appearance and taste. The storage study inferred that all the samples were suitable after six months in various packaging system, however, packaging in PET/PET met/LDPE kept the product with superior quality followed by PET met/LDPE and LDPE in terms of moisture content, crispness and sensory data. The developed products were provided to 100 school children of different age (10-18 yrs) group of Bhopal and collected the response for knowing the acceptability level of the product. The products were rated as ‘very much liked’.
Conclusion
Extrusion-technology is gaining increasing popularity in the global agro-food processing industry, particularly in the food and feed sectors. In our study, starches and protein of different nature are co-extruded and the product parameters are influenced by synergetic effects. Such inexpensive, high energy value products may be valuable in feeding the hungry across the world as well as in promoting the health benefits of extruded foods. This study focuses to develop the process for production of nutritionally balanced formulated and functional snack foods which are successful in the market and meet the intended nutritional requirements and are also accessible to the vulnerable groups of the society at minimum possible cost. There was non-significant increase in moisture content and hardness of products during three month of storage. It was aimed to achieve this objective through use of abundantly available raw food ingredients having high nutrition such as cereals, soybean, dairy products and horticultural produce to minimize the cost and maximize nutrition.
References1. Mangaraj S, Kadam DM (2007) Design and scale up of food extruder:
Single screw. Processed Food Industry 10(11): 32-42.
2. Bhat R, Karim AA (2009) Exploring the nutritional potential of wild and underutilized legumes. Comp Rev Food Sci Food Safety 8:305-331.
3. Boye J, Zare F, Pletch A (2010) Pulse proteins: Processing, characterization, functional properties and applications in food and feed. Food Res Intl 43: 414- 431.
4. Mangaraj S, Tripathi MK, Ali N (2013) Hand Book of Nutraceuticals and Functional Food – Soybean as An Example. Satish Serial Publishing House, New Delhi, India, pp. 321.
5. Patil RT, Mangaraj S (2013) Processing Technology for Food Legumes. Satish Serial Publishing House, New Delhi, India, pp. 668.
6. Kadan RS, Bryant RJ, Pepperman AB (2003) Functional properties of extruded rice flours. J Food Sci 68: 1669-1672.
7. Giri SK, Mangaraj S (2012) Processing Influences on Composition and Quality Attributes of Soymilk and its Powder – A Review. Food Engg Rev 4(3): 149-164.
8. Giri SK, Mangaraj S (2014) Soymilk concentration by ultra-filtration: Effects of pore size and transmembrane pressure on filtration performance. Int J Food Sci Tech 49: 666-672.
9. Adesina AA, Sowhbagya CM, Bhattacharya S, Zakiuddin Ali S (1998)
Maize-soy-based ready-to-eat extruded snack food. J Food Sci Technol 35(1): 40-43.
10. Boonyasirikool P, Charunuch C (2010) Development of Corngrit-Broken Rice Based Snack Food by Extrusion Cooking. Kasetsart J Nat Sci 34: 279 – 288.
11. Harper JM (1981) Extrusion of Foods. Boca Raton, CRC Press, FL, USA, 1: 2.
12. Stojceska V, Ainsworth P, Plunkett A, Ibanoglu E, Ibanoglu S (2008) Cauliflower by-products as a new source of dietary fibre, antioxidants and proteins in cereal based ready-to-eat expanded snacks. J Food Eng 87: 554-563.
13. Altan A, McCarthy KL, Maskan M (2008) Evaluation of snack food from barley-tomato blends by extrusion processing. J Food Eng 84: 231-242.
14. Altan A, McCarthy KL, Maskan M (2008) Twin-screw extrusion of barley-grape pomace plends: Extrudate characteristics and determination of optimum processing conditions. J Food Eng 89: 24-32.
15. Upadhyay A (2008) thesis on Optimization of carrot pomace powder incorporation on extruded product quality by response surface methodology. Mahatma Gandhi Chitrakoot Gramoday Vishwavidyalys, Satna, Madhya Pradesh, India.
16. Upadhyay A, Sharma HK, Sarkar BC (2008) Characterization of dehydration kinetics of carrot pomace.
17. Khuri AI, Cornell JA (1987) Response Surfaces. Dekker, New York, USA.
18. Mangaraj S, Singh KP (2011) Optimisation of machine parameters for milling of pigeon pea using RSM. Food and Bioprocess Tech. An Int J 4: 762-769.
19. Mangaraj S, Singh KP (2011) Milling study of multiple pulses using CIAE dhal mill for optimal responses. J Food Proc Tech 2(2): 110-117.
20. Jha SK, Presad S (1997) Development of cereal-pulse based extruded food. J Agril Engng 34(1): 24-31.
21. Sudha ML, Rajeswari G, Rao GV (2011) Influence of defatted soyflour and whey protein concentrate on dough rheological characteristics and quality of instant vermicelli. J Texture Stud 42: 72–80.
22. Park CS, Baik BK (2004a) Cooking time of white salted noodles andits relationship with protein and amylose contents of wheat. Cereal Chem 81: 165–171.
23. Sathe SK, Salunkhe DK (1981) Functional properties of the great Northern bean proteins: emulsion, foaming, viscosity, and gelation properties. J Food Sci 46:71-81.
24. Devi NL, Shobha S, Tang X, Shaur SA, Dogan H, et al. (2013) Development of Protein-Rich Sorghum-Based Expanded Snacks Using Extrusion Technology. Int J Food Prop 16: 263-276.
25. Pelembe LAM, Erasmus C, Taylor JRN (2002) Development of a Protein-Rich Composite Sorghum-Cowpea Instant Porridge by Extrusion Cooking Process. LWT, Food Sci Tech 35: 120-127.
26. Li S, Zhang HQ, Jin ZT, Hsieh F (2005) Textural Modification of Soya Bean/Corn Extrudates as Affected by Moisture Content, Screw Speed and Soya Bean Concentration. Int J Food Sci Tech 40: 731-741.
27. Leszek M, Zuilichem DJ (2011) Extrusion-Cooking and Related Techniques In: Extrusion-Cooking Techniques: Applications. Theory and Sustainability p. 1-24.
28. Kulkarni SD, Joshi KC, Venkatraj J, Venkatraghaven U (1997) Extrusion cooking of soy-cerealand other tuber blends: Product properties. J Food sci Technol 34(6): 509-512.
29. Messina M (2000) Soy foods and soybean phyto-estrogens (isoflavones) as possible alternatives to hormone replacement therapy (HRT). Eur J Cancer 36(4): 71-72.

How to cite this article: Mangaraj S, Sachidananda S, Deshpande S. Development of Extruded Functional Snack Foods from Plants and Dairy Ingredients Employing Response Surface Methodology. Dairy and Vet Sci J. 2018; 7(4): 555717. DOI: 10.19080/JDVS.2018.07.555717.
0019
Journal of Dairy & Veterinary Sciences
30. Moss R, Gore PJ, Murray IC (1987) The influence of ingredients and processing variables on the quality and microstructure of Hokien, Cantonese and instant noodles. Food Microstructure. 9:63-74.
31. Salcedo-Chávez B, Osuna-Castro JA, Guevara-Lara F, Domínguez-Domínguez J, Paredes-López O (2002) Optimization of the isoelectric precipitation method to obtain protein isolates from amaranth (Amaranthuscruentus) seeds. J Agric Food Chem 50: 6515-6520.
32. Shils ME, Olson JA, Shike M, Ross AC (2002) Nutriciónensalud y enfermedad, Volumen II 9 A edition, McGrawHill Inter Americana Editors, S.A. de C.V. México, USA, pp. 1103-133.
33. Van Hung P, Maeda T, Tsumori R, Morita N (2007) Characteristics of fractionated flours from whole buckwheat grain using a gradual milling system and their application for noodle making. J Sci Food Agric 87: 2823–2829.
Your next submission with Juniper Publishers will reach you the below assets
• Quality Editorial service• Swift Peer Review• Reprints availability• E-prints Service• Manuscript Podcast for convenient understanding• Global attainment for your research• Manuscript accessibility in different formats
( Pdf, E-pub, Full Text, Audio) • Unceasing customer service
Track the below URL for one-step submission https://juniperpublishers.com/online-submission.php
This work is licensed under CreativeCommons Attribution 4.0 LicenseDOI: 10.19080/JDVS.2018.07.555717