development of a reliable measure of - iase...
TRANSCRIPT

20
DEVELOPMENT OF A RELIABLE MEASURE OF STUDENTS’ INFERENTIAL REASONING ABILITY4
SHARON J. LANE-GETAZ
St. Olaf College [email protected]
ABSTRACT
This mixed-methods study reports psychometric properties of the 34-item Reasoning about P-values and Statistical Significance (RPASS) scale. RPASS is being designed as a research tool to assess effects of teaching methods on students’ inferential reasoning. During development (Phase I), two graphical scenarios and 12 items were added to the scale, field tested, and evaluated by three content raters. During Phase II, reliability and validity evidence were gathered in three college statistics courses. Score reliability was sufficient to conduct group research (= 0.76, n = 105). RPASS scores were correlated with college entrance scores and GPAs as evidence of construct-related validity. Further validity evidence was obtained by analyzing consistency between students’ reasoning and answers for eight items. Future development and research are discussed.
Keywords: Statistics education research; Assessment; Inference; p-values; Statistical significance
1. INTRODUCTION
1.1. UNDERSTANDING INFERENTIAL REASONING
Introductory statistics courses should emphasize the “conceptual meaning of ‘p-value,’ ‘confidence,’ and ‘statistical significance’” per leading statistics education professionals (Cobb, 1992, 2007; Moore, 1997) and the Guidelines for Assessment and Instruction in Statistics Education (GAISE; Aliaga, Cuff, Garfield, Lock, Utts, & Witmer, 2005). Students in virtually every discipline encounter p-values or confidence intervals when reading research articles in their fields. Statistical significance of a research result is typically assessed by a p-value or whether a confidence interval includes a specified null hypothesis or not. As one introductory student aptly summarized, “The p-value is a check to see if results are a fluke or not.”
Zieffler, Garfield, delMas, and Reading (2008) state that by the end of an introductory course, students who develop formal statistical inferential reasoning should be able to demonstrate an “understanding of a p-value as an indicator of how likely or surprising a sample result, or a result more extreme, is under a certain hypothesis, and the action of rejecting this hypothesis if the p-value is small enough” (p. 45). Students who develop informal inferential reasoning should be able to “use their informal statistical knowledge to make arguments to support inferences about unknown populations based on observed samples” (p. 44).
Despite their common use, p-values, tests of statistical significance, and confidence intervals are often misinterpreted and misunderstood by students, and some authors and researchers as well (see Carver, 1978, 1993; Cohen, 1994; Kline, 2004; Nickerson, 2000; Vallecillos, 1999). The research literature offers considerable empirical data supporting claims that misunderstandings of inference are common and persistent (Sotos, Vanhoof, Noortgate, & Onghena, 2007; Lane-Getaz, 2007a). However, these studies do not employ a reliable, valid measure to assess what students do or do not know; there is no single instrument used across these studies to measure the various difficulties cited in the literature (Sotos et al.; Lane-Getaz).
Statistics Education Research Journal, 12(1), 20-47, http://iase-web.org/Publications.php?p=SERJ International Association for Statistical Education (IASE/ISI), May, 2013

21
1.2. ASSESSING INFERENTIAL REASONING A reliable and valid measure is needed to assess the effectiveness of teaching methods on the
development of students’ inferential reasoning. The Reasoning about P-values and Statistical Significance (RPASS) scale is being developed to be just such a tool (Lane-Getaz, 2007b). Unlike the Comprehensive Assessment of Outcomes in Statistics (CAOS; delMas, Garfield, Ooms, & Chance, 2007; Zieffler, Garfield, delMas & Bjornsdottir, 2010), the Statistical Reasoning Assessment (SRA; Garfield, 2003), or Statistics Concepts Inventory (SCI; Allen, Stone, Rhoads, & Murphy, 2004) which measure a broad array of introductory statstics concepts, the RPASS is specifically focused on students’ inferential reasoning (Lane-Getaz, 2007a). The Assessment Resource Tools for Improving Statistical Thinking (ARTIST) Test of Significance topic scale measures some of the same content as RPASS but no reliability evidence has been reported (delMas, Ooms, Garfield, & Chance, 2006).
1.3. RESEARCH QUESTIONS
This study develops and provides validity evidence for version 7 of the RPASS scale. To use
RPASS-7 to conduct research, sufficient reliability and validity evidence must be established for results to be transportable across studies (see Schaeffer & Smith, 2007). Graphical scenarios and associated items were developed and added to items from the previous version of the scale, RPASS-6 (Lane-Getaz, 2008), to broaden content coverage and improve reliability. Adding these new items and scenarios motivated two important research questions:
1. To what extent do the new items and graphical scenarios improve the psychometric properties (reliability and validity) of the RPASS-7?
2. To what extent do RPASS-7 scores differentiate course outcomes in this study?
2. METHODS
This mixed-methods study unfolded in two phases. Phase I included the development, field test, and expert review of RPASS-7 content. Phase II administered RPASS-7 in three college courses to evaluate score reliability and validity of inferences. This project received Institutional Review Board approval as an exempt project (IRB #0809-01-0910). 2.1. PHASE I METHODS: DEVELOPMENT, FIELD TEST, & EXPERT REVIEW
Subjects and setting In fall 2008 twenty-six students in a second statistics course at a small liberal
arts college were invited to pilot two new graphic scenarios and eight associated RPASS items. Three statistics education professionals were asked to provide evidence of content–related validity for this 33-item version of RPASS during winter, 2008-2009. The statistics education experts were statistics professors from the University of California at Los Angeles, Meredith College, and Cal Poly-San Luis Obispo.
Instrument development procedure RPASS is designed to measure the effects of different
teaching methods on respondents’ inferential reasoning. RPASS items include correct conceptions and misconceptions about p-values and statistical significance as culled from the research literature (Lane-Getaz, 2007a, 2007b). Initially, RPASS had low reliability (27-item RPASS-4, = 0.46, n = 224). Items with weak correlations with the RPASS total score were removed and seven items that correlated with existing item responses were added from the ARTIST Test of Significance topic scale (delMas et al., 2006; see https://apps3.cehd.umn.edu/artist/ ). The resulting 23-item RPASS-6 had improved reliability ( = 0.57, n = 177; Lane-Getaz, 2008). For this study, one weakly correlating item was removed and 14 new items, inluding two new graphical scenarios, were added to create RPASS-7. In Table 1 the RPASS Content Blueprint summarizes the research literature undergirding RPASS-7 into four categories: Basic terminology and concepts; Relationships between inferential concepts; Logic of statistical inference; and Hypotheses, p-values, decisions, and error. Appendices A and B map specific items to the 19 content blueprint codes in Table 1. Appendix A also provides RPASS-7 item wording and learning objectives for the 25 items discussed in this paper.

22
Table 1. RPASS content blueprint: Categorizations of correct conceptions and misconceptions of p-values and statistical significance culled from research literature
Blueprint
codea Correct conceptions (C) or Misconceptions (M) Research literature
Basic terminology and concepts B-1 Demonstrating knowledge or confusion about basic
language and concepts of inference (C or M) Batanero, 2000; Carver, 1978; Williams 1999
B-2 Believing the p-value is always low (M) Williams, 1999 Relationships between inferential concepts
R-1 Confusing test statistics and p-values (M) Williams, 1999 R-2 Confusing samples and populations (M) Mittag & Thompson, 2000 R-3 Confusing α and Type I error rate or significance
level with the p-value (M) Haller & Krauss, 2002;
Hubbard & Bayari, 2003; Mittag & Thompson, 2000
R-4 Believing p-value is independent of sample size (M) Mittag & Thompson, 2000; Wilkerson & Olson, 1997
R-5b Believing reliability is 1 – p-value (M) Carver, 1978; Daniel, 1998
R-6c Recognizing significance testing and confidence interval equivalence for means (C)
Cumming & Finch, 2005
R-7c Confusing replications with sample size (M) Gould, 2008d Logic of statistical inference
L-1 Misusing the Boolean logic of contrapositive proof (a→b and not-b, then not-a) (deterministic) (M)
Batanero, 2000; Falk & Greenbaum, 1995; Oakes, 1986
L-2b Misusing the Boolean logic of the converse (a→b) replaced with b→a) (M)
Batanero, 2000; Falk, 1986
L-3 Misinterpreting the p-value as the probability chance caused the observed results; probability due to chance (M)
Carver, 1978, 1993; Daniel, 1998
L-4c Misinterpreting the scope of inference; not attending to the study design (M)
May & Hunter, 1993
L-5c Interpreting p-value as a conditional probability (C) Ancker, 2006; Falk, 1986 L-6c Checking necessary conditions for inference (C) Hahn & Meeker, 1993;
Nickerson, 2000 Hypotheses, p-values, decisions and error
H-1b Misinterpreting the p-value as the probability the alternative hypothesis is true (M)
Falk & Greenbaum, 1995; Oakes, 1986
H-2b Misinterpreting the p-value as the probability that accepting the alternative hypothesis is false (M)
Falk & Greenbaum, 1995; Haller & Krauss, 2002; Williams, 1999
H-3 Misinterpreting the p-value as the probability the null hypothesis is true (M)
Falk & Greenbaum, 1995; Oakes, 1986
H-4 Misinterpreting the p-value as the probability the null hypothesis is false (M)
Falk & Greenbaum, 1995; Haller & Krauss, 2002
H-5c Interpreting p-values to make rejection decision (C) Nickerson, 2000; H-6c Confusing Type-I and Type–II error rates Wilkerson & Olson, 1997
aAppendix A illustrates how items discussed in this paper are mapped to the blueprint codes and research literature. bConcept not assessed in current study. cOne of seven new blueprint codes added during RPASS-7 development. dE-mail during expert review (R. Gould, personal communication, November 26, 2008).
From the test respondents’ perspective, RPASS-7 items are organized in six sections. The first
five sections are thematic: (1) Defining p-values, (2) Using Tests of Statistical Significance, (3) Interpreting Results, (4) Drawing Conclusions about Statistical Significance, and (5) Tying P-values Back to Hypotheses. Each section has one or two problem scenarios and a series of associated items. Item responses may be true/false, valid/invalid, or may be selected from multiple choice options. Both multiple-true-false (MTF) and multiple choice (MC) item formats are employed. One advantage of the MTF format is that students can concurrently select both correct and incorrect options for the same prompt, revealing whether they simultaneously harbor both correct conceptions and

23
misconceptions about the same concept. MTF items may also improve reliability and validity compared to equivalent MC item formats and can provide more information than MC items given the same test duration (Downing, 1992). The final section consists of the seven MC items selected from the 10-item ARTIST Test of Significance topic scale.
Field test procedure Although the RPASS-7 version used in this study would ultimately consist
of 34 items, in fall 2008 a 33-item version of the RPASS was constructed by adding 11 new items to 22 existing items from RPASS-6 in an attempt to increase scale reliability. Three of the 11 new items were added to existing scenarios: item 2-3 (P-value as a conditional probability) and 2-5 (Confidence interval equivalence; Scenario 2), and item 5-4 (Sample and population differentiation; Scenario 5). The other eight new items were associated with two new graphical scenarios. These new scenarios featured a theoretical sampling distribution of means (Scenario 3b) and a dotplot distribution of differences in means from a randomization test (Scenario 4b). Five of the items associated with the graphical scenarios assessed new learning outcomes: 3b-1 Assessing statistical significance graphically, 3b-4 P-value as a shaded proportion, 4b-1 P-value and the hypothesized direction, 4b-2 P-value and the rejection decision, and 4b-4 Assessing significance with The three remaining graphical items were assessing learning outcomes addressed by existing items but within a graphical context: 3b-1 Assessing statistical significance graphically, 3b-3 P-value as always low, 4b-3 Sample size and significance. (Note that during expert review one additional item was added.)
All items were scored 1 (correct) or 0 (incorrect). In addition, to further instrument development, fall 2008 respondents were asked to explain their reasoning on seven selected items. Four items were selected because they were difficult for respondents in previous administrations: items 1-3 (P-value as dependent on alternative hypothesis), 2-5 (Confidence interval equivalence), 3a-1 (Contrapositive proof), and 4a-3 (Conclusion as independent of study design). Three were selected from the new items: 2-3, 3b-2, and 4b-4.
Expert review procedure Three expert raters reviewed the content of the 33-item version of the
RPASS field tested in fall 2008. The same raters provided evidence of content-related validity for previous RPASS versions (RPASS-4: Lane-Getaz, 2007a, 2007b; RPASS-6: Lane-Getaz, 2008). The format of Appendix A closely resembles information provided to expert raters to use for item and scale ratings. The experts rated the extent to which each new item assessed the stated learning outcome using a scale from 1 (strongly disagree) to 4 (strongly agree). The experts also revisited all items to evaluate the RPASS-7 scale as a whole, and made suggestions for rewording scenarios, items, or content categories to improve validity. After making recommended modifications, items were recirculated among the experts to verify changes.
2.2. PHASE II METHODS: PSYCHOMETRICS & COURSE OUTCOMES
Subjects At the same liberal arts college, students in three sections of Principles of Statistics
(Course-1), three sections of Statistics for Science (Course-2), and two sections of Statistical Modeling (Course-3) were invited to participate in this study during the spring of 2009. Participation was voluntary and instructors offered extra credit for participation. Of the 215 enrolled students, 209 started the RPASS-7 pretest and 174 answered all 34 items. Of 175 students who started the posttest, 140 answered all 34 items. Completed tests (without skipped items) are required to estimate reliability. Pretests and posttests must also be paired by respondent to compute gains. In order to pair pretest to posttest, respondents had to enter a unique access code for individual identification, protecting students’ anonymity per IRB guidelines. Of those respondents with complete pretests and posttests, 105 entered the access code provided at the pretest, or had sufficient demographic data, to pair posttest to pretest.
Table 2 details the ratio and response rate comparing respondents who were included in the sample to the number enrolled by course and by instructor (overall response rate = 0.49). To assess potential bias due to missingness associated with observed quantities, two-way interaction ANOVAs were conducted to compare mean scores of completed tests included in and excluded from the sample by course for pretests and posttests.

24
Table 2. Ratio and response rate of sample respondents compared to the number of students enrolled by course and by instructor
Instructor-1 Instructor-2 Instructor-3 Instructor-4 Total Response rate Course-1 55 / 87 - - - 55 / 87 0.63 Course-2 - 6 / 51 20 / 25 - 26 / 76 0.34 Course-3 - - 9 / 27 15 / 25 24 / 52 0.46 Total 55 / 87 6 / 51 29 / 52 15 / 25 105 / 215 0.49
Three statistics educators rated student reasoning collected on eight selected posttest items. The
three reasoning raters included two of the three instructors teaching courses in the study (Instructor-2 and Instructor-3) and a third statistics instructor from another university with prior experience rating student-written statistics responses. For full disclosure, the author of this paper is Instructor-3, who taught one section of Course-2 and one section of Course-3.
Instruments The 34-item RPASS-7 developed in Phase I was completed as a pretest and posttest
by the 105 statistics students described as the sample. Scores on standardized national exams (SAT Mathematics and Verbal, ACT Mathematics and Composite) were obtained from college records to compute construct-related validity correlations.
Course descriptions All three courses were taught by experienced instructors in computer labs where students explore real data to reinforce concepts. Students in all three courses completed a research project as part of the final exam. Course-1 was an introductory service course for liberal arts students with an Algebra prerequisite. Course-1 began with confidence intervals and students were later exposed to randomization and simulation tests, but the greatest emphasis was on t-tests, regression, and ANOVA. The textbooks used were Statistics: Concepts and Controversies (CC) (Moore & Notz, 2006) and Using SPSS for Windows and Macintosh (Green & Salkind, 2007). The course culminated in students learning to write American Psychological Association results sections for t-tests, ANOVA, and regression. Technology tools used in the course included Fathom Dynamic StatisticsTM, MinitabTM, and SPSSTM.
Course-2 was an introductory course for students in the sciences with a Calculus prerequisite. Randomization tests, simulations, and p-values were introduced early and repeatedly throughout the course. Simulations were used to introduce an array of statistical tests including categorical analysis for two-way tables, group comparisons, and inference for regression. The textbook used in the course, Investigating Statistical Concepts, Applications, and Methods (ISCAM), is case-study based (Chance & Rossman, 2006). Technology tools used in the course included Minitab and online simulation applets included with the textbook.
Course-3 was a second course in statistics, designed for students who had taken one of Course-1, Course-2, Advanced Placement Statistics, or a post-secondary option course in statistics. With instructor permission, some mathematics majors or double majors take this course without statistical preparation. Course-3 began with a review of randomization tests, t-tests, and simple regression (approximately one third of the course) and built toward multiple linear regression, ANOVA, and multiple logistic regression using R. The course textbook, The Statistical Sleuth (Ramsey & Schafer, 2002), was case-study based.
Administration procedure The 34-item RPASS-7 developed in Phase I was administered online
as a pretest and posttest in each of the three statistics courses. Human subjects consent forms were completed on the first page of the test per IRB guidelines. Pretests were administered during the first week of classes. Posttests were administered during the final week of classes or during the scheduled final exam hours in all courses, except two sections of Course-2 in which the posttest was taken outside of class hours.
Reliability analysis procedure To estimate internal consistency reliability of RPASS-7,
Cronbach’s coefficient alpha was computed on posttest scores. As background, the 22-item RPASS-6 produced a Cronbach’s coefficient of 0.57 (n = 177), an improvement from the 27-item RPASS-4

25
(Cronbach’s = 0.42, n = 224; see Lane-Getaz, 2007a, 2007b). This study aimed to achieve adequate (i.e., > 0.70) RPASS-7 score reliability to conduct research on groups.
One way to improve internal consistency reliability is to attend to the corrected-item-to-total-correlation (CITC) by item. CITC is a point biserial correlation correlating each dichotomous item response with the corrected total score (i.e., excluding the contribution from that particular item). For brevity corrected point biserial correlation will be written rpb. To improve reliability of the scale further, items with low CITC (i.e., rpb < 0.10) were either rewritten or removed from the scale.
Validity analysis procedure To the degree possible, respondents’ college entrance scores were
obtained for SAT Mathematics, SAT Verbal, and ACT Mathematics from college admission records. Evidence of construct-related validity was gathered by correlating RPASS-7 scores with college entrance scores and student-reported fall 2008 grade point averages (GPAs). Fall 2008 GPAs were captured categorically, such that 0: < 1.99, 1: 2.0–2.49, 2: 2.5–2.99, 3: 3.0–3.49, and 4: 3.5–4.0.
In Lane-Getaz (2008) RPASS-6 scores were moderately correlated with CAOS test scores (r = 0.68) providing evidence of convergent construct-related validity and were weakly correlated with student-reported college entrance test scores, providing evidence of discriminant construct-related validity (SAT Math: r = 0.11, SAT Verbal: r = 0.24, ACT Composite: r = 0.31). However, the 23-item RPASS-6 correlations were attenuated by low score reliability (= 0.57, n = 177, 22 items with variation).
Additional RPASS-7 construct-related validity evidence was gathered qualitatively by analyzing student reasoning on eight selected items. All 175 posttests were included in the analysis of students’ reasoning. Three raters independently categorized student reasoning for the following posttest items: 1-3, 2-3, 2-5, 3a-1, 3b-2, 4a-3, 4b-4, plus item 4b-5 (added during expert review). Respondents’ reasoning for each item was categorized as correct or incorrect by the raters. After completing the classifications, raters met with the researcher to discuss their classifications.
For the analysis of student reasoning each respondent was cross-classified into two groups: a correct score group and an incorrect score group by item. The cross-classification was analyzed using odds and odds ratios. Tabular data reported by item include mean number of respondents classified as providing correct reasoning, mean number of respondents providing incorrect reasoning (eliminating blank responses), odds by group (# correct reasoning / # incorrect reasoning)—labeled oddsc for the correct score group and oddsi for the incorrect score group; and the odds ratio—(oddsc / oddsi). Statistical significance for the odds ratio was computed from the approximate normality of the natural-log odds ratio, where z = ln(odds ratio) / SE(ln(odds ratio)). Patterns in incorrect reasoning were also analyzed, as they may suggest areas for item improvement or potential student misconceptions.
Course outcomes analysis procedure Distributions of RPASS-7 pretest and posttest scores and
gains were described numerically and graphically, using boxplot distributions. The number and proportion of respondents answering each item correctly are reported by course. For 17 items with expected counts of at least five, chi-square analyses were conducted under the null hypothesis that there is no association between courses and correct answers. Items that differentiate course outcomes are discussed.
Imputation procedure To minimize missing data for correlations and covariate measures, ACT
Math scores were estimated for nine respondents from their SAT Math score using the College Board concordance table (Dorans, 1999). Eight remaining missing values for ACT Math were imputed, along with 14 missing values for ACT Composite, and 68 missing values for SAT Math and SAT Verbal using a multiple imputation method (see National Research Council, 2010, pp. 6667; Rubin, 1987). The R procedure for the imputation method was based on a process documented by Su, Gelman, Hill, and Yajima (2011). Missing data were imputed iteratively for each variable using linear regression, conditioned on all the other specified variables. Independent variables with no missing values included in the imputation analysis were course, gender, class, GPA, instructor, and RPASS-7 pretest score. Three datasets were generated using the process described. The mean of the imputed

26
scores from these three datasets was used to fill-in missing values to complete the data for the 105 respondents in the sample. (Note: For this analysis variability was not estimated.)
3. RESULTS
3.1. PHASE I RESULTS: RPASS-7 FIELD TEST AND EXPERT REVIEW
Field test Results for the 25 respondents who completed the field test of 33 of 34 RPASS-7 items
in the fall 2008 were slightly skewed left (M = 26.8, SD = 2.1, Median = 27, IQR = 2.5). During expert review, one additional item was added. Seven items were answered correctly by all 25 respondents and were removed from the reliability analysis as the items had no variance. With the small number of items in the analysis (26) and the small number of respondents (n = 25), the estimated internal consistency reliability was extremely low (Cronbach’s coefficient = 0.06). No conclusions could be drawn about the field test item responses due to low reliability. No items were removed, pending expert review. However, one item was flagged as being problematic. Item 6-3 (Strength of statistical evidence) was intended to assess understanding that small p-values provide strong evidence against the null hypothesis. The problem context uses a class as if it were a sample; therefore, the p-value and answer are dependent on whether or not one assumes the sample is to be treated as if it were random. It was decided to score the item with two correct answers: “…Mrs. Rose’s class outperformed high school students across the nation” (as if the class were a random sample) and “None of the above” (assuming the class was not a random sample).
Expert review Based on expert rater feedback, 18 items were modified (eight of the existing items
and 10 of the 11 new items) and one additional item was added. The eight previously existing items modified to further improve their clarity included 1-1 Textbook definition, 1-2 Lay definition, 1-3 P-value as dependent on alternative, 2-2 Strong statistical evidence, 2-4 Chance as cause of observed results, 2-5 Confidence interval equivalence, 3a-1 Contrapositive proof, and 3a-3 P-value as always low. Modifications were made to ten new items, including nine associated with the new scenarios: 3b-1 Assessing statistical significance graphically, 3b-2 and 3b-3 P-value as always low, 3b-4 P-value as a shaded proportion, 4b-1 P-value and hypothesized direction, 4b-2 P-values and the rejection decision, 4b-3 Sample size and significance, 4b-4 Assessing significance with , 4b-5 Replication versus sample size, and item 2-3 P-value as a conditional probability (associated with Scenario 2). Item 4b-5 was added based on an expert reviewer request to assess whether students differentiate the number of replications in a simulation from the size of the samples. Raters agreed or strongly agreed to the scale’s validity once suggested changes were made. Thus, RPASS-7 consisted of 34 items for the spring 2009 administration. (See Appendix B.)
3.2. PHASE II RESULTS: PSYCHOMETRICS & COURSE OUTCOMES
RPASS-7 scores and reliability In spring 2009, the 105 sample respondents answered 75% (25.5
of 34) of the RPASS-7 posttest items correctly, on average. The results were slightly left skewed (M = 25.5, SD = 4.6, Median = 26.0, IQR = 6.0). The estimated reliability of RPASS-7 scores is = 0.76, 34 items, n = 105. Reliability results (Appendix B) include the proportion of respondents answering each item correctly (item difficulty) and standard deviation, corrected-item-to-total-correlation (CITC), and Cronbach’s coefficient -if-item-deleted.
Construct-related validity Table 3 reports RPASS-7 construct-related validity evidence. RPASS-7
posttest scores are correlated with student-reported fall 2008 GPA, and SAT Verbal, SAT Mathematics, and ACT Mathematics after imputation. Correlations before imputation are reported in Appendix C (Table 1).
Additional construct-related validity evidence was gleaned by cross-classifying student reasoning and correct answers on eight selected items (items 1-3, 2-3, 2-5, 3a-1, 3b-2, 4a-3, 4b-4, and 4b-5) for the 175 posttests. Rater classifications, means, standard deviations, and medians are reported in Appendix C for the correct score group (Table 2). The inter-rater reliability evidence for the reasoning
27
Table 3. RPASS-7 Reliability and validity: Correlations of student-reported GPA, and imputed SAT Verbal, SAT Math, and ACT Math with the RPASS-7 posttesta (n = 105)
Student-
reported GPASAT
Verbal SAT
MathematicsACT
Mathematics RPASS-7 Posttest
Student-reported GPAb n/a SAT Verbal 0.62*** 0.93c SAT Mathematics 0.54*** 0.40*** 0.92c ACT Mathematics 0.42*** 0.49*** 0.79*** 0.91 (median)c RPASS-7 Posttest 0.35*** 0.44*** 0.61*** 0.61*** 0.76
aMissing scores imputed using multiple imputation. bFall 2008 GPA student reported. cReliability on diagonal: SAT per College Board, 2005, ACT per ACT Technical Manual, 2007, RPASS-7 Cronbach’s ; Validity off-diagonal: Pearson’s r. ***p < 0.001, two-tailed.
raters shows moderate agreement in correct reasoning classifications across items. However, for item 1-3 (P-value as dependent on alternative), Rater-3 classified 31 respondents’ reasoning as correct; whereas Rater-1 and Rater-2 were in closer agreement classifying 90 and 85 respondents’ as having correct reasoning, respectively. By reporting the rounded mean, all three perspectives were included in the reported count of respondents providing correct reasoning, and in the odds and odds ratios. The bivariate correlations between rater classifications were r = 0.80 (Rater-1 and Rater-2), r = 0.66 (Rater-1 and Rater-3), and r = 0.53 (Rater-2 and Rater-3). Inter-rater reliability was computed as the mean of the correlations, r = 0.66.
Plotting rater classifications by item revealed a similar classification pattern across raters (Appendix C, Figure 1). The odds ratios comparing the correct to incorrect group indicate consistency between students’ reasoning and item responses for seven of the eight items (Appendix D, Table 1). However, within the correct group, the oddsc statistics suggest some inconsistent reasoning on three items (2-3, 2-5, and 4b-5). See Appendix D, Table 2 for the most common incorrect reasoning for eight RPASS-7 posttest items, namely 1-3, 2-3, 2-5, 3a-1, 3b-2, 4a-3, 4b-4, and 4b-5.
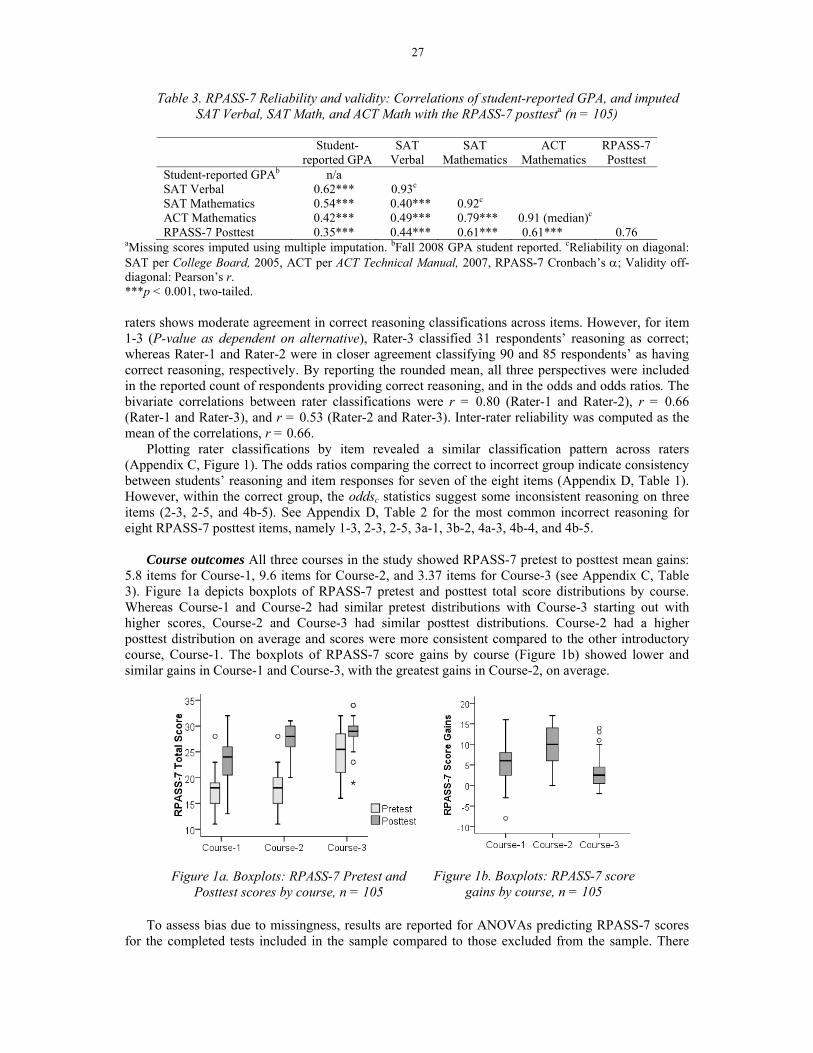
Course outcomes All three courses in the study showed RPASS-7 pretest to posttest mean gains:
5.8 items for Course-1, 9.6 items for Course-2, and 3.37 items for Course-3 (see Appendix C, Table 3). Figure 1a depicts boxplots of RPASS-7 pretest and posttest total score distributions by course. Whereas Course-1 and Course-2 had similar pretest distributions with Course-3 starting out with higher scores, Course-2 and Course-3 had similar posttest distributions. Course-2 had a higher posttest distribution on average and scores were more consistent compared to the other introductory course, Course-1. The boxplots of RPASS-7 score gains by course (Figure 1b) showed lower and similar gains in Course-1 and Course-3, with the greatest gains in Course-2, on average.
Figure 1a. Boxplots: RPASS-7 Pretest and
Posttest scores by course, n = 105
Figure 1b. Boxplots: RPASS-7 score gains by course, n = 105
To assess bias due to missingness, results are reported for ANOVAs predicting RPASS-7 scores
for the completed tests included in the sample compared to those excluded from the sample. There

28
was no statistically significant interaction between course and inclusion in the sample for either pretests (F(2,168) = 0.23, p = 0.79) or posttests (F(2,134) = 0.37, p = 0.69).
For 17 items with expected counts of at least five, chi-square tests were conducted assuming no association between the course taken and the number of correct answers by item. Chi-square results for all 17 items meeting the necessary conditions are annotated in Appendix A. Eight items differentiated course outcomes well, yielding chi-square test statistics > 6 (p < 0.05) with four tests yielding statistically significant results using a conservative Type I error rate of 0.05/17 = 0.003. The count and proportion of respondents answering these eight items correctly is reported by course in Table 4.
Table 4. Proportion of respondents with correct answers by item and course for eight RPASS-7
posttest items that differentiate course outcomes
Eight RPASS-7 Proportion of sample respondents answering item correctly Posttest Course-1 Course-2 Course-3 Overall Itemsa (n1 = 55) (n2 = 26) (n3 = 24) (n = 105)
1-2* 0.56 0.89 0.71 0.68 1-3**bc 0.55 0.85 0.88 0.70 3a-1***bc 0.33 0.65 0.92 0.54 3b-4** 0.29 0.27 0.67 0.37 4a-3** 0.67 0.96 0.88 0.79 5-1* 0.53 0.77 0.83 0.66 6-4**bc 0.53 0.73 0.96 0.68 6-5**b 0.44 0.69 0.83 0.59
aEight items with X2(2) > 6, (p < 0.05). bOne of four statistically significant results, per-item Type I error rate: 0.05/17 = 0.003. cOne of six items with high CITC, rpb > .44. *p < 0.05. **p < 0.01. ***p < 0.001.
4. DISCUSSION
4.1. RESEARCH QUESTION 1: RPASS-7 PSYCHOMETRIC PROPERTIES
Reliability evidence The estimated internal consistency reliability of RPASS-7 scores is sufficient to use for comparing groups (Pedhazur & Schmelkin, 1991) with 76% of the variation in scores attributed to true score variance. The improved reliability of the 34-item RPASS-7 compared to the 23-item RPASS-6 can be attributed in part to the new graphical Scenarios (3b and 4b) and associated items.
Generally, items associated with the scenario depicting a theoretical sampling distribution correlated well with the total RPASS-7 score. All of the CITC correlations associated with Scenario 3b exceeded 0.10, as desired. One of the new graphic items, item 3b-1 (Assessing significance graphically), had the highest CITC in this study, suggesting the ability to graphically assess statistical significance is important to understanding inference. With the exception of item 4b-1 (P-value and the hypothesized direction), items associated with the randomization distribution (Scenario 4b) also correlated well with the RPASS-7 total score. If item 4b-1 is measuring the intended learning outcome, respondents had difficulty with reasoning that the p-value is computed in the direction hypothesized by the researcher.
Five more items correlated well with the RPASS-7 total score: item 3a-1 (misusing the deterministic Boolean logic of contrapositive proof), item 1-3 (understanding the magnitude of the p-value depends on whether one has a one-tailed or two-tailed alternative hypothesis), item 6-3 (understanding that the stronger the statistical evidence of a difference or effect, the smaller the p-value), item 6-4 (larger sample sizes yield smaller p-values, and more statistically significant observed results, if all else remains the same), and item 4a-3 (believing causal conclusions can be drawn from small p-values regardless of study design). The relatively high CITC for these six bellwether items suggests the importance of the learning outcomes they measure in the development of students’ inferential reasoning.
The reliability analysis also revealed three items that correlated weakly (rpb < 0.10) with the RPASS-7 total score. First, item 2-1 had a marginally low CITC (rpb = 0.09). For this item, the p-value

29
is described in terms of sampling variation in a sampling distribution. Second, item 2-5 (Confidence interval equivalence), assessing whether students link confidence intervals to an equivalent two-tailed hypothesis test, had a very low CITC (rpb = 0.01). Third, whereas eight of nine graphics-related items correlated well with RPASS-7 total score, item 4b-1 (P-value and hypothesized direction) did not (rpb
= 0.02). Item 4b-1 states “the absolute value would be as large or larger” than the observed; that is, a one-sided p-value is described but a two-sided p-value is computed. Students should respond that the action taken is invalid but they seem to get stuck in the confusion between one-tailed and two-tailed p-values. Merely removing either item 2-5 or 4b-1 would improve reliability of the RPASS scale. In order to assess this content, these items should be rewritten and reintroduced. Student explanations for response choices will be examined for these items in a future administration.
Validity evidence Expert raters provided evidence of content-related validity for the RPASS-7
scale. With their recommended changes, all raters agreed or strongly agreed that the scale measured the intended content. With respect to construct-related validity, the pattern of correlations suggests RPASS-7 scores are more closely related to math ability than reading or general academic ability, as one might expect. However, the moderate correlation with mathematics scores may further suggest that RPASS-7 measures some unique content. Because the CAOS test was not administered to RPASS-7 respondents, no direct convergent criterion-related evidence is available. Nevertheless, since RPASS-7 consists of 22 RPASS-6 items that correlated moderately with CAOS scores (see Lane-Getaz, 2008), one might expect RPASS-7 to correlate as well or even higher with CAOS scores, but this remains an open question for further study.
Analyzing respondent reasoning on eight selected items provided additional evidence that the items were measuring as intended. For seven of the eight items the odds of providing correct reasoning were far greater for the correct score group compared to the incorrect score group as expected. However, item 4b-5 (Replication versus sample size) had an odds ratio very close to one. This item was added during expert review to assess confusion between the numbers of samples in a simulation (replications) and the number of subjects within the samples (sample size). An analysis of the incorrect reasoning provided for this item and the relatively high CITC suggest the item was measuring different content related to statistical significance. Item 4b-5 should be modified to intentionally assess students’ understanding of practical significance and a new item may need to be developed to assess the confusion between replications and sample size.
As stated previously, item 2-5 (Confidence interval equivalence) had a very low CITC. For item 2-5 there are two sources of respondent confusion. The most common reasoning revealed that respondents were grappling with whether a two-tailed confidence interval could be used to assess statistical significance, given a one-tailed alternative. The item requires modification to avoid this confusion. Some respondents were concerned whether one could use a two-tailed confidence interval (CI) to assess a one-tailed scenario. Other respondents confused the center of the CI (the sample statistic) with the center of the sampling distribution (the population parameter). An item may need to be added to capture this confusion about the CI center.
Two other new or modified items, 2-3 and 4b-4, may not measure the intended content. These items had marginally acceptable CITC (rpb = 0.12 and 0.11, respectively). For item 2-3 (P-value as a conditional probability), replacing the phrase “assuming the population mean really is 100” with “conditioned on the population mean being 100” may help focus the respondents’ attention on the intended learning outcome. The wording of item 4b-4 seemed to misdirect students to attend to whether a one-tailed or two-tailed solution was appropriate. Perhaps having a two-tailed solution as a distracter (item 4b-1, P-value and the hypothesized direction) before the correct one-tailed solution (item 4b-4, Assessing significance with contributed to the respondents’ confusion. Reordering items for Scenario 4b may help respondents attend to the significance level discussion as intended.
As previously discussed, item 6-3 (Strength of statistical evidence) was flagged as being problematic after the field test was completed. Both the intended answer and a second answer were scored as correct for this administration. The unique scoring for this item may have made the CITC artificially high. For the next administration the phrase “if the classes were a random sample” will be added to the problem stem to ensure the intended response is the only correct response. Student reasoning will be requested for item 6-3 in a future administration.

30
4.2. RESEARCH QUESTION 2: RPASS-7 OUTCOMES BY COURSE As reported, all three courses in the study showed RPASS-7 pretest to posttest mean gains. To
differentiate respondents’ formal statistical inferential reasoning at the end of each course, items 1-3, 3a-1, and 6-4 were highlighted. These three bellwether items with high CITC also differentiate RPASS-7 results by course. The three concepts assessed by these items may deserve added focus in introductory courses.
Second, item 3a-1 (Contrapositive proof) may be particularly indicative of respondents’ differentiation of probabilistic reasoning from deterministic reasoning. Batanero (2000) noted that “the formal structure of statistical tests is superficially similar to that of proof by contradiction. However, there are fundamental differences between these two types of reasoning that are not always well understood” (p. 86). Student explanations for item 3a-1 provide valuable insight into the “fundamental differences” between deterministic contrapositive proof and the probabilistic reasoning required for statistical tests. For a correct interpretation, students must overcome difficulties with applying the logic of contrapositive proof, which is a well-documented difficulty in the literature (e.g., Batanero, 2000; Falk & Greenbaum, 1995; O’Brien, 1973; O’Brien, Shapiro, & Reali, 1971; Sotos, Vanhoof, Noortgate, & Onghena, 2009). Second, students must move beyond this deterministic logic. Students must understand that small p-values do not definitively disprove a null hypothesis. Small p-values, computed under specific conditions, suggest that the sample data are inconsistent with the null. Third, students must consider whether conditions have been sufficiently met to support the scope of the inference being made (Hahn & Meeker, 1993; Nickerson, 2000).
Multiple choice item 6-4 (Sample size and significance) assesses understanding that, if all else remains the same, larger sample sizes yield smaller p-values and are more likely to produce statistically significant results. Researchers have found that introductory, intermediate-level, and some graduate students struggle with the impact of sample size on statistical significance (Haller & Krauss, 2002; Hubbard & Bayarri, 2003; Williams, 1999; Wilkerson & Olson, 1997). In the current study students’ understanding of the impact of sample size on statistical significance is well differentiated by course taken. Interestingly, item 4b-3 is a multiple-true-false item that also assesses Sample size and significance, without multiple-choice distractors. A larger proportion of respondents answered this item correctly, suggesting students’ understanding is somewhat tenuous.
4.3. LIMITATIONS
Missingness The missingness drew into question whether estimates might be biased. Two-way
interaction ANOVAs comparing completed pretest and posttest results for included and excluded respondents suggest excluded respondents were essentially missing completely at random (MCAR). There was no statistically significant interaction between course and inclusion for either pretests or posttests. The missingness due to the lost copy of access codes was likely MCAR. Logistics for future studies will be modified so that course instructors routinely send a copy of their access code assignments to the researcher as backup. However, this MCAR testing method cannot detect missingness that is nonignorable. Missing data is nonignorable if the probability a response is missing depends on the value of the unobserved response (Little & Rubin, 1989). Missingness due to skipped items may indeed be nonignorable. To minimize skipped items in future studies, instructions can be altered to stress answering every question on the test. In addition, items can be coded to require a response via the software.
5. CONCLUSIONS
5.1. SUMMARY
After adding items with a greater emphasis on graphical understanding and informal inference,
the psychometric properties of RPASS-7 showed sufficient reliability evidence ( > 0.70) to use RPASS-7 total scores to compare groups for research purposes. Expert raters provided evidence of content-related validity having agreed or strongly agreed that the items and scale measure the intended learning objective or misconception. Evidence of construct-related validity showed RPASS-

31
7 scores were weakly correlated with student-reported GPA and SAT Verbal scores, suggesting RPASS-7 measures a construct different than reading or general academic ability. Furthermore, the moderate correlations of RPASS-7 scores with SAT Mathematics and ACT Mathematics scores, suggest the construct RPASS-7 measures has some overlap with mathematical ability, as one might also expect of a measure of statistical understanding. However, there appears to be unique variation in RPASS-7 scores above and beyond mathematical ability. Analysis of students’ reasoning on the eight selected items provided insight into item functioning and direction for item improvements.
5.2. DIRECTIONS FOR FUTURE DEVELOPMENT AND RESEARCH
Future research is indicated in two areas: development of the tool to improve the psychometric
properties and use of the tool to conduct research concerning the effects of different teaching methods on students’ inferential reasoning.
Development Eight of the 34 RPASS-7 items require more development or removal from the
scale. Odds ratios comparing the correct score group to the incorrect group indicated a general consistency between correct answers and correct reasoning for seven of the eight items with student explanations. However, within the correct score group, there were only even odds of providing correct reasoning for three items.
Four new items need to be written to assess confusion about the confidence interval center, relating the sign of the CI end points to a one-tailed alternative hypothesis, confusion surrounding one-tailed and two-tailed tests, and, possibly, replication versus sample size confusion. To further improve reliability and broaden content coverage, an informal inferential reasoning scenario and associated items (e.g., comparing two boxplots) should be added to the scale (see Zieffler et al., 2008). Items written to assess informal inferential reasoning are expected to correlate with existing RPASS items. Student reasoning should be collected and analyzed for all the new or modified items.
After the item modifications have been implemented, RPASS psychometric properties should be reassessed. RPASS scores should be correlated with scores from the CAOS test as evidence of convergent construct-related validity. Items should also be mapped to the GAISE recommendations to assess for concepts that may be missing from the RPASS Item Content Blueprint. To strengthen content-related validity, a future study might enlist a broad sample of statistics educators to evaluate content coverage and the importance of content assessed by RPASS. Once items are stable, a factor analysis may identify a smaller set of factors that characterize inferential reasoning.
Research As a research tool, RPASS-7 did differentiate course outcomes. While all three courses
in the study showed pretest to posttest gains, it is of interest that the randomization-based ISCAM Course-2 achieved greater RPASS-7 gains when compared to the other introductory course, Course-1. Results reported in Lane-Getaz (2010) show that even after adjusting for prior knowledge and mathematical ability, Course-2 respondents achieved significantly greater gains than those in Course-1. Similar results were observed when comparing RPASS-6 posttest scores across institutions; the same randomization-based ISCAM course (labeled CP1) had statistically higher scores, on average, and a smaller standard deviation, compared to the other introductory courses in the study (Lane-Getaz, 2008). This artifact was observed with RPASS-4 (Lane-Getaz, 2007b) with data collected at Cal Poly. The course with the highest mean and the smallest variation in scores used the same ISCAM textbook and randomization-based teaching approach.
Future RPASS research should explore relationships between students’ inferential reasoning and innovative methods of teaching introductory statistics, including: teaching inference with randomization, bootstrapping, and sampling simulations; modeling with multivariate regression; focusing on model-eliciting activities; and using innovative technology tools. For example, students’ explanations about confidence interval equivalence revealed confusion about whether CIs are centered at the sample mean or the population mean. To help students develop a deeper understanding of CIs, instruction might introduce students to bootstrap simulations of confidence intervals. Analyzing RPASS results for this group could provide valuable insight into the effectiveness of this method.

32
Future RPASS research should also explore the development of students’ inferential reasoning as they progress through a course or a series of statistics courses. Important research design considerations include ensuring sample characteristics facilitate broader generalizability of results, obtaining longitudinal samples to assess retention, and controlling for differences between courses being compared to isolate specific areas of interest (e.g., content, tools, order of topics, etc.). Analysis of RPASS research results from a variety of courses, universities, and colleges would give a clearer picture of what students do and do not understand about inference and what instructors can do to help students develop and retain inferential reasoning.
ACKNOWLEDGEMENTS This research was made possible by a 2009 St. Olaf College Faculty Development Summer Grant;
cooperation of course instructors (Rose Gundacker, Katie Zieglar-Graham, and Paul Roback), raters of students’ reasoning (Brenda Tiefenbruck and Katie Zieglar-Graham), and immeasurable guidance from my research advisers over the eight years of RPASS design and development (Bob delMas and Joan Garfield). Thank you.
REFERENCES
ACT. (2007). ACT assessment: Technical manual. Iowa City, IA. [Online: http://www.act.org/aap/pdf/ACT_Technical_Manual.pdf ] Aliaga, M., Cuff, C., Garfield, J., Lock, R., Utts, J., & Witmer, J. (2005). Guidelines for assessment
and instruction in statistics education (GAISE): College report. Alexandria, VA: American Statistical Association. [Online: www.amstat.org/education/gaise/GAISECollege.htm ]
Allen, K., Stone, A., Rhoads, T. R., & Murphy, T. J. (2004). The statistics concepts inventory: Developing a valid and reliable instrument. Proceedings of the 2004 American Society for Engineering Education Annual Conference and Exposition (pp. 115). Salt Lake City, UT. [Online: https://engineering.purdue.edu/SCI/pubs/ASEE%202004%20SCI.pdf ]
Ancker, J. S. (2006). The language of conditional probability. Journal of Statistics Education, 14(2). [Online: www.amstat.org/publications/jse/v14n2/ancker.html ] Batanero, C. (2000). Controversies around the role of statistical tests in experimental research.
Mathematical Thinking and Learning, 2(1&2), 75–97. Carver, R. P. (1978). The case against statistical significance testing. Harvard Educational Review,
48(3), 378–399. Carver, R. P. (1993). The case against statistical significance testing, revisited. Journal of
Experimental Education, 61(4), 287–292. Cobb, G. (1992). Teaching statistics. In L. A. Steen (Ed.), Heeding the call for change: Suggestions
for curricular action (pp. 3–43). Washington, DC: The Mathematical Association of America. Cobb, G. (2007). The introductory statistics course: A Ptolemaic curriculum? Technology Innovations
in Statistics Education, 1(1). [Online: http://escholarship.org/uc/item/6hb3k0nz ] Cohen, J. (1994). The earth is round (p < .05). American Psychologist, 49(12), 997–1003. Cumming, G., & Finch, S. (2005). Inference by eye: Confidence intervals and how to read pictures of
data. American Psychologist, 60(2), 160–180. Chance, B. L., & Rossman, A. J. (2006). Investigating statistical concepts, applications, and methods.
Belmont, CA: Brooks/Cole – Thomson Learning. Daniel, L. G. (1998). Statistical significance testing: A historical overview of misuse and
misinterpretation with implications for the editorial policies of educational journals. Research in the Schools, 5(2), 23–32.
delMas, R. C., Garfield, J. B., Ooms, A., & Chance, B. (2007). Assessing students’ conceptual understanding after a first course in statistics. Statistics Education Research Journal, 6(2), 28–58.
[Online: http://iase-web.org/documents/SERJ/SERJ6%282%29_delMas.pdf ] delMas, R. C., Ooms, A., Garfield, J. B., & Chance, B. (2006). Assessing students’ statistical
reasoning. In A. Rossman & B. Chance (Eds.), Working cooperatively in statistics education:

33
Proceedings of the Seventh International Conference on Teaching Statistics. Voorburg, The Netherlands: International Statistical Institute. [Online: http://iase-web.org/documents/papers/icots7/6D3_DELM.pdf ]
Dorans, N. J. (1999). Correspondence between ACT and SAT I scores. New York: College Entrance Examination Board.
Downing, S. M. (1992). True-false, alternate-choice, and multiple-choice items. Educational Measurement: Issues and Practice, 11(3), 27–30.
Falk, R. (1986). Conditional probabilities: Insights and difficulties. In R. Davidson, R., & J. Swift, (Ed.), Proceedings of the Second International Conference on Teaching Statistics, 292–297. Victoria, Canada. Voorburg, The Netherlands: International Statistical Institute.
[Online: http://iase-web.org/documents/papers/icots2/Falk.pdf ] Falk, R., & Greenbaum, C. (1995). Significance tests die hard. Theory and Psychology, 5(1), 75–98. Garfield, J. (2003). Assessing statistical reasoning. Statistics Education Research Journal, 2(1),
2238. [Online: http://iase-web.org/documents/SERJ/SERJ2%281%29.pdf ]
Green, S., & Salkind, N. J. (2007). Using SPSS for Windows and Macintosh: Analyzing and understanding data. Old Tappan, NJ: Pearson Education.
Hahn, G. J., & Meeker, W. Q. (1993). Assumptions for statistical inference. The American Statistician, 47(1), 1–11.
Haller, H., & Krauss, S. (2002). Misinterpretations of significance: A problem students share with their teachers? Methods of Psychological Research, 7(1), 1–20.
Hubbard, R., & Bayarri, M. J. (2003). Confusion over measures of evidence (p’s) versus errors (’s) in classical statistical testing. The American Statistician, 57(3), 171–178.
Kline, R. B. (2004). Beyond significance testing: Reforming data analysis methods in behavioral research. Washington, DC: American Psychological Association.
Lane-Getaz, S. J. (2007a). Development and validation of a research-based assessment: Reasoning about p-values and statistical significance (Unpublished doctoral dissertation). University of Minnesota, Minneapolis. [Online: http://www.stat.auckland.ac.nz/~iase/publications/dissertations/07.Lane-Getaz.Dissertation.pdf ]
Lane-Getaz, S. J. (2007b). Toward the development and validation of the reasoning about p-values and statistical significance scale. In B. Phillips & L. Weldon (Eds.), Proceedings of the International Statistical Institute / International Association of Statistical Education Satellite Conference on Assessing Student Learning in Statistics, Voorburg, The Netherlands: International Statistical Institute.
[Online: http://iase-web.org/documents/papers/sat2007/Lane-Getaz.pdf ] Lane-Getaz, S. J. (2008). Introductory and intermediate students’ understanding and
misunderstanding of p-values and statistical significance. In Proceedings of the 11th International Congress on Mathematical Education (ICME-11), Monterrey, Mexico: International Commission.
[Online: http://tsg.icme11.org/document/get/475 ] Lane-Getaz, S. J. (2010). Linking the randomization test to reasoning about p-values and statistical
significance. In C. Reading (Ed.), Data and context in statistics education: Towards an evidence-based society. Proceedings of the Eighth International Conference on Teaching Statistics, Ljubljana, Slovenia. Voorburg, The Netherlands: International Statistical Institute.
[Online:http://iase-web.org/documents/papers/icots8/ICOTS8_C210_LANEGETAZ.pdf ] Little, R. J. A., & Rubin, D. B. (1989). The analysis of social science data with missing values.
Sociological Methods and Research, 18, 292–326. May, R. B., & Hunter, M. A. (1993). Some advantages of permutation tests. Canadian Psychology,
34(4), 1–10. Mittag, K. C., & Thompson, B. (2000). A national survey of AERA members’ perceptions of
statistical significance tests and other statistical issues. Educational Researcher, 29(4), 14–20. Moore, D. S. (1997). New pedagogy and new content: The case of statistics. International Statistical
Review, 65(2), 123–165. [Online: http://www.stat.auckland.ac.nz/~iase/publications/isr/97.Moore.pdf ]
Moore, D. S., & Notz, W. I. (2006). Statistics: Concepts and controversies (6th ed.). New York: W. H. Freeman.

34
National Research Council. (2010). The prevention and treatment of missing data in clinical trials. Washington, DC: National Academies Press.
Nickerson, R. S. (2000). Null hypothesis significance testing: A review of an old and continuing controversy. Psychological Methods, 5(2), 241–301.
Oakes, M. (1986). Statistical inference: A commentary for the social and behavioral sciences, Chichester, England: Wiley.
O’Brien, T. C. (1973). Logical thinking in college students. Educational Studies in Mathematics, 5(1), 71–79.
O’Brien, T. C., Shapiro, B. J. & Reali, N. C. (1971). Logical thinking—Language and context. Educational Studies in Mathematics, 4(2), 201–219.
Pedhazur, E. J., & Schmelkin, L. P. (1991). Measurement, design, and analysis: An integrated approach. Hillsdale, NJ: Lawrence Erlbaum Associates.
Ramsey, F., & Schafer, D. (2002). The statistical sleuth: A course in methods of data analysis (2nd ed.). Belmont, CA: Duxbury Press.
Rubin, D. B. (1987). Multiple imputation for nonresponse in surveys. New York: Wiley. Scheaffer, R., & Smith, W. B. (2007). Using statistics effectively in mathematics education research:
A report from a series of workshops organized by the American Statistical Association with funding from the National Science Foundation. Alexandria, VA: American Statistical Association.
Sotos, A. E. C., Vanhoof, S., Van den Noortgate, W., & Onghena, P. (2007). Students’ misconceptions of statistical inference: A review of the empirical evidence from research on statistics education. Educational Research Review, 2(2), 98–113.
Sotos, A. E. C, Vanhoof, S., Van den Noortgate, W., & Onghena, P. (2009). How confident are students in their misconceptions about hypothesis tests? Journal of Statistics Education, 17(2). [Online: http://www.amstat.org/publications/jse/v17n2/castrosotos.html ]
Su, Y., Gelman, A., Hill, J., & Yajima, M. (2011). Multiple imputation with diagnostics in R: Opening windows into the black box. Journal of Statistical Software, 45(2).
[Online: http://www.stat.columbia.edu/~gelman/research/published/mipaper.pdf ] Vallecillos, A. (1999). Some empirical evidences on learning difficulties about testing hypotheses. In
Proceedings of the International Statistical Institute 99, 52nd session, Helsinki, Finland. Voorburg, The Netherlands: International Statistical Institute. [Online: http://www.stat.auckland.ac.nz/~iase/publications/5/vall0682.pdf ]
Wilkerson, M., & Olson, J. R. (1997). Misconceptions about sample size, statistical significance, and treatment effect. The Journal of Psychology, 131(6), 627–631.
Williams, A. M. (1999). Novice students’ conceptual knowledge of statistical hypothesis testing. In J. M. Truran & K. M. Truran (Eds.), Making the difference: Proceedings of the Twenty-second Annual Conference of the Mathematics Education Research Group of Australasia (pp. 554–560). Adelaide, South Australia: MERGA.
Zieffler, A., Garfield, J., delMas, R. & Björnsdóttir, A. (2010). Development of an instrument to assess statistical thinking. In C. Reading (Ed.), Data and context in statistics education: Towards an evidence-based society. Proceedings of the Eighth International Conference on Teaching Statistics, Ljubljana, Slovenia. Voorburg, The Netherlands: International Statistical Institute.
[Online: http://iase-web.org/documents/papers/icots8/ICOTS8_5F2_ZIEFFLER.pdf ] Zieffler, A., Garfield, J., delMas, R. & Reading, C. (2008). A framework to support research on
informal inferential reasoning. In C. Reading (Ed.), Data and context in statistics education: Towards an evidence-based society. Proceedings of the Eighth International Conference on Teaching Statistics, Ljubljana, Slovenia. Voorburg, The Netherlands: International Statistical Institute. [Online: http://iase-web.org/documents/SERJ/SERJ7%282%29_Zieffler.pdf ]
SHARON J. LANE-GETAZ
St. Olaf College 1520 St. Olaf Avenue
Northfield, MN 55057

35
APPENDIX A: SELECTED RPASS-7 SCENARIOS AND ITEM WORDINGS
This appendix includes four of the seven RPASS-7 Scenarios and 25 of the 34 items that are discussed in this paper. For each item the assessed learning outcome is listed along with the RPASS Content Blueprint codes (from Table 1) and whether the student reasoning employed is a correct conception (C), misconception (M), or both (C/M). Furthermore, chi-square test results are noted for 17 items with expected counts of at least five. The null hypothesis for the chi-square test is that there is no association between the course taken and correct item scores. The item Type I error rate is 0.05/17 = 0.003.
SECTION 1. DEFINING P-VALUES
RPASS-7 item wording Assessed learning outcome 1-1a. Statement: The P-value (.048) is the probability that the students' random sample would have a mean as extreme or more extreme as what they had observed, if the results based on the research article (the null hypothesis) were indeed true. o True o False
Textbook definition (B-1): Recognizing a formal textbook definition of the p-value without a context. (C)
1-2ab. Statement: This P-value (.048) tells the students that the chances are 48 in 1000 of observing data at least as unusual as what they observed, if the null hypothesis were true. o True o False
Lay definition (B-1): Recognizing an informal description of the p-value embedded in a context. (C)
1-3abc. Statement: Assume a student had conducted a 2-tailed test instead of a 1-tailed test on the same data, how would the P-value have changed? o The two-tailed P-value would be smaller than the one-tailed (i.e., the
P- value would be .024) o The two-tailed P-value be the same as the one-tailed (i.e., the P-value
would be .048) o The two-tailed the P-value would be larger than the one-tailed (i.e., the
P-value would be .096) Please explain your reasoning in the space below:
p-value as dependent on alternative (B-1): Understanding the magnitude of p-value depends on whether one has a one-tailed or two-tailed alternative hypothesis (C)
aModified during expert review. bOne of 17 chi-square test items, item 1-2: X2(2) = 8.5, p = 0.015; item 1-3: X2(2) = 12.3, p = 0.002. cOne of six bellwether items with high CITC, rpb = 0.46.

36
SECTION 2. USING TESTS OF SIGNIFICANCE
RPASS-7 item wording Assessed learning outcome
2-1. Action: The district researchers found how likely a sample mean of 102 or higher would be in the sampling distribution of mean scores, assuming that the population mean really is 100.
o Valid Action o Invalid Action
P-value and sampling variation (B-1): The p-value is described in terms of sampling variation in a sampling distribution. (C)
2-2a. Interpretation: In their presentation to the district administration, the researchers explained that when comparing the observed results to the general population, the stronger the evidence that the reading readiness program had an effect, the smaller the P-value that would be obtained.
o True o False
Strong statistical evidence (B-1): Understanding the stronger the statistical evidence of a difference or effect, the smaller the p-value. (C)
2-3ab. Interpretation: The P-value should be interpreted as the conditional probability of having obtained a mean Reading Readiness score of 102 or higher, assuming the population mean really is 100.
o Valid Interpretation o Invalid Interpretation
Please explain your reasoning in the space below:
P-value as a conditional probability (L-5): Understanding the p-value as being conditioned on the null hypothesis being true. (C)
2-4a. Interpretation: After checking the conditions necessary for inference, the district researchers found they had statistically significant results. They interpreted the small P-value to mean that the cause of the results obtained was clearly due to chance.
o Valid Interpretation o Invalid Interpretation
Chance as cause of observed results (L-3): Interpreting the p-value as the probability observed results are due to chance or caused by chance if null is true. (M)
2-5abc. Action: Since conditions for inference were acceptable, the district researcher constructed a 95% confidence interval to estimate the range of population means that could have plausibly produced the observed results. The researcher assessed whether this confidence interval captured the hypothesized population mean of 100, and drew a conclusion as if a two-tailed significance test were conducted (at the .05 level).
o Valid Action o Invalid Action
Please explain your reasoning in the space below:
Confidence interval equivalence (R-6)— Recognizing significance testing and Confidence Interval equivalence for means (C)
aModified during expert review. bOne of 12 new items. cOne of 17 items with valid chi-square test, item 2-5: X2(2)=1.1, p = 0.571.

37
SECTION 3. INTERPRETING RESULTS Scenario 3a. A researcher conducts a two-sample test. He compares the mean hair growth results for one class section of students who agreed to try his treatment to a second class section’s mean who do not use the treatment. He hopes to show that there is a statistically significant difference between the two group means. How should this researcher interpret results from this two-sample test?
RPASS-7 item wording Assessed learning outcome
3a-1abc. Interpretation: If the class section that had the treatment has more hair growth (on average) compared to the no treatment group and the P-value is small, the researcher interprets the P-value to mean there would definitely be more hair growth in a population who uses his treatment.
o Valid Interpretation o Invalid Interpretation Please explain your reasoning in the space below:
Contrapositive proof / Inverse as true (L-1): Believing statistics provide definitive proof; Misusing the deterministic Boolean logic of contrapositive proof. (M)
3a-3a. Interpretation: Assume the conditions for inference were met and the researcher obtains a large P-value of .72. How should this be interpreted? o There is a calculation error because P-values are not supposed to be
this large. o The sample data did not support the research hypothesis.
P-value as always low (B-2): Believing the p-value is always a low number (or is always desired to be a low number). (M)
aModified during expert review. bOne of 17 items with valid chi-square test, item 3a-1: X2(2) = 25.1, p < 0.001. cOne of six bellwether items with high CITC, rpb = 0.47.

38
Scenario 3b. Radium-226 is a naturally occurring radioactive gas. For public safety, the Environmental Protection Agency (EPA) has set the maximum exposure level of Radium-226 at a mean of 4 pCi/L (picocuries per liter). Student researchers at a southern Florida university expected to show that Radium-226 levels were less than 4 pCi/L. However, these student researchers collected 32 soil specimens with a mean Radium-226 measured at 4.1 pCi/L. Students checked the necessary conditions and conducted a hypothesis test at the .05 level. Estimate the P-value given the sketch below of the distribution of means and the observed mean of 4.1 pCi/L.
RPASS-7 item wording Assessed learning outcome
3b-1abc. Interpretation: Based on the estimated P-value, the students’ sample mean was statistically significant.
o Valid Interpretation o Invalid Interpretation
Assessing statistical significance graphically (B-1): Using a density curve and an observed value to estimate if the observed (or more extreme) is statistically significant. (M)
3b-2ab. Interpretation: The estimated P-value for the students’ sample is greater than .05.
o Valid Interpretation o Invalid Interpretation
Please explain your reasoning in the space below:
P-value as always low (B-2): Believing the p-value is always a low number (or is always desired to be low a number). (M)
3b-3abd. Interpretation: The P-value for the students’ sample was most
likely greater than .5.
o Valid Interpretation o Invalid Interpretation
P-value as always low (B-2): Believing the p-value is always a low number (or is always desired to be a low number). (M)
3b-4abd. Interpretation: The estimated P-value for the students’ sample can be illustrated by shading the area to the right of the observed sample mean of 4.1 pCi/L in the sampling distribution of means represented above.
o Valid Interpretation o Invalid Interpretation
P-value as a shaded proportion (B-1): Understanding p-value as a shaded proportion (observed and more extreme) of the possible values in a sampling or randomization distribution. (C)
aModified during expert review. bOne of 12 new items. cOne of six bellwether items with high CITC, rpb = 0.52. dOne of 17 items with valid chi-square test, item 3b-3: X2(2) = 3.9, p = 0.14; item 3b-4: X2(2) = 11.77, p = 0.003.

39
SECTION 4. DRAWING CONCLUSIONS ABOUT STATISTICAL SIGNIFICANCE
RPASS-7 item wording Assessed learning outcome
4a-3ab. Conclusion: A causal conclusion can be drawn about the effectiveness of the review course based on a P-value this small, regardless of whether this was a randomized comparative experiment or an observational study.
o True o False
Please explain your reasoning in the space below:
Conclusions as independent of study design (L-4): Believing causal conclusions can be drawn from small p-values regardless of study design. (M)
aOne of six bellwether items with high CITC, rpb = 0.44. bOne of 17 items with valid chi-square test; item 4a-3: X2(2) = 10.2, p < 0.006.
Scenario 4b. Researchers hypothesized that female students suffering from bulimia would have a greater fear of a negative evaluation by others than female students who had more normal eating habits. To investigate this theory two samples of female subjects were recruited to participate in a psychological study. One sample consisted of 11 "bulimic" females; the other sample of 14 female subjects had "normal" eating habits. The response variable in this study was based on a questionnaire taken by each subject that measured her “fear of negative evaluation” (FNE). The mean difference in FNE scores between the "bulimic" group and the "normal" group was 3.68 points.
A statistics class was asked to assess if this difference of 3.68 was statistically significant (at the .05 level)?[sic] The statistics students decided to randomly reassign the observed FNE scores to two groups (Bulimic and Normal) 100 times as if there were no difference in the two groups. For every random re-assignment the statistics students computed differences between the mean FNE scores (mean Bulimic FNE score – mean Normal FNE score). They plotted these 100 mean differences in a dot plot to assess how much the mean difference would vary just by chance. The distribution of mean differences appears below. Using this distribution, students estimated a P-value and assessed the statistical significance of the observed mean difference of 3.68.

40
RPASS-7 item wording Assessed learning outcome
4b-1abc. Action: The statistics students counted the mean differences in the above distribution where the absolute value would be 3.68 or greater and obtained an approximate P-value of 13/100 or .13.
o Valid Action o Invalid Action
P-value and hypothesized direction (B-1): p-value is computed in the direction hypothesized by the researcher. (C)
4b-2ac. Conclusion: Given the observed difference in mean FNE scores of 3.68 in this study, researchers rejected the hypothesis that there was no difference in FNE scores in the broader population.
o Valid Conclusion o Invalid Conclusion
P-value and the rejection decision (B-1): Understanding that large p-values provide insufficient evidence to reject the null hypothesis. (C)
4b-3ab. Conclusion: Assuming the statistics students failed to reject the null hypothesis, the study may not have a large enough sample size to detect a statistically significant difference.
o Valid Conclusion o Invalid Conclusion
Sample size and significance (R-4): Understanding larger sample sizes yield smaller p-values, and more statistically significant observed results, if all else remains the same. (C)
4b-4abc. Conclusion: One student argued that the appropriate P-value should be 7/100 or .07 for a one-tailed hypothesis, which was sufficient evidence to reject the null hypothesis at the .10 significance level but insufficient to reject at the .05 level.
o Valid Conclusion o Invalid Conclusion
Please explain your reasoning in the space below:
Assessing significance with (R-3): Using significance level alpha to assess whether a p-value is rare or unusual enough to be statistically significant. (C)
4b-5abc. Conclusion: The sample size of 100 replications would create results that are statistically significant, regardless of whether they are practically significant.
o Valid Conclusion o Invalid Conclusion
Please explain your reasoning in the space below:
Replication versus sample size (R-7): Differentiating the number of replications in a simulation from the sample size. (M)
aModified during expert review. bOne of 12 new items. cOne of 17 items with valid chi-square test, item 4b-1: X2(2) = 5.5, p = 0.065; item 4b-2: X2(2) = 2.8, p = 0.247; item 4b-4: X2(2) = 0.77, p = 0.679; item 4b-5: X2(2) = 6.7, p = 0.034.

41
SECTION 5. TYING P-VALUES BACK TO HYPOTHESES Scenario 5. Suppose you have a new driving school curriculum which you suspect may alter performance on passing the written exam portion of the driver's test. You compare the mean scores of subjects who were randomly assigned to a control or treatment group (20 subjects in each group). You use a 2-sample test of significance and obtain a P-value of .01.
RPASS-7 item wording Assessed learning outcome 5-1a. Statement: The small P-value of .01 is the probability that the null
hypothesis (that there is no difference between population means for those who took the driving course and those who did not) is false.
o True Statement o False Statement
Probability: null is false (H-4): Misinterpreting p-value as probability the null hypothesis is false. (M)
5-4abc. Statement: The P-value of .01 may reflect a significant mean difference in scores between the treatment and control groups in this study but has no bearing on whether there is a statistically significant mean difference in the broader population.
o True Statement o False Statement
Sample and population (R-2): Confusing whether statistically significant results refer to a sample or a population. (M)
aOne of 17 items with valid chi-square test, item 5-1: X2(2) = 8.9, p = 0.012, item 5-4: X2(2) = 1.4, p = 0.507. bOne of 12 new items. cModified during expert review.

42
SECTION 6. MAKING INFERENTIAL CONNECTIONS
RPASS-7 item wording Assessed learning outcome6-3ab. It is reported that scores on a particular test of historical trivia given to
high school students are approximately normally distributed with a mean of 85. Mrs. Rose believes that her 5 classes of high school seniors will score significantly better than the national average on this test. At the end of the semester, Mrs. Rose administers the historical trivia test to her students. The students score an average of 89 on this test. After conducting the appropriate statistical test, Mrs. Rose finds that the P-value is .0025. Which of the following is the best interpretation of the P-value?
o A P-value of .0025 provides strong evidence that, on average, Mrs. Rose's class outperformed high school students across the nation.
o A P-value of .0025 indicates that there is a very small chance that, on average, Mrs. Rose's class outperformed high school students across the nation.
o A P-value of .0025 provides evidence that Mrs. Rose is an exceptional teacher who was able to prepare her students well, on average, for this national test.
o None of the above
Strength of statistical evidence (B-1): Understanding the stronger the statistical evidence of a difference or effect, the smaller the p-value. (C/M)
6-4ac. A researcher conducts an experiment on human memory and recruits 15 people to participate in her study. She performs the experiment and analyzes the results. She obtains a P-value of .17. Which of the following is a reasonable interpretation of her results?
o This proves that her experimental treatment has no effect on memory. o There is evidence of a small effect on memory by her experimental
treatment. o She should reject the null hypothesis. o There could be a treatment effect, but the sample size was too small to
detect it.
Sample size and significance (R-4): Larger sample sizes yield smaller p-values, and more statistically significant observed results, if all else remains the same. (C/M)
aOne of six bellwether items with high CITC, rpb = 0.44. bItem 6-3, two options scored as correct. cOne of 17 items with valid chi-square test, item 6-4: X2(2) = 14.7, p = 0.001.

43
RPASS-7 new or modified item wording Assessed learning outcome
6-5a. A newspaper article claims that the average age for people who receive food stamps is 40 years. You believe that the average age is less than that. You take a random sample of 100 people who receive food stamps, and find their average age to be 39.2 years. You find that this is significantly lower than the age of 40 stated in the article (p<.05). What would be an appropriate interpretation of this result? o The statistically significant result indicates that the majority of people
who receive food stamps is younger than 40. o Although the result is statistically significant, the difference in age is
not of practical importance. o An error must have been made. This difference is too small to be
statistically significant.
Practical significance (B-1): Asmall p-value does not necessarily mean that there is a large or practical difference or effect. (C/M)
6-6a. A newspaper article stated that the US Supreme Court received 812 letters from around the country on the subject of whether to ban cameras from the courtroom. Of these 812 letters, 800 expressed the opinion that cameras should be banned. A statistics student was going to use this sample information to conduct a test of significance of whether more than 95% of all American adults feel that cameras should be banned from the courtroom. What would you tell this student? o The necessary conditions for a test of significance are not satisfied, so
no statistical test should be performed. o With such a large number of people favoring the notion that cameras
be banned, there is no need for a statistical test. o This is a large enough sample to provide an accurate estimate of the
American public's opinion on the issue.
Conditions for inference (B-1): In order to conduct a significance test the necessary conditions must be met. (C/M)
6-7a. Food inspectors inspect samples of food products to see if they are safe. This can be thought of as a hypothesis test, where: Ho: the food is safe (in the population), and Ha: the food is not safe (in the population). Identify whether the following statement is a Type I (Alpha), a Type II (Beta) error, or neither. Statement: “The inspector says the food is not safe but it actually is safe.” o The inspector fails to reject the null hypothesis when he should have
(i.e., a Type II or beta error) o The inspector rejects the null hypothesis when he shouldn’t have (i.e.,
a Type I or alpha error) o Not an error
Type I vs. Type II error differentiation (H-6): Differentiates between concepts of Type I or Type II error. (C/M)
aOne of 17 items with valid chi-square test, item 6-5: X2(2) = 12.4, p = 0.002, item 6-6: X2(2) = 1.7, p = 0.423, item 6-7: X2(2) = 5.9, p = 0.052.

44
APPENDIX B: RPASS-7 SCORE RELIABILITY AND ITEM ANALYSIS
Table 1. RPASS-7 posttest score reliability analysis: Blueprint code, item difficulty, SD, CITC, and Coefficient alpha-if-item-deleted ( = 0.76, 34 items, n = 105 respondents)
RPASS-7 34 items
Item assesses the following correct conception (C) or misconception (M)
Blueprintcodea
Item difficulty SD CITC
if-item- deleted
1-1 Textbook definition C B-1 .92 .27 .11 .760 1-2 Lay definition C B-1 .68 .47 .18 .759 1-3b p-value as dependent on alternative C B-1 .70 .46 .46 .743 2-1 p-value and sampling variation C B-1 .90 .30 .09 .760 2-2 Strong statistical evidence C B-1 .87 .34 .28 .753 2-3bc p-value as a conditional probability C L-5 .81 .40 .12 .761 2-4 Chance as cause of observed results M L-3 .91 .28 .25 .755 2-5bcd Confidence interval equivalence C R-6 .70 .46 .01 .768 3a-1b Contrapositive proof / Inverse as true M L-1 .54 .50 .47 .741 3a-2 p-value as rareness measure C B-1 .87 .34 .25 .755 3a-3 p-value as always low M B-2 .96 .19 .18 .758 3b-1ce Assessing significance graphically C B-1 .82 .39 .52 .741 3b-2bce p-value as always low M B-2 .81 .40 .39 .748 3b-3ce p-value as always low M B-2 .49 .50 .18 .759 3b-4ce p-value as a shaded proportion C B-1 .37 .49 .17 .759
4a-1 Type I / and p-value M R-3 .93 .25 .31 .754 4a-2 Large difference or effect & p-value C B-1 .90 .30 .19 .757 4a-3b Conclusion as independent of design M L-4 .79 .41 .44 .745 4b-1cdf p-value and hypothesized direction C B-1 .31 .47 .02 .768 4b-2cf p-values and the rejection decision C H-5 .64 .48 .31 .751 4b-3cf Sample size and significance C R-4 .85 .36 .31 .752
4b-4bcf Assessing significance with C R-3 .60 .49 .10 .764 4b-5bcf Replication versus sample size M R-7 .70 .46 .29 .752 5-1 Probability: null is false M H-4 .66 .48 .32 .751 5-2 Probability: null is true M H-3 .82 .39 .38 .748 5-3 Smaller the p-value C B-1 .95 .21 .31 .754 5-4c Sample and population differentiation M R-2 .47 .50 .19 .758 6-1 Textbook definition C/M B-1 .88 .33 .24 .755 6-2 Smaller the p-value C/M B-1 .94 .23 .41 .751 6-3 Strength of statistical evidence C/M B-1 .93 .25 .44 .749 6-4 Sample size and significance C/M R-4 .68 .47 .44 .744 6-5 Practical significance C/M B-1 .59 .49 .12 .762 6-6 Conditions for inference C/M L-6 .78 .42 .39 .748 6-7 Type I / Type II error differentiation C/M H-6 .71 .45 .21 .757
Note. 25.5 items answered correctly, on average, 75%. aBlueprint code links item to the research literature (refer to Table 1). bStudent reasoning requested for this item. cNew item introduced during RPASS-7 development. dItem with low CITC (corrected-rpb < 0.10). eItem associated with the graphical representation of the theoretical sampling distribution. fItem associated with the graphical representation of the randomization distribution.

45
APPENDIX C: RPASS-7 PSYCHOMETRIC PROPERTIES, INTER-RATER RELIABILITY, AND PRETEST AND POSTTEST DESCRIPTIVES BY COURSE
Table 1. RPASS-7 reliability and validity coefficients: Correlations of RPASS-7 posttest with
student-reported GPA, SAT Verbal, SAT Mathematics, and ACT Mathematics scores
Student-
reported GPA SAT
Verbal SAT
MathematicsACT
Mathematics RPASS-7 Posttest
Student-reported GPAa n/a (105) SAT Verbal .58** (37) .93c SAT Mathematics .34* (37)b .46** (37) .92c ACT Mathematics .44** (88) .45** (28) .80** (28) .91 (median)c RPASS-7 Posttest .35** (105) .66** (37) .68** (37) .61** (88) .76 (105)c
aGPA reported is fall 2008. bPairwise sample size in parentheses. cReliability on diagonal: SAT per College Board Research Notes, 2005; ACT per ACT Technical Manual, 2007; RPASS-7 is Cronbach’s coefficient ; Validity off-diagonal (Pearson’s r). *p < 0.05. **p < 0.01, two-tailed.
Table 2. Number of respondents classified with correct reasoning for the correct response group:
Count, Mean, SD, and Median by rater and item
RPASS-7 Item 1-3 2-3 2-5 3a-1 3b-2 4a-3 4b-4 4b-5
Rater-1 90 45 40 53 59 80 46 8 Rater-2 85 46 33 28 86 81 28 25 Rater-3 31 32 14 53 48 48 22 5
Mean(SD) 58(38.2) 39(9.9) 24(13.4) 41(17.7) 67(26.9) 65(23.3) 25(4.2) 15(14.1) Median 85 45 33 53 59 80 28 8
Note. Whereas median count would resist the influence of an outlier rating, the rounded mean is used to compute odds and odds ratios in Appendix D (Table 1). Bivariate correlations between Rater-1 and Rater-2 ratings are r = 0.80, between Rater-1 and Rater-3 are r = 0.66, and between Rater-2 and Rater-3 are r = 0.53. Inter-rater reliability is the mean of these correlations, r = 0.66. Rater-1 is the author of this paper.
0
10
20
30
40
50
60
70
80
90
100
1-3 2-3 2-5 3a-1 3b-2 4a-3 4b-4 4b-5
RPASS-7 Item
Nu
mb
er o
f R
esp
ond
ents
wit
h
Rea
son
ing
Cla
ssif
ied
as
Cor
rect
Rater-1
Rater-2
Rater-3
Figure 1. Scatterplot of the number of respondents in correct score group classified as providing correct reasoning by rater and item
Table 3. RPASS-7 pretest and posttest means, gains, and SDs by course (n = 105)
Course n
Sample Mean (SD) Mean gain (SD) Pretest Posttest
Course-1 55 17.4 (3.0) 23.2 (4.5) 5.8 (5.0) Course-2 26 17.8 (4.0) 27.4 (2.9) 9.6 (4.5) Course-3 24 25.0 (4.8) 28.7 (3.1) 3.7 (4.4)
Overall 105 19.2 (4.9) 25.5 (4.6) 6.2 (5.2)

46
APPENDIX D: RESPONDENTS’ REASONING CLASSIFIED BY ITEM SCORE AND COMMON INCORRECT REASONING
Table 1. Classification of Respondents’ Reasoning for Eight RPASS-7 Items, Odds, and Odds Ratios for all Posttest Respondents (n = 175)
RPASS-7 item
Correct conception (C) or misconception (M)
Total number
responses
Respondents scoring correct for item Respondents scoring incorrect for item Odds ratioc
Numbercorrect
Reasoning classification Oddsc
b Number
incorrectReasoning classification
OddsibCorrect a Incorrect Blank Correcta Incorrect Blank
1-3 p-value as dependent on alternative (C)
174 113 69 23 21 3.00 61 3 30 28 .11 30.00***
2-3 p-value as a conditional probability (C)
174 140 41 43 56 0.95d 34 2 15 17 .13 7.15**
2-5 Confidence interval equivalence (C)
174 126 29 33 64 0.88d 48 2 38 8 .04 16.70***
3a-1 Contrapositive proof / Inverse as true (M)
173 91 45 31 15 1.44 81 1 39 41 .03 56.61***
3b-2 p-value as always low (M)
172 137 64 32 41 2.01 35 6 12 17 .50 4.00**
4a-3 Conclusion as independent of study design (M)
171 130 70 26 34 2.68 41 2 16 23 .10 21.54***
4b-4 Assessing significance with (C)
168 95 32 22 41 1.45 73 2 45 24 .04 32.73***
4b-5 Replication versus sample size (M)
170 116 13 48 55 0.26d 53 5 21 27 .24 1.14
aCorrect = Mean number of respondents coded as providing essentially correct reasoning for each item based on three independent ratings. bOddsc and oddsi are (# correct / # incorrect) for respondents answering the item correctly and incorrectly, respectively. Odds computations exclude those respondents leaving the reasoning field blank. cOdds ratio = oddsc / oddsi. Statistical significance for the odds ratio is computed using approximate normality of the log odds ratio. dOddsc < 1 indicates poor item functioning and may indicate student misconceptions. **p < 0.01. ***p < 0.001.

47
Table 2. Common incorrect reasoning for eight RPASS-7 posttest items, CITC, & item evaluation for all posttest respondents (n = 175)
RPASS-7 item
Correct conception (C) or misconception (M)
Blueprintcode Most typical incorrect explanation given, if any CITC Item evaluation
1-3 p-value as dependent on alternative (C)
B-1 (11) Respondents described needing to divide the one-tailed p-value to obtain the two-tailed p-value (5) Vaguely described including more data or values
.46 No item change. Difficulty with one- vs. two-tailed p-value. Two-tailed splits alpha between tails; can double p-value.
2-3 p-value as a conditional probability (C)
L-5 (4) Respondents described p-value as probability results would happen by chance but not specifying conditioned on the null hypothesis.
.12ac Revisit item or scenario wording; CITC is sufficient; Rewording may better target intended objective.
2-5 Confidence interval equivalence (C)
R-6 (18) Respondents discussed one-tailed versus two-tailed issues, rather than CI / p-value equivalence for means, as intended. (14) Respondents confused if a confidence interval is centered at a population mean or a sample mean
.01bc Revisit item and scenario wording: - Move or modify to isolate from
difficulty with one-tailed / two-tailed. - Consider new items attending to CI
center and sign(s) of CI end points. 3a-1 Contrapositive proof (M) L-1 (28) Respondents cited the small p-value as sufficient
to determine statistical significance without considering conditions for inference. (12) Respondents discuss random allocation and causation when item asks about generalization.
.47 Reword learning outcome. Juxtaposes deterministic and probabilistic reasoning. Explanations include scope of inference (SRS/randomization) discussion interlocked with probabilistic thinking.
3b-2 pvalue as always low (M) B-2 No patterns in the incorrect explanations. .39a No item change. Item seems clear. 4a-3 Conclusion as independent
of study design (M) L-4 (5) Respondents cited small p-value as sufficient to
draw causal conclusions without randomization. .44 No item change. Suggests little
difficulty with scope of inference item. 4b-4 Assessing significance with
(C) R-3 (14) Respondents described the need to have a two-
tailed test for this scenario. Whether one- or two-tailed is used, both would fail to reject.
.10c Consider rewording scenario (e.g., to reject for one-tailed, retain for 2-tailed, =.05) or changing item order for Scenario 4b.
4b-5 Replication versus sample size (M)
R-7 No clear discussion of the conflation of replications and sample size, indicating misunderstanding of this concept. Some refer to “practical versus statistical significance.”
.29ac Write a new item for R-7 Replication vs. sample size. Practical significance seems to be assessed by this item, not the intended objective. Modify item for this objective and add new for R-7.
aLow odds of providing a correct response, Appendix D, Table 1. bCommon incorrect reasoning suggests possible misconception. cItem or scenario needs rewording:, 2-3, 2-5, 4b-4, and 4b-5 (despite high CITC of 4b-5, rpb = 0.29; odds ratio=1.14 from Appendix D, Table 1 suggests measurement error).