development and validation of the fyi – a preliminary ... · pdf filedavid blustein, ms....
TRANSCRIPT

FYI Validation 1
Running Head: FYI Validation
Development and Validation of the FYI – A Preliminary Report
Harley E. Baker Jane S. Styer
California State University Channel Islands Defense Manpower Data Center
Lenore Harmon Mary Pommerich
University of Illinois at Urbana- Champaign Defense Manpower Data Center
24 May 2010
Note. This research received partial funding from the US Department of Defense (Contract # M67004-08-C-0008). The views, opinions, and/or findings contained in this paper are those of the author(s) and should not be construed as an official DoD position, policy, or decision unless so designated by other official documentation. The authors thank the following – among many others - for their important contributions to the research reported in this paper: Dr. David Blustein, Ms. Denise Lawson, Dr. Jan Bayer, Dr. Susan Stiles, Dr. Dan Segall, Ms. Kathy Moreno, Dr. Alan Nicewander, Ms. Gail Budda, Ms. Sherlyn Stahr, and Mr. John Harris. Members of the Defense Advisory Committee on Military Personnel Testing provided empirical oversight. Dr. Jane Arabian, Associate Director of Accession Policy, Office of the Assistant Secretary of Defense (Personnel and Readiness), provided policy oversight.

FYI Validation 2
Abstract
Developed for the ASVAB Career Exploration Program, the Find Your Interests (FYI) inventory
was designed to help students learn about their career-related interests. The FYI is a 90-item interest
inventory based on Holland’s (1973, 1985, 1997) widely accepted theory and taxonomy of career choice.
The inventory determines their resemblance to each of the six interest types. Nearly one-quarter of all
high school students in the nation participate in the ASVAB Program (Baker, 2000), underscoring the
need for study and documentation of the creation and validation of this instrument. Based on a large
national sample of high school students, analyses were conducted to assess FYI content, criterion, and
construct-related evidence of validity. Results showed that the FYI (a) is composed of six factors with
each factor representing one RIASEC domain, (b) has a hexagonal shape, and (c) has substantial
relationships with the Strong Interest Inventory. Throughout the analyses, consistent content, criterion,
and construct-related evidence for the validity of the FYI are presented.

FYI Validation 3
Development and Validation of the FYI – A Measure of Career Interests
The primary purpose of this technical document is to introduce the Find Your Interests (FYI)
inventory, a new measure of career and vocational interests. It was hoped that by integrating a “best
practices” (DeVellis, 2003) with a construct validation (Simms & Watson, 2007) approach for scale
development, that the FYI would demonstrate optimal psychometric characteristics and be a valuable
resource for students beginning to explore the world of work and their place in that world.
Designed specifically for the ASVAB Career Exploration Program, the FYI has replaced the
Interest-Finder (IF; Wall, Wise, & Baker, 1996; Wall & Baker, 2001) as the fully-operational interest
component of the program. Based on Holland’s (1973, 1985, 1997) well-accepted vocational personality
theory, the FYI is a 90-item interest inventory designed to help students identify areas in which their
career interests lie. It accomplishes this task by identifying students’ career interests in each of the six
areas advanced by Holland’s RIASEC theory: (R)ealistic, (I)nvestigative, (A)rtistic, (S)ocial,
(E)nterprising, and (C)onventional. This paper describes the three-phase development process used to
create the FYI, and provides information concerning the psychometric characteristics and properties of
the FYI. Information concerning the administration and scoring of the FYI can be found elsewhere
(Defense Manpower Data Center, 2005).
Description of the ASVAB Career Exploration Program
The Armed Services Vocational Aptitude Battery (ASVAB) Career Exploration Program is one of
the largest career exploration programs in the world. Annually, it serves between 800,000 and 900,000
high school and post-secondary students in over 14,000 schools nationwide. Based on internal estimates
of market penetration and utilization, it appears that more than one-fourth of all high school seniors will
have participated in the ASVAB Program during their high school years (Baker, 2002).
Since its inception in 1968, the ASVAB Program has undergone considerable and substantial
revision. The current version, fielded in 2002, is a cooperative endeavor between the nation's schools and
the Department of Defense. The ASVAB Program provides a comprehensive vocational assessment
package at no cost either to participating schools or to their students. Funded entirely by the Department

FYI Validation 4
of Defense, this comprehensive package contains two major assessment instruments and a number of
exercises that help students identify and research occupations for which they show interest and ability.
The ASVAB Program fulfills two major purposes. First, the program provides age and developmentally
appropriate materials to support high school and postsecondary educational and career counseling.
Second, the program is useful to the Military Services as an aid in the process of identifying interested
students who meet the qualifications for entrance into the nation’s Armed Forces.
The goal of the ASVAB Career Exploration Program is to give students the opportunity to explore a
variety of careers using knowledge they have gained about their interests and skills through assessment
components and structured activities. Career development during adolescence and early adulthood is an
ongoing process. Students’ career plans are still in the formative stages, and these plans will continue to
develop and change over time. The ASVAB Career Exploration Program emphasizes the importance of
planning and decision making, skills that can benefit students throughout their lives. The Program is
designed to help students: (a) learn more about themselves and the world of work; (b) explore occupations
in line with their interests and skills; and, (c) develop an effective strategy to realize their career goals.
The ASVAB program relies on the ASVAB test (Defense Manpower Data Center, 1995) and the
Find Your Interests inventory to provide information about students’ academic abilities and career
interests respectively. The ASVAB is the most widely-used multiple aptitude test battery in the United
States (Defense Manpower Data Center, 1995). It also is one of the most highly developed, technically
sophisticated, and well-researched test batteries in the world (Jensen, 1988; Patrick, Blosel, & Gross,
2009; Rogers, 2001.)
Until recently, the ASVAB Program also relied on the Interest-Finder (Defense Manpower Data
Center, 2000; Wall, Wise, & Baker, 1996; Wall & Baker, 1997) as a measure of career interests. The IF
was based on Holland’s (1985) theory of career choice. There is substantial evidence and support for the
IF as a measure of the RIASEC constructs. Factor analysis demonstrated the existence of six factors, with
each factor corresponding to one of the IF scales, and with each factor uniquely representing one of the
RIASEC domains. These factor results are consistent with the high levels of internal consistency for the

FYI Validation 5
IF scales, with coefficients alpha ranging from .93 to .97. Multidimensional scaling techniques showed
that the IF has a hexagonal shape and structure. IF scales correlate substantially (.68 to .78) with their
corresponding Strong Interest Inventory scales (SII; Hansen & Campbell, 1985) and with the appropriate
SII Basic Interest Scales. While gender, ethnicity, and socioeconomic status differences exist on some of
the IF scales, these differences are relatively small in comparison to the differences found on the SII. IF
scales are related to courses taken in high school and to students' expected future career. In their biennial
review of assessment devices, Bingham and Krantz (2001) concluded that the extensive validity analyses
reported by Wall and Baker demonstrated considerable content, construct, and criterion-related validity
for the IF as a measure of the RIASEC domains.
The IF, a 240-item inventory could take as long as 45 minutes to administer, score and interpret. As
such, there was a need to create a brief, flexible superior measure of the Holland types for use by high
school students in the ASVAB Program. In contrast, most students can complete the FYI in about 15 to
20 minutes with little or no assistance. Most students easily understand the instructions for scoring the
FYI. After scoring the FYI and considering the influence of gender on their scores, students identify their
three highest Interest Codes. Students use these Interest Codes along with their ASVAB Career
Exploration Scores to identify potentially satisfying occupations for exploration.
Holland’s RIASEC Theory
Holland’s (1973, 1985a, 1997) theory of vocational personalities and work environments is probably
the most widely accepted contemporary theory of career choice (Brown & Gore, 1994; Weinrach &
Srebalus, 1990). He designed the theory to address three important aspects of vocational psychology and
career development. He wanted his theory to identify the personal and work environment characteristics
that lead to satisfying career decisions, involvement, and achievements. He hoped to find the personal and
work environment characteristics that lead to career stability and career change. Finally, he wanted to
determine the most effective methods for helping people with career decisions and problems.
Holland states that most people can be categorized in terms of their resemblance to the six model
RIASEC personality types. The more closely an individual resembles a particular type, the more likely

FYI Validation 6
that person is to exhibit the personality characteristics associated with that type. Holland suggests cultural
and personal forces, such as parents, social class, and the physical environment shape people in different
ways by providing individuals with opportunities for different kinds of experiences. Out of these
experiences, individuals develop preferences for particular kinds of activities over other kinds of
activities. With further development, these preferred activities become interests. These interests tend to
lead to the development of a set of corresponding competencies that are required for them to engage in
these activities. Out of these competencies, interests, and experiences, a personal disposition emerges that
leads to thinking, perceiving, and acting in particular ways. These personal dispositions are what we
would call personality. While each person is unique, the personalities that develop can be categorized into
a small number based on the person’s interests. For convenience, we refer to a person who can be
classified as, say realistic, as a Realistic person. No one is a “pure” type to the exclusion of the other five
types: all people have at least some characteristics that are associated with each of the six types.
Holland also suggests that most work environments can be categorized in terms of their resemblance
to each of the six RIASEC model environment types. The more closely a work environment resembles a
particular type, the more likely that environment is to exhibit the characteristics associated with that type.
Different work environments require different skills, abilities, and competencies from those who work in
them. As such, work environments call for the types of skills possessed by people with the corresponding
personality type. For example, Realistic work environments require people with the competencies
associated with the Realistic personality type. Consequently, for each personality type there is a
corresponding work environment type, in which their skills, abilities, and competencies are valued.
Further, the corresponding work environment becomes a place where a great deal of value is placed on
the required skills, abilities and competencies, as well as on the attitudes and interests that spawn them.
Therefore, these environments can be categorized in the same way as people are categorized. Similarly,
each work environment type has at least some characteristics associated with the other types. Holland
(1985, p. 3) explains that "the choice of an occupation is an expressive act which reflects the person's
motivation, knowledge, personality, and ability. Occupations represent a way of life, an environment

FYI Validation 7
rather than a set of isolated functions or skills.” Work environments provide the context for the use of
skills, abilities and competencies, as well as an important place where people express their attitudes and
values. Because people prefer to be valued and respected, rather than devalued and disrespected, people
search for environments in which their skills and abilities are appreciated and desired. For example,
Social people seek out social work environments, while Realistic people search for realistic work
environments.
Prediger (1982; Prediger & Vansickle, 1992) has suggested that the six types can be mapped on to
two bipolar dimensions, data vs. ideas and things vs. people. According to this formulation, the types can
be differentiated in terms of the preference for ideas or data, and things or people. Rounds and Tracey
(1993), who performed a ‘structural meta-analysis’ of the RIASEC model provide support for Prediger's
views.
The relative distance between the types determines consistency. Each person and work environment
contains characteristics associated with each of the six types. Consistency is determined from the degree
of compatibility among these characteristics and is assessed by looking at the RIASEC patterns. Some
pairs of types (person or environment) are more consistent than other pairs. For example, a Realistic-
Artistic environment would be inconsistent, since these environments contain characteristics that are
incompatible with the other. Conversely, a Realistic-Conventional environment would be consistent,
since they emphasize similar characteristics. The relationships between and within the personality and
environment types are ordered according to the hexagonal arrangement of the types. This is formally
called the calculus assumption and states that the distances between the types are "inversely proportional
to the theoretical relationships between them" (Holland, 1973, 1985a, p.5). As such, adjacent types (e.g.,
R and I) are most similar to each other, and that opposite types (e.g., R and S) are least similar to each
other. The similarity between nonadjacent types (e.g., R and A) falls in between (see Figure 1)..

FYI Validation 8
Realistic Investigative
Conventional Artistic
Enterprising Social
Figure 1: Holland Hexagonal Arrangement of the RIASEC Types
Development of the FYI
A three-phase development process was employed in the creation and initial validation of the FYI as
a measure of the RIASEC domains associated with Holland’s theory of vocational choice. Phase I focused
on foundational issues such as articulating and specifying the constructs to be assessed, identifying the
kinds of items necessary to do so, deciding on the appropriate format for those items, the item-writing
process, and writing trial items. In Phase II, the trial items were administered to two large national
samples of high school students as a pilot test. The psychometric and statistical characteristics and
properties of the items were evaluated in order to decide on a smaller group of items for inclusion in a
trial version of the FYI. In Phase III, the trial version was administered to another large and nationally
representative sample of high school students. Based on both the empirical results and further conceptual
analysis, the final set of items was identified, the FYI scales and form was finalized, and a set of
appropriate national norms was created.
The first step in the creation of any new measure involves a detailed description of both the (a)
constructs to be assessed and measured, and (b) the population in which the measure will be employed

FYI Validation 9
(Simms & Watson, 2007). These form the foundation both for the creation and editing of the items used
in the measure and the ways in which the measure will be subjected to empirical study and refinement.
The FYI was designed to assess the RIASEC domains advanced by Holland’s (1959, 1973, 1985, 1997)
theory of vocational personalities and work environments. His theory is probably the most widely
accepted contemporary theory of career choice (Brown & Gore, 1994; Weinrach & Srebalus, 1990),
enjoying “unprecedented influence” (Spokane, Luchetta & Rickwine, 2002, p. 375) in the field of career
choice and development. The theory is so influential that Gottfredson (1999) says “Holland’s
monumental research, theoretical, and practical contributions have irrevocably altered the manner in
which career assistance is delivered around the world” (p. 15). Holland advanced his theory of vocational
choice 50 years ago (Holland, 1959), and has continued to articulate, enhance, refine and elaborate the
theory ever since. Moreover, there have been, literally, hundreds of empirical investigations of the theory
and its tenets. As would be expected, some aspects of the theory have enjoyed continuity and stability
over the years, while other aspects have not. Consequently, while consensus is unambiguous concerning
the importance and applicability of the theory, there is still debate and ambiguity concerning the precise
nature and definitions of the Holland’s RIASEC constructs. As with any dynamic and useful theory, such
debate and ambiguity is to be expected.
In order to develop the clearest and most explicit conceptualization of the RIASEC constructs to be
assessed, psychologists with expertise in career development, career counseling, psychometrics, statistics
and developmental psychology was convened. This panel, informed by a thorough review of the
appropriate literatures, came to strong consensus with regard to the constructs to be assessed by the FYI.
Consistent with Clark and Watson (1995), each RIASEC domain was carefully defined and explicated.
Further, particular occupations were identified that might serve as exemplars and pure types to make more
concrete each RIASEC domain. These descriptions and definitions (see Table 1) appear similar in many
regards to definitions and descriptions of the RIASEC domains offered by others, focusing on the
vocational aspects of the domains from a work activity perspective.

FYI Validation 10
Table 1
Description of Each RIASEC Type
RIASEC Domain RIASEC Description Example Occupations
Realistic (R) Typically prefer work activities that include practical, hands-on problems and solutions, such as designing, building, and repairing machinery. They tend to enjoy working outside, with tools and machinery, or with plants and animals. Realistic types generally prefer to work with things rather than people. Realistic occupations generally require workers to have physical and mechanical abilities.
Broadcast Technician; Construction and Maintenance; Cooks; Dental Laboratory Technician; Desktop Publisher; Electrical, Civil, or Mechanical Engineer/ Engineering Technician; Farmer; Firefighter; Forest and Conservation Worker; Fish and Game Warden; Mechanic; Pilot; Veterinary Assistant; and Woodworker.
Investigative (I) Typically prefer analytical or intellectual activities such as reading, studying, investigating, evaluating, and problem solving. Investigative types generally prefer to work with ideas rather than with people or things. Investigative occupations generally require workers to have mathematical and scientific abilities.
Anthropologist; Dentist; Dietitian/Nutritionist; Chemical, Electronics, and Agricultural Engineer/Technician; Computer Software Engineer, Programmer, and Support Specialist; Forensic Science Technician; Meteorologist; Physician/Surgeon; Respiratory Therapist; Surveyor; Systems Analyst; Veterinarian; and Zoologist and Wildlife Biologist.
Artistic (A) Typically prefer work that involves expressing oneself in original activities like writing, dancing, singing, sculpting, and painting. They tend to enjoy working in a setting where the work can be done without following a clear set of rules. Artistic types generally prefer to work with ideas rather than things. Artistic occupations generally require workers to have artistic abilities and good imagination.
Actor, Architect, Film and Video Editors, Choreographer, Composer, Graphic Designer, Musician, Photographer, Radio and Television Announcer, Reporter/ Correspondent, and Writer/Author.
Social (S) Typically like activities that involve personal interaction with people such as teaching, counseling, or otherwise to be of service to others. They prefer work that involves informing, helping, or serving others in either individual or group settings. Social types prefer to work with people rather than to work with objects, machines or data. Social occupations generally require
Childcare Worker, Dental Assistant, EMT/Paramedic, Fitness Trainer, Licensed Practical Nurse, Occupational Therapist/Assistant, Park Naturalist, Personal Financial Advisor, Physical Therapist/Assistant, Police/Security Officer, Recreation Worker, Social Worker, Teacher, and Tour Guide.

FYI Validation 11
personal interaction and communication skills and abilities. Social occupations generally require personal interaction and communication skills and abilities.
Enterprising (E) Typically prefer work that involves persuading, influencing, and directing others and are often interested in economics and politics. They enjoy work activities such as sales, supervision, and project or business management. They like work that is fast-paced, requires a lot of responsibility and decision-making, and requires taking risks for profit. Enterprising types prefer to work with people and ideas rather than things. Enterprising occupations generally require workers to have leadership, sales, and speaking abilities.
Athletes and Sports Competitor, Chef, Chief Executive, Coach, Construction Manager, Financial Manager, Judge, Lawyer, Marketing Manager, Meeting and Convention Planner, Paralegal/Legal Assistant, Police Detective, Private Detective/Investigator, Real Estate Agent, Retail Buyer, Sales Representative, and Travel Agent/Guide.
Conventional (C) Typically prefer work activities that involve establishing or maintaining orderly and accurate records, procedures, and routines. They like working with data, or machines and applying precise standards in a setting where there is a clear line of authority. Conventional types prefer working with data and details more than with ideas. Conventional occupations generally require workers to have clerical, organizational, and arithmetic abilities.
Accountant, Air Traffic Controller, Bank Teller, Budget Analyst, Construction and Building Inspector, Court Reporter, Fire Investigator/Inspector, Freight/Cargo Inspector, Human Resource Assistant, Immigration and Customs Inspector, Payroll Clerk, Pharmacy Technician, Legal/Medical Secretary, Tax Preparer, Title Examiner and Abstractor, and Travel Clerk.

FYI Validation 12
With clear definitions and descriptions as the foundation for the FYI, the next issue to be faced was
that of item type and response format. RIASEC-based inventories have traditionally relied on several
different kinds of items to assess the constructs. After a careful review of the literature, Wall, Wise and
Baker (1996) noted the most common types of RIASEC items are: (a) Activities – actions one might find
enjoyable to pursue, (b) Types of People – kinds of people with whom one would want to have day-to-
day contact, (c) Experiences – activities one has pursued in the past, (d) Skills – abilities or competencies
one possesses, (e) Training or Education – topics one may have learned through courses or training
programs, and (f) Occupations – career titles or jobs. To this list, Harmon (1999) adds self-efficacy – the
degree to which believes one can perform successfully the activities associated with a RIASEC domain.
Some item types work better in certain kinds of populations than do other item types (Harmon,
1999). Late adolescents were the primary targeted population for the FYI. From a developmental
perspective, items that focus on activities appears to be the more appropriate than do other item types
(Kaplan, 2004). Savickas (1999) thoughtfully argues, there are at least four qualitative attributes of
interest that need to be considered: (a) interest focuses attention on some aspect of the environment, (b)
interest arouses feelings concerning the object of focus, (c) interest steers a direction either toward or
away from the object of focus, and (d) interest involves activity, or action toward the object of focus. The
vital role that activities play in interest and in the self that guides interest is clear: it is through engaging in
various activities that people determine the degree to which they choose to pursue future tasks. The
experiences gained from these activities become the grist for the mill of self-concept development and for
deciding whether to engage in similar activities. Developmentally, the most relevant items for adolescent
populations, therefore, probably would be those that focus on activities as indicators of interests. Given
that adolescence is the time most associated with issues surrounding self-concept and identity formation
(Erikson, 1968; Kroger, 2000), it seems reasonable to expect that adolescents themselves would be paying
strong attention to the kinds of activities in which they would like to engage or avoid.
With the definitions resolved and the item type identified, over 1,000 items were written based on
these descriptions. These items focused on the types of activities associated with the RIASEC domains

FYI Validation 13
listed above and written to: (a) be understandable to students, (b) be equally valid for all students, and (c)
provide content coverage of each RIASEC domain. The major purpose of the Item Tryout Study was to
assess the psychometric characteristics of the items. The final form of the FYI could then contain the
items with the best psychometric Indices of reliability and validity. To obtain statistics on the items and
assess their psychometric and statistical characteristics, a large national study was conducted.
METHOD
Participants
High school students recruited from 48 schools in 47 cities across 28 states (N = 4,873) constituted
the sample for this study. The sample consisted of female adolescents (54%; n = 2,629) and male
adolescents (46%; n = 2,244). While there were more females than males in this study χ2 (1, N = 4,873) =
30.418, p < .0001), this difference constituted a small effect (d = .159; r = .079). Most students were
either juniors (61%; n = 2,965) or seniors (25%; n = 1,224), with the rest being sophomores (13%; n =
642). The remainder (1%; n = 41) consisted of freshman and those who declined to provide grade level
information. Ethnically, the sample consisted mostly of Caucasian students (82%; n = 3,950), with
relatively small numbers of American Indians (1%; n = 37), African Americans (8%; n = 382), 27%;
Hispanic Americans (8%; n = 393), Asian Americans (1%; n = 69), and students from other racial/ethnic
descents or multi-racial descent (4%; n = 195). A number of students (5%; n = 240) declined to provide
information about their racial/ethnic descent. Because participants could elect to self-identify as a member
of several different ethnic/racial categories, these numbers and percentages should be viewed with this in
mind. Geographically, the sample evidenced considerable diversity, with over a third (41%; n = 1,994)
from rural schools, over a third (45%; n = 2,177) from suburban schools, and about one-sixth (14%; n =
702) from urban schools. There was considerable regional diversity as well, with about one-sixth of the
students from the New England states (15%; n = 723), about one-fourth from the MidAtlantic states
(23%; n = 1,114), one-sixth from the Southeastern states (14%; n = 668), about one-fourth from the
Midwestern states (25%; n = 1,194), about one-tenth from the Southern states (11%; n = 521), and about

FYI Validation 14
one-sixth from the Western states (13%; n = 653). Participants were from both public (85%; n = 4146)
and private (15%; n = 727) schools.
Procedures
Rather than administer all 515 of the tryout items to each student, the tryout items were randomly
divided into two tryout forms. Both forms contained: (a) a series of background items from which
demographic diversity could be determined; (b) the Strong Interest Inventory (SII; Harmon, Hansen,
Borgen, & Hammer, 1994); and, (c) the tryout items. A general answer sheet was utilized that had room
to record up to 300 answers. Data were collected in schools from January through May of 2004. Form A,
administered to 2,444 participants, contained 260 tryout items; Form B was administered to 2,429
students and contained 255 tryout items. These tryout items were arranged according to the RIASEC
order in which the RIASEC order was repeated every six items. This helped to ensure that the participants
would not develop stereotypic responses to the items. To help ensure that the FYI would assess interest
rather than competence or aptitude, participants were told: “Don’t be concerned with how well you would
do any activity or whether you have the experience or training to do it. Just think about how much you
would like or dislike doing the activity.” Designed primarily for high school aged students who range in
age from 15 to 19, the items employed a three-point scale of Like (“I would like to do this activity”),
Indifferent (“I don’t care one way or the other”), and Dislike (“I would not like to do this activity”). While
some have argued against the use of neutral points in interest measures (e.g., Wall, Wise, & Baker, 1996),
a three-point format enhances the probability the FYI will produce accurate and valid profiles by allowing
the respondent to respond with certainty concerning the activities about which the respondent is sure, and
with uncertainty concerning the activities about which the respondent is unsure. Given that adolescence is
a time when individuals come to grips with such certainties and uncertainties (Kaplan, 2004), it is
developmentally appropriate to employ such a three-point response format.
Demographically, the two groups was quite similar in gender composition χ2 (1, N = 4,873) = 0.212,
p = ns), racial and ethnic composition χ2 (5, N = 4,873) = 6.382, p = ns and grade level χ2 (3, N = 4,873)

FYI Validation 15
= 1.700, p = ns). Because students were randomly assigned either to Form A or Form B at each location,
there were no differences in the two groups with regard to school, school location or type of school.
RESULTS
The analysis proceeded in four stages. In the first stage, initial screenings were conducted to find the
items that met the statistical requirements for inclusion in the inventory. All data analytic strategies make
assumptions about the nature of the data. Data screening was conducted to ensure that these assumptions
were not substantially violated by the data in question. Participants with data that failed to meet these
minimal criteria were deleted from the study. First, participants who provided more answers than there
were questions – suggesting they failed to attend appropriately to the task – were deleted. Second,
participants with more than 10% missing data were deleted. Finally, participants who were either
univariate outliers (p < .001) or multivariate outliers (p < .001) also were deleted. After deleting these
participants (7%; n = 332) from the study, there were 2442 Form A and 2429 Form B participants (see
Figure 2).
Having eliminated respondents that likely would have increased error variance, Phase II began. In
this phase, a number of item-level psychometric and statistical characteristics were computed. The item-
level statistics included measures of endorsement rate, item-RIASEC domain correlations, and Westen
and Rosenthal’s (2003) construct validity coefficient (ralerting-CV) an item-level measure of the degree to
which the items mirrored the theoretical hexagonal relationships among the RIASEC types specified in
Holland’s theory.
In scoring the items, a Like received a score of 1.0, an Indifferent was scored as 0.5, and a Dislike
was scored as 0.0. Scoring the items in this way approximated the scoring for endorsement rates, making
it easier to assess the degree to which the respondents either enjoyed the activity or did not do so. The
items were then aggregated by RIASEC domain within each Form to create the RIASEC domain scores in
order to assess how well each item reflected the domain of interest and whether it exhibited the hexagonal
pattern of correlations one would expect based on the theory. In essence, these domain scores functioned

FYI Validation 16
as RIASEC scales. The number of items, item-level means and standard deviations, and correlations
among the RIASEC domains for each form are reported in Table 2.
Figure 2
Consolidated Standards for Reporting of Trials (CONSORT) chart of participant flow
Based on the information reported in Table 2, it seems clear that the Form A and Form B items
functioned very similarly. The pattern of the domain means for the two forms was very similar (r = .94),
as would be expected when two different inventories assessing the same construct are administered to
similar large samples. Second, the domain means themselves were similar for the two forms. While
MANOVA revealed statistically significant differences between the two forms λ = .979, F(6, 4534) =
16.043, p < .001, the multivariate effect size was quite small η2 = .021, suggesting the differences are at
best trivial. In terms of reliability, the coefficients α were high for all of the domains, ranging in
magnitude from .94 to .96 demonstrating substantial internal consistency for the domains.

FYI Validation 17
Table 2
RIASEC Domain Score Descriptive Statistics
Form A Domain RIASEC Domain Correlations
RIASEC Domaina Items Mean SD R I A S E C
Realistic (R) 45 0.32 0.23 .96 .59 .30 .18 .32 .38
Investigative (I) 42 0.32 0.22 .95 .44 .41 .43 .44
Artistic (A) 46 0.42 0.25 .96 .55 .43 .28
Social (S) 42 0.37 0.25 .96 .54 .50
Enterprising (E) 43 0.34 0.23 .96 .71
Conventional (C) 42 0.21 0.19 .95
Form B Domain RIASEC Domain Correlations
RIASEC Domainb Items Mean SD R I A S E C
Realistic (R) 44 0.30 0.23 .96 .48 .23 .08 .35 .33
Investigative (I) 42 0.29 0.23 .95 .42 .38 .40 .34
Artistic (A) 43 0.43 0.25 .95 .56 .50 .28
Social (S) 40 0.41 0.25 .96 .49 .50
Enterprising (E) 43 0.34 0.22 .94 .65
Conventional (C) 43 0.23 0.20 .95 Note. Coefficient alpha on the diagonal of each correlation matrix. an = 2442; bn = 2429.
Myors (1996) suggested a simple test to assess the degree to which an interest inventory matches
Holland’s hexagon. This test relies on how well the RIASEC scale rank-order correlations match the
rank-order correlations specified by the hexagonal nature of the model. As such, this method uses a
simple rank-order correlation to assess how well the data fit the hypothesized hexagonal structure. It
accomplishes this by first rank-ordering the observed intercorrelations among the RIASEC scales. These
ranks are then correlated with the ranks one would expect if the inventory fit the hexagonal structure. If
the correlation is statistically significant, there is agreement between the two sets of ranks. Such
agreement indicates that the structure of the interest inventory matches the structure implied by the
hexagon. For Form A, the rank-order correlation was statistically significant r(13) = .71, p < .005. This
indicates that the pattern of the observed correlations matches the hexagon-generated expected pattern of

FYI Validation 18
correlations. Form B also exhibited a pattern indicative of congruence with the hexagonal structure of the
RIASEC domains r(13) = .53, p < .04.
Armed with this information, four expert judges independently selected the items for the further
empirical and conceptual scrutiny planned for Phase III. The judges all had doctorates in appropriate
fields with at least five years of post-doctoral experience in the career development or psychometric
fields. All were quite familiar with Holland’s theory, having been major contributors to other RIASEC-
based inventories, published in the career development field, and/or served on Editorial Boards or as
Editors in appropriate journals in the field. Judges were asked to identify items they believed would be
the best construct-valid indicators of the RIASEC domains, while trying to avoid construct
underrepresentation and content overrepresentation both across and within the RIASEC domains. In
doing so, judges were especially careful to scrutinize and avoid items overly sensitive to issues of gender
or race/ethnicity. This was done in order both enhance the validity of the measure and to reduce
potentially spurious gender and race/ethnic differences. Given that the items all focused on the degree to
which the participants might like to engage in the specified activities, judges also wanted to be sensitive
to environmental concerns, such as the region, urbanicity and type of the school. Further, judges attended
to the pattern of correlations of the items with the RIASEC domains.
Rather than rely solely on classical statistics, IRT methods were also employed because IRT
provided another way to link item parameters across the two forms in order to evaluate and compare item
performance. In order to link parameters across different samples, a set of common items must be
administered to anchor the scale across the two forms. The SII was chosen to provide the anchor
items In these analyses, SII GOT items were selected for each of the six RIASEC domains by regressing
each GOT score on the 317 SII items. Statistically significant items (p < .0001) were scrutinized and
screened for content similarity with the FYI RIASEC content definitions and for consistent response
format. IRT modeling has seldom been used in the creation of interest inventories for various reasons.
However, in the present case, there was

FYI Validation 19
“strong empirical evidence, however, that the 3PL model is appropriate to use across the six
RIASEC domains. The a and b parameters have comparable classical statistics to which they
may be reasonably compared, and the correlations between the IRT parameters and the classical
statistics are very high. The a parameter is similar in scope to the correlation between the item
score and the domain score, while the b parameter is similar in scope to the endorsement rate.”
(Pommerich, 2004, p. 6).
Pommerich goes on to note that correlations between the a - parameters correlated substantially (r =
.76 - .92) with the item-domain score correlations and that the b – parameter showed similar
correlations (r = .76 - .94). Such relationships argue persuasively that 3PL modeling is appropriate
for these data and that both methods are likely to produce similar results. The IRT analyses are
reported in detail elsewhere (Pommerich, 2004).
After the judges created their separate lists of the items for further scrutiny, vigorous and intense
discussions were held in order to create a final list of items for further scrutiny. A consensus procedure
was employed and the list of potential items for inclusion in the FYI was finalized. This final list of 124
items included 19 Realistic, 22 Investigative, 20 Artistic, 20 Social, 22 Enterprising, and 21 Conventional
items.
The retained items were compared with the items that were not retained on a number of important
statistical and psychometric characteristics. These analyses were conducted to help determine and to
document if the final set of selected items were superior to those unselected in important ways. First, item
selection was unrelated to Form χ2 (1, N = 515) = 2.022, p = ns indicating that roughly the same number
of items from Form A (70 items) as from Form B (54 items) were selected for inclusion. This suggests
that neither differential sample characteristics nor item placement by form had a significant effect on
whether items were retained for the final form.

FYI Validation 20
Statistical Comparison of Retained vs. Unretained Items
Judges’ efforts to select the best items appeared productive and fruitful. Statistical and psychometric
comparison of the 124 selected vs. the 391 unselected items showed selected items: (a) referenced more
appealing activities; (b) evidenced smaller gender differences; (c) evidenced smaller race/ethnic
differences; (d) created more internally consistent scales; (e) demonstrated greater evidence of construct
validity; (f) demonstrated greater evidence of criterion validity; and, (g) demonstrated greater evidence of
content validity. These conclusions are based on the analyses presented below.
Retained items referenced more appealing activities than did unretained items. The hypothesis that
the retained items (M = .347, SD = .087) had a higher endorsement rate than did the unretained items (M
= .328, SD = .117) was assessed via a one-tailed t-test. Because the assumption of homogeneity of
variance was substantially violated F(1, 513) = 19.092, p < .0001, the unequal variance formula was use,
confirming that retained items had a higher endorsement rate than did unretained items t(275.10) = 1.849,
p < .05.
Retained items evidenced smaller gender differences than did unretained items. Given the power of
interest inventories to reify occupational stereotypes based on gender, it was important to provide a
“balanced” set of activities in the FYI. The dependent variable for this analysis, gender difference, was
constructed by subtracting the female endorsement rate from the male endorsement rate. A positive value
would thus indicate a higher male endorsement rate, while a negative value would indicate a higher
female endorsement rate. It is important to note that the preliminary item screenings were quite effective
in reducing gender differences across the entire set of items: the mean gender difference across all 515
items was essentially zero (-.007) t(514) = -.886, p = .376. Given the large gender differences reported in
the literature in the Realistic, Artistic and Social domains, the panel sought to select items that would be
equally appealing to male and female adolescents especially in these three RIASEC arenas. To test for
this, the endorsement rate differences were submitted to a 2 (retained, unretained) X 6 (RIASEC domain)
ANOVA. While no differences were found due to retained or unretained status, strong RIASEC area
gender differences emerged F(5,503) = 73.966, p < .0001. Of greater importance is the significant

FYI Validation 21
interaction effect F(5,503) = 6.493, p < .001. Post hoc Bonferroni procedures revealed that compared to
the unretained items, the retained items had smaller gender differences in the Artistic (p < .001), Realistic
(p < .005) and Social (p < .005) domains. Overall, gender differences appeared reasonable among the
retained items: only the Realistic and Social domains still evidenced significant gender differences, and
these had relatively small effect sizes (d = .21 and .29 respectively). As such, it appears that the judges
selected items that minimized potentially spurious gender differences.
Retained items evidenced smaller race/ethnic differences than did unretained items. Similarly,
interest inventories seem also to reify occupational stereotypes based on race and ethnicity. It was also,
therefore, important to provide a “balanced” set of activities in the FYI with regard to race and ethnicity.
Given the large ethnicity differences reported in the literature, the panel sought to select items that would
be equally appealing to adolescents from all ethnic and racial backgrounds. As before, ANOVA results
show the retained items (M = .333, SD = .123) had significantly higher endorsement rates than did the
unretained items (M = .352, SD = .097) F(1, 1509) = 11.244, p < .001. More important is the degree to
which the African American, Hispanic and Caucasian endorsement rates differ in the retained and
unretained items. To see if the retained items manifest smaller differences, the unretained item
endorsement rates were submitted to a 3 (African American, Hispanic, Caucasian) X 6 (RIASEC domain)
ANOVA. Significant overall race/ethnicity differences were found F(2, 1155) = 5.530, p < .01. Follow-up
Dunnett tests compared African Americans (M = .346, SD = .134) and Hispanics (M = .328, SD = .116)
to Caucasian (M = .326, SD = .118), showing significant African American - Caucasian differences p <
.01, but not Hispanic – Caucasian differences p > .90. The same analyses were conducted with the
retained items, with a failure to find an overall significant race/ethnic differences F(2, 354) = .668, p >
.50. Under these conditions, follow-up tests were unnecessary.
Retained items created more internally consistent scales than did unretained items. One of the
judges’ goals was to retain items that would, all things being equal, maximize the probability that the final
scale would deliver high quality accurate information to examinees concerning their career interests. This
information, hopefully, is as free from error as possible. This would imply that the FYI would deliver to

FYI Validation 22
students reliable information. According to the Standards for Educational and Psychological Testing
(American Psychological Association, 1999), “reliability refers to the degree to which test scores are free
from errors of measurement” (p. 19). Reliability, therefore, is the psychometric property concerned with
the accuracy, precision, and consistency of test scores (Kerlinger, 1986). As part of the study design,
participants completed about only about one-half of the FYI Tryout items. Because participants did not
complete all of the items, scale statistics cannot be calculated. Rather, they must be estimated from
summary item-level data. The mean, standard deviation, and coefficient alpha were estimated (Lord &
Novick, 1968) for each of the final RIASEC scales. These are conservative and lower-bound estimates.
These estimates are reported in Table 3 for the retained and unretained items separately. As can be seen,
the estimated reliabilities that would emerge from the retained items (M = .89, SD = .012) are higher than
the estimated reliabilities that would emerge from the unretained items (M = .87, SD = .015). While these
differences may seem trivial, they are statistically significant z = 1.928, p < .03 (one-tailed) upholding the
hypothesis that the retained items would yield more reliable scales than would the unretained items.
Table 3
Estimated Mean, Standard Deviation, and Coefficient α for Final FYI Scales
Created from the Retained and Unretained Items
Based on Retained Items Based on Unretained Items
FYI Scale Mean SD α Mean SD α
Realistic 9.94 7.06 .87 9.23 6.98 .88
Investigative 9.68 7.98 .91 9.02 6.27 .85
Artistic 12.77 8.08 .89 12.81 7.47 .88
Social 11.09 7.45 .88 11.95 7.49 .90
Enterprising 10.82 7.48 .89 9.99 6.47 .86
Conventional 8.21 6.70 .89 5.99 5.65 .87 Note. FYI = Find Your Interests inventory. Final FYI scale scores will range from 0 to 30. As part of the study design, participants completed about only about half of the FYI items. Because participants did not complete all of, scale statistics cannot be calculated. Rather, they must be estimated from summary item-level data. The formulas required to estimate these scale statistics can be found in Lord and Novick (1968). Scale means are estimated by Equation 15.2.3 (p. 328). Scale standard deviations are estimated by Equation 15.3.6 (p. 330). Where the formulas called for the item-scale correlations, the item-RIASEC domain scores were used as the value of the scale. This will cause all estimates to be conservative lower bound estimates of the final FYI scale parameters. These values were

FYI Validation 23
then adjusted to represent estimates for fifteen item scales. Coefficients alpha are estimated by Equation 15.3.8 (p. 331), adjusted to reflect the estimated reliabilities for fifteen item scales by the Spearman-Brown Prophecy Formula, Equation 5.10.1 (p. 112).
Retained items demonstrated greater evidence of construct validity than did the unretained items.
According to Holland’s (1973, 1985, 1997) theory, the RIASEC domains are related to each in a
particular hexagonal arrangement in which the distances between the types are "inversely proportional to
the theoretical relationships between them" (Holland, 1973, 1985, p.5). As such, construct-valid items
(Messick, 1989) would be expected to demonstrate the same set of patterns. This suggests that an item’s
correlation with each of the RIASEC domains would also be arranged hexagonally, according to it’s own
RIASEC domain. If so, one would expect, for example Realistic items to correlate highest with the
Realistic domain, next highest with the Investigative and Conventional domains, next highest with the
Artistic and Enterprising domains, and least with the Social domain. Consistent with Westen and
Rosenthal (2003), an item-level measure of construct validity is easily created that assesses the degree to
which an item’s correlations with the six RIASEC domains follow the RIASEC pattern required by the
theory. Westen and Rosenthal define ralerting-CV, which is a “simple correlation between (a) the pattern of
correlations predicted between the measure being validated and the k variables correlated with that
measure, and (b) the pattern of correlations actually obtained.” (p. 610, emphasis in the original.) Based
on what Holland has termed “the geometry of the hexagon,” each FYI Tryout item was correlated with
the six RIASEC domain scores. These correlations were expected to mirror their placement on the
hexagon, correlating highest with their respective RIASEC domain, second highest with the two adjacent
RIASEC domains, third highest with the two alternate RIASEC domains, and least with the opposite
RIASEC domain. These are, in essence, measures of an item’s “hexagonality” (Defense Manpower Data
Center, 2005, p. 65). These correlations were submitted to a 2 (retained, unretained) X 6 (RIASEC
domain) ANOVA to test the hypothesis that the retained items had greater evidence of construct validity
than did the unretained items. This hypothesis was strongly upheld, with the retained items (M = .80, SD
= .09) having significantly more “hexagonality” than did the unretained items (M = .72, SD = .25) F(1,

FYI Validation 24
503) = 15.599, p < .001. Post hoc Bonferroni procedures demonstrated that the retained items evidenced
greater levels of hexagonality than did the unretained items in the Investigative, Artistic, and Enterprising
domains.
This analysis was repeated using only the correlations derived from the female, African American,
and Latino participants with very similar results. This hypothesis was strongly upheld for females, with
the retained items (M = .79, SD = .12) having significantly more “hexagonality” than did the unretained
items (M = .73, SD = .21) F(1, 503) = 8.622, p < .001. As with the total sample, post hoc Bonferroni
procedures that the retained items evidenced greater levels of hexagonality than did the unretained items
in the Investigative, Artistic, and Enterprising domains.
This hypothesis was also strongly upheld for both African Americans and for Latinos. Among the
African Americans in the sample, the retained items (M = .75, SD = .15) evidenced significantly more
“hexagonality” than did the unretained items (M = .69, SD = .26) F(1, 503) = 7.565, p < .01. Post hoc
Bonferroni procedures that the retained items evidenced greater levels of hexagonality than did the
unretained items in the Investigative and Enterprising domains among African Americans. Among the
Latinos in the sample, the retained items (M = .78, SD = .12) again evidenced significantly more
“hexagonality” than did the unretained items (M = .68, SD = .27) F(1, 503) = 16.429, p < .001. As with
the total sample, post hoc Bonferroni procedures that the retained items evidenced greater levels of
hexagonality than did the unretained items in the Investigative, Artistic, Enterprising and Conventional
domains among the Latinos in the sample.
For the entire sample, for females, African Americans and Latinos separately, the retained items
evidenced greater construct validity than did the unretained items. Specifically, the retained items more
closely mirrored the pattern of expected correlations with the RIASEC domains than did the unretained
items. As Westen and Rosenthal (2003) argue, the evidence based on this type of analysis is strong
construct-validity related evidence.
Retained items demonstrated greater evidence of criterion validity than did the unretained items.
Criterion-related evidence of validity demonstrates the degree to which the scores on a measure are

FYI Validation 25
systematically related to one or more appropriate criteria. Because the General Occupation Theme (GOT)
scales of the Strong Interest Inventory (SII; Harmon, Hansen, Borgen & Hammer, 1994) correspond to
the six RIASEC areas defined by Holland’s theory, these scales constitute an appropriate criterion
suitable for gathering evidence for the criterion-related validity of the retained and unretained items.
Consequently, the FYI item-GOT scale correlations were examined to determine whether or not an item
manifested a higher correlation with the target RIASEC scale. Out of the 391 unretained items, 65
(16.6%) failed to meet this criterion, while among the 124 retained items, only 4 (3.2%) failed to meet
this criterion. This difference is highly significantly different χ2 (1, N = 515) = 13.433, p < .001,
indicating that more retained items met the criterion than did unretained items.
Retained items demonstrated greater evidence of content validity than did the unretained items.
According to the joint testing standards described earlier (American Psychological Association, 1999),
content-related evidence of validity demonstrates the degree to which the items represent the
appropriately defined domain. After an extensive review of the RIASEC-based literature and other
RIASEC-based assessments, definitions for the six scales were written to be descriptive and
comprehensive. Six domain blueprints were developed and used in the process of evaluating the coverage
of items for each scale. Expert judgment, along with psychometric and statistical analyses helped ensure
the retained items provided both balanced and comprehensive coverage of the RIASEC domains. After
further discussion and review of the statistical analyses, the panel eliminated another four items, leaving a
final count of 120 retained items
Summary. The statistical and psychometric comparison of the 124 selected vs. the 391 unselected
items showed that the selected items: (a) referenced more appealing activities; (b) evidenced smaller
gender differences; (c) evidenced smaller race/ethnic differences; (d) created more internally consistent
scales; (e) demonstrated greater evidence of construct validity; (f) demonstrated greater evidence of
criterion validity; and, (g) demonstrated greater evidence of content validity than did the unselected items.
Consequently, the 120 retained items were judged as meeting the stringent criteria for inclusion into the
next stage of the validation effort: Phase III, in which the items would be administered, along with the SII

FYI Validation 26
to another large, diverse national sample of high school students in order to select the final 90 best
functioning items to constitute the FYI.
Study II: Form Tryout Study
The major purpose of the Form Tryout Study was to assess the psychometric characteristics of the
items based on a new nationally representative sample. The final 90-item form of the FYI could then
contain the items with the best psychometric indices of reliability and validity.
METHOD
Participants
High school students recruited from 19 schools in 19 cities across 28 states (N = 1,952) constituted
the sample for this study. The sample consisted of approximately equal numbers of female adolescents
(52%; n = 1,103) and male adolescents (48%; n = 945). Most students were sophomores (43%; n = 849),
juniors (42%, n = 825) or seniors (14%; n = 277). The mean age was 15.9 years (SD = 0.9 years.)
Ethnically, the sample consisted mostly of Caucasian students (86%; n = 1,682), with relatively small
numbers of American Indians (4%; n = 76), African Americans (6%; n = 112), 27%; Hispanic Americans
(11%; n = 206), Asian Americans (1%; n = 69), Native Hawaiian/Pacific Islanders (1%; n = 18), and
students from other racial/ethnic descents or who declined to provide information about their racial/ethnic
descent (1%; n = 13). Because participants could elect to self-identify as a member of several different
ethnic/racial categories, these numbers and percentages should be viewed accordingly. Geographically,
the sample evidenced considerable diversity, with well over a third (45%; n = 889) from rural schools and
from urban schools (44%; n = 858), and about one-tenth (11%; n = 211) from suburban schools. There
was considerable regional diversity as well, with about one-sixth of the students each from the New
England (14%; n = 264), Mid-Atlantic (14%; n = 275), Southeastern (17%; n = 329), South Central (13%;
n = 245), and Western states (15%; n = 298), and about one quarter from the North Central states (27%, n
= 528). Very few students were from the Northwest Central states (1%, n = 19). Participants were
primarily enrolled in public (89%; n = 1,746) rather than private (11%; n = 212) schools.
Procedures

FYI Validation 27
As in the previous study, participants completed the retained FYI items, placed into the Career
Exploration Program Interest Inventory (CEPII), the Strong Interest Inventory (SII; Harmon, Hansen,
Borgen, & Hammer, 1994) and a series of background items from which demographic diversity could be
determined. Data were collected in schools from January through May of 2005.
Item placement in the CEPII was according to the RIASEC order in which the RIASEC order was
repeated every six items. This helped to ensure that the participants would not develop stereotypic
responses to the items. To help ensure that the FYI would assess interest rather than competence or
aptitude, participants were again told: “Don’t be concerned with how well you would do any activity or
whether you have the experience or training to do it. Just think about how much you would like or dislike
doing the activity.” Designed primarily for high school aged students who range in age from 15 to 19, the
items employed a three-point scale of Like (“I would like to do this activity”), Indifferent (“I don’t care
one way or the other”), and Dislike (“I would not like to do this activity”). A counterbalanced design used
to ensure the order of administration of the two instruments was not a factor in students’ responses. The
order of administration was randomly assigned using school as the unit of analysis.
RESULTS
Prior to any analyses, this large and diverse sample was weighted to be nationally representative.
Weights were calculated for each respondent based on three key demographic characteristics: (a) type of
school attended (public, private); (b) geographic setting of the school (rural, urban, suburban); and, (c)
geographic region of the school (New England, Mid-Atlantic, Southeastern, North Central, South Central,
Northwest Central, Western.) Psychometric and statistical analyses of these weighted data provide
descriptive characteristics of the FYI scales, the reliability of the scores produced by the FYI, and
evidence for the validity of the FYI as a measure of the RIASEC constructs described by Holland’s
theory.
As before, the initial statistical and psychometric characteristics of the 120 items were calculated and
discussed by the judges. In selecting the final 90 form of the FYI, great care was taken to help ensure that
the FYI was equally useful for all students, regardless of their gender or racial/ethnic heritage. Item-level

FYI Validation 28
means, item-to-scale correlations, hexagonal pattern correlations, and reliability indices were calculated
and used to eliminate items that would tend to favor one group of students over another group of students.
These statistical procedures, used in concert with expert judgment, created an item selection process that
gave preference to items that assessed the RIASEC constructs equally well across the gendered and
race/ethnic groups represented in the sample. After considerable discussion and deliberation, the judges
reached an easy consensus concerning which 15 items would be retained for each of the six RIASEC
domains to constitute the final form of the FYI. Table 4 reports descriptive information on the resulting
FYI scales.
Table 4
FYI Raw Score Scale Means, Standard Deviations, and Reliability Coefficients
FYI Scale FYI Scale Correlationsa
FYI Scale Mean SDb R I A S E C
Realistic (R) 9.82 8.92 .94 .31 .13 -.01 .09 .17
Investigative (I) 10.07 9.10 .94 .40 .21 .26 .18 Artistic (A) 11.73 8.76 .92 .44 .38 .12
Social (S) 12.11 9.20 .94 .43 .32 Enterprising (E) 9.55 8.06 .92 .57
Conventional (C) 7.33 7.72 .94 Note. N = 1,958 weighted analysis. FYI = Find Your Interests inventory. aCoefficient alpha (α) appears on the diagonal. bSD = standard deviation.
Several conclusions can be drawn from the material in Table 4. First, it is interesting to compare the
actual FYI scale means, standard deviations and coefficients alpha with the “prediction” of those values
derived from the Item Tryout data in Phase II (see Table 3). While there are some differences to be sure,
one is struck by the accuracy of the predictions. The magnitude of the differences between the predicted
and obtained scale means, for example, ranges from .12 (Realistic) to 1.27 (Enterprising). As the scales
range in magnitude from 0 – 30, this constitutes impressively accurate predictions. Further, the pattern of
the means is quite similar (r = .85, p < .05) further evidence for the validity of the estimation procedure.

FYI Validation 29
Similar findings emerge from a comparison of the estimated and obtained standard deviations. However,
the predicted coefficients alpha seriously underestimated the obtained coefficients.
Second, the correlations among the several RIASEC scales tend to be rather modest in magnitude,
with an average correlation of .27, lower than for many other RIASEC-based inventories. This is
important because it will enhance the differential validity of the scales for career counseling purposes: if
the scales were too highly correlated it would suggest that an individual with a high score in one domain
also would have high scores in the other domains. His would make exploration based on high scores
difficult, since it would in essence say: “Go explore everything.” Modest intercorrelations suggest that
participants will receive scores that will enhance and facilitate, rather than impede career exploration
(Wall, Wise, & Baker, 1996).
FYI Reliability
Coefficient alpha (Cronbach, 1951) is perhaps the most widely-used of all of the estimates of internal
consistency (Pedhazur & Schmelkin, 1991). Alpha theoretically ranges from a low of 0 to a high of 1,
with higher values indicating higher levels of internal consistency. An alpha of .80 indicates that 80% of
the variance of the measure is systematic. Consequently, this 80% represents the upper limit of the
variance that can be “explained” or related to other constructs and variables.
Based on the data from the Form Tryout and Validation study, the FYI scales exhibited a high degree
of internal consistency as assessed by alpha. By itself, however, a high value of alpha is not a sufficient
indicator of internal consistency, since even unrelated items in sufficient quantity can produce high alpha
coefficients (Lord & Novick, 1968). Therefore, another indicator of internal consistency (item-to-scale
correlations) was used to assess the internal consistency of the scales. High item-to-scale correlations
suggest internal consistency regardless of the number of items in the scale (Feldt & Brennan, 1989). As
shown in Table 4, the internal consistency of the scales, as assessed by coefficient alpha, ranged from .92
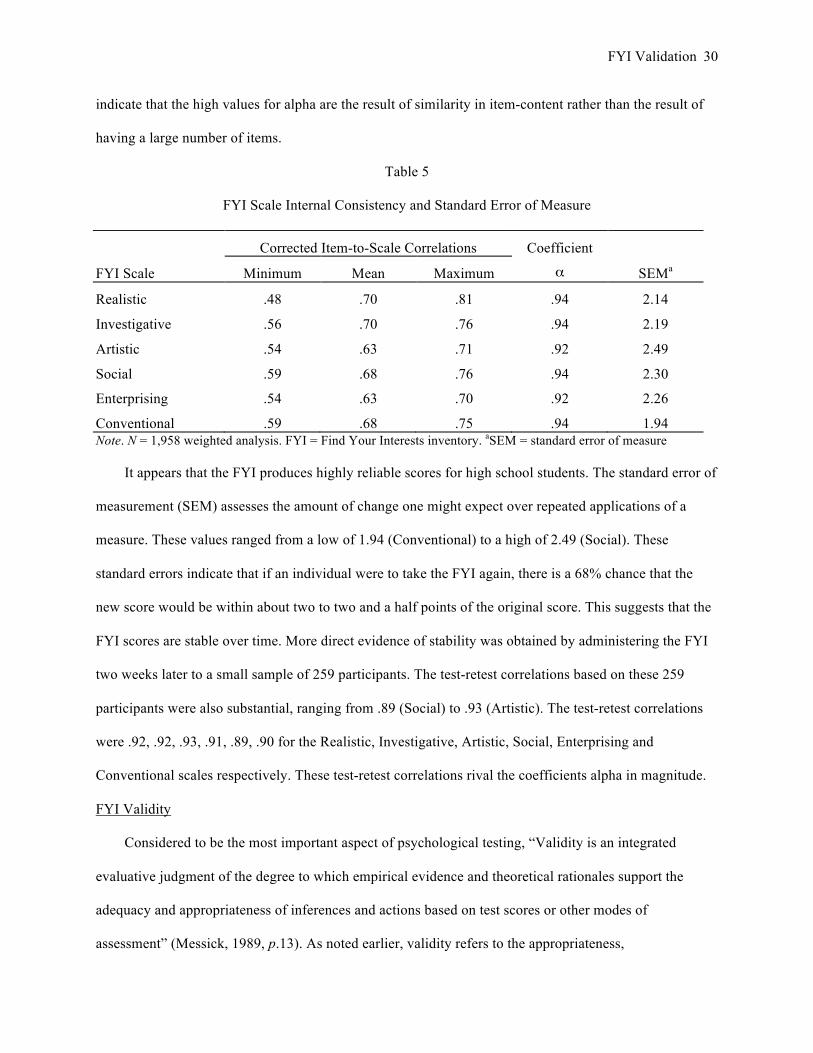
to .94. Additionally, Table 5 reports the minimum, average, and maximum corrected item-to-scale
correlations. These values not only attest to the internal consistency of the Interest-Finder, but also
FYI Validation 30
indicate that the high values for alpha are the result of similarity in item-content rather than the result of
having a large number of items.
Table 5
FYI Scale Internal Consistency and Standard Error of Measure
Corrected Item-to-Scale Correlations Coefficient
FYI Scale Minimum Mean Maximum α SEMa
Realistic .48 .70 .81 .94 2.14
Investigative .56 .70 .76 .94 2.19
Artistic .54 .63 .71 .92 2.49
Social .59 .68 .76 .94 2.30
Enterprising .54 .63 .70 .92 2.26
Conventional .59 .68 .75 .94 1.94 Note. N = 1,958 weighted analysis. FYI = Find Your Interests inventory. aSEM = standard error of measure
It appears that the FYI produces highly reliable scores for high school students. The standard error of
measurement (SEM) assesses the amount of change one might expect over repeated applications of a
measure. These values ranged from a low of 1.94 (Conventional) to a high of 2.49 (Social). These
standard errors indicate that if an individual were to take the FYI again, there is a 68% chance that the
new score would be within about two to two and a half points of the original score. This suggests that the
FYI scores are stable over time. More direct evidence of stability was obtained by administering the FYI
two weeks later to a small sample of 259 participants. The test-retest correlations based on these 259
participants were also substantial, ranging from .89 (Social) to .93 (Artistic). The test-retest correlations
were .92, .92, .93, .91, .89, .90 for the Realistic, Investigative, Artistic, Social, Enterprising and
Conventional scales respectively. These test-retest correlations rival the coefficients alpha in magnitude.
FYI Validity
Considered to be the most important aspect of psychological testing, “Validity is an integrated
evaluative judgment of the degree to which empirical evidence and theoretical rationales support the
adequacy and appropriateness of inferences and actions based on test scores or other modes of
assessment” (Messick, 1989, p.13). As noted earlier, validity refers to the appropriateness,

FYI Validation 31
meaningfulness, and usefulness of the inferences made from test scores. Because validity emphasizes the
inferences based on the test scores rather than the scores themselves, it is not appropriate to talk about
validity as if it were a property of the test. Evidence for the validity of a scale or set of scales may be
found in three sets of relationships. First, the relationships among the items, and how the items are related
both to emerging scales and to other measures constitutes one arena from which evidence for validity can
be found. These relationships should be consistent with the expectations derived from the theory on
which they are founded and based. Second, the nature of the internal relationships among the scales
should conform to the expectations derived from the theory from which they emerged, and provides the
second arena in which to gather validity related information. Third, the ways in which the scales are
related to other measures of the same, or similar, constructs provides potential evidence for validity.
Most of the validity information presented here stems from two types of analyses: (a) FYI item and
scale internal relationships, and (b) relationships between FYI item/scales and the various scales in the
1994 version of the Strong Interest Inventory (SII; Harmon, Hansen, Borgen & Hammer, 1994). The SII
has three types of scales germane to FYI validity: General Occupational Theme (GOT) scales, the Basic
Interest Scales (BIS), and the 211 Occupational Scales. At the most general level are the six GOT scales
that correspond to the six RIASEC areas defined by Holland’s theory. The BIS are subdivisions of the
GOT scales. Each BIS covers a specific content area within a RIASEC domain. The BIS were designed to
flesh out each GOT scale by providing a more detailed look at each content area within that RIASEC
area. At the most specific levels are the 211 Occupational Scales. These assess the degree to which a
respondent mirrors the interests of men and women working in particular occupations. With all three of
these scales, the SII provides normative scores useful for drawing gender-specific comparisons with both
males and females. This allows for greater career exploration and understanding of how satisfied
respondents might be were they to enter the occupations and career fields assessed by the SII. Because
study participants completed both the SII and the experimental FYI inventory, validity analyses were
conducted using all three of the scale types from the SII for the total group and for each gender.

FYI Validation 32
FYI Content Validity
According to the joint testing standards described earlier, content-related evidence of validity
demonstrates the degree to which the items represent the appropriately defined domain. After an
extensive review of the RIASEC-based literature and other RIASEC-based assessments, definitions for
the six scales were written to be descriptive and comprehensive. Six domain blueprints were developed
and used in the process of evaluating the coverage of items for each scale. Expert judgment, along with
psychometric and statistical methods was employed to help ensure the items provided both balanced and
comprehensive coverage of the RIASEC domains.
Because the SII BIS provide a detailed look at each content area within that RIASEC area, the
relationships between the FYI and the BIS scales can be viewed as content-related evidence for the
validity of the FYI as a measure of Holland’s RIASEC domains. As shown in Table 6, each RIASEC
domain in the SII BIS has multiple scales (i.e., 3 to 5). The FYI scales were correlated with each of these
3 to 5 scales within each SII BIS scale. To summarize these findings, the median correlations were
calculated between each FYI scale and the SII BIS, grouped by RIASEC theme. These median
Table 6
Median Correlations Between Scores on the FYI and SII Basic Interest Scales
SII BIS Median Correlation with FYI Scales
RIASEC Domain Scalesa R I A S E C
Realistic (R) 5 .44 .24 .05 -.01 .13 .12
Investigative (I) 3 .25 .59 .29 .13 .31 .24
Artistic (A) 5 .06 .31 .72 .35 .24 .04
Social (S) 4 -.01 .22 .34 .62 .30 .24
Enterprising (E) 4 .10 .22 .33 .34 .67 .43
Conventional (C) 4 .13 .21 .17 .27 .52 .64 Note. N = 1,958 weighted analysis. aNumber of SII BIS in the RIASEC domain. Corresponding RIASEC scales are bolded for ease of interpretation.
correlations ranged in magnitude from .44 (Realistic) to .72 (Artistic) and are highly statistically
significant (p < .001). The median correlations between the corresponding SII BIS and FYI scales were

FYI Validation 33
substantially higher than were the median correlations for the non-corresponding scales. Both of these
findings provide important content-related validity evidence supporting that the FYI scales assess
important content areas within each of the RIASEC areas – the essence of content validity.
FYI Criterion Validity
Criterion-related evidence of validity refers to the degree to which the scores on a measure are
systematically related to one or more appropriate outcome criteria. Criterion-related evidence for the
validity of new instruments is often more difficult to obtain than either content- or construct-related
evidence of validity. Certainly, if the FYI could be shown to predict accurately what jobs people entered,
it would constitute evidence for criterion-related validity. As a new instrument, such data are not
available.
However, an examination of the relationship between FYI scores and the SII Occupational Scales
provides considerable criterion-related evidence for the validity of the FYI as a measure of the RIASEC
domains. The SII gender-specific Occupational Scales were designed to assess the degree to which
individuals match interests with professionals in the field. Because these occupations are classified
according to Holland interest codes, they may serve as criteria to be predicted by FYI scale scores through
correlational techniques. As shown in Table 7, each RIASEC domain in the SII Occupational Scales has
multiple scales (i.e., 27 to 44). The FYI RIASEC scales were correlated with each of these 27 to 44 scales
within each SII Occupational Scale. To summarize these findings, the median correlations were
calculated between each FYI scale and the SII Occupational Scales, grouped by RIASEC theme (see
Table 5).
As was the case with the BIS, the median correlations between the corresponding SII Occupation
and FYI scales were substantial in magnitude, ranging from .54 (Realistic) to .61 (Investigative, Artistic).
Further, they were substantially higher than were the median correlations for the non-corresponding
scales. These results not only provide substantial criterion-related validity evidence, they also suggest the
possibility that FYI scales may be able to predict satisfaction and persistence in certain occupations. This
is because the SII Occupational Scales originally were designed to be predictive of persistence and job

FYI Validation 34
satisfaction in these particular career fields and occupations. (Harmon, Hansen, Borgen, & Hammer,
1994). Since they are also correlated with FYI scales in reliable and substantial ways, it seems reasonable
to believe that the FYI scales might be able to predict satisfaction and persistence in the same fashion.
Table 7
Median Correlations Between Scores on the FYI and SII Occupational Scales
SII Occupation Scales Median Correlation with FYI Scales
RIASEC Domain Scalesa R I A S E C
Realistic (R) 29 .54 .27 .01 .01 .02 .13
Investigative (I) 44 .28 .61 .23 .22 .16 .17
Artistic (A) 38 .02 .29 .61 .23 .18 -.04
Social (S) 36 .16 .24 .34 .51 .34 .20
Enterprising (E) 37 .19 .18 .25 .30 .55 .42
Conventional (C) 27 .11 .03 .05 .24 .38 .55 Note. N = 1,958 weighted analysis. aNumber of gendered SII Occupational Scales in the RIASEC domain. Corresponding RIASEC scales are bolded for ease of interpretation.
FYI Construct Validity: FYI Item Homogeneity
Evidence for the construct validity of a scale or set of scales may be found in the relationships
among the items, which constitutes one arena from which construct-related evidence for validity can be
found. These relationships should be consistent with the expectations derived from the theory on which
they are founded and based. Consistent with this understanding, Messick (1989) argues that item
homogeneity – internal consistency – is relevant validity information “because the degree of homogeneity
in the test, as we have seen, should be commensurate with the degree of homogeneity theoretically
expected for the construct in question” (p. 51). The coefficients alpha for the six RIASEC scales range
from .92 to .94. Because alpha is essentially the ratio of the sum of the common factor variances to total
variance (Cronbach, 1951), it suggests high values of alpha can function as a preliminary foundation from
which to argue for construct validity.

FYI Validation 35
FYI Construct Validity: FYI Item Correlations with Corresponding GOT Scales
One useful way to assess the construct validity of the FYI at the item level would be to assess the
relationships (correlations) between the FYI items and the SII GOT scales. Theoretically, the FYI items
should correlate more strongly with the corresponding GOY scales than with the other GOY scales. Table
8 summarizes these correlations. In fact, all 90 of the FYI items correlated more strongly with the
appropriate SII GOT scale than with any other SII GOT scale. These correlations provide substantial
amount of evidence in support of the FYI’s construct validity at the item level.
Table 8
Summary of FYI Item Correlations with SII GOT Scales
SII GOT Scales
FYI Scale R I A S E C
Realistic (R) .58 .17 .00 -.03 .11 .11
Investigative (I) .29 .55 .25 .14 .15 .18
Artistic (A) .07 .21 .59 .28 .21 .14
Social (S) -.15 .19 .33 .57 .26 .27
Enterprising (E) -.15 .21 .20 .26 .46 .40
Conventional (C) .07 .19 .05 .21 .41 .55 Note. N = 1,958 weighted analysis. FYI = Find Your Interests. SII GOT = Strong Interest Inventory General Occupation Theme Scales. Corresponding RIASEC scales are bolded for ease of interpretation.
FYI Construct Validity: FYI Item Hexagonality Index
Further construct-related evidence for the validity of the FYI items can be found by examining the
degree to which the FYI item-to-scale correlations match those specified by Holland’s hexagon theory.
Consistent with Westen and Rosenthal (2003), an item-level measure of construct validity is easily
created that assesses the degree to which an item’s correlations with the six RIASEC domains follow the
RIASEC pattern required by the theory. Westen and Rosenthal define ralerting-CV, which is a “simple
correlation between (a) the pattern of correlations predicted between the measure being validated and the
k variables correlated with that measure, and (b) the pattern of correlations actually obtained.” (p. 610,
emphasis in the original.) Based on what Holland has termed “the geometry of the hexagon,” each FYI

FYI Validation 36
item was correlated with the six RIASEC scale scores. These correlations were expected to mirror their
placement on the hexagon, correlating highest with their respective RIASEC domain, second highest with
the two adjacent RIASEC domains, third highest with the two alternate RIASEC domains, and least with
the opposite RIASEC domain. Theoretically, each item should correlate most strongly with its FYI target
scale, followed in magnitude by the correlations with the two adjacent FYI scales, the two alternate FYI
scales, and lowest with the opposite FYI scale. The degree to which an item’s correlations with the FYI
scales match these expectations is the degree to which the item exhibits the pattern of correlations
expected by Holland’s theory. Many measures expect their RIASEC scales to exhibit this property, but no
other RIASEC measure reports the degree to which each of the items exhibit this property. Based on the
pattern correlation between the observed and expected item-to-FYI scale correlations, it appears that all
90 of the FYI items exhibit a high degree of “hexagonality,” as assessed by the overall median pattern
correlation across all 90 items (r = .84). The median pattern correlations for each scale separately were
.85, .80, .86, .95, .82, and .81 respectively for the Realistic, Investigative, Artistic, Social, Enterprising,
and Conventional scales respectively.
FYI Construct Validity: FYI Item-Level Exploratory Factor Analysis
Prior to factoring the FYI items, the Kaiser-Meyer-Olkin measure of sampling adequacy (KMO) and
the Bartlett test of sphericity were calculated. These tests help to assess the degree to which a correlation
matrix is suitable for factor analytic exploration (Dzuiban & Shirkey, 1974). The values of both indicated
that factor analysis was highly appropriate given the correlation matrix. The KMO, which ranges from
zero to one, was .96, which Kaiser (1974) describes as “marvelous” (p.33) and the Bartlett test of
sphericity yielded a highly significant result (p < .00001). The items were then submitted to a maximum
likelihood factor analysis. Consistent with Hansen and Roberts’ (2006) recommendations for best
practices with exploratory factor analysis, multiple criteria were used to determine the number of factors
to extract: (a) Parallel Analysis, (b) the Scree test, and (c) an examination of the residual matrix. Based on
convergence across these three criteria, six factors accounting for 51.15% of the variance, were extracted
(λ = 18.46, 10.03, 8.26, 5.14, 4.15, 2.88.) As an explicit measure of the adequacy of the solution, the

FYI Validation 37
residual correlation matrix was calculated based on the six-factor solution. If the factor solution is
adequate, the residuals should be fairly close to zero, indicating that the extracted factors do indeed
account for the observed correlations. If the residuals are relatively small, additional factors, even when
statistically significant, do not appreciably improve the solution. In the present case, the residual matrix
contained a relatively small number (5%) of residual correlations larger than .05, suggesting that retaining
additional factors would probably add little to the adequacy of the obtained solution.
Because Holland’s theory explicitly defines that the underlying factors are correlated in specific
ways, the six factors were rotated to simple structure via the Promax criterion. The items with loadings of
absolute value of .40 or higher were used to define the content of each of the six factors. Using this
criterion, all 90 of the FYI items exhibited the expected loadings on the appropriate factors. This analysis
is summarized in Table 9. (Full results are reported in Appendix B.)
Table 9
Summary of Item-Level Factor Analyses of the FYIa Scales
Median Factor Pattern Coefficients
FYI Scale R I A S E C
Realistic (R) .63 .01 -.02 .01 .01 .06
Investigative (I) .00 .73 -.01 .00 .01 .01
Artistic (A) .02 .01 .74 .01 .01 -.02
Social (S) .02 .00 .01 .72 .01 .04
Enterprising (E) .00 .00 .01 .02 .63 .00
Conventional (C) .15 .02 -.02 .01 .01 .61 Note. N = 1,958 weighted analysis. aFYI = Find Your Interests. Factors placed in RIASEC order for ease of interpretation. Corresponding RIASEC scales are bolded for ease of interpretation.
Because the factors were rotated to simple structure by Promax, the factors are not orthogonal. Table
10 reports the correlations among the factors. As can be seen, the correlations are of low to moderate
magnitude, with a median correlation of .21, also indicative of a low to moderate correlation.
Given that one of the major tenets of the theory is that the relationship among the RIASEC domains
is hexagonal in nature, one might expect that the factor intercorrelations should be consistent with the

FYI Validation 38
appropriate hexagonal arrangement of the factors. To test this, the factor correlations were submitted to
Myors’ (1996) test of hexagonal arrangement. The test indicated that the factor intercorrelations were
consistent with what one would expect based on Holland’s hexagonal arrangement of the RIASEC
domains rs(13) = .74, p < .002, providing additional construct-related evidence for the validity of the FYI
as a measure of the Holland domains.
Table 10
FYI Promax Rotated Factor Intercorrelations
Factor R I A S E C
Realistic (R) 1.00 .33 .12 -.05 .05 .20
Investigative (I) 1.00 .38 .17 .24 .16
Artistic (A) 1.00 .43 .36 .08
Social (S) 1.00 .40 .29
Enterprising (E) 1.00 .52
Conventional (C) 1.00 Note. N = 1,958 weighted analysis. FYI = Find Your Interest Inventory; R = Realistic factor, I = Investigative factor, A = Artistic factor, S = Social factor, E = Enterprising factor, C = Conventional factor. The factors have been placed in RIASEC order rather than in the order they emerged from the rotation.
FYI Construct Validity: GOT Marker Variable FYI Item-Level Exploratory Factor Analysis
This exploratory factor analysis was repeated, adding in the SII GOT scales as “marker variables” to
mark the content domain of the factors that emerge. As before, the correlation matrix showed itself to be
suitable for such exploratory factor analysis, with an extremely hi KMO (.96) and significant Bartlett’s
test of sphericity (p < .0001). Again, the three criteria for factor extraction agreed on a six-factor solution,
with similar indices as before. Summarized in Table 11, this factor analysis yielded near-identical results,
again with all 90 of the FYI items loading on the factor “marked” by the corresponding SII GOT scale.
(See Appendix C for complete results.) The results of this factor analysis provide substantial evidence for
the construct validity of the FYI at the item level.

FYI Validation 39
Table 11
Summary of Item-Level Factor Analyses of the FYIa Scales
With SII GOT Scales as Marker Scales
Median Factor Pattern Coefficients
Scale R I A S E C
GOT Marker Scale .72 .72 .88 .73 .47 .70
FYI Realistic (R) .64 .00 .00 -.02 .00 .05
FYI Investigative (I) -.01 .74 .01 -.02 .02 .02
FYI Artistic (A) .01 .01 .71 .02 -.01 .03
FYI Social (S) .01 .02 .01 .74 .03 -.03
FYI Enterprising (E) .00 .01 .00 .00 .63 .01
FYI Conventional (C) .15 .02 .01 -.03 .00 .62 Note. N = 1,958 weighted analysis. aFYI = Find Your Interests. Factors placed in RIASEC order for ease of interpretation. Corresponding RIASEC scales are bolded for ease of interpretation.
FYI Construct Validity: FYI Item-Level Confirmatory Factor Analysis
Confirmatory factor analysis (CFA) is grounded in a hypothesis testing tradition and tests specific
hypothesis about both the number and content of underlying common factors in a measure. Specifically,
CFA was employed to test the six-factor model that specified each FYI item would load solely on it’s
target factor. The CFA was conducted with both an orthogonal restraint on the resulting factors, and with
no such restraint, using robust maximum likelihood estimation procedures. The results of both analyses
were quite similar. The results of the unconstrained CFA are reported here.
The explicit factor model submitted to CFA (EQS 6.1 for Windows) was that the factors that
underlie the FYI in this sample are the six RIASEC domains composed of the appropriate FYI items.
Based on standard rule-of-thumb practices, Schumacker and Lomax (2004) suggested three criteria for
assessing the adequacy of the model fit to the data. The first criterion is the overall test of significance of
the model fit to the data. Nonsignificant results with a corresponding low error term suggest an adequate
fit to the data. In the present case, the global index suggested a poor degree of fit of the three-factor model
to the data, Satorra-Bentler Scaled χ2(3,900, N = 1,958) = 17,903.81, p < .0001. However, because this

FYI Validation 40
model fit index is highly sensitive to the sample size, it often is divided by the corresponding degrees of
freedom to calculate an adjusted value “free” of the inflation due to sample size. In the present case this
adjusted value, χ2 = 4.59, also was somewhat higher than the value (1.0) generally hoped for as a measure
of good fit. The other major index of overall fit, the root-mean-square-error (RMSEA = .042), however,
was considerably lower than the value of .10 advocated as a rule of thumb by Schumacker and Lomax.
Their third criteria consists of an examination of various fit indices, with a cutoff value of at least .90 for
such indices as the Bentler-Bonet normed fit index (NFI), Tucker-Lewis index (TLI), comparative fit
index (CFI), goodness of fit index (GFI), and the adjusted goodness of fit index (AGFI).
Such rules-of-thumb, however, have been questioned seriously on both theoretical and empirical
grounds. Recently, Hu and Bentler (1999) tested the adequacy of such rules-of-thumb in a large-scale
study employing simulated data. They tested how well the various practices were able to detect
misspecification errors in model fit using the various rule-of-thumb approaches. Based on their results,
the various standard rules (e.g., those advocated by Schumacker and Lomax, 2004) had high
misspecification errors. That is, the application of these sorts of rules led to relatively high rates of either
or both Type I and Type II errors. The results of their large-scale simulations and analyses led them to
conclude “we recommend that practitioners use a cutoff value close to .95 for TLI (BL89, RNI, CFI or
Gamma Hat [GFI]) in combination with a cutoff close to .09 for SRMR to evaluate model fit. In general,
a cutoff value of .96 for TLI, BL89, RNI, CFI or Gamma Hat [GFI], in combination with SRMR < .09 (or
.10) resulted in the least sum of Type I and Type II error rates” (p. 27). Using these guidelines, the results
appear less-than-satisfactory: CFI = .86, TLI = .86, NFI = .83. These values fall well below the .95
threshold recommended by Hu and Bentler (1999), though other equally important goodness-of-fit
measures fall well under the threshold of .09 they suggest: SRMR = .06, RMSEA = .04. Table 12
summarizes the results by reporting the standardized regression coefficients for each hypothesized
RIASEC factor. In this table the items refer to the targeted FYI scale items. For example, Item01 for
Realistic would refer to “Adjust bicycle gears,” which is the first Realistic item; for Investigative, Item01
would refer to “Investigate stars and black holes,” the first Investigative item. This short-hand way of

FYI Validation 41
tabling the CFA item-level parameters makes clear that the appropriate FYI items “loaded” on the
appropriate hypothesized factors. Appendix D reports the results in the more typical tabled form.
Table 12
Summary CFA Standardized Regression Coefficients
Hypothesized RIASEC Factors
Scale Item R I A S E C
Item01 .63 .66 .66 .74 .63 .60
Item02 .73 .63 .61 .57 .64 .71
Item03 .76 .65 .67 .78 .55 .64
Item04 .49 .59 .60 .62 .61 .73
Item05 .72 .76 .71 .64 .70 .72
Item06 .78 .74 .72 .64 .67 .77
Item07 .84 .74 .68 .81 .73 .72
Item08 .82 .74 .63 .71 .63 .64
Item09 .81 .78 .62 .74 .70 .65
Item10 .75 .74 .68 .62 .70 .76
Item11 .62 .76 .72 .74 .71 .76
Item12 .83 .76 .69 .65 .63 .69
Item13 .58 .80 .68 .77 .65 .79
Item14 .65 .72 .62 .79 .70 .67
Item15 .79 .81 .56 .78 .73 .76 Note. N = 1,958 weighted analysis. R = Realistic, I = Investigative, A = Artistic, S = Social, E = Enterprising, C = Conventional. Item01 – Item15 refer to the targeted FYI scale items.
Consequently, it appears the model of six factors, with each factor representing one RIASEC domain
should be rejected. However, Lee and Ashton (2007) argue persuasively that the standard CFA goodness-
of-fit indices are overly conservative when used with multi-item/multi-factor inventories, noting that
“CFA frequently fails in these cases, by rejecting factor structures that clearly replicate across different
types of participant samples“ (p. 437). It may have to do with the loadings and with the correlations
among the factors. As such, they recommend caution in rejecting the model solely based on goodness of
fit indices. In such situations, it may be that that the construct validity or reliability of one or more of the
factors may be an issue (Hancock & Mueller, 2008). To assess this possibility, construct validities and

FYI Validation 42
reliabilities were calculated and assessed (see Table 13). Since the reliability and validity indices of the
model seem reasonable and mostly within recommended bounds, it appears that the model provides an
adequate fit to the data: all of the construct reliabilities are above .90, and only two of the six factors
(Artistic, .43; Enterprising, .44) failed to achieve the minimum recommended value of .50. To bolster this
conclusion, the present model with compared to alternate models with differing number of hypothesized
factors. These alternate models with varying number of factors were tested against the present model and
found to provide poorer fit to the data, suggesting the wisdom of Lee and Ashton’ caution concerning the
use of CFA in some situations.
Table 13
CFA Factor Intercorrelations and Construct Indices
CFA Factor Construct
CFA Factor R I A S E C Val Rel
Realistic (R) 1.00 .31 .08 -.17 -.08 .21 .53 .94
Investigative (I) 1.00 .40 -.03 .04 .12 .53 .94
Artistic (A) 1.00 .37 .37 -.23 .43 .92
Social (S) 1.00 .42 .05 .50 .94
Enterprising (E) 1.00 .62 .44 .92
Conventional (C) 1.00 .50 .94 Note. N = 1,958 weighted analysis. Val = Construct Validity; Rel = Construct Reliability.
Given that one of the major tenets of the theory is that the relationship among the RIASEC domains
is hexagonal in nature, one might expect that these factor intercorrelations also should be consistent with
the appropriate hexagonal arrangement of the factors. To test this, the factor correlations were submitted
to Myors’ (1996) test of hexagonal arrangement. The test indicated that the CFA factor intercorrelations
were indeed consistent with what one would expect based on Holland’s hexagonal arrangement of the
RIASEC domains rs(13) = .85, p < .001, providing additional construct-related evidence for the validity
of the FYI as a measure of the Holland domains.

FYI Validation 43
FYI Construct Validity: FYI – SII GOT Scale Relationships
As would be expected given the results of the factor analysis of the FYI items with the GOT marker
variables, the correlations for corresponding FYI and SII scales are very high - ranging from .68
(Enterprising) to .85 (Artistic) in magnitude. Each FYI scale also correlated more highly with its
respective SII GOT scale than with any of the other SII GOT scales (see Table 14). This provides further
evidence of the FYI’s validity as a measure of the RIASEC constructs and domains proposed in Holland’s
theory.
Table 14
FYI and SII GOT Scale Intercorrelations
FYI Scales SII GOT Scales
Scalesa R I A S E C R I A S E C
FYI R 1.00 .31 .13 -.01 .09 .17 .78 .24 .00 .00 .16 .15
FYI I 1.00 .40 .21 .26 .18 .36 .74 .34 .19 .21 .25
FYI A 1.00 .44 .38 .12 .08 .33 .85 .39 .31 .21
FYI S 1.00 .43 .32 -.18 .26 .43 .79 .36 .36
FYI E 1.00 .57 .08 .32 .30 .38 .68 .53
FYI C 1.00 .10 .27 .07 .31 .54 .75
GOT R 1.00 .37 .02 -.06 .23 .20
GOT I 1.00 .35 .33 .33 .46
GOT A 1.00 .49 .37 .29
GOT S 1.00 .47 .49
GOT E 1.00 .70
GOT C 1.00 Note. N = 1,958 weighted analysis. aFYI = For Your Interest; R = Realistic; I = Investigative; A = Artistic; S = Social; E = Enterprising; C = Conventional; SII = Strong Interest Inventory; GOT = SII General Occupational Theme Scale. Corresponding RIASEC scales are bolded for ease of interpretation.
FYI Construct Validity: Shape of the RIASEC Hexagon
Multidimensional scaling techniques (MDS) were used to assess the degree to which the FYI scales
fit the hexagonal pattern hypothesized by Holland (1997). This was accomplished by using MDS to
determine the number of independent stimulus dimensions that explain how the RIASEC types differ

FYI Validation 44
from each other. Holland’s model, because it is in two-dimensional space, specifies two stimulus
dimensions that underlie the similarities and dissimilarities among the six RIASEC types. Holland’s
model further postulates that when mapped onto these two stimulus dimensions, the RIASEC types form
a hexagon. The MDS analysis of the FYI scales yielded a two-dimensional solution. Based on the
Euclidean distance matrix, the two-dimensional model provided an almost perfect fit to the data. Tucker’s
coefficient of congruence, a measure of the goodness of fit between the data and the MDS solution, was
.99, close to its maximum possible value of 1.0 which indicates a perfect fit between the data and the
MDS solution. This high degree of fit also was demonstrated by the low value of the stress index (.013).
The stress value indicates how much the process has to distort the data to come up with the solution. High
stress values mean that the analysis is an inadequate representation of the original data because data fit
only when strained to do so. Based on Kruskal and Wish’s (1978) recommendation that solutions with
stress values less than .10 are adequate solutions, these two stimulus dimensions were retained. Together,
they accounted for 98.7% of the variance. These dimensions correspond substantially to the generally-
accepted view that the hexagon can be described by two bi-polar axes: (a) data vs. ideas, and (b) things
vs. people (Prediger, 1982). As shown in Figure 1, this correspondence is seen in the extremely high
correlations between the FYI dimensions and what would be expected from a “perfect” hexagon (r = .98
and r = .94 for the two dimensions respectively.)The MDS results also were quite consistent with the
empirical findings reported by Rounds and Tracey (1993) based on their meta analysis of RIASEC
instruments. As shown in Figure 2, the FYI dimensions also correlated quite highly with those reported
by Rounds and Tracey (r = .99 and r = .97 for the two dimensions respectively.) Therefore, like virtually
all RIASEC inventories (Rounds & Tracey, 1993), the FYI can best be described as a misshapened
hexagon (see Figure 1). Fortunately, the theory does not require it to be a “perfect” hexagon (Holland,
1997; Holland &Gottfredson, 1982).

FYI Validation 45
Figure 1. FYI Fit to the Ideal Hexagon

FYI Validation 46
Figure 2. FYI Fit to the Rounds and Tracey (1993) Model
Additionally, Myors’(1996) test of hexagonal structure yielded a significant value (r = .67, p <
.007), indicating the pattern of FYI scale correlations are consistent with the pattern one would expect
based on Holland’s hexagonal model. In this model, adjacent scales have higher correlations than do
alternate scales, which in turn, have higher correlations than do opposite scales on the hexagon.
These results provide support for two conclusions. First, the FYI exhibited the same type of
hexagonal shape exhibited by other RIASEC-based inventories. This is based on the high degree of

FYI Validation 47
correspondence between the FYI and the meta-analytic findings reported by Rounds and Tracey (1993).
Second, the shape of the FYI is consonant with expectations based on RIASEC theory as proposed by
Prediger (1982). Consequently, it seems reasonable to conclude that the shape of the FYI is also
hexagonal in nature, providing further construct-related evidence supporting the validity of the FYI as a
measure of the RIASEC constructs.
DISCUSSION
Summary of FYI Reliability. Based on two large national samples of high school students, the FYI
scales evidence substantial levels of both internal consistency (all α > .92) and test-retest reliability (all r
> .89). Given that each FYI scale consists of 15 items responded to in a three-point metric, such indices
are impressive.
Summary of FYI Validity. Based on two large national samples of high school students, the FYI: (a)
is composed of six factors with each factor representing one RIASEC domain; (b) has a hexagonal shape;
and, (c) has substantial relationships with the 1994 Strong Interest Inventory. Throughout the analyses,
consistent content, criterion, and construct-related evidence for the validity of the FYI have been
presented.

FYI Validation 48
REFERENCES
American Psychological Association. (1999). Standards for educational and psychological testing.
Washington, DC: Author.
Baker, H. E. (2002). Reducing adolescent career indecision: The ASVAB Career Exploration
Program. The Career Development Quarterly, 50, 359-370.
Bingham, R. P., & Krantz, J. (2001). Career and vocational assessment 1997-1998: A biennial
review. Journal of Career Assessment, 9, 1-24.
Brown, D., & Gore, A. (1994). An evaluation of interest congruence indices: Distribution
characteristics and measurement properties. Journal of Vocational Behavior, 45, 310-327.
Clark, L. A., & Watson, D. (1995). Constructing validity: Basic issues in objective scale
development. Psychological Assessment, 7, 309-319.
Cronbach, L. J. (1951). Coefficient alpha and the internal structure of tests. Psychometrika, 16, 297-
334.
Defense Manpower Data Center. (2005). ASVAB Career Exploration Counselor Manual. North
Chicago, IL: HQ USMEPCOM.
DeVellis, R. F. (2003). Scale development: Theory and applications (2nd ed.). Thousand Oaks, CA:
Sage Publications.
Dziuban, C. D., & Shirkey, E. C. (1974). When is a correlation matrix appropriate for factor analysis? Some decision rules. Psychological Bulletin, 81, 358-361.
Erikson, E. H. (1968). Identity, youth and crisis. New York: Norton.
Gottfredson, G. L. (1999). John L. Holland’s contributions to vocational psychology: A review and
evaluation. Journal of Vocational Behavior, 55, 15–40.
Hambleton, R. K., Swaminathan, H., & Rogers, H. J. (1991). Fundamentals of item response theory.
Newbury Park, CA: Sage Publications.
Hancock, G. R., & Mueller, R. O. (2008). Structural equation modeling: The first course. Maryland:
The Department of Measurement, Statistics and Evaluation, University of Maryland, College Park.

FYI Validation 49
Hansen, J. C., & Campbell, D. P. (1985). Manual for the Strong Interest Inventory (4th ed.) Palo
Alto, CA: Consulting Psychologists Press, Inc.
Harmon, L. W. (1999). Measuring interests: Approaches and issues. In M. L. Savickas & A. R.
Spokane (Eds.), Vocational interests: Meaning, measurement and counseling use (pp. 171-191). Palo
Alto: Davies-Black.
Harmon, L. W., Hansen, J. C., Borgen, F. H., & Hammer, A. L. (1994). Strong Interest Inventory:
Applications and technical guide. Palo Alto, CA: Consulting Psychologists Press.
Holland, J. L. (1959). A theory of vocational choice. Journal of Counseling Psychology, 6, 35-44.
Holland, J. L. (1973). Making vocational choices: A theory of vocational personalities and work
environments. Englewood Cliffs, NJ: Prentice-Hall.
Holland, J. L. (1985). Making vocational choices: A theory of vocational personalities and work
environments (2nd ed.). Englewood Cliffs, NJ: Prentice-Hall.
Holland, J. L. (1997). Making vocational choices: A theory of vocational personalities and work
environments (3rd ed.). Odessa, FL: Psychological Assessment Resources.
Holland, J. L., & Gottfredson, G. D. (1992). Studies of the hexagonal model: An evaluation: or The
perils of stalking the perfect hexagon. Journal of Vocational Behavior, 40, 158-170.
Hu, L., & Bentler, P. M. (1999). Cutoff criteria for fit indexes in covariance structure analysis:
Conventional criteria versus new alternatives. Structural Equation Modeling, 6, 1-55.
Kaiser, H. F. (1974). An index of factorial simplicity. Psychometrika, 39, 31-36.
Kaplan, P. S. (2004). Adolescence. New York: Houghton Mifflin.
Kerlinger, F. N. (1986). Foundations of behavioral research (3rd ed.). New York: Holt, Rinehart and
Winston.
Kroger, J. (2000). Identity development: Adolescence through adulthood (2nd ed.). Thousand Oaks,
CA: Sage.
Kruskal, J. B. (1964). Multidimensional scaling by optimizing goodness of fit to a nonmetric
hypothesis. Psychometrika, 29, 1-27.

FYI Validation 50
Lee, K., & Ashton, M. C. (2007). Factor analysis in personality research. In R. W. Robins, R. C.
Fraley, and R. F. Krueger (Eds.), Handbook of research methods in personality psychology (pp. 424-443).
New York: The Guilford Press.
Lord, F. M., & Novick, M. R. (1968). Statistical theories of mental test scores. Reading, MA:
Addison-Wesley.
Messick, S. (1989). Validity. In R. L. Linn (Ed.) Educational measurement (3rd ed., pp. 13-104).
New York: McMillan.
Myors, B. (1996). A simple, exact test for the Holland Hexagon. Journal of Vocational Behavior, 48,
339-351.
Pedhazur, E. J., & Schmelkin, L. P. (1991). Measurement, design, and analysis: An integrated
approach. Hillsdale, NJ: Lawrence Erlbaum.
Pommerich, M. (2004). Using item-response theory to develop and interest inventory. Presented at
the International Military Testing Association conference, Brussels, Belgium.
Prediger, D. J. (1982). Dimensions underlying Holland's hexagon: Missing link between interests
and occupations? Journal of Vocational Behavior, 21, 259-287.
Prediger, D. J., & Vansickle, T. R. (1992). Locating occupations on Holland's hexagon: Beyond
RIASEC. Journal of Vocational Behavior, 40, 111-128.
Rounds, J., & Tracey, T. J. (1993). Prediger’s dimensional representation of Holland’s RIASEC
circumplex. Journal of Applied Psychology, 78, 875-890.
Schumacker, R. E., & Lomax, R. G. (2004). A beginner’s guide to structural equation modeling
(2nd. Ed.). Mahwah, NJ: Erlbaum.
Sharf, R. S. (2006). Applying career development theory to counseling. Belmont, CA: Thompson.
Simms, L. J., & Watson, D. (2007) The construct validation approach to personality scale
construction. In R. W. Robins, R. C. Fraley, and R. F. Krueger (Eds.), Handbook of research methods in
personality psychology (pp. 240-258). New York: The Guilford Press.

FYI Validation 51
Spokane, A. R., Luchetta, E. J., & Richwine, M. H. (2002). Holland’s theory of personalities and
work environments. In D. Brown and Associates (Eds.), Career choice and development: Applying
contemporary theories to practice (4th ed.) (pp. 373-426). San Francisco: Jossey-Bass.
Wall, J. E., & Baker, H. E. (1997). The Interest-Finder: Evidence of validity. Journal of Career
Assessment, 5, 255-273.
Wall, J. E., Wise, L. L., & Baker, H. E. (1996). Development of the Interest-Finder -- a new
RIASEC-based interest inventory. Measurement and Evaluation in Counseling and Development, 29,
134-152.
Weinrach, S. G., & Srebalus, D. J. (1990). Holland’s theory of careers. In D. Brown, L. Brooks and
Associates (Eds.), Career choice and development: Applying contemporary theories to practice (2nd ed.)
(pp. 37-67). San Francisco: Jossey-Bass.
Westen, D. & Rosenthal, R. (2003). Quantifying construct validity: Two simple measures. Journal of
Personality and Social Psychology, 84, 608-618.

FYI Validation 52
Appendix A
FYI Items
RIASEC Domain Item Text
R Adjust bicycle gears R Repair a leaky faucet R Install kitchen cupboards R Operate a farm R Apply wood stains and varnishes to furniture R Repair household appliances R Build a deck for a house R Tile a kitchen floor R Use carpentry tools R Build a stone wall R Operate a riding mower R Refinish the floors in a house R Detail a car R Assemble playground equipment R Frame a house I Investigate stars and black holes I Discover a new strain of virus I Test DNA samples I Explore ancient ruins I Study an active volcano I Identify an unknown chemical substance I Conduct lab experiments I Study environmental science I Predict earthquakes I Analyze ocean currents I Study the effects of acid rain on plants I Observe and classify a new species I Study planetary storms I Observe and record animal life cycles I Study changes in Earth’s atmosphere A Paint portraits A Act on stage A Write a movie script A Compose music A Illustrate a book A Design a set for a play A Play a role in a musical A Attend a poetry reading

FYI Validation 53
RIASEC Domain Item Text
A Design a museum exhibit A Create sculptures A Direct a musical A Attend an art class A Write a short story A Film a documentary A Play in a jazz band S Help people resolve personal problems S Serve as a playground activity leader S Help people cope with loss S Volunteer for a local community service S Organize activities at a community center S Assist a teacher in the classroom S Teach people how to cope with stress S Help children with after-school homework S Counsel others about substance abuse S Take care of a disabled person S Teach parenting skills S Serve as a dormitory counselor S Lead a group therapy session S Mentor a troubled child S Reassure a nervous patient E Chair a committee meeting E Persuade committee members on an issue E Campaign for a political office E Manage a department in a company E Conduct a business seminar E Market new products to retail businesses E Give a sales presentation E Invest in new companies E Recruit new customers for a business E Give a press conference E Persuade someone to finance a business E Sell residential and business properties E Publicize an event E Plan meetings and conferences E Serve as a company’s spokesperson C Count and balance a cash drawer C Enter data in an accounting ledger C Count the inventory of a small business C Do accounting for a business
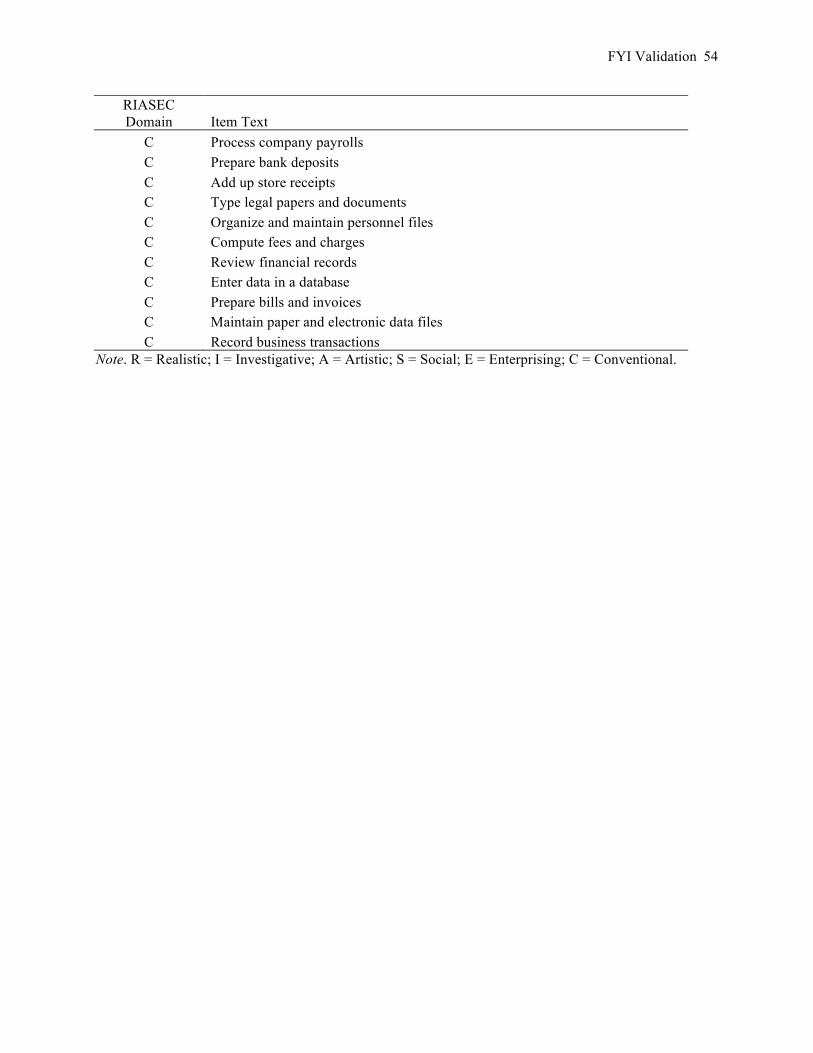
FYI Validation 54
RIASEC Domain Item Text
C Process company payrolls C Prepare bank deposits C Add up store receipts C Type legal papers and documents C Organize and maintain personnel files C Compute fees and charges C Review financial records C Enter data in a database C Prepare bills and invoices C Maintain paper and electronic data files C Record business transactions
Note. R = Realistic; I = Investigative; A = Artistic; S = Social; E = Enterprising; C = Conventional.

FYI Validation 55
APPENDIX B
FYI Item-Level Exploratory Factor Analysis Results
Promax Rotated Factor Pattern Coefficient Domain Item Text R I A S E C h2
R Adjust bicycle gears .62 .06 -.06 -.07 .01 .00 .41 R Repair a leaky faucet .73 .05 -.10 -.02 .07 -.04 .54 R Install kitchen cupboards .78 -.03 -.02 -.02 .02 .01 .59 R Operate a farm .47 .08 .01 .06 -.01 -.02 .25
R Apply wood stains and varnishes to furniture .71 -.03 .09 .06 -.11 .08 .54
R Repair household appliances .79 .03 -.09 .00 .04 .00 .62 R Build a deck for a house .87 -.01 -.06 .01 .07 -.09 .71 R Tile a kitchen floor .84 -.07 .02 .09 -.07 .05 .69 R Use carpentry tools .83 -.01 -.04 -.04 .05 -.10 .67 R Build a stone wall .72 .06 .08 -.06 .01 -.03 .57 R Operate a riding mower .63 -.02 .04 .00 .01 .03 .40 R Refinish the floors in a house .85 -.07 .01 .05 -.01 .01 .69 R Detail a car .54 .06 .06 -.13 .05 .00 .35 R Assemble playground equipment .64 .02 .07 .17 -.06 .05 .47 R Frame a house .81 -.03 -.01 -.01 .03 -.04 .64 I Investigate stars and black holes -.04 .63 .17 -.09 -.05 .02 .45 I Discover a new strain of virus -.04 .64 -.10 .09 .16 -.04 .44 I Test DNA samples -.08 .70 -.10 .13 .03 .05 .48 I Explore ancient ruins .02 .51 .20 -.08 .08 -.07 .39 I Study an active volcano .06 .71 .12 -.06 -.02 -.01 .59
I Identify an unknown chemical substance .01 .77 -.11 .01 .09 -.03 .57
I Conduct lab experiments .04 .76 -.11 .07 .02 -.01 .56 I Study environmental science .00 .76 -.05 .07 -.07 .02 .55 I Predict earthquakes .07 .75 -.01 -.02 .06 -.01 .61 I Analyze ocean currents .00 .73 .04 .00 -.08 .07 .55 I Study the effects of acid rain on plants .04 .75 -.03 .02 -.05 .02 .57 I Observe and classify a new species .01 .74 .05 .00 .01 -.02 .58 I Study planetary storms -.02 .79 .07 -.07 -.02 .02 .64 I Observe and record animal life cycles .00 .71 .02 .09 -.09 .03 .52 I Study changes in Earth’s atmosphere -.03 .82 .01 -.03 -.05 .02 .65 A Paint portraits .03 -.01 .71 .03 -.15 .10 .47 A Act on stage -.13 -.10 .59 .06 .17 -.10 .43 A Write a movie script -.02 .00 .64 -.13 .23 -.08 .47 A Compose music .03 -.01 .64 -.08 .00 .02 .37 A Illustrate a book .00 .02 .71 .00 -.03 .02 .50 A Design a set for a play .06 -.06 .71 .07 -.02 .00 .53

FYI Validation 56
A Play a role in a musical -.10 -.09 .69 .08 .00 .01 .49 A Attend a poetry reading -.07 .01 .56 .19 -.03 -.01 .43 A Design a museum exhibit .08 .27 .48 -.01 .08 .01 .47 A Create sculptures .13 .08 .69 -.02 -.10 .03 .52 A Direct a musical -.04 -.05 .72 .02 .05 -.03 .53 A Attend an art class .00 .03 .74 .04 -.18 .07 .51 A Write a short story -.04 .00 .62 .02 .12 -.05 .46 A Film a documentary .01 .09 .52 -.07 .23 -.03 .42 A Play in a jazz band .02 .09 .57 -.12 .03 .00 .34
S Help people resolve personal problems -.08 .05 -.04 .74 .08 -.06 .57
S Serve as a playground activity leader .15 -.06 .10 .58 -.12 .08 .37 S Help people cope with loss -.02 .05 -.07 .82 .03 -.08 .63
S Volunteer for a local community service .05 .03 .09 .56 .04 .02 .41
S Organize activities at a community center .04 -.04 .13 .52 .06 .15 .45
S Assist a teacher in the classroom .03 -.06 .11 .59 -.05 .11 .43 S Teach people how to cope with stress -.05 .02 -.05 .82 .06 -.07 .66
S Help children with after-school homework .00 -.01 .03 .72 -.14 .12 .52
S Counsel others about substance abuse -.02 .04 -.07 .74 .08 -.06 .55 S Take care of a disabled person .06 .04 -.06 .70 -.14 .06 .42 S Teach parenting skills .02 -.03 -.01 .75 -.01 .04 .56 S Serve as a dormitory counselor .05 -.02 .01 .58 .15 .03 .44 S Lead a group therapy session -.04 .01 .02 .72 .12 -.07 .59 S Mentor a troubled child -.02 -.01 .01 .83 -.07 -.03 .64 S Reassure a nervous patient -.01 .11 -.06 .78 .10 -.11 .62 E Chair a committee meeting -.04 .05 -.01 .08 .62 -.03 .42 E Persuade committee members on an
issue -.04 .06 .01 .13 .66 -.13 .47 E Campaign for a political office -.04 .07 .02 -.02 .64 -.12 .36 E Manage a department in a company .07 .02 -.04 .07 .47 .18 .38 E Conduct a business seminar -.01 -.03 .00 -.04 .63 .16 .50 E Market new products to retail
businesses .03 .01 -.01 -.07 .60 .15 .45 E Give a sales presentation .03 -.10 .03 .01 .67 .09 .52 E Invest in new companies .11 .12 -.09 -.17 .59 .18 .48 E Recruit new customers for a business .06 -.03 -.05 .01 .61 .16 .49 E Give a press conference -.02 .01 .06 -.03 .75 -.08 .53 E Persuade someone to finance a
business .02 -.01 -.08 -.04 .64 .20 .53 E Sell residential and business properties .08 -.02 -.05 -.04 .51 .25 .42 E Publicize an event -.01 -.06 .26 .08 .58 -.09 .50 E Plan meetings and conferences -.03 -.07 .03 .19 .59 .08 .53
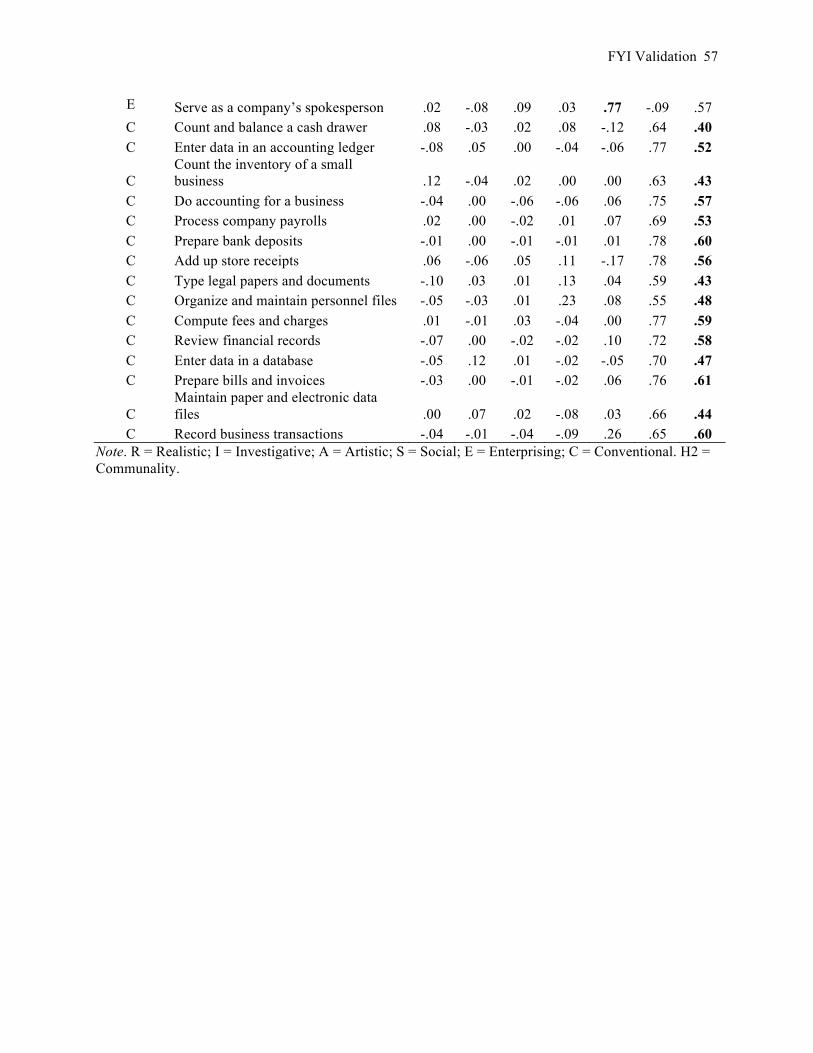
FYI Validation 57
E Serve as a company’s spokesperson .02 -.08 .09 .03 .77 -.09 .57 C Count and balance a cash drawer .08 -.03 .02 .08 -.12 .64 .40 C Enter data in an accounting ledger -.08 .05 .00 -.04 -.06 .77 .52
C Count the inventory of a small business .12 -.04 .02 .00 .00 .63 .43
C Do accounting for a business -.04 .00 -.06 -.06 .06 .75 .57 C Process company payrolls .02 .00 -.02 .01 .07 .69 .53 C Prepare bank deposits -.01 .00 -.01 -.01 .01 .78 .60 C Add up store receipts .06 -.06 .05 .11 -.17 .78 .56 C Type legal papers and documents -.10 .03 .01 .13 .04 .59 .43 C Organize and maintain personnel files -.05 -.03 .01 .23 .08 .55 .48 C Compute fees and charges .01 -.01 .03 -.04 .00 .77 .59 C Review financial records -.07 .00 -.02 -.02 .10 .72 .58 C Enter data in a database -.05 .12 .01 -.02 -.05 .70 .47 C Prepare bills and invoices -.03 .00 -.01 -.02 .06 .76 .61
C Maintain paper and electronic data files .00 .07 .02 -.08 .03 .66 .44
C Record business transactions -.04 -.01 -.04 -.09 .26 .65 .60 Note. R = Realistic; I = Investigative; A = Artistic; S = Social; E = Enterprising; C = Conventional. H2 = Communality.

FYI Validation 58
APPENDIX C
FYI Item-Level Exploratory Factor Analysis Results Using the SII GOT Scales as Marker Scales
Promax Rotated Factor Pattern Coefficient Domain Item Text R I A S E C h2
GOT Marker Scale .72 .72 .88 .73 .47 .70
R Adjust bicycle gears .63 .06 -.07 -.05 .00 .00 .43 R Repair a leaky faucet .74 .04 -.08 .00 .05 -.04 .56 R Install kitchen cupboards .78 -.05 -.01 -.01 .02 .01 .59 R Operate a farm .49 .08 .03 .07 -.01 -.05 .27
R Apply wood stains and varnishes to furniture .73 -.04 .09 .09 -.10 .07 .55
R Repair household appliances .80 .03 -.10 .02 .03 -.02 .64 R Build a deck for a house .86 -.02 -.07 .04 .04 -.09 .69 R Tile a kitchen floor .83 -.08 .02 .11 -.09 .06 .67 R Use carpentry tools .84 -.02 -.03 -.03 .05 -.10 .67 R Build a stone wall .70 .07 .09 -.06 -.02 -.01 .56 R Operate a riding mower .64 -.03 .00 .01 .02 .03 .41 R Refinish the floors in a house .85 -.10 .02 .07 -.02 .01 .67 R Detail a car .56 .04 .06 -.12 .05 -.01 .36 R Assemble playground equipment .65 .01 .05 .22 -.07 .04 .48 R Frame a house .81 -.03 .02 -.02 .02 -.02 .63 I Investigate stars and black holes -.05 .62 .18 -.09 -.07 .03 .45 I Discover a new strain of virus -.07 .67 -.10 .07 .16 -.05 .46 I Test DNA samples -.10 .73 -.13 .12 .03 .05 .50 I Explore ancient ruins .02 .52 .20 -.10 .08 -.07 .39 I Study an active volcano .06 .72 .11 -.06 -.03 -.02 .59
I Identify an unknown chemical substance .01 .79 -.12 .01 .08 -.04 .59
I Conduct lab experiments .04 .78 -.13 .08 .02 -.02 .59 I Study environmental science .01 .77 -.06 .08 -.07 .01 .56 I Predict earthquakes .06 .76 -.01 -.03 .04 -.01 .61 I Analyze ocean currents -.01 .72 .04 -.01 -.07 .06 .53 I Study the effects of acid rain on plants .04 .74 -.01 .03 -.06 .03 .56 I Observe and classify a new species .02 .74 .04 .00 .00 -.03 .58 I Study planetary storms -.01 .77 .08 -.07 -.03 .02 .61 I Observe and record animal life cycles .02 .70 .03 .09 -.10 .03 .51 I Study changes in Earth’s atmosphere -.02 .81 .03 -.03 -.07 .01 .64 A Paint portraits .05 -.03 .74 .01 -.15 .10 .50 A Act on stage -.13 -.10 .57 .06 .16 -.10 .41 A Write a movie script .01 -.01 .63 -.12 .24 -.10 .46 A Compose music .03 -.02 .63 -.09 .01 .01 .35

FYI Validation 59
A Illustrate a book .01 -.01 .73 -.01 -.02 .01 .51 A Design a set for a play .08 -.05 .68 .08 .00 -.03 .50 A Play a role in a musical -.11 -.07 .67 .09 -.01 .01 .48 A Attend a poetry reading -.07 .00 .59 .18 -.06 .00 .45 A Design a museum exhibit .09 .28 .46 -.02 .10 -.02 .47 A Create sculptures .13 .08 .71 -.04 -.10 .04 .53 A Direct a musical -.04 -.03 .68 .03 .06 -.04 .49 A Attend an art class .01 .01 .76 .02 -.20 .08 .53 A Write a short story -.03 .01 .63 .00 .14 -.06 .46 A Film a documentary .04 .09 .52 -.09 .24 -.05 .41 A Play in a jazz band .04 .09 .55 -.12 .03 .00 .33
S Help people resolve personal problems -.09 .06 -.04 .73 .11 -.07 .57
S Serve as a playground activity leader .16 -.06 .06 .63 -.12 .07 .41 S Help people cope with loss -.02 .06 -.06 .81 .03 -.09 .61
S Volunteer for a local community service .05 .04 .07 .59 .03 .01 .42
S Organize activities at a community center .05 -.04 .09 .57 .07 .13 .48
S Assist a teacher in the classroom .04 -.06 .09 .63 -.08 .10 .45 S Teach people how to cope with stress -.05 .03 -.05 .80 .07 -.08 .64
S Help children with after-school homework .00 -.02 .02 .75 -.15 .14 .55
S Counsel others about substance abuse -.02 .05 -.06 .72 .12 -.09 .54 S Take care of a disabled person .08 .03 -.08 .71 -.13 .05 .42 S Teach parenting skills .01 -.03 -.02 .77 .00 .03 .58 S Serve as a dormitory counselor .06 -.02 -.01 .58 .16 .02 .44 S Lead a group therapy session -.05 .02 .02 .71 .14 -.09 .58 S Mentor a troubled child -.01 -.01 -.01 .84 -.07 -.04 .65 S Reassure a nervous patient -.02 .12 -.06 .77 .12 -.13 .62 E Chair a committee meeting -.05 .05 -.02 .08 .62 -.03 .42 E Persuade committee members on an
issue -.04 .07 .00 .15 .65 -.14 .46 E Campaign for a political office -.04 .08 .04 -.02 .62 -.13 .36 E Manage a department in a company .06 .02 -.06 .06 .49 .19 .40 E Conduct a business seminar -.03 -.04 .00 -.05 .63 .17 .49 E Market new products to retail
businesses .03 .00 -.02 -.07 .62 .16 .47 E Give a sales presentation .03 -.11 .02 .02 .67 .08 .51 E Invest in new companies .09 .12 -.08 -.17 .60 .17 .48 E Recruit new customers for a business .08 -.06 -.04 .01 .64 .15 .51 E Give a press conference -.03 .02 .04 -.03 .75 -.10 .50 E Persuade someone to finance a
business .02 -.02 -.07 -.04 .65 .19 .53 E Sell residential and business properties .07 -.03 -.05 -.04 .52 .24 .43

FYI Validation 60
E Publicize an event -.02 -.07 .24 .09 .59 -.09 .49 E Plan meetings and conferences -.02 -.05 .00 .21 .59 .06 .52 E Serve as a company’s spokesperson .00 -.08 .06 .04 .77 -.10 .56 C Count and balance a cash drawer .10 -.04 .00 .08 -.12 .66 .42 C Enter data in an accounting ledger -.07 .05 .00 -.04 -.09 .78 .52
C Count the inventory of a small business .12 -.05 .01 .00 .02 .64 .46
C Do accounting for a business -.05 .00 -.07 -.07 .06 .76 .58 C Process company payrolls .03 -.01 -.03 -.01 .09 .69 .54 C Prepare bank deposits -.01 -.01 .00 -.03 .01 .78 .59 C Add up store receipts .07 -.07 .03 .13 -.17 .76 .55 C Type legal papers and documents -.14 .05 .01 .11 .03 .61 .44 C Organize and maintain personnel files -.06 -.02 .00 .23 .06 .55 .47 C Compute fees and charges .02 -.01 .02 -.06 .00 .78 .58 C Review financial records -.08 -.02 -.01 -.03 .10 .72 .56 C Enter data in a database -.07 .14 -.01 -.02 -.06 .69 .46 C Prepare bills and invoices -.03 -.01 -.01 -.02 .04 .76 .59
C Maintain paper and electronic data files -.02 .08 .00 -.10 .01 .67 .44
C Record business transactions -.03 -.02 -.04 -.10 .27 .64 .59 Note. R = Realistic; I = Investigative; A = Artistic; S = Social; E = Enterprising; C = Conventional. H2 = Communality.

FYI Validation 61
APPENDIX D
FYI CFA Results
RIASEC Hypothesized Factors Domain FYI Items R I A S E C
R Adjust bicycle gears .63 R Repair a leaky faucet .73 R Install kitchen cupboards .76 R Operate a farm .49
R Apply wood stains and varnishes to furniture .72
R Repair household appliances .78 R Build a deck for a house .84 R Tile a kitchen floor .82 R Use carpentry tools .81 R Build a stone wall .75 R Operate a riding mower .62 R Refinish the floors in a house .83 R Detail a car .58 R Assemble playground equipment .65 R Frame a house .79 I Investigate stars and black holes .66 I Discover a new strain of virus .63 I Test DNA samples .65 I Explore ancient ruins .59 I Study an active volcano .76 I Identify an unknown chemical substance .74 I Conduct lab experiments .74 I Study environmental science .74 I Predict earthquakes .78 I Analyze ocean currents .74 I Study the effects of acid rain on plants .76 I Observe and classify a new species .76 I Study planetary storms .80 I Observe and record animal life cycles .72 I Study changes in Earth’s atmosphere .81 A Paint portraits .66 A Act on stage .61 A Write a movie script .67 A Compose music .60 A Illustrate a book .71 A Design a set for a play .72 A Play a role in a musical .68

FYI Validation 62
A Attend a poetry reading .63 A Design a museum exhibit .62 A Create sculptures .68 A Direct a musical .72 A Attend an art class .69 A Write a short story .68 A Film a documentary .62 A Play in a jazz band .56 S Help people resolve personal problems .74 S Serve as a playground activity leader .57 S Help people cope with loss .78 S Volunteer for a local community service .62 S Organize activities at a community center .64 S Assist a teacher in the classroom .64 S Teach people how to cope with stress .81 S Help children with after-school homework .71 S Counsel others about substance abuse .74 S Take care of a disabled person .62 S Teach parenting skills .74 S Serve as a dormitory counselor .65 S Lead a group therapy session .77 S Mentor a troubled child .79 S Reassure a nervous patient .78 E Chair a committee meeting .63 E Persuade committee members on an issue .64 E Campaign for a political office .55 E Manage a department in a company .61 E Conduct a business seminar .70 E Market new products to retail businesses .67 E Give a sales presentation .73 E Invest in new companies .63 E Recruit new customers for a business .70 E Give a press conference .70 E Persuade someone to finance a business .71 E Sell residential and business properties .63 E Publicize an event .65 E Plan meetings and conferences .70 E Serve as a company’s spokesperson .73 C Count and balance a cash drawer .60 C Enter data in an accounting ledger .71 C Count the inventory of a small business .64 C Do accounting for a business .73 C Process company payrolls .72

FYI Validation 63
C Prepare bank deposits .77 C Add up store receipts .72 C Type legal papers and documents .64 C Organize and maintain personnel files .65 C Compute fees and charges .76 C Review financial records .76 C Enter data in a database .69 C Prepare bills and invoices .79 C Maintain paper and electronic data files .67 C Record business transactions .76
Note. R = Realistic; I = Investigative; A = Artistic; S = Social; E = Enterprising; C = Conventional. H2 = Communality.