development and evaluation of procedures and methods for...
TRANSCRIPT
UPTEC X 14 003
Examensarbete 30 hpMars 2014
Development and evaluation of procedures and methods for Proseek Multiplex
Ara-Shant Migoyan


Molecular Biotechnology Programme
Uppsala University School of Engineering
UPTEC X 14 003 Date of issue 2014-03
Author Ara-Shant Migoyan
Title (English)
Development and evaluation of procedures and methods for
Proseek Multiplex Title (Swedish)
Abstract
Contemporary proximity extension assays (PEAs) are used for qualitative protein
quantifications in serological samples, with possibilities for scaling assays in multiplex.
Medical research can however benefit from robust immunoassays functional for assessing
protein levels in other types of biospecimens. Formalin-fixed paraffin embedded (FFPE)
tissues have long been used for morphological studies. The proteome encapsulated by
extensive cross-linking from formalin fixation has however impeded the development of
proteomic analysis from the vast biorepositories FFPE-tissues constitute. In this study, I
present a proof of concept for assessing FFPE-samples in multiplex format through PEA.
Furthermore, a homogenization and protein extraction protocol for assessing fresh-frozen
tissue with PEA is presented, together with a novel sample buffer for which remarkable rises
in protein detection can be seen in several protein assays. Together, these findings extend the
application area of PEA to tissues together with improved quantification characteristics.
Keywords
PEA, immunoassay, FFPE, multiplex
Supervisors
Mats Gullberg Olink Bioscience
Scientific reviewer
Masood Kamali-Moghaddam Uppsala University
Project name Sponsors
Language
English
Security
ISSN 1401-2138
Classification
Supplementary bibliographical information Pages
41
Biology Education Centre Biomedical Center Husargatan 3 Uppsala
Box 592 S-75124 Uppsala Tel +46 (0)18 4710000 Fax +46 (0)18 471 4687


Development and evaluation of procedures and methods
for Proseek Multiplex
Ara-Shant Migoyan
Populärvetenskaplig sammanfattning
Proteiner är byggstenarna för allt levande – små molekyler som länge varit svåra att studera
och mäta i kroppen hos människor. Numera kan man få relativa indikationer på hur mycket av
dessa proteiner som finns i bland annat blodprover, med hjälp av antikroppar som binder till
specifika proteiner. Olink Bioscience har utvecklat egna metoder för att hitta och detektera
intressanta proteiner i blodprov. En av dessa bygger på proximity extension assay (PEA)
teknologi där kända DNA-molekyler är bundna till proteinigenkännande antikroppar. DNA-
molekylerna kan sedan kopieras efter att deras tillhörande antikroppar hittat ett protein. Mäter
man antalet kopierade DNA-molekyler får man även en uppskattning av antalet proteiner som
fanns i provet.
Än så länge används denna teknologi mestadels till blodprover. I detta projekt har
applikationsområdet för PEA-teknologin breddats till vävnadsprover som fixerats på
objektglas och vävnadsprover som frysts ner efter biopsi. Trots att optimering och
kvalitetssäkring kvarstår av resultaten är detta steg mot en generaliserbar proteinmätning från
vävnad ytterst intressant ur ett medicinskt perspektiv, då många biologiska prover är i just
vävnadsform. Som ett led i utvecklingen av nya applikationsområden har även en alternativ
buffertlösning upptäckts – med egenskaper som stärker proteinmätningen och ger högre utslag
på proteindetektion vid blandning med prover.
Examensarbete 30 hp
Civilingenjörsprogrammet Molekylär bioteknik
Uppsala universitet, januari 2014

Table of contents
Abbreviations .......................................................................................................................................... 7
1 Introduction .......................................................................................................................................... 8
1.1 Background ................................................................................................................................... 8
1.2 Aim of study .................................................................................................................................. 8
1.3 Tissue samples as biospecimens .................................................................................................... 9
1.3.1 Formalin fixation and paraffin embedding ............................................................................. 9
1.3.2 Antigen retrieval from formalin-fixed, paraffin embedded tissues ...................................... 10
1.3.3 Fresh-frozen tissue................................................................................................................ 10
1.3.4 Methods for homogenizing and lysing tissue ....................................................................... 11
1.4 Proximity Extension Assay (PEA) .............................................................................................. 11
1.4.1 Principles of PEA ................................................................................................................. 11
1.4.2 Olink’s Proseek - operating rationale ................................................................................... 12
1.4.3 Multi- versus singleplex ....................................................................................................... 12
1.4.4 Evaluating qPCR .................................................................................................................. 13
2 Materials and Methods ....................................................................................................................... 14
2.1 Evaluation of FFPE compatibility ............................................................................................... 14
2.1.1 Rehydration, deparaffinization and HIER ............................................................................ 14
2.1.2 Homogenization of FFPE-samples ....................................................................................... 15
2.1.3 Protein assay in singleplex ................................................................................................... 15
2.1.4 Protein assay in multiplex .................................................................................................... 16
2.2 Fresh-frozen tissue homogenization, protein extraction and assay in singleplex ........................ 16
2.3 Trials for unconventional buffer .................................................................................................. 17
2.4 Validation of data ........................................................................................................................ 18
3 Results ................................................................................................................................................ 18
3.1 Detection of antigen retrieved from FFPE-tissue ........................................................................ 18
3.2 Homogenization protocol for fresh-frozen tissue ........................................................................ 19
3.3 Lowering Ct in Proseek assays by alternate sample buffer ......................................................... 20
3.3.1 Effects on antigen standard .................................................................................................. 20
3.3.2 Effects on biological samples ............................................................................................... 24
4. Discussion ......................................................................................................................................... 26
4.1 Tissue samples and the Proseek immunoassay............................................................................ 26
4.2 Implications of alternate sample buffer ....................................................................................... 27
5 Conclusions ........................................................................................................................................ 28

6 Acknowledgments .............................................................................................................................. 29
7 References .......................................................................................................................................... 30
8 Appendix ............................................................................................................................................ 32
8.1 Biomarkers in Olink-panel CVD I .............................................................................................. 32
8.2 Results from MUX-assay of CVD I antigen standard, buffer A to buffer B ............................... 33
7
Abbreviations
Table 1 – List of reoccurring abbreviations. For full list of acronyms for analysed proteins, see Table 9 in
appendix, section 8.1.
Term Meaning
AR Antigen Retrieval
BCA Bicinchoninic Acid Assay
Ct Threshold Cycle
CV Coefficient of Variation
FFPE Formalin-Fixed, Paraffin-Embedded
HIER Heat-Induced Epitope Retrieval
IHC Immunohistochemistry
LOD Limit of detection
MUX Multiplex
PEA Proximity Extension Assay
PLA Proximity Ligation Assay
qPCR Quantitative Polymerase Chain Reaction
(also known as real-time PCR)

8
1 Introduction
1.1 Background
High-performing detection methods for protein targets are highly required in both research
and clinical settings. A great deal of innovative steps are yet to be done in the pursuit for
developing novel assays. This is especially true for protein quantification procedures in
complex biological samples, where such characteristics as robustness, specificity and
sensitivity play a significant role for conducting accurate measurements in volumetrically
small samples. The development of such high-performing assays are however difficult –
impeding research from further progression4,11.
Proximity ligation assay (PLA) is a protein detection method using in vitro DNA
amplification, enabling sensitive and specific macromolecule assays. Early versions of PLAs
were based on a proximity ligation event by a simultaneous recognition of target-specific
pairs of DNA-aptamers. These aptamers belong to a class of oligonucleotides for which their
respective affinity towards target molecules is known beforehand through in vitro selection
trials. Pairs of DNA-aptamers bind to their target molecule and hybridize their free sequence
extensions through the addition of connector oligonucleotides, forming a hybridized
proximity probe pair joined together by a DNA ligase. Hybridized proximity probe pairs form
a PCR-reporter sequence, and can thus be amplified through PCR, leaving the unhybridized
probes unamplified4. Qualitative measurements can then reflect the amount of specific
proteins in a biological sample. These findings led to later studies where the DNA-aptamers
have successfully been substituted by polyclonal or matched pairs of monoclonal antibodies
connected to oligonucleotides (called proximity probes) – making the PLA more standardized
and generalizable6.
PLA is however prone to recovery loss when assessing proteins in complex biological
samples, such as blood plasma10, due to the proximity probes being joined with a DNA ligase.
In a more recent study, this recovery loss has been overcome by substituting DNA ligase with
a DNA polymerase. This technology, referred to as proximity extension assay (PEA) detects
proteins through a proximity-dependent polymerization event11 rather than a ligation event as
can be found in PLA. PEA-technology is now commercialized as the Proseek immunoassay,
provided by Olink Bioscience.
1.2 Aim of study
A broad approach was taken to set up the initial research plan with the principal goal of
identifying, defining, evaluating, and performing a specific application to Olink’s PEA-
technology. A proper methodology for accomplishing the project aim was to include theoretic
studies in molecular biology relevant for the chosen application, hands-on immunoassay
utilization, qPCR, computer aided data analysis, and even minor features of market analysis to
affirm the potential interest of any given application.

9
This broad approach became considerably narrower when it was decided to examine the
compatibility between formalin-fixed paraffin-embedded (FFPE) samples and Olink’s PEA-
technology. By developing an immunoassay protocol for FFPE-samples, apart from the
important scientific value of making use of abundant biospecimens, Olink’s existing line of
immunoassays would add a field of application to their existing portfolio (serum and plasma
samples).
However, during the course of the study, new interesting findings emerged which paved the
way for alternative applications and improvements of the contemporary immunoassay. These
include extension of the application area to fresh-frozen tissue samples and using alternate
buffers in the assay format (Fig. 1).
Fig. 1 – General schematics for the FFPE-project and the two subsequent projects.
1.3 Tissue samples as biospecimens
1.3.1 Formalin fixation and paraffin embedding
Stored tissue samples are a keystone for pathological research by immunohistochemistry
(IHC), and vast biorepositories of fixated tissue can be found in clinical and research
environments worldwide17. Unfortunately, no single standard protocol for tissue fixation has
been found to preserve all kinds of epitopes. Therefore, fixating procedures can differ
between tissue samples and complicate the handling of fixated tissues when applying them to
different analytical procedures2.
Formaldehyde fixation and paraffin embedding of tissue samples has been, and continues to
be, a common method for storing tissue samples. FFPE biopsies are highly stable and can be
stored at room temperature for indefinite time periods7. Thus, FFPE is a valuable method for
preserving histological and morphological features of different tissue types, by which the
tissues become suitable for diagnostics by for example IHC1. Formaldehyde acts as a reactant
•Obtain homogenization protocol for FFPE-samples.
•Evaluate Olink's PEA-mediated assays towards FFPE-samples.FFPE
•Analyze advantages and disadvantages for the alternate sample buffer.
•Gather data for assays in the new sample buffer.Sample buffer
•Obtain homogenization protocol for fresh-frozen tissue samples.
•Evaluate Olink's PEA-mediated assays towards fresh-frozen tissue samples.
Fresh-frozen tissue

10
towards certain functional groups of amino acid side chains, resulting in protein-protein and
protein-nucleic acid cross-links16.
The fixation process can vary between desired thicknesses of cut tissues and antigen-antibody
pairs. In general, the sliced tissue is fixated in a neutrally buffered formalin solution for at
least a couple of hours. The fixated tissue is then dehydrated in a graded series of alcohol
solutions followed by a paraffin embedding procedure1, 2. However, FFPE reduces the
proteomic availability for tissues due to its extensive molecular cross-linking and therefore
undermines immunoreactivity. Relatively recent findings have however streamlined antigen
retrieval techniques, allowing other protein identification methods than IHC to be compatible
with FFPE-samples1.
1.3.2 Antigen retrieval from formalin-fixed, paraffin embedded tissues
A range of different sampling and AR (antigen retrieval) methods for FFPE-samples have
been studied and compared to each other. These involve different sample formats, for
example cylindrical tissue samples and tissue-sections as well as extraction protocols with
different buffers, homogenization steps and incubation procedures5,7. HIER (heat-induced
epitope retrieval) applied for IHC is one of several classic AR techniques. There is no
recognized standard protocol for this heat-induced extraction method, but there are however
general hallmarks to be considered when setting up a HIER-protocol for FFPE-samples – 1)
deparaffinization and rehydration of FFPE-samples in a graded series of xylene and alcohol,
respectively, 2) incubation of the samples near boiling point for different periods of time, 3)
using different buffer solutions with ranging pH as boiling medium, with the occasional
supplement of stabilizing chemicals such as sodium dodecyl sulphate (SDS)1,8,17. Although all
anticipated proteins cannot be fully recovered from a single specimen; sodium dodecyl
sulphate-polyacrylamide gel electrophoresis (SDS-PAGE), western blotting (WB), protein
arrays, enzyme-linked immunosorbent assay (ELISA) and mass spectrometry (MS) have
shown that HIER-treatment can extract the majority of proteins encapsulated in both FFPE-
samples and fresh-frozen tissue1. Intuitively, one would argue that epitopes conserved within
a fixated tissue would not withstand such a high-temperature treatment. Research has yet to
elucidate the chemical and physical processes enabling HIER to yield recognizable epitopes.
In the meantime, one can simply rely on the empirical evidence indicating its adequateness8.
1.3.3 Fresh-frozen tissue
Fresh-frozen tissue, in contrast to FFPE-samples, is less stressful to the conservation of
retrieved antigens7. Use of fresh-frozen tissue in immunohistochemistry as well as
immunoassays can therefore carry conserved antigens that would have been damaged by
formalin fixation2. However, fresh-frozen tissue requires more rigorous arrangements for
storing (at -80°C)1.
11
1.3.4 Methods for homogenizing and lysing tissue
Contemporary lysis techniques can roughly be categorized into traditional (non-detergent) and
chemical (detergent) methods. Traditional methods include mechanical disruption, manual
grinding (for example by using pestles) and sonication (high-frequency sound waves).
Chemical lysis techniques often include detergents which break lipid-enriched cell structures
by solubilizing proteins. The choice of lysis technique should depend on sample type. Due to
varying composition of cell membranes and cell walls, the choice of proper detergents is
crucial for a successful protein extraction. This also applies to more traditional disruptive and
mechanical techniques, due to the rigidness of cells affecting yield and subsequent
downstream applications20.
1.4 Proximity Extension Assay (PEA)
1.4.1 Principles of PEA
As earlier described, more recent developments based on PLA have focused on improvements
of assay performance in biological samples by substituting DNA ligase with DNA
polymerase. The enzyme replacement for enabling proximity-dependent DNA polymerization
has been proven to reduce the likelihood of enzymatic inhibitions, an intrinsic factor when
performing assays in complex biological samples. Thus, PEA is a more robust method for
protein quantification in sera, while still inheriting the homogenous assay format from PLA
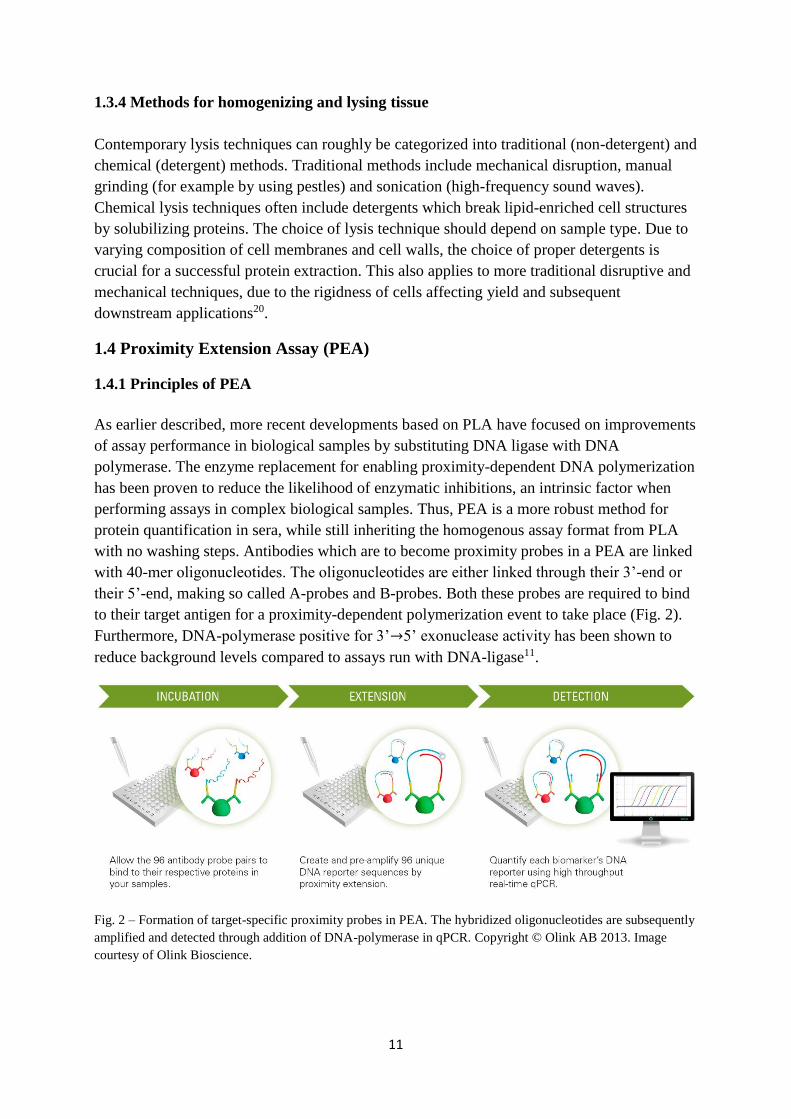
with no washing steps. Antibodies which are to become proximity probes in a PEA are linked
with 40-mer oligonucleotides. The oligonucleotides are either linked through their 3’-end or
their 5’-end, making so called A-probes and B-probes. Both these probes are required to bind
to their target antigen for a proximity-dependent polymerization event to take place (Fig. 2).
Furthermore, DNA-polymerase positive for 3’→5’ exonuclease activity has been shown to
reduce background levels compared to assays run with DNA-ligase11.
Fig. 2 – Formation of target-specific proximity probes in PEA. The hybridized oligonucleotides are subsequently
amplified and detected through addition of DNA-polymerase in qPCR. Copyright © Olink AB 2013. Image
courtesy of Olink Bioscience.
12
1.4.2 Olink’s Proseek - operating rationale
In a Proseek assay, known oligonucleotide-labelled antibody pairs bind to their correlated
antigens in a 1 µl sample. Two adjacent oligonucleotides coupled to their respective antibody
pairs form a PCR-reporter sequence by a proximity-dependent DNA polymerization event.
The polymerized oligosequences are then detected and quantified by qPCR. Thus far,
Proseek’s protocol does not differ from the main principles of PEA. However, the assay
format is to this date niched and validated for qualitatively indicating certain proteins levels in
serum and plasma samples.
1.4.3 Multi- versus singleplex
An assay that runs in singleplex can only measure a single analyte at any given time. An assay
that runs in multiplex (commonly abbreviated MUX) however, can measure several different
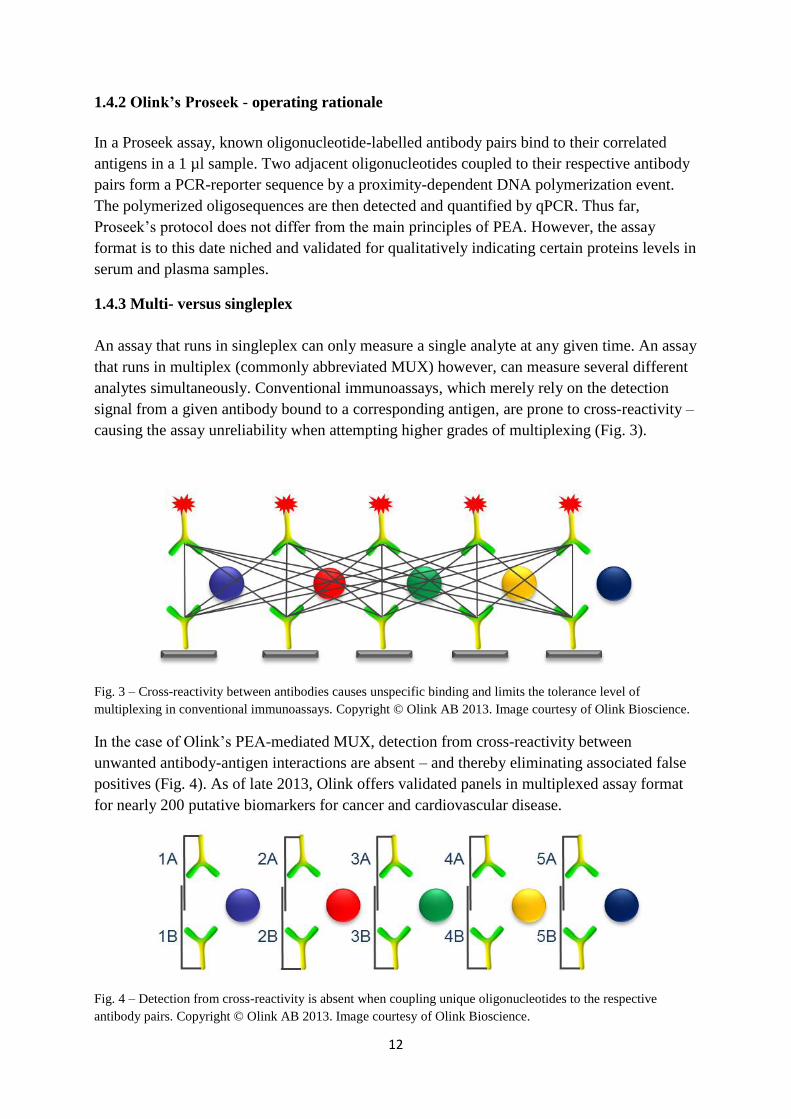
analytes simultaneously. Conventional immunoassays, which merely rely on the detection
signal from a given antibody bound to a corresponding antigen, are prone to cross-reactivity –
causing the assay unreliability when attempting higher grades of multiplexing (Fig. 3).
Fig. 3 – Cross-reactivity between antibodies causes unspecific binding and limits the tolerance level of
multiplexing in conventional immunoassays. Copyright © Olink AB 2013. Image courtesy of Olink Bioscience.
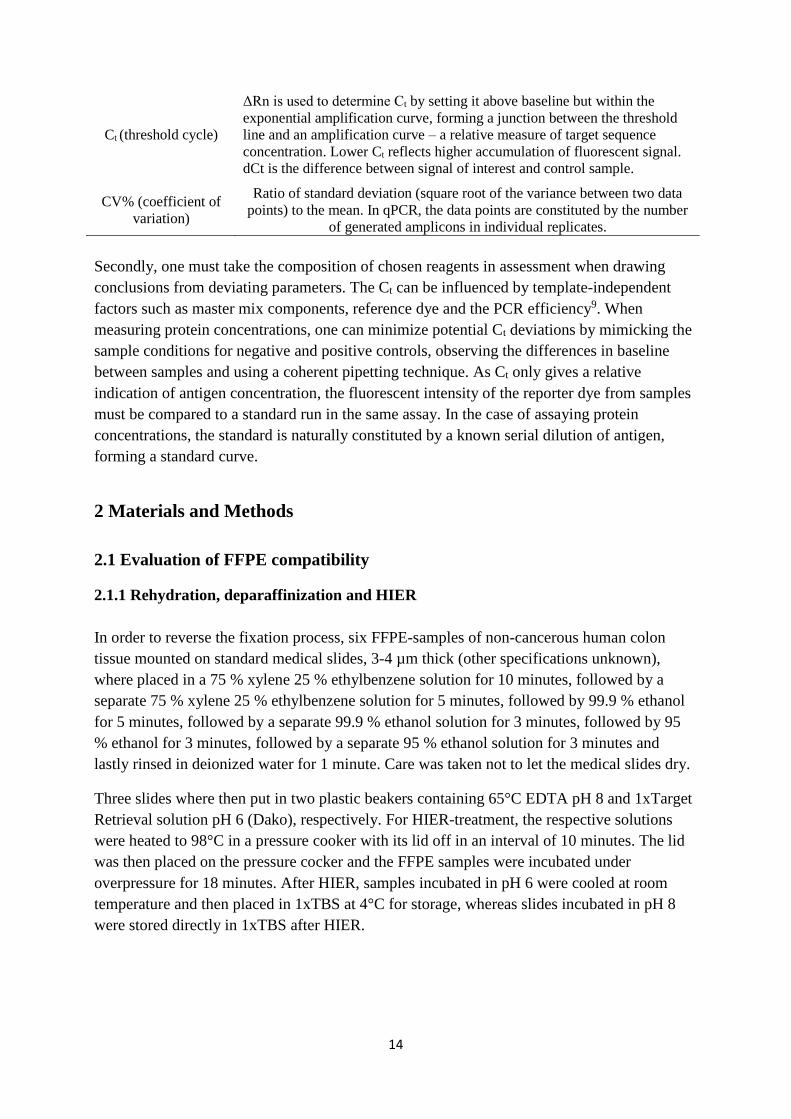
In the case of Olink’s PEA-mediated MUX, detection from cross-reactivity between
unwanted antibody-antigen interactions are absent – and thereby eliminating associated false
positives (Fig. 4). As of late 2013, Olink offers validated panels in multiplexed assay format
for nearly 200 putative biomarkers for cancer and cardiovascular disease.
Fig. 4 – Detection from cross-reactivity is absent when coupling unique oligonucleotides to the respective
antibody pairs. Copyright © Olink AB 2013. Image courtesy of Olink Bioscience.

13
The ability to distinguish detection signals in multiplex mode is simply due to measurement
of amplicons of antibody-specific oligonucleotides rather than antibody-antigen hybridization
events (Fig. 5). Thus, known oligonucleotides can be used to pair fluorescent detection signals
with individual proteins. Multiplexing protein detection in PLA or PEA formats therefore
provide a more scalable alternative in contrast to heterogeneous methods3.
Fig. 5 – In PEA, known oligonucleotide sequences act as bar-codes for protein identification through qPCR.
Copyright © Olink AB 2013. Image courtesy of Olink Bioscience.
However, the issue of DNA ligase becoming an inhibiting factor when assessing serological samples
remains in multiplex. Optimisation from PLA to PEA in multiplex has been shown to be suitable for
detecting plasma biomarkers in samples from colorectal cancer patients21.
1.4.4 Evaluating qPCR
Several aspects of a qPCR must be taken into consideration if one is to properly examine the
results. Firstly, a definition of the different parameters involved in the evaluation must be set
(Table 2).
Table 2 – Terms and parameters used in qPCR evaluation9.
Term/Parameter Description Dynamic range Range of linearity of the standard curve.
Precision Usually indicated by the standard deviation between replicates.
Standard deviation Square root of the variance between two data points
Efficiency
How efficient a PCR-reaction amplifies a target between cycles. A perfect
efficiency (E) doubles the target sequence at each cycle according to 𝐶𝑛 =𝐶𝑖 × (1 + 𝐸)𝑛, where Ci = initial copy number; Cn = copy number at cycle
n; n = number of cycles; E = efficiency of target amplification9.
Sensitivity Effectiveness of amplifying and detecting starting template. In PLA,
sensitivity is dependent on antibody affinity6.
R2 Statistical indication of how well a measured value can predict another
when extrapolated. R2=1 indicates a perfect prediction.
Rn Normalized fluorescence signal of reporter dye to reference dye.
Baseline The background fluorescence which is observed in the initial PCR-cycles.
ΔRn Rn normalized to the baseline, ΔRn = Rn - baseline
14
Ct (threshold cycle)
ΔRn is used to determine Ct by setting it above baseline but within the
exponential amplification curve, forming a junction between the threshold
line and an amplification curve – a relative measure of target sequence
concentration. Lower Ct reflects higher accumulation of fluorescent signal.
dCt is the difference between signal of interest and control sample.
CV% (coefficient of
variation)
Ratio of standard deviation (square root of the variance between two data
points) to the mean. In qPCR, the data points are constituted by the number
of generated amplicons in individual replicates.
Secondly, one must take the composition of chosen reagents in assessment when drawing
conclusions from deviating parameters. The Ct can be influenced by template-independent
factors such as master mix components, reference dye and the PCR efficiency9. When
measuring protein concentrations, one can minimize potential Ct deviations by mimicking the
sample conditions for negative and positive controls, observing the differences in baseline
between samples and using a coherent pipetting technique. As Ct only gives a relative
indication of antigen concentration, the fluorescent intensity of the reporter dye from samples
must be compared to a standard run in the same assay. In the case of assaying protein
concentrations, the standard is naturally constituted by a known serial dilution of antigen,
forming a standard curve.
2 Materials and Methods
2.1 Evaluation of FFPE compatibility
2.1.1 Rehydration, deparaffinization and HIER
In order to reverse the fixation process, six FFPE-samples of non-cancerous human colon
tissue mounted on standard medical slides, 3-4 µm thick (other specifications unknown),
where placed in a 75 % xylene 25 % ethylbenzene solution for 10 minutes, followed by a
separate 75 % xylene 25 % ethylbenzene solution for 5 minutes, followed by 99.9 % ethanol
for 5 minutes, followed by a separate 99.9 % ethanol solution for 3 minutes, followed by 95
% ethanol for 3 minutes, followed by a separate 95 % ethanol solution for 3 minutes and
lastly rinsed in deionized water for 1 minute. Care was taken not to let the medical slides dry.
Three slides where then put in two plastic beakers containing 65°C EDTA pH 8 and 1xTarget
Retrieval solution pH 6 (Dako), respectively. For HIER-treatment, the respective solutions
were heated to 98°C in a pressure cooker with its lid off in an interval of 10 minutes. The lid
was then placed on the pressure cocker and the FFPE samples were incubated under
overpressure for 18 minutes. After HIER, samples incubated in pH 6 were cooled at room
temperature and then placed in 1xTBS at 4°C for storage, whereas slides incubated in pH 8
were stored directly in 1xTBS after HIER.
15
2.1.2 Homogenization of FFPE-samples
After the incubation in 1xTBS at room temperature, tissues were scraped of the slides with a
scalpel and placed in 100 µl solution of Buffer B including 1xHalt Protease and Phosphatase
Inhibitor Cocktail (Thermo Scientific), one solution for slides boiled in acidic (pH 6)
environment and one for basic (pH 8) environment. Each solution was kept in separate vials.
Note that samples for the Proseek assay are conventionally buffered in another buffer, here
called Buffer A. The extraction solutions containing the remainder of the deparaffinised tissue
samples underwent homogenization through mechanical disruption. Polytron System PT 1200
E (Kinematica) was used for mixing with an attached PT-DA 05/2EC-E85 (Kinematica) as
dispersing aggregate, with a dispersing head diameter of 5 mm, suitable for processing
volumes of 100 µl minimum. Solutions were mixed in low temperature vials until clear
visibility through the vials was reached and then centrifuged at 5 000 rpm for 5 min to
separate supernatant from pellet. When not in use, the solutions were stored at -20°C.
No attempt was done to determine the weight of the retrieved tissue, as early experiments had
shown that no available scale was suitable for accurately determining such low masses (~0.1
mg) for a standard medical slide, 3-4 µm thick. To determine an accurate weight for small
FFPE-samples becomes even more complicated as the tissue must not dry prior to protein
extraction, and the wet weight’s proportion of the total mass becomes a major source of error.
The protein concentration was measured with BCA (bicinchoninic acid assay), using Pierce
BCA protein assay kit with a bovine gamma globulin standard. Measurement samples were
diluted 10-fold in 50 mM pH 7.2 Tris-HCl and a total of four replicates were measured for the
supernatant and pellet, samples undergone acidic incubation and basic incubation,
respectively. The reaction wells were incubated in 120 minutes at 37°C to let the reactions
reach equilibrium before spectrophotometric analysis with Tecan Genesis at 562 nm, through
accompanying software Magellan v.6.5 (Tecan).
Due to non-detectable protein concentrations in the supernatant for samples incubated in both
acidic and basic conditions, a new round of human colon tissue from FFPE-slides underwent
HIER-treatment as before. The tissue was added to the existing vials and mixed with the same
mixer and dispersing aggregate as before, at full speed for 30 minutes, each 30 minute session
divided into 10 minute intervals for both vials, to ensure a higher protein concentration.
2.1.3 Protein assay in singleplex
Vascular endothelial growth factor (VEGF-D) was chosen as a candidate biomarker for the
FFPE colon samples due to its relative abundance in endothelial cells19 and also for its
existing position as a validated biomarker in Olink’s oncological and cardiovascular set of
biomarker panels. Thus, polyclonal IgG human VEGF-D antibodies purified from goat (R&D
Systems) were labelled with known oligo-nucleotides and assayed against a standard curve of
VEGF-D antigen and serum samples as positive control in Proseek singleplex, according to
Olink’s manual14.
16
The 7500 Real-Time PCR System from Applied Biosystems was used for amplifying
hybridized oligos in the qPCR step. The accompanying 7500 software Version 2.0.5 was used
for compiling the measurement data. The protocol for thermal cycles can be seen in Table 3.
Table 3 – Thermal cycling program for assays run in singleplex
Step #Cycles Time (min) Temp (°C )
Pre-extension 1 20 50
Activation 1 2 95
Amplification 40 0.25 95
40 1 60
Melting curve 1 ~40 Ramping
However, the initial VEGF-D assays for FFPE-samples did not generate a signal
distinguishable from LOD, with samples of antigen standard and plasma indicating no
malfunctioning of chosen probes. In the light of HIER being an unpredictable method
pertaining to conservation of certain antigens, epithelial cell adhesion molecule (EpCAM)
proximity probes were prepared through polyclonal IgG human EpCAM antibodies purified
from goat (R&D Systems) chosen for a new round of assays due to the protein’s abundance
in human colon18. The assays were conducted with a similar protocol as the ones for VEGF-D
and rendered a lower Ct than the baseline for samples taken from the acidic incubation.
2.1.4 Protein assay in multiplex
Encouraged by the positive results from the EpCAM assay in singleplex, the project
proceeded in multiplex format, simultaneously assaying 92 cardiovascular-related proteins
from Olink’s CVD I (cardiovascular disease I, see section 8.1 for full list of proteins) panel
of biomarkers. By this point in the study, efforts and resources were put on developing new
sample buffers. As a consequence, only two measurement samples were used for the
concluding assay for FFPE-samples, one for each incubation environment (pH 6 and pH 8).
The Proseek Multiplex protocol was carried out in accordance with the user manual15.
2.2 Fresh-frozen tissue homogenization, protein extraction and assay in singleplex
0.24 mg of fresh-frozen normal human colon was added to a 480 µl buffer solution of 50 mM
Tris-HCl pH 7.2, 150 mM NaCl, 1 mM EDTA pH 8, 11 % w/v Triton X-100, 0.1 % w/v
sodium deoxycholate, 1 x Halt Protease and Phosphatase Inhibitor Cocktail (Thermo
Scientific), 1 mM PMSF. The buffer solution was adapted from a protocol kindly provided by
Lotta Wik at the Department of Immunology, Genetics and Pathology, Uppsala University.
Polytron System PT 1200 E (Kinematica) tissue with an attached PT-DA 05/2EC-E85
(Kinematica) as dispersing aggregate was used for homogenizing the tissue. The lysate was
then centrifuged at 13 000 rpm for 3 min, from which the supernatant was recovered and
stored at 4°C.
Protein concentration in the supernatant was measured with BCA, using Pierce BCA protein
assay kit with a bovine gamma globulin standard. Measurement samples were diluted 10-fold
in 50 mM Tris-HCl pH 7.2 with three replicates for every serial dilution. The reaction wells
17
were incubated for 60 minutes at 37°C and measured with Tecan Genesis at 562 nm, through
accompanying software Magellan v.6.5 (Tecan).
The supernatant of the centrifuged tissue lysate was subsequently assayed in Proseek
singleplex according to protocol14, based on a 10-fold serial dilution of six steps with two
replicates, respectively. Plasma samples were used as positive control. All samples were
assayed against EpCAM by using the probes conjugated earlier for assessing FFPE-samples
(see section 2.1.3). No antigen standard for EpCAM was included in the singleplex assay due
to absence of an isolated EpCAM antigen in solution. The chosen protocol is however
appropriate for determining whether the homogenization and extraction protocol rendered
detectable proteins with the Proseek assay format.
2.3 Trials for unconventional buffer
When performing protein assays for evaluation of FFPE-compatibility, an interesting
observation and ensuing project emerged. The use of buffers unlike the conventional one,
(referred to as buffer A) used in the assay formats, resulted in assays with higher dCt, showing
a higher protein concentration in samples that were otherwise equivalent. Furthermore, assays
run with separate buffers had a similar baseline – excluding a higher fluorescence background
as a factor for falsely high detection signals. The only plausible explanations for the
unanticipated results were either that the alternate buffer (referred to as buffer B) inhabits
chemical properties suitable for antibody-antigen hybridization in the assay, or that it recovers
more antibodies from solution while pipetting or that it is prone to being pipetted in excess
volume due to its difference in viscosity and stickiness. The issue of proper pipetting becomes
crucial in this case, considering that the Proseek assay is run with 1 µl samples. A volume of 2
µl that might be non-distinguishable during experimentation, doubles the protein
concentration of a standard sample. However, repeated experiments all pointed at higher
sensitivity for the VEGF-D antigen when using buffer B in comparison to buffer A.
To further examine this so far unexplainable phenomenon, assays for standard curves of all
antigens in the before mentioned CVD I panel were run in multiplex, with two replicates for
buffer A and buffer B, respectively. The standard curves were diluted 5-fold, ranging from an
antigen concentration of 100 ng/ml to 1.28 pg/ml. The sole difference between the antigen
samples was the buffer solution in which the antigen pools are solubilized in, all other
specifications in the assay format have been identical. Plasma samples with unknown antigen
concentrations were also included with two replicates, diluted from stock to 1:2 and 1:8
dilutions. To exclude false positives dependent on pipetting method due to the different
viscosities of buffer A and B, a similar setup for an antigen standard was assayed in the same
qPCR but with a consciously flawed pipetting method, where samples were diluted
independently without any master mix and in a different concentration range (10-fold dilution
between 1 000 ng/ml – 1 pg/ml). The multiplex-protocol proceeded in accordance with user
manual15.
Replicates of fresh-frozen colon samples with buffer B as sample buffer were performed in
connection with the EpCAM assay on fresh-frozen colon samples in singleplex (see section
2.2), in order to elucidate any difference in assay performance.

18
2.4 Validation of data
This study has focused on development of methods for Olink’s contemporary immunoassays.
Therefore, efforts have not been strained to statistical analysis of the extensive data collected,
as collected data remains at Olink’s disposal and can be analysed more extensively when
needed. However, CV% of replicates were calculated and will be presented in the results
section, due to it being a good indicator of variability between replicate samples and in-run
precision. The cut-off value for precise replicates have been set at CV%<30, as this limit is
used in Olink’s data packages for biomarkers13.
3 Results
3.1 Detection of antigen retrieved from FFPE-tissue
Earlier optimization trials have validated a protein concentration threshold of 0.021 mg ml-1
(Mats Gullberg, personal communication) as applicable with the Proseek assay format. A
supernatant concentration roughly half of the accepted threshold value can therefore be
regarded as inadequate (Table 4). Concerning the experienced difficulties of reaching a higher
solubility of proteins from the treated FFPE-samples, protein assays in Proseek were
conducted despite the low concentrations.
Table 4 – BCA on homogenized and centrifuged FFPE-samples incubated in acidic and basic environments.
Measurement samples for BCA categorized as supernatant and pellet, where the protein concentration of the
supernatant indicates amount of solubilized protein. Concentration calculated as mean of four replicates.
Supernatant Protein concentration mg/ml Pellet Protein concentration mg/ml
pH 6 0.010 pH 6 0.079
pH 8 0.010 pH 8 0.069
R2 for standard curve: 0.9961
Approximately one third of the 92 proteins in CVD I had a dCt above 1 in comparison to the
baseline, out of which several had dCt above 2 – indicating some functionality between the
described homogenization protocol and Olink’s multiplexed assay format (Fig. 6). As
mentioned in the materials and methods section, no replicates of the FFPE-samples were
prioritized and thus, no standard deviation or CV% could be calculated. Four proteins in the
CVD I panel (PAR-1, MB, CA-125 and NEMO) did not give away any fluorescent signal in
any control sample and are therefore discarded in the results.

19
Fig. 6 – Percental distribution of dCt for individual biomarkers in Proseek MUX CVD I. FFPE-samples
undergone HIER in acidic (pH 6) and basic (pH 8) environments, respectively.
21 out of 92 proteins in CVD I had at least one dCt above 2, either for treatment in pH 6 or pH
8 (Fig. 7). Some proteins showed sensitivity to basic or acidic environments, indicating the
importance of acidity for preserving immunoreactive antigen in the HIER-treatment.
Fig. 7 – dCt above 2 for single-replicate FFPE-samples assayed with Proseek MUX CVD I. See appendix (8.2)
for assays on between-run antigen standards from CVD I.
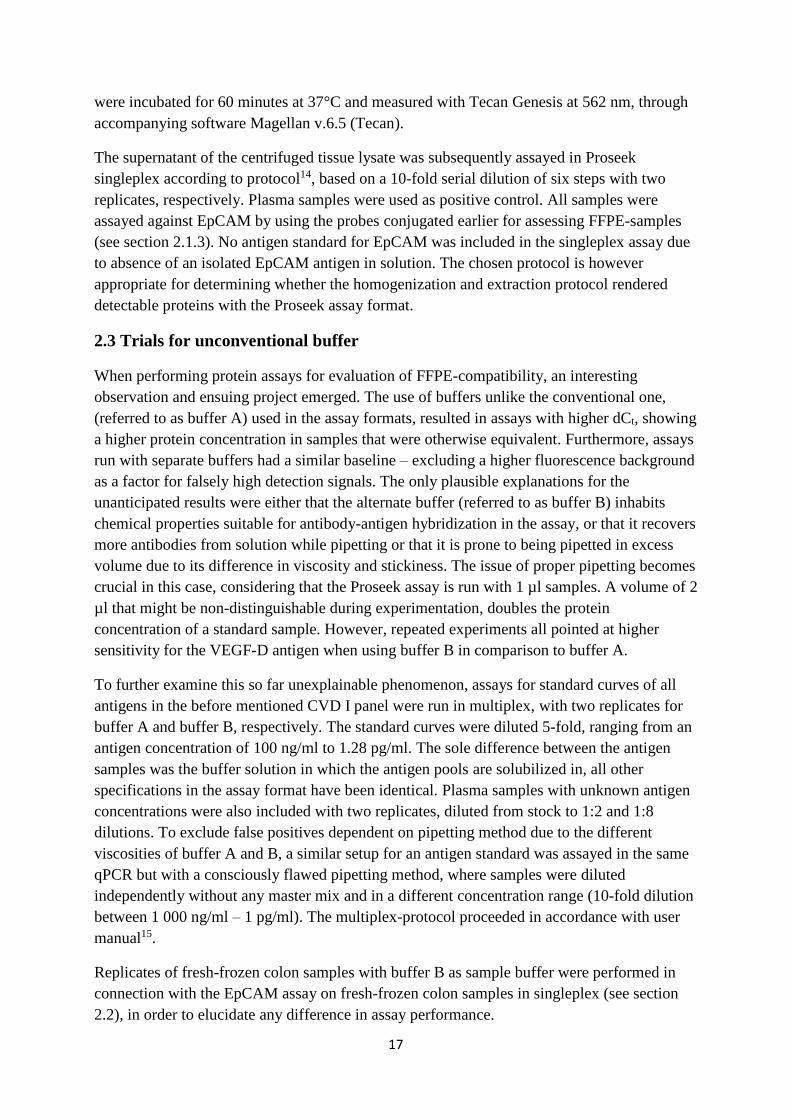
3.2 Homogenization protocol for fresh-frozen tissue
The fresh-frozen tissue lysate contained an adequate amount of protein (Table 5) for a
Proseek assay, as a dilution of 1:100 from the original lysate rendered a protein concentration
of 0.2 mg/ml.
dCt<1
66%
1<dCt<2
20%
dCt>2
14%
dCt for FFPE-samples (pH 6)
dCt<1
65%
1<dCt<2
15%
dCt>2
20%
dCt for FFPE-samples (pH 8)
0
1
2
3
4
5
6
7
8
9
dCt
Protein
Signals detecting dCt > 2 for antigens retrieved from FFPE-samples
pH 6
pH 8
20
Table 5 – BCA on homogenized fresh-frozen, human colon samples. Concentration calculated as mean of three
replicates
Dilution of lysate (fresh-frozen human colon) Protein concentration mg/ml
1:10 Above LOD
1:100 0.206
1:1 000 Under LOD
R2 for standard curve: 0.9574
The subsequent assay on EpCAM concentrations in the fresh-frozen colon sample rendered a
fluorescent signal clearly distinguishable from the fluorescence reference (Fig. 8).
Fig. 8 – Ct for EpCAM assay of fresh-frozen samples (human colon) in Proseek singleplex. All data points had
CV%<30 between double replicates.
3.3 Lowering Ct in Proseek assays by alternate sample buffer
3.3.1 Effects on antigen standard
Practically no protein in panel CVD I showed deteriorated results with buffer B while
approximately one third of the biomarkers showed a Ct lowered by 1 in the antigen
concentration span 160 pg/ml – 6.4 pg/ml (Table 6), indicating a stronger assay. Furthermore,
when examining the distribution of antigen concentrations showing lower Ct in buffer B
(Fig.l9), certain antigens are distinguished by their lower Ct for a wider range of antigen
concentration. Thus, lower Ct does not appear to be randomly distributed among the 92
biomarkers in CVD I as some antibody-antigen pairs appear to have a stronger inclination for
hybridizing in buffer B. In contrast, where Ct has been lower for buffer B compared to buffer
A, the drop in Ct has almost exclusively been lower than 1 and had a character of random
distribution. The protein assays which indicate a weaker assay with buffer B are SRC and
PAPPA (Fig. 9). Individual assays of all 92 biomarkers are graphically represented and
compared in appendix section 9.2, buffer A to buffer B. Three proteins in the CVD I panel
(PAR-1, MB and CA-125) did not give away any fluorescent signal in any control sample and
are therefore discarded in the results.
14
16
18
20
22
24
26
1:101:1001:1 0001:10 0001:100 0001:1 000 000Reference
Ct
Dilution
EpCAM assay, fresh-frozen human colon

21
Table 6 – Differences in dCt for buffer B compared to buffer A in Proseek MUX CVD I. Diluted antigen
samples.
Percent of biomarkers in CVD I meeting condition for ∆dCt=dCt Buffer B - dCt Buffer A
Buffer B rendering higher dCt (∆dCt>0)
Buffer B rendering lower dCt (∆dCt<0)
Antigen
concentration ∆dCt>0,5 ∆dCt>1 ∆dCt>2 ∆dCt>3 ∆dCt<0,5 ∆dCt<1 ∆dCt<2 ∆dCt<3
100 ng/ml 22% 4% 0% 0% 6% 2% 1% 1%
20 ng/ml 30% 7% 2% 1% 6% 2% 1% 0%
4 ng/ml 46% 16% 3% 1% 1% 1% 1% 0%
800 pg/ml 64% 18% 6% 1% 1% 1% 0% 0%
160 pg/ml 65% 35% 7% 0% 1% 0% 0% 0%
32 pg/ml 65% 36% 2% 0% 1% 0% 0% 0%
6.4 pg/ml 52% 27% 2% 0% 2% 0% 0% 0%
1.28 pg/ml 40% 18% 1% 0% 1% 0% 0% 0%
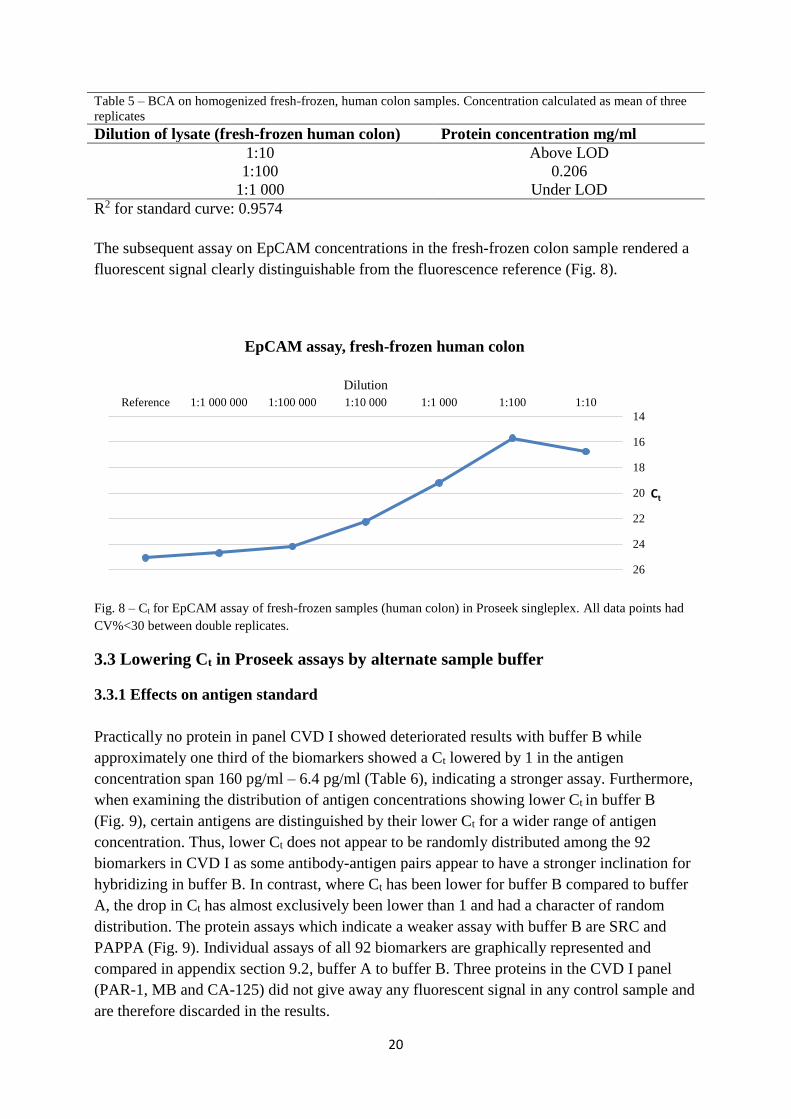
Out of 1 728 data points gathered from two replicates, 1 639 (94.8 %) had a CV%<30
(Fig.l10) signifying within-run assays with high precision. The experiment indicated that
certain proteins were prone to higher CV% and are over-represented in the share of unreliable
values (such as CHI3L1). However, the proteins with high CV% between replicates show sign
of being assayed for concentrations beyond their dynamic range when compared to earlier
validation studies12.

22
Fig. 9 – ∆dCt for antigen standard (1.28 pg/ml to 100 ng/ml, 5-fold dilution) for CVD I antigen standard in
Proseek MUX, buffer B to buffer A. A: Buffer B rendering higher dCt; B: Buffer B rendering lower dCt.
IL-8VEGF-AAMInc Ctrl 1CD40LGDF-15PlGFSELEEGFOPGSRCIL-1raIL-6CSTBMCP-1KLK6Gal-3Ext CtrlTRAILhK11TIE2TFTNF-R1PDGF Subunit BIL27-ACSF-1CXCL1LOX-1TRAIL-R2FGF-23SCFIL-18IL-6RATNF-R2MMP-3HSP 27TNFSF14PRLMPOGHMMP-1RETNFASPAPPAInc Ctrl 2Det CtrlPTX3RENCHI3L1ST2TIMBeta-NGFmAmPTRANCEHGFPSGL-1TMIL-16MMP-10U-PARCCL4CTSDRAGECCL3MMP-7CXCL-6ITGB1BP2CXCL16Dkk-1SIRT2GALAGRPEN-RAGECD40t-PAHB-EGFESM-1IL-4VEGF-DMMP-12SPON1CASP-8CTSL1CX3CL1FABP4BNPLEPCCL20NEMOFSPECAM-1NT-pro-BNPECP
100
ng/m
l
4 n
g/m
l
160
pg/m
l
6.4
pg
/ml
ΔdCt>0, buffer B compared to buffer A
(antigens, CVD I)
3,2-4,0
2,4-3,2
1,6-2,4
0,8-1,6
0,0-0,8
IL-8VEGF-AAMInc Ctrl 1CD40LGDF-15PlGFSELEEGFOPGSRCIL-1raIL-6CSTBMCP-1KLK6Gal-3Ext CtrlTRAILhK11TIE2TFTNF-R1PDGF Subunit BIL27-ACSF-1CXCL1LOX-1TRAIL-R2FGF-23SCFIL-18IL-6RATNF-R2MMP-3HSP 27TNFSF14PRLMPOGHMMP-1RETNFASPAPPAInc Ctrl 2Det CtrlPTX3RENCHI3L1ST2TIMBeta-NGFmAmPTRANCEHGFPSGL-1TMIL-16MMP-10U-PARCCL4CTSDRAGECCL3MMP-7CXCL-6ITGB1BP2CXCL16Dkk-1SIRT2GALAGRPEN-RAGECD40t-PAHB-EGFESM-1IL-4VEGF-DMMP-12SPON1CASP-8CTSL1CX3CL1FABP4BNPLEPCCL20NEMOFSPECAM-1NT-pro-BNPECP
100
ng/m
l
4 n
g/m
l
160
pg/m
l
6.4
pg
/ml
ΔdCt>0, buffer B compared to buffer A
(antigens, CVD I)
-1,6--0,8
-2,4--1,6
-3,2--2,4
-4,0--3,2
A B
23
Fig. 10 – CV% of Ct-measurements for CVD I antigen standard (100 ng/ml to 1.28 pg/ml, 5-fold dilution, two
replicates) in Proseek MUX, buffer A and buffer B. Values indicate within-run precision.
IL-8VEGF-AAMInc Ctrl 1CD40LGDF-15PlGFSELEEGFOPGSRCIL-1raIL-6CSTBMCP-1KLK6Gal-3Ext CtrlTRAILhK11TIE2TFTNF-R1PDGF Subunit BIL27-ACSF-1CXCL1LOX-1TRAIL-R2FGF-23SCFIL-18IL-6RATNF-R2MMP-3HSP 27TNFSF14PRLMPOGHMMP-1RETNFASPAPPAInc Ctrl 2Det CtrlPTX3RENCHI3L1ST2TIMBeta-NGFmAmPTRANCEHGFPSGL-1TMIL-16MMP-10U-PARCCL4CTSDRAGECCL3MMP-7CXCL-6ITGB1BP2CXCL16Dkk-1SIRT2GALAGRPEN-RAGECD40t-PAHB-EGFESM-1IL-4VEGF-DMMP-12SPON1CASP-8CTSL1CX3CL1FABP4BNPLEPCCL20NEMOFSPECAM-1NT-pro-BNPECP
100
ng/m
l
4 n
g/m
l
160
pg/m
l
6.4
pg
/ml
buff
.A
CV for antigen standard samples
in buffer A
0%-30% 30%-60%
IL-8VEGF-AAMInc Ctrl 1CD40LGDF-15PlGFSELEEGFOPGSRCIL-1raIL-6CSTBMCP-1KLK6Gal-3Ext CtrlTRAILhK11TIE2TFTNF-R1PDGF Subunit BIL27-ACSF-1CXCL1LOX-1TRAIL-R2FGF-23SCFIL-18IL-6RATNF-R2MMP-3HSP 27TNFSF14PRLMPOGHMMP-1RETNFASPAPPAInc Ctrl 2Det CtrlPTX3RENCHI3L1ST2TIMBeta-NGFmAmPTRANCEHGFPSGL-1TMIL-16MMP-10U-PARCCL4CTSDRAGECCL3MMP-7CXCL-6ITGB1BP2CXCL16Dkk-1SIRT2GALAGRPEN-RAGECD40t-PAHB-EGFESM-1IL-4VEGF-DMMP-12SPON1CASP-8CTSL1CX3CL1FABP4BNPLEPCCL20NEMOFSPECAM-1NT-pro-BNPECP
100
ng/m
l
4 n
g/m
l
160
pg/m
l
6.4
pg
/ml
buff
.B
CV for antigen standard samples in
buffer B
0%-30% 30%-60%>30% >30%
24
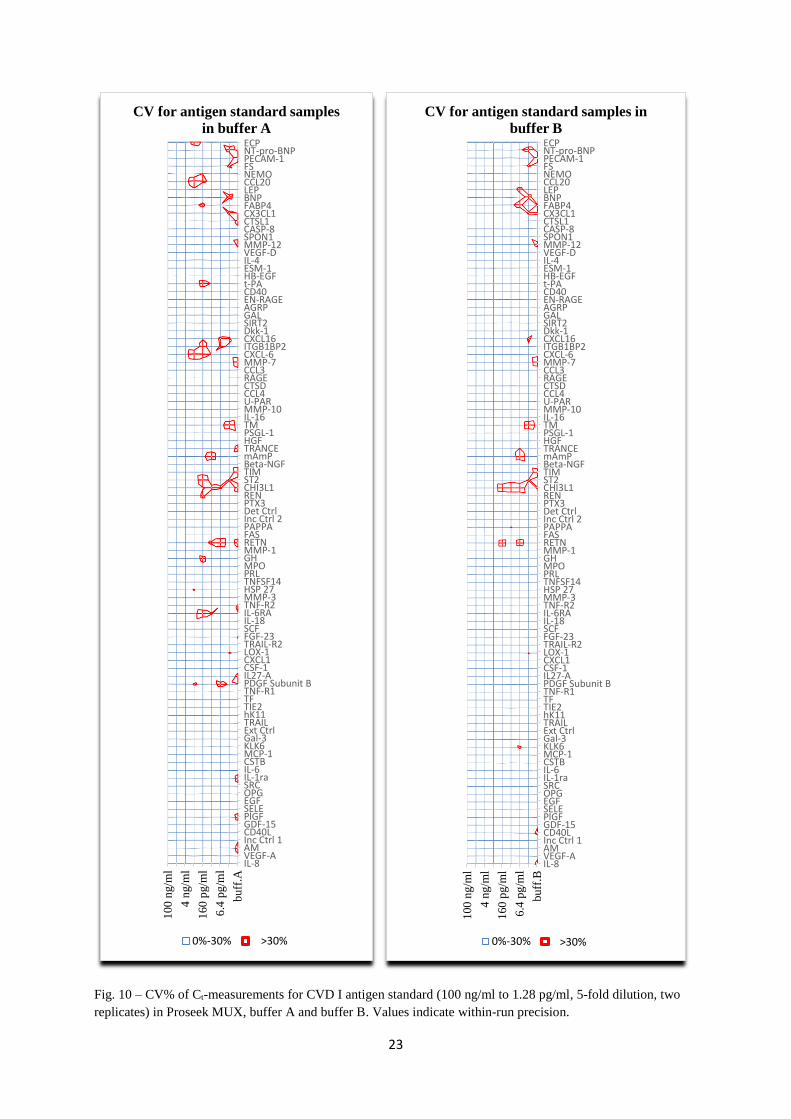
When examining the lower antigen concentration levels, which were affected the most
between samples diluted through a rigorous method, and those in a flawed method, a
correlation could be seen towards lower Ct between both pipetting techniques for buffer B
(Fig. 11). To which extent different pipetting procedures affect results is cumbersome to
evaluate from this single experiment with arbitrary concentrations. However, there is a clear
tendency towards higher sensitivity for different concentrations with both pipetting
techniques.
Fig. 11 – Compared ∆dCt, antigen standard, buffer B to buffer A performed in Proseek MUX CVD I. A: 100
pg/ml flawed pipetting; B: 32 pg/ml appropriate pipetting; C: 10 pg/ml flawed pipetting; D: 160 pg/ml
appropriate pipetting.
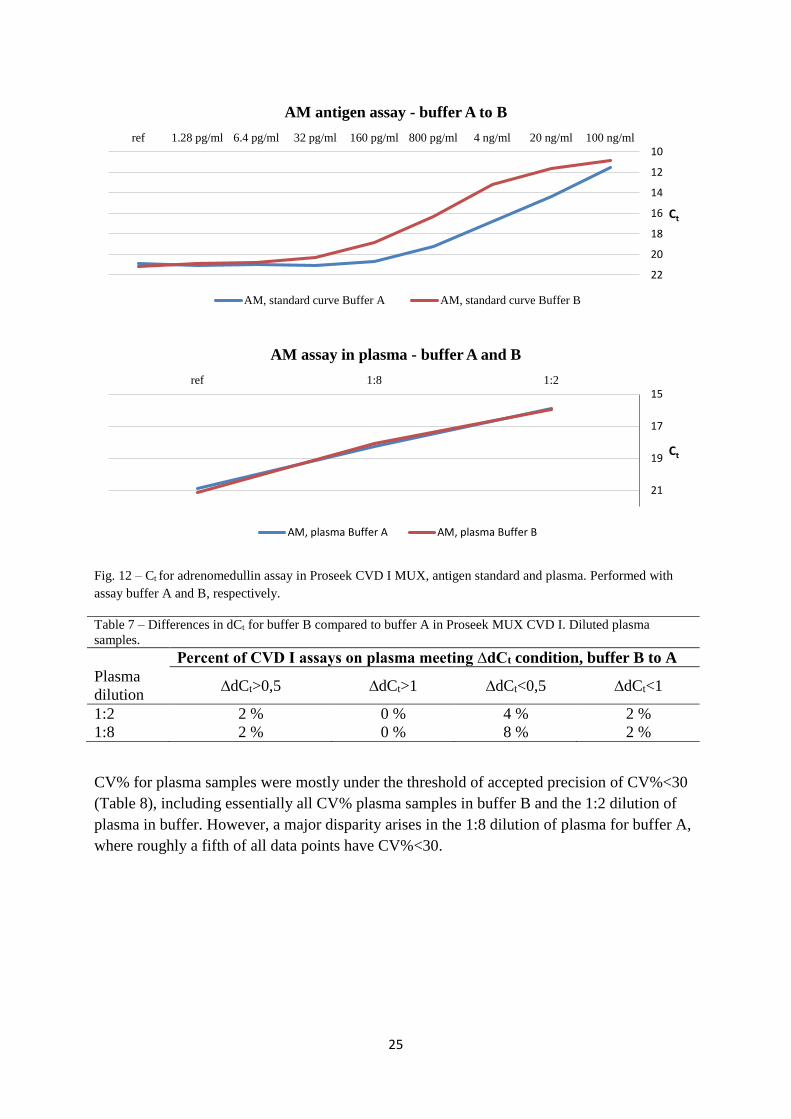
3.3.2 Effects on biological samples
No effect on Ct can be found in plasma samples when comparing assays run with buffer B to
buffer A (Table 7). For instance, a great contrast appears in the two buffers’ effects on Ct
when comparing the curves for adrenomedullin (AM) as antigen standard and detection from
plasma samples (Fig. 12).
-2
-1
0
1
2
3
ΔdCt
A B C D
25
Fig. 12 – Ct for adrenomedullin assay in Proseek CVD I MUX, antigen standard and plasma. Performed with
assay buffer A and B, respectively.
Table 7 – Differences in dCt for buffer B compared to buffer A in Proseek MUX CVD I. Diluted plasma
samples.
Percent of CVD I assays on plasma meeting ∆dCt condition, buffer B to A
Plasma
dilution ∆dCt>0,5 ∆dCt>1 ∆dCt<0,5 ∆dCt<1
1:2 2 % 0 % 4 % 2 %
1:8 2 % 0 % 8 % 2 %
CV% for plasma samples were mostly under the threshold of accepted precision of CV%<30
(Table 8), including essentially all CV% plasma samples in buffer B and the 1:2 dilution of
plasma in buffer. However, a major disparity arises in the 1:8 dilution of plasma for buffer A,
where roughly a fifth of all data points have CV%<30.
10
12
14
16
18
20
22
100 ng/ml20 ng/ml4 ng/ml800 pg/ml160 pg/ml32 pg/ml6.4 pg/ml1.28 pg/mlref
Ct
AM antigen assay - buffer A to B
AM, standard curve Buffer A AM, standard curve Buffer B
15
17
19
21
1:21:8ref
Ct
AM assay in plasma - buffer A and B
AM, plasma Buffer A AM, plasma Buffer B
26
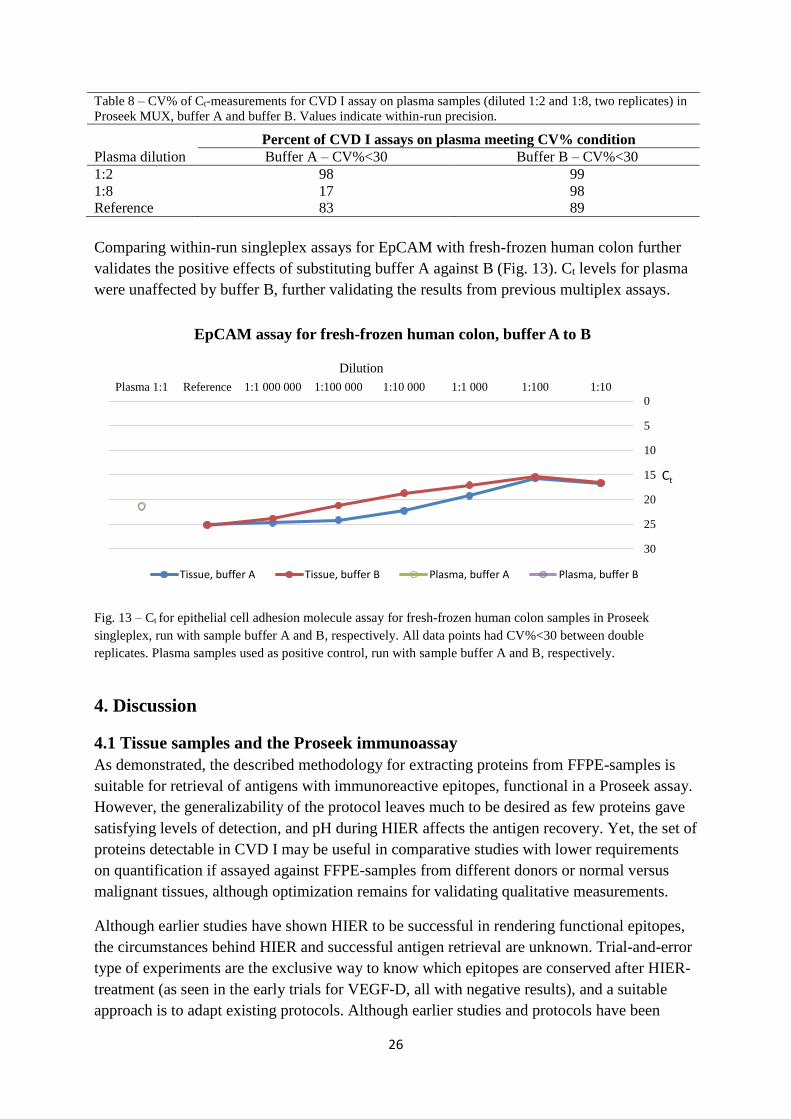
Table 8 – CV% of Ct-measurements for CVD I assay on plasma samples (diluted 1:2 and 1:8, two replicates) in
Proseek MUX, buffer A and buffer B. Values indicate within-run precision.
Percent of CVD I assays on plasma meeting CV% condition
Plasma dilution Buffer A – CV%<30 Buffer B – CV%<30
1:2 98 99
1:8 17 98
Reference 83 89
Comparing within-run singleplex assays for EpCAM with fresh-frozen human colon further
validates the positive effects of substituting buffer A against B (Fig. 13). Ct levels for plasma
were unaffected by buffer B, further validating the results from previous multiplex assays.
Fig. 13 – Ct for epithelial cell adhesion molecule assay for fresh-frozen human colon samples in Proseek
singleplex, run with sample buffer A and B, respectively. All data points had CV%<30 between double
replicates. Plasma samples used as positive control, run with sample buffer A and B, respectively.
4. Discussion
4.1 Tissue samples and the Proseek immunoassay
As demonstrated, the described methodology for extracting proteins from FFPE-samples is
suitable for retrieval of antigens with immunoreactive epitopes, functional in a Proseek assay.
However, the generalizability of the protocol leaves much to be desired as few proteins gave
satisfying levels of detection, and pH during HIER affects the antigen recovery. Yet, the set of
proteins detectable in CVD I may be useful in comparative studies with lower requirements
on quantification if assayed against FFPE-samples from different donors or normal versus
malignant tissues, although optimization remains for validating qualitative measurements.
Although earlier studies have shown HIER to be successful in rendering functional epitopes,
the circumstances behind HIER and successful antigen retrieval are unknown. Trial-and-error
type of experiments are the exclusive way to know which epitopes are conserved after HIER-
treatment (as seen in the early trials for VEGF-D, all with negative results), and a suitable
approach is to adapt existing protocols. Although earlier studies and protocols have been
0
5
10
15
20
25
30
1:101:1001:1 0001:10 0001:100 0001:1 000 000ReferencePlasma 1:1
Ct
Dilution
EpCAM assay for fresh-frozen human colon, buffer A to B
Tissue, buffer A Tissue, buffer B Plasma, buffer A Plasma, buffer B
27
regarded in this study, the mode of procedure has mainly stemmed from what has been
available at Olink and reasonable to obtain within set timeframes. One major improvement to
the developed protocol for protein extraction from FFPE is needed regarding the
homogenization. If solubilized protein concentration levels were to rise in lysates, so could
the detected levels of antigen and maybe even antigens that were not detectable with the
contemporary protocol. Earlier studies have conducted serial treatments of the pellet during
extraction16, a phase which has been neglected in this study. A straight forward way of
increasing the concentration of solubilized protein, would be to use a dispersing aggregate
designed for volumes below 100 µl, adding of stabilizers such as SDS17, or by using reagents
which have been validated for FFPE-tissue16. Standardizing the antigen retrieval methods for
several types of FFPE-tissues and their contained proteins may be troublesome for some
antigens or FFPE-samples as dehydration and paraffin embedding procedures differ.
However, the sampling techniques can be standardized by a more practically convenient
method for retaining equal amount of tissue and protein in the homogenization protocol, as
has been shown in earlier studies5.
Fresh-frozen tissue, in contrast to FFPE-tissue, have been shown to easily undergo
homogenization and protein extraction in a standardized manner, with protein concentration
in lysates reaching compatible levels for Proseek assays (>0.021 mg/ml) (Mats Gullberg,
personal communication). No greater reasoning is justifiable on possibilities of quantifying
protein concentrations in fresh-frozen tissue due to the absence of a valid antigen standard in
the experimental assay.
4.2 Implications of alternate sample buffer
Considering the undergone methodology for comparing buffer A against buffer B and its
effect on Ct for antigens, the results indicate that one or several properties of buffer B either
facilitate the binding of antibodies to their respective antigen pairs or simply hinder antigen
loss during pipetting. As the methodology only differed in the composition of sample buffer,
the only plausible explanation for possible false-positives is a faulty pipetting technique. The
scenario of inconsistent handling of the small sample volumes (1 µl) is however unlikely,
considering that 1) Ct was lower for different diluting techniques in assays performed with
buffer B, 2) certain proteins in CVD I were prone to render better assays with buffer B in
multiplex – indicating that deviations were not random, and 3) even if a faulty technique has
been used during pipetting, some differences in Ct are too high (for example adrenomedullin)
to be explained by excess sample volume caused by different viscosities or pipetting
procedures. By substituting the conventional sample buffer used for setting up antigen
standards in Proseek with buffer B, measured protein concentrations may come closer to the
absolute values – raising opportunities for improved quantifications. Futures studies could
however benefit from studying the effect on Ct when assaying antigen standards in the same
dilution range, but with different pipetting techniques.
Experiments pertaining to plasma samples diluted 8-fold in buffer A may have had unreliable
standard deviations between replicates. Yet the overall results for plasma in buffer B to A
overwhelmingly point to plasma being unaffected by buffer B. In the view of equal Ct

28
observed between buffer A and B in plasma samples, buffer B may hold equivalent properties
as the biological samples the assay is run in. In that case, by using buffer B in the antigen
standard from which sample measurements are related to, one can reach a more reliable
quantification of proteins in complex biological samples. However, trials with fresh-frozen
human colon showed a ΔdCt>3 at certain concentrations for detected EpCAM when using
sample buffer B compared to A. Further dilution of plasma in buffer B may therefore raise
observations of buffer B affecting Ct, as the whole dynamic range for plasma was not covered
in this study. An equally interesting discussion is related to the before mentioned CV% of 8-
fold dilution of plasma in buffer A. I argue that the high CV% has to do with my own
malpractice, but while working with this buffer I have had to reassess my own convictions at
several occasions due to its exact properties being unknown. Future studies could merit from
trying to validate if the disparity in CV% for one particular concentration level diluted with
buffer A was a simple misfortune, or if buffer B actually raises precision in diluted plasma
samples in comparison to buffer A.
As the study for buffer B emerged as a consequence of the initial research plan regarding the
compatibility of FFPE-samples and immunoassays, no extensive literature has been
investigated to discuss any theories behind buffer properties on immunoreactivity. Elucidating
properties for used buffers becomes even more cumbersome due to the undisclosed nature of
components in all commercial buffers used. Although empirical data found in this study point
to assays with plasma samples being unaffected by buffer B, the circumstances of how the
plasma samples have been obtained and processed are unknown – making it difficult to
determine whether the properties of buffer B are intrinsic to plasma or not. Buffer B did
however show a strong correlation between lowered Ct with fresh-frozen tissue lysates, yet
only assayed with antibodies for EpCAM.
5 Conclusions
At this point, the functionality of developing a standardized FFPE-protocol for entire panels
of biomarkers is far-fetched. Nonetheless, a proof of concept for assaying FFPE-samples in
Olink’s PEA-mediated Proseek immunoassay has been established in this study. As shown,
some proteins extracted from FFPE-samples are detected in a Proseek assay through the given
homogenization and extraction protocol. The homogenization and extraction can thus be
examined further for improvement on biomarkers of interest in an ad-hoc manner.
A homogenization protocol and extraction method for fresh-frozen tissue has been adapted to
be compatible for immunoassays with Olink’s PEA technology. Further validation is needed
for including a larger set of biomarkers assayed in different types of tissue with validated
antigen standards.
Concluding from the discussion of the affected Ct for the CVD I assay, I argue that the
properties for Buffer B are suitable for one or several categories of proteins and that more
research on this matter is justifiable. If properly validated and incorporated into the Proseek
protocol, Buffer B would provide a powerful and cost-efficient improvement to the

29
contemporary immunoassay panels by lowering Ct. A suggestion for further research is to
combine the assessment of buffer B in a wider range of biological samples with other panels
of biomarkers and integrating it into earlier steps in the assay protocol to determine possible
improvements.
All in all, the results obtained in this study regarding FFPE, fresh-frozen tissue and buffer B
provide a vast data pool which can be statistically analysed more extensively if needed.
6 Acknowledgments
I would like to convey my special thanks to my supervisor Mats Gullberg at Olink
Bioscience, for guiding me through the project without ever compromising on my own
creativity, to my scientific reviewer Masood Kamali-Moghaddam at the department of
Immunology, Genetics and Pathology at Uppsala University, for reviewing my work, to Ann-
Catrin Andersson at Olink Bioscience for going beyond her formal duties and tutoring me
during the project’s onset, and to Lars-Göran Johansson and Lena Henriksson for reviewing
my report.
In addition to all the foregoing, I extend my thanks and appreciation to all employees
affiliated with Olink Bioscience, who have every so often facilitated my familiarization of
routines and procedures at the company.
30
7 References
1. Addis MF, Tanca A, Pagnozzi D, Crobu S, Fanciulli G, Cossu-Rocca P, Uzzau S. 2009.
Generation of high-quality protein extracts from formalin-fixed, paraffin-embedded tissues.
Proteomics 9: 3815-3823.
2. Farmilo A, Stead RH. 2006. Fixation and Processing, in Immunohistochemical Staining
Methods, Carpinteria, California, USA, Dako, pp. 27-33.
3. Fredriksson S, Dixon W, Ji H, Koong AC, Mindrinos M, Davis RW. 2007. Multiplexed protein
detection by proximity ligation for cancer biomarker validation. Nature Methods 4(4): 327-
329.
4. Fredriksson S, Gullberg M, Jarvius J, Olsson C, Pietras K, Gústafsdóttir SM, Östman A,
Landegren U. 2002. Protein detection using proximity-dependent DNA ligation assays. Nature
Biotechnology 20: 473-476.
5. Gräntzdörffer I, Yumlu S, Gioeva Z, von Wasielewski M. Ebert PA, Röcken C. 2010.
Comparison of different tissue sampling methods for protein extraction from formalin-fixed
and paraffin-embedded tissue specimens. Experimental and Molecular Pathology 88: 190–
196.
6. Gullberg M, Gústafsdóttir SM, Schallmeiner E, Jarvius J, Bjarnegård M, Betsholtz C, Landegren
U, Fredriksson S. 2004. Cytokine detection by antibody-based proximity ligation. Proceedings
of the National Academy of Sciences 101(22): 8420-8424.
7. Guo H, Liu W, Ju Z, Tamboli P, Jonasch E, Mills GB, Lu Y, Hennessy BT, Tsavachidou D. 2012.
An efficient procedure for protein extraction from formalin-fixed, paraffin-embedded tissues
for reverse phase protein arrays. Proteome Science 10(56): 1-12.
8. Key M, Boenisch T. 2006. Antigen Retrieval, in Immunohistochemical Staining Methods,
Carpinteria, California, USA, Dako, pp. 41-44.
9. Life Technologies, “Real-Time PCR: Understanding Ct Application Note | Life Technologies,”
2013. [Online]. Available: http://www.lifetechnologies.com/se/en/home/life-
science/pcr/real-time-pcr/qpcr-education/pcr-understanding-ct-application-note.html.
[Accessed 2 December 2013].
10. Lundberg M, Buch SB, Assarsson E, Villablanca A, Tran B, Gee N, Knowles M, Nielsen SB,
González EC, Martin R, Nilsson O, Fermer C, Schlingemann J, Jarle IC, Nielsen HJ, Ekström B,
Andersson C, Gustafsson M, Brunner N, Stenvang J, Fredriksson S. 2011. Multiplexed
Homogeneous Proximity Ligation Assays for High-throughput Protein Biomarker Research in
Serological Material. Molecular & Cellular Proteomics 10(4): 1-10.
31
11. Lundberg M, Eriksson A, Tran B, Assarsson E, Fredriksson S. 2011. Homogenous antibody-
based proximity extension assays provide sensitive and specific detection of low-abundant
proteins in human blood. Nucleic Acids Research 39(15): 1-8.
12. Olink Bioscience, “Chitinase-3-like protein 1 (CHI3LI) CVDI | Olink Bioscience,” [Online].
Available: http://www.olink.com/node/994. [Accessed 12 01 2014].
13. Olink Bioscience, “Proseek Multiplex CVD I Data Package,” [Online]. Available:
http://www.olink.com/sites/default/files/0969%20v1.1%20Proseek%20Multiplex%20CVD%2
0I%20Data%20Package_final.pdf. [Accessed 15 01 2014].
14. Olink Bioscience, “User Manuals and Short Instructions | Olink Bioscience,” [Online].
Available: http://www.olink.com/products/proseek/downloads/proseek-manuals-and-
guidelines. [Accessed 5 January 2014].
15. Olink Bioscience, “User Manuals and Short Instructions | Olink Bioscience,” [Online].
Available: http://www.olink.com/products/proseek-multiplex/downloads/user-manuals-and-
short-instructions. [Accessed 5 January 2014].
16. Scicchitano MS, Dalmas DA, Boyce RW, Thomas HC, Frazier KS. 2009. Protein Extraction of
Formalin-fixed, Paraffin-embedded Tissue Enables Robust Proteomic Profiles by Mass
Spectrometry. Journal of Histochemistry & Cytochemistry 57(9): 849–860.
17. Shi SR, Liu C, Balgley BM, Lee C, Taylor CR. 2006. Protein Extraction from Formalin-fixed,
Paraffin-embedded Tissue Sections: Quality Evaluation by Mass Spectrometry. Journal of
Histochemistry & Cytochemistry 54(6): 739-743.
18. The Human Protein Atlas, “The Human Protein Atlas,” [Online]. Available:
http://www.proteinatlas.org/ENSG00000119888/tissue. [Accessed 4 January 2014].
19. The Human Protein Atlas, “The Human Protein Atlas,” [Online]. Available:
http://www.proteinatlas.org/ENSG00000165197/tissue. [Accessed 03 January 2014].
20. Thermo Fisher Scientific. 2009. Introduction to Protein Extraction, in Thermo Scientific Pierce
Cell Lysis Technical Handbook, pp. 2-5.
21. Thorsen SB, Lundberg M, Villablanca A, Christensen SLT, Christensen KB, Nielsen SB, Knowles
M, Gee N, Jørgen HN, Brünner N, Jarle IC, Fredriksson S, Stenvang J, Assarsson E. 2013.
Detection of serological biomarkers by proximity extension assay for detection of colorectal
neoplasias in symptomatic individuals. Journal of Translational Medicine 11(253): 1-13.

32
8 Appendix
8.1 Biomarkers in Olink-panel CVD I
Table 9 – List of biomarkers in the CVD I panel
Adrenomedullin (AM) Agouti-related protein (AGRP)
Angiopoietin-1 receptor (TIE2) Beta-nerve growth factor (Beta-NGF)
Cathepsin D (CTSD) Caspase-8 (CASP-8)
Cathepsin L1 (CTSL1) C-C motif chemokine 20 (CCL20)
C-C motif chemokine 3 (CCL3) C-C motif chemokine 4 (CCL4)
CD40 ligand (CD40L) Chitinase-3-like protein 1 (CHI3LI)
C-X-C motif chemokine 1 (CXCL1) C-X-C motif chemokine 6 (CXCL6)
C-X-C motif chemokine 16 (CXCL16) Cystatin-B (CSTB)
Dickkopf-related protein 1 (Dkk-1) Endothelial cell-specific molecule 1 (ESM-1)
Eosinophil cationic protein (ECP) Epidermal growth factor (EGF)
E-selectin (SELE) Fatty acid-binding protein, adipocyte (FABP4)
Fibroblast growth factor 23 (FGF-23) Follistatin (FS)
Fractalkine (CX3CL1) Galanin peptides (GAL)
Galectin-3 (Gal-3) Growth hormone (GH)
Growth/differentiation factor 15 (GDF-15) Heat shock 27 kDa protein (HSP 27)
Heparin-binding EGF-like growth factor (HB-EGF) Hepatocyte growth factor (HGF)
Interleukin-1 receptor antagonist protein (IL-1ra) Interleukin-18 (IL-18)
Interleukin-27 subunit alpha (IL27-A) Interleukin-4 (IL-4)
Interleukin-6 (IL-6) Interleukin-6 receptor subunit alpha (IL-6RA)
Interleukin-8 (IL-8) Kallikrein-11 (hK11)
Kallikrein-6 (KLK6) Lectin-like oxidized LDL receptor 1 (LOX-1)
Leptin (LEP) Macrophage colony-stimulating factor 1 (CSF-1)
Matrix metalloproteinase-1 (MMP-1) Matrix metalloproteinase-10 (MMP-10)
Matrix metalloproteinase-12 (MMP-12) Matrix metalloproteinase-3 (MMP-3)
Matrix metalloproteinase-7 (MMP-7) Melusin (ITGB1BP2)
Membrane-bound aminopeptidase P (mAmP) Monocyte chemotactic protein 1 (MCP-1)
Myeloperoxidase (MPO) Myoglobin (MB)
Natriuretic peptides B (BNP) NF-kappa-B essential modulator (NEMO)
N-terminal pro-B-type natriuretic peptide (NT-pro-
BNP)
Osteoprotegerin (OPG)
Ovanrian cancer-related tumor marker CA 125 (CA-
125)
Pappalysin-1 (PAPPA)
Pentraxin-related protein PTX3 (PTX3) Placenta growth factor (PlGF)
Platelet endothelial cell adhesion molecule (PECAM-1) Platelet-derived growth factor subunit B (PDGF
subunit B)
Interleukin-16 (IL16) Prolactin (PRL)
Protein S100-A12 (EN-RAGE) Proteinase-activated receptor 1 (PAR-1)
Proto-oncogene tyrosine-protein kinase Src (SRC) P-selectin glycoprotein ligand 1 (PSGL-1)
Receptor for advanced glycosylation end products
(RAGE)
Renin (REN)
33
Resistin (RETN) SIR2-like protein (SIRT2)
Spondin-1 (SPON1) ST2 protein (ST2)
Stem cell factor (SCF) Thrombomodulin I
TIM-1 (TIM) Tissue factor (TF)
Tissue-type plasminogen activator (t-PA) TNF-related activation-induced cytokine
(TRANCE)
TNF-related apoptosis-inducing ligand (TRAIL) TNF-related apoptosis-inducing ligand receptor 2
(TRAIL-R2)
Tumor necrosis factor ligand superfamily member 14
(TNFSF14)
Tumor necrosis factor receptor 1 (TNF-R1)
Tumor necrosis factor receptor 2 (TNF-R2) Tumor necrosis factor receptor superfamily
member 5 (CD40)
Tumor necrosis factor receptor superfamily member 6
(FAS)
Urokinase plasminogen activator surface receptor
(U-PAR)
Vascular endothelial growth factor A (VEGF-A) Vascular endothelial growth factor D (VEGF-D)
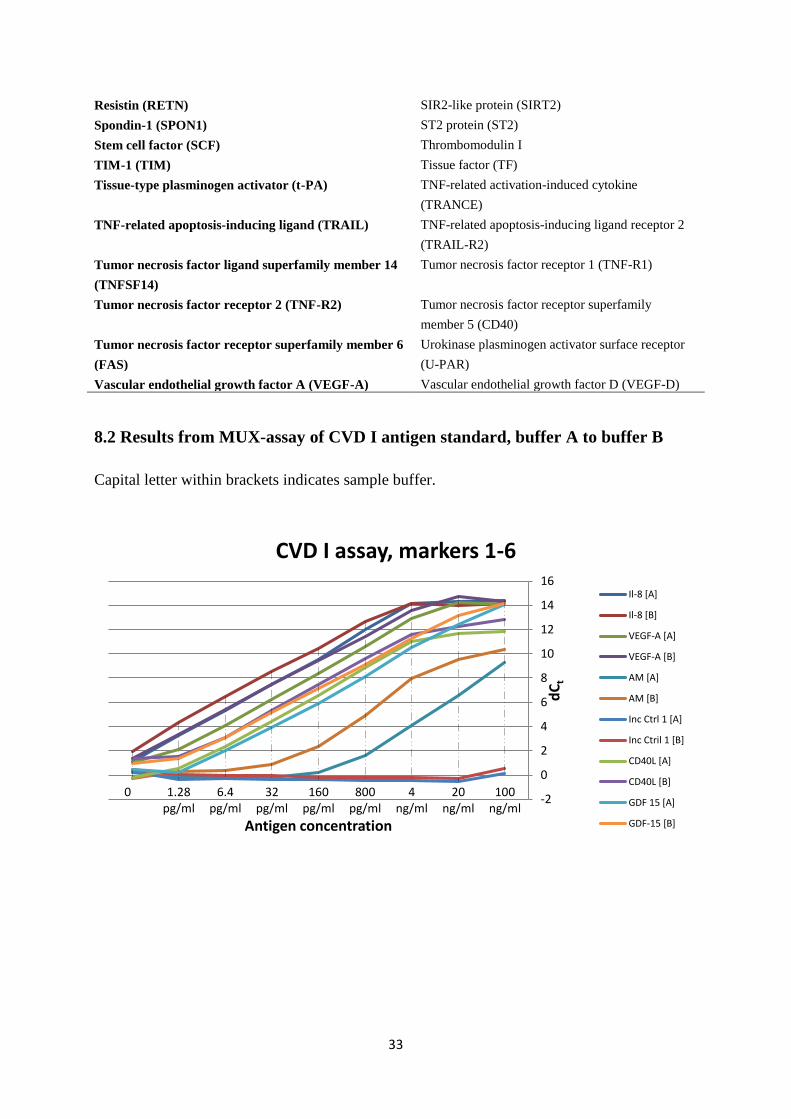
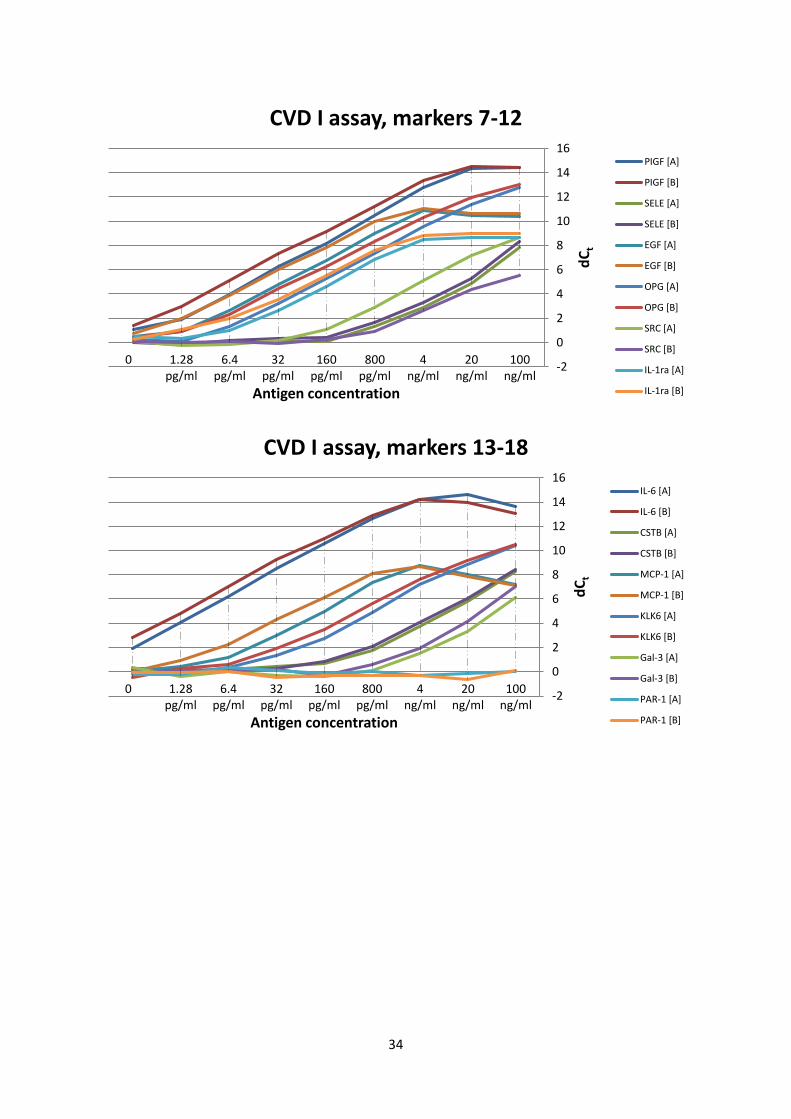
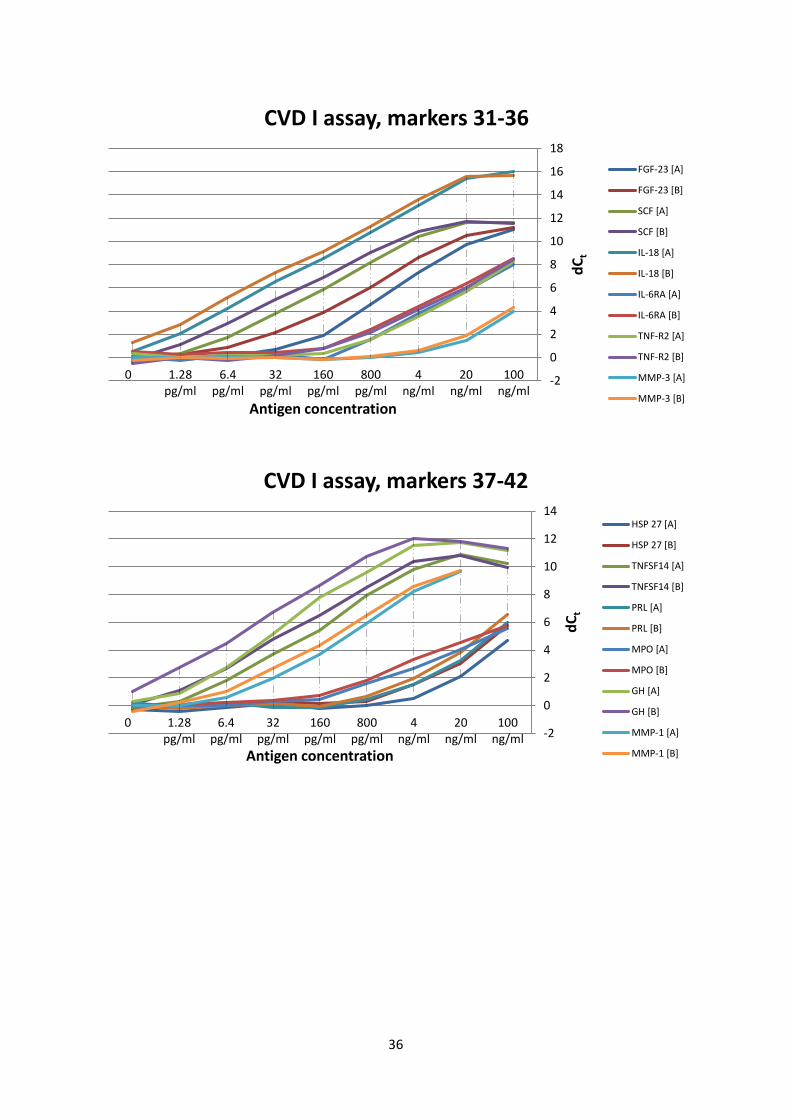
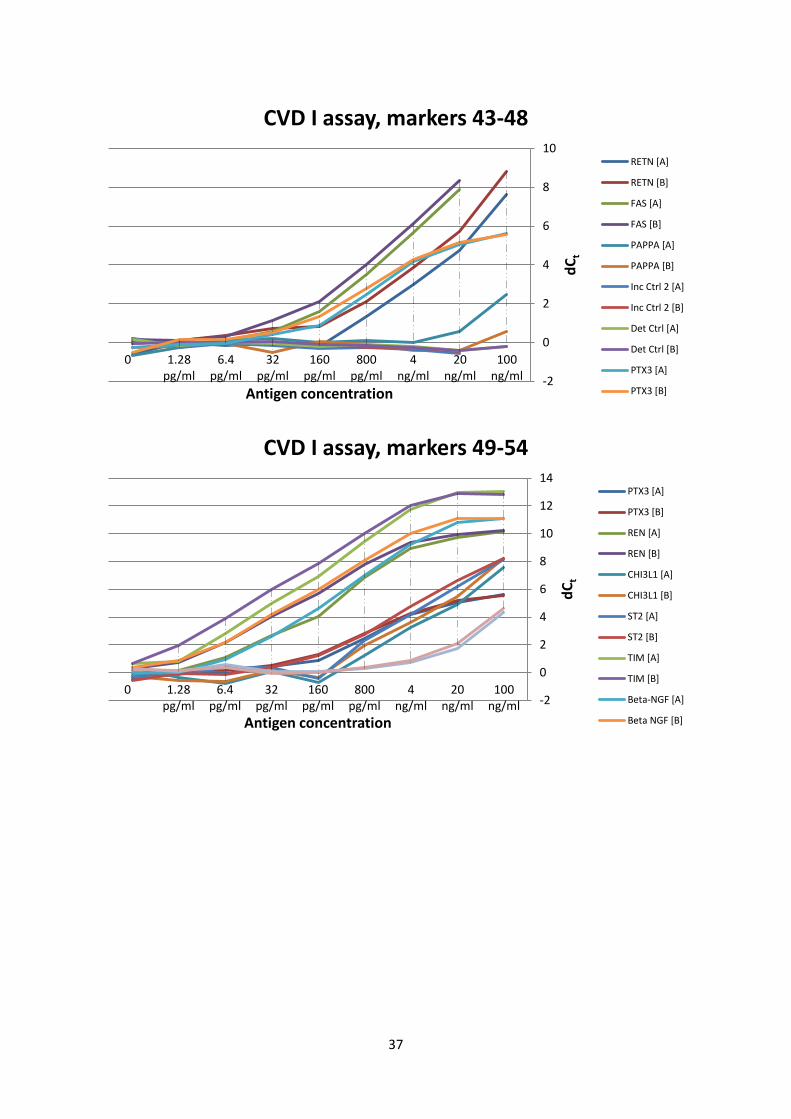
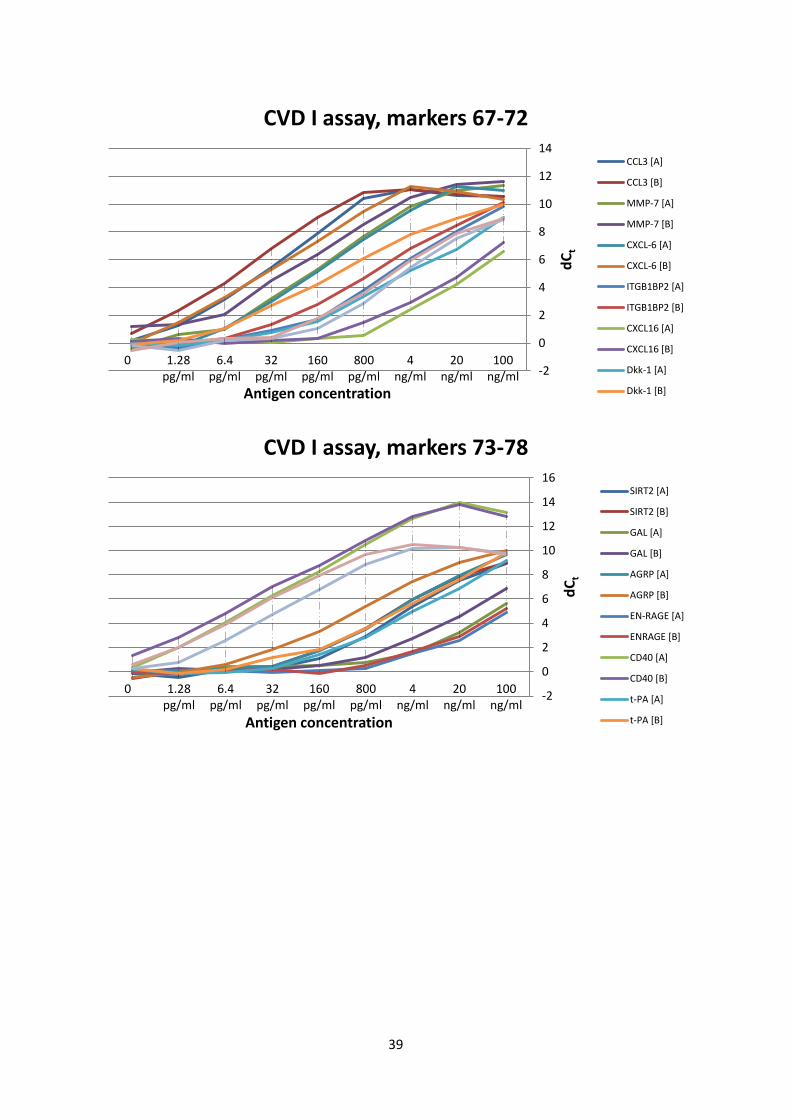
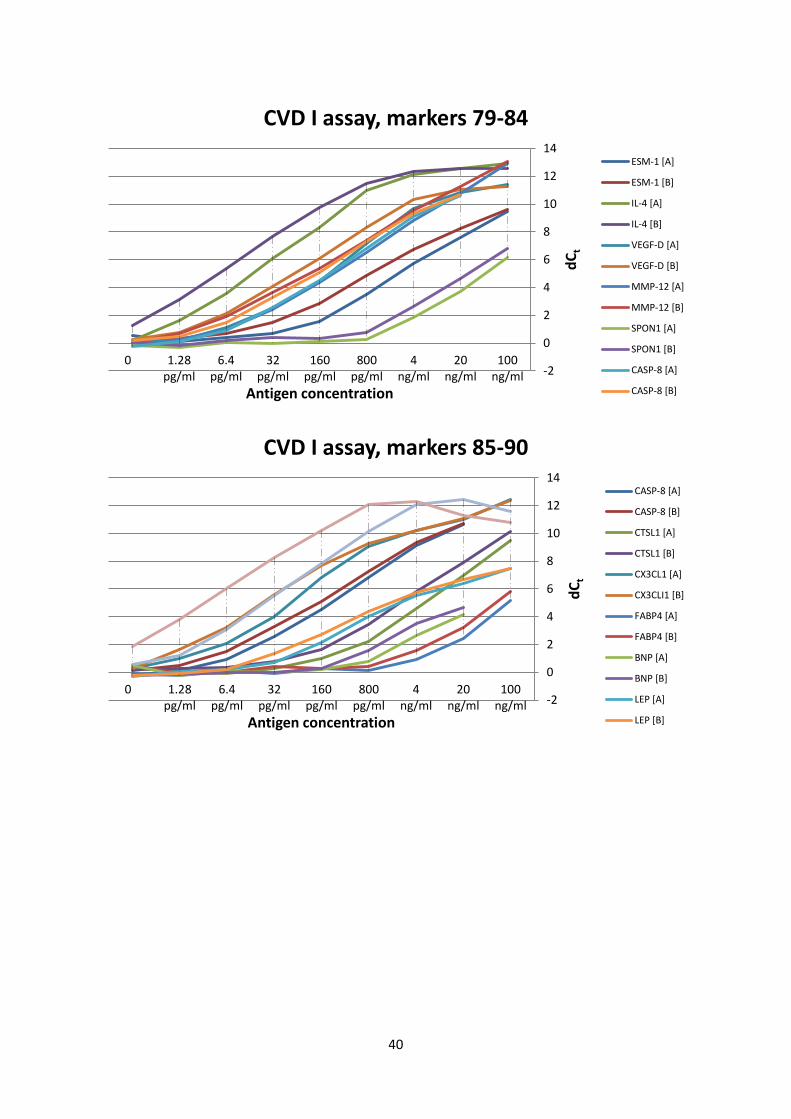
8.2 Results from MUX-assay of CVD I antigen standard, buffer A to buffer B
Capital letter within brackets indicates sample buffer.
-2
0
2
4
6
8
10
12
14
16
100ng/ml
20ng/ml
4ng/ml
800pg/ml
160pg/ml
32pg/ml
6.4pg/ml
1.28pg/ml
0
dC
t
Antigen concentration
CVD I assay, markers 1-6
Il-8 [A]
Il-8 [B]
VEGF-A [A]
VEGF-A [B]
AM [A]
AM [B]
Inc Ctrl 1 [A]
Inc Ctril 1 [B]
CD40L [A]
CD40L [B]
GDF 15 [A]
GDF-15 [B]
34
-2
0
2
4
6
8
10
12
14
16
100ng/ml
20ng/ml
4ng/ml
800pg/ml
160pg/ml
32pg/ml
6.4pg/ml
1.28pg/ml
0
dC
t
Antigen concentration
CVD I assay, markers 7-12
PIGF [A]
PIGF [B]
SELE [A]
SELE [B]
EGF [A]
EGF [B]
OPG [A]
OPG [B]
SRC [A]
SRC [B]
IL-1ra [A]
IL-1ra [B]
-2
0
2
4
6
8
10
12
14
16
100ng/ml
20ng/ml
4ng/ml
800pg/ml
160pg/ml
32pg/ml
6.4pg/ml
1.28pg/ml
0
dC
t
Antigen concentration
CVD I assay, markers 13-18
IL-6 [A]
IL-6 [B]
CSTB [A]
CSTB [B]
MCP-1 [A]
MCP-1 [B]
KLK6 [A]
KLK6 [B]
Gal-3 [A]
Gal-3 [B]
PAR-1 [A]
PAR-1 [B]

35
-2
0
2
4
6
8
10
12
14
16
100ng/ml
20ng/ml
4ng/ml
800pg/ml
160pg/ml
32pg/ml
6.4pg/ml
1.28pg/ml
0
dC
t
Antigen concentration
CVD I assay, markers 19-24
Extr Ctrl [A]
Extr Ctrl [B]
TRAIL [A]
TRAIL [B]
hK11 [A]
hK11 [B]
TIE2 [A]
TIE2 [B]
TF [A]
TF [B]
TNF-R1 [A]
TNF-R1 [B]
-2
0
2
4
6
8
10
12
14
16
100ng/ml
20ng/ml
4ng/ml
800pg/ml
160pg/ml
32pg/ml
6.4pg/ml
1.28pg/ml
0
dC
t
Antigen concentration
CVD I assay, markers 25-30
PDGF Subunit B [A]
PDGF Subunit B [B]
IL27-A [A]
IL27-A [B]
CSF-1 [A]
CSF-1 [B]
CXCL11 [A]
CXCL1 [B]
LOX-1 [A]
LOX-1 [B]
TRAIL-R2 [A]
TRAIL-R2 [B]
36
-2
0
2
4
6
8
10
12
14
16
18
100ng/ml
20ng/ml
4ng/ml
800pg/ml
160pg/ml
32pg/ml
6.4pg/ml
1.28pg/ml
0
dC
t
Antigen concentration
CVD I assay, markers 31-36
FGF-23 [A]
FGF-23 [B]
SCF [A]
SCF [B]
IL-18 [A]
IL-18 [B]
IL-6RA [A]
IL-6RA [B]
TNF-R2 [A]
TNF-R2 [B]
MMP-3 [A]
MMP-3 [B]
-2
0
2
4
6
8
10
12
14
100ng/ml
20ng/ml
4ng/ml
800pg/ml
160pg/ml
32pg/ml
6.4pg/ml
1.28pg/ml
0
dC
t
Antigen concentration
CVD I assay, markers 37-42
HSP 27 [A]
HSP 27 [B]
TNFSF14 [A]
TNFSF14 [B]
PRL [A]
PRL [B]
MPO [A]
MPO [B]
GH [A]
GH [B]
MMP-1 [A]
MMP-1 [B]
37
-2
0
2
4
6
8
10
100ng/ml
20ng/ml
4ng/ml
800pg/ml
160pg/ml
32pg/ml
6.4pg/ml
1.28pg/ml
0
dC
t
Antigen concentration
CVD I assay, markers 43-48
RETN [A]
RETN [B]
FAS [A]
FAS [B]
PAPPA [A]
PAPPA [B]
Inc Ctrl 2 [A]
Inc Ctrl 2 [B]
Det Ctrl [A]
Det Ctrl [B]
PTX3 [A]
PTX3 [B]
-2
0
2
4
6
8
10
12
14
100ng/ml
20ng/ml
4ng/ml
800pg/ml
160pg/ml
32pg/ml
6.4pg/ml
1.28pg/ml
0
dC
t
Antigen concentration
CVD I assay, markers 49-54
PTX3 [A]
PTX3 [B]
REN [A]
REN [B]
CHI3L1 [A]
CHI3L1 [B]
ST2 [A]
ST2 [B]
TIM [A]
TIM [B]
Beta-NGF [A]
Beta NGF [B]

38
-4
-2
0
2
4
6
8
10
12
14
100ng/ml
20ng/ml
4ng/ml
800pg/ml
160pg/ml
32pg/ml
6.4pg/ml
1.28pg/ml
0
dC
t
Antigen concentration
CVD I assay, markers 55-60
TRANCE [A]
TRANCE [B]
HGF [A]
HGF [B]
PSGL-1 [A]
PSGL-1 [B]
MB [A]
MB [B]
TM [A]
TM [B]
IL-16 [A]
IL-16 [B]
-2
0
2
4
6
8
10
12
14
100ng/ml
20ng/ml
4ng/ml
800pg/ml
160pg/ml
32pg/ml
6.4pg/ml
1.28pg/ml
0
dC
t
Antigen concentration
CVD I assay, markers 61-66
IL-16 [A]
IL-16 [B]
MMP-10 [A]
MMP10 [B]
U-PAR [A]
U-PAR [B]
CCL4 [A]
CCL4 [B]
CTSD [A]
CTSD [B]
RAGE [A]
RAGE [B]
39
-2
0
2
4
6
8
10
12
14
100ng/ml
20ng/ml
4ng/ml
800pg/ml
160pg/ml
32pg/ml
6.4pg/ml
1.28pg/ml
0
dC
t
Antigen concentration
CVD I assay, markers 67-72
CCL3 [A]
CCL3 [B]
MMP-7 [A]
MMP-7 [B]
CXCL-6 [A]
CXCL-6 [B]
ITGB1BP2 [A]
ITGB1BP2 [B]
CXCL16 [A]
CXCL16 [B]
Dkk-1 [A]
Dkk-1 [B]
-2
0
2
4
6
8
10
12
14
16
100ng/ml
20ng/ml
4ng/ml
800pg/ml
160pg/ml
32pg/ml
6.4pg/ml
1.28pg/ml
0
dC
t
Antigen concentration
CVD I assay, markers 73-78
SIRT2 [A]
SIRT2 [B]
GAL [A]
GAL [B]
AGRP [A]
AGRP [B]
EN-RAGE [A]
ENRAGE [B]
CD40 [A]
CD40 [B]
t-PA [A]
t-PA [B]
40
-2
0
2
4
6
8
10
12
14
100ng/ml
20ng/ml
4ng/ml
800pg/ml
160pg/ml
32pg/ml
6.4pg/ml
1.28pg/ml
0
dC
t
Antigen concentration
CVD I assay, markers 79-84
ESM-1 [A]
ESM-1 [B]
IL-4 [A]
IL-4 [B]
VEGF-D [A]
VEGF-D [B]
MMP-12 [A]
MMP-12 [B]
SPON1 [A]
SPON1 [B]
CASP-8 [A]
CASP-8 [B]
-2
0
2
4
6
8
10
12
14
100ng/ml
20ng/ml
4ng/ml
800pg/ml
160pg/ml
32pg/ml
6.4pg/ml
1.28pg/ml
0
dC
t
Antigen concentration
CVD I assay, markers 85-90
CASP-8 [A]
CASP-8 [B]
CTSL1 [A]
CTSL1 [B]
CX3CL1 [A]
CX3CLI1 [B]
FABP4 [A]
FABP4 [B]
BNP [A]
BNP [B]
LEP [A]
LEP [B]

41
-2
0
2
4
6
8
10
12
100ng/ml
20ng/ml
4ng/ml
800pg/ml
160pg/ml
32pg/ml
6.4pg/ml
1.28pg/ml
0
dC
t
Antigen concentration
CVD I assay, markers 91-96
CA-125 [A]
CA-125 [B]
NEMO [A]
NEMO [B]
FS [A]
FS [B]
PECAM-1 [A]
PECAM-1 [B]
NT-pro-BNP [A]
NT-pro-BNP [B]
ECP [A]
ECP [B]