development and deployment of large scale wireless sensor
TRANSCRIPT

Smart Structures and Systems, Vol. 6, No. 5-6 (2010) 525-543 525
Development and deployment of large scale wireless
sensor network on a long-span bridge
Shamim N. Pakzad*
Department of Civil and Environmental Engineering, Lehigh University, PA 18015, USA
(Received October 30, 2009, Accepted February 20, 2010)
Abstract. Testing and validation processes are critical tasks in developing a new hardware platform based
on a new technology. This paper describes a series of experiments to evaluate the performance of a newly
developed MEMS-based wireless sensor node as part of a wireless sensor network (WSN). The sensor node
consists of a sensor board with four accelerometers, a thermometer and filtering and digitization units, and a
MICAz mote for control, local computation and communication. The experiments include calibration and
linearity tests for all sensor channels on the sensor boards, dynamic range tests to evaluate their performance
when subjected to varying excitation, noise characteristic tests to quantify the noise floor of the sensor board,
and temperature tests to study the behavior of the sensors under changing temperature profiles. The paper also
describes a large-scale deployment of the WSN on a long-span suspension bridge, which lasted over three
months and continuously collected ambient vibration and temperature data on the bridge. Statistical modal
properties of a bridge tower are presented and compared with similar estimates from a previous deployment of
sensors on the bridge and finite element models.
Keywords: wireless sensor network; testing and calibration; MEMS; modal analysis; bridge monitoring.
1. Introduction
Advances in micro-electro-mechanical-systems (MEMS) technology as well as wireless network
systems have attracted attention to the applications of wireless sensor networks (WSNs) in different
areas of engineering. One such area of interest is the implementation of WSNs for structural monitoring
applications. Several research groups have developed hardware and software wireless sensor network
(WSN) platforms to address different requirements of this application and/or deployed a prototype
system on civil structures. Spencer et al. (2004), Spencer (2003), Ruiz-Sandoval et al. (2006), Ruiz-
Sandoval et al. (2003), Lynch et al. (2003), Lu et al. (2006), Lynch et al. (2005), Aoki et al. (2003),
Nagayama et al. (2004), Whelan and Janoyan (2009), Hackmann et al. (2008), Wu et al. (2009), Cho et
al. (2008) and Rice and Spencer (2008) are a few examples of such studies. A critical task in developing
a new hardware platform which is based on advanced technology is the testing and validation
processes. Only after the primary performance of the new systems have been validated can their
advantages in terms of low-cost, ease of installation and maintenance, and superior computational
capabilities be utilized.
Pakzad et al. (2008) describes an integrated platform for structural monitoring applications, which
*Corresponding Author, Assistant Professor, E-mail: [email protected]

526 Shamim N. Pakzad
consists of a sensor board with four channels of accelerometers and a thermometer. The sensor
board is equipped with dedicated filtering and digitization chips. This platform accepts MICAz motes
for control and communication and runs a control software based on TinyOS operating system (Hill
et al. 2003). Building up on that work, this paper presents testing and validation processes for the
hardware through laboratory and field experiments. The objective of this paper is to present several
testing protocols that can be used to evaluate the performance of the hardware for various
circumstances. Several laboratory tests are described which examine the behavior of the sensor
board under static and dynamic excitations and quantify their characteristic noise levels. Calibration
parameters for each sensor are estimated and linearity of their response is evaluated. The behavior
of the sensor board under varying temperature profiles is tested and response histograms are
presented. The integrated system is deployed on a long-span bridge and the results of statistical
modal identification of a tower of the bridge are presented and compared with similar estimates
from a previous deployment of sensors on the bridge and finite elements models.
The organization of the remainder of the paper is in three main parts. The hardware platform and
its different components are described in section 2. Then the laboratory testing and calibration
processes are presented in section 3. Sections 4 and 5 describe the field deployment of the WSN on
Golden Gate Bridge as a testbed and present the analysis results.
2. Hardware platform
The wireless sensor network consists of a set of connected sensor nodes. Each node has three
main hardware components: sensors, filters and micro-controller, and radio for wireless communication.
The sensor board, which has the sensing, filtering and analog-to-digital converters, is shown in Fig. 1.
These hardware components are discussed in this section in more details.
2.1 Sensors
The main sensors on the node are MEMS accelerometers. For the measurement of low-level and
high-level accelerations, two commercially available sensor units are used in each of two directions
Fig. 1 Sensor board with four accelerometer channels (physical size is 115 × 75 mm)

Development and deployment of large scale wireless sensor network on a long-span bridge 527
(one horizontal and one vertical). The use of two sensor types is a cost-effective solution and allows
examination of performance-price tradeoffs. The high-level sensor is Analog Device’s ADXL 202
shown in Fig. 2(a), a widely used device that provides ±2.0 g range with a sensitivity of 1 mg at
25 Hz (Analog Devices 1999). It is a low-cost (~$10 in 2005), low-power complete two-axis
accelerometer, which can measure both dynamic acceleration (vibration) and static acceleration
(gravity). Its dimensions are 5 mm × 5 mm × 2 mm. Its nominal resolution is 200 µg per root-
square Hz, allowing signals below 2 mg (at 60 Hz bandwidth) to be resolved. Accelerometer noise
has the characteristic of white Gaussian noise that contributes equally at all frequencies. This
accelerometer provides the required range of strong motions for the node.
Fig. 2(b) shows a Silicon Designs 1221, which provides acceptable sensitivity for low-level ambient
structural vibrations at a relatively low cost (Silicon Designs 2007). This single-axis sensor also
responds to both static and dynamic vibrations, provides the sensitivity required for ambient
vibrations, and has a nominal noise level of 2 µg per root-square Hz. The range of Silicon Designs
device is reduced to ±0.150 g so by using 16-bit A/D converters maximum nominal resolution of
4.6 µg is achieved. Tests show that the noise floor of the accelerometer itself is controlling and the
device is sensitive to within 10 µg (see the following section for more details).
The other sensor on the board is a thermometer to provide accurate temperature data at each node.
This is an important piece of information since tests showed that the sensors are sensitive to
temperature changes and the temperature information can be used to calibrate the sensors.
2.2 Filtering and analog/digital conversion
Each channel from the MEMS accelerometers provides an analog voltage that is fed to a single-
pole (-6 db) anti-aliasing low-pass filter with a cutoff frequency of 25 Hz. The filter was set for a
long-span bridge application because even very high vibration modes have frequencies well below
the cutoff frequency. The filtered analog signal is fed to 16-bit analog-to-digital converter (ADC) for
each of the four channels. Sampling is done at a high frequency (1 kHz), but the digitized signal is
downsampled by averaging, which acts as a digital filter and reduces the Gaussian noise level by a
factor of , when every n samples are averaged. Combination of the 25 Hz analog anti-aliasing
filter, high-frequency sampling at 1000 Hz, and downsampling, provides a simple and power efficient
approach for high-resolution acceleration measurement.
n
Fig. 2 (a) ADXL 202 sensor (physical size 5 × 5 × 2 mm) and (b) Silicon Designs 1221 sensor installed on
the sensor board (physical size 3.5 × 3.5 × 1 mm)

528 Shamim N. Pakzad
2.3 Control and communication unit
The mote with a micro-controller provides local processing and storage capability and a low-
power radio communication for a node. The MICAz mote was selected because it has a good
tradeoff between processing and communication capability, and power requirements (Crossbow
Technology, 2007). The MICAz, pictured in Fig. 3, has 512 kB flash memory, which can store up to
250,000 two-byte data samples, and a 2.4 GHz radio-frequency (RF) Chipcon CC2420 transceiver
with a hardware interface that can support commercially available bi-directional antennas. The
ability of the mote to connect with a bi-directional antenna was an important factor because the
long-span bridge application required a linear network topology and a standard omni-directional
antenna would have wasted a significant amount of radio power. Based on the power usage testing
of the node (Pakzad et al. 2008), it was decided to use four 6 V lantern batteries to provide 12 V
and 15 Ah in the deployment.
3. Testing and validation
Micro-electro-mechanical-system (MEMS) devices are a relatively new category of integrated
electronic chips and therefore do not have a long track record of performance for various applications.
This makes the process of testing and validation of the hardware and control software critical,
because one of the tasks for any research project that uses these devices is to evaluate and validate
their performance. Only after establishing such performance measures, can the advantages of MEMS
devices in terms of small size, low cost, ease of installation and maintenance, and eventually
scalability be considered. In this section the testing and calibration of the sensor network for structural
monitoring is presented. Four major categories of tests were performed on the accelerometer sensors:
calibration and linearity tests, static tests, shaking table tests, and temperature sensitivity tests. The
calibration tests evaluated the linearity of the response of each sensor to acceleration input. The
calibration parameters were estimated for use in further testing and comparison with other devices. The
static tests evaluated the performance of the sensors under ambient conditions to establish the noise
characteristics of the accelerometers. The shaking table tests were performed to analyze the dynamic
range of the sensors and test the response characteristics in the frequency range of interest. The
Fig. 3 MICAz Mote (physical size is 56 × 25 mm)

Development and deployment of large scale wireless sensor network on a long-span bridge 529
temperature tests evaluated the sensitivity of the accelerometer sensors to temperature change. Each
set of tests and results are presented in the following sections.
3.1 Calibration and linearity tests
The sensor boards were manufactured in two categories: horizontal boards, and vertical boards.
The horizontal boards are designed for the bridge span to measure acceleration in transverse and
vertical directions, so the range of the low-level Silicon Designs 1221 sensor in vertical direction is
adjusted to gravity to include 850 mg to 1150 mg interval. The vertical boards, designed to measure
accelerations in transverse and longitudinal directions, do not need the adjustment for the gravity
and can be used on the bridge tower. Overall, seventy-eight horizontal boards and twenty vertical
boards were manufactured.
The accelerometer sensors were calibrated so the digital output of the analog/digital converter
(ADC) can be translated into an acceleration value. Calibration was performed by subjecting the
sensor to known static accelerations and determining the digital output for that input. The calibration
process is performed using the acceleration due to gravity by tilting the sensor between a position
parallel to the ground that produces 1.0 g, and vertical position, which corresponds to zero acceleration.
At each stop the ADC readings are recorded and compared with the corresponding acceleration and
the linear shift and scale factors are estimated. Several stops between vertical and horizontal
positions are used to examine the linearity of the accelerometer response. This method has the
advantage of simplicity and ease of use, and does not require complicated equipment. It is, however,
limited to ±1.0 g range, so it is required to assume that the response remains linear for larger
accelerations. Another implicit assumption is made that the acceleration readings are independent of
frequency of the input signal and the DC calibration is valid for dynamically applied excitations.
For field deployment, the calibration parameters for every sensor on each board, i.e., shift and
scale parameters, were individually determined with tilt tests. A Yuasa 220 single axis rotary tilt
table with a UDNC-100 programmable controller was used to tilt the sensor boards, as shown in
Fig. 4. The rotary table has a resolution of 0.001 degrees, with an optional horizontal or vertical
setting position. The programmable controller was set up to rotate the board under test to a station
with a specific angle and collect 1500 samples from each of the four accelerometer channels, before
rotating the board further to the next station and repeating this process. The thirteen predefined
stations and the corresponding angles and accelerations are listed in Table 1. The horizontal sensors
Fig. 4 The Yuasa 220 single axis rotary tilt table and UDNC-100 controller during the calibration of a sensor board

530 Shamim N. Pakzad
were subjected to the full range of –1.0 g to +1.0 g with the rotation of one-half revolution about
the horizontal axis.
The ADXL 202 sensor measures the whole interval since its operational range is ±2.0 g. The
Silicon Designs 1221 sensor saturates at Station 1, and remains so until Stations 4 or 5, where its
operational range of approximately ±150 mg is reached. This channel saturates again at Stations 9
or 10 where the applied acceleration exceeds its range. In the vertical direction the corresponding
acceleration at Station 1 is zero, which is in range for the ADXL 202 but out of range for the
Silicon Designs 1221. At Stations 2 through 12 the acceleration goes from 866 mg to 1.0 g and
again back to 866 mg, which is measured by both vertical sensors. The Silicon Designs 1221 sensor
saturates at Station 13. Fig. 5 shows the rotation angle θ with respect to the horizontal direction. The
acceleration generated in vertical and horizontal sensors when the board is tilted by an angle θ is
AccHor
Sin θ( ) g⋅=
AccVer
1 Cos θ( )–( ) g⋅=⎩
⎨
⎧
Table 1Tilt stations and their corresponding accelerations for calibration of vertical boards using Yuasa rotary table
Station Angle Vertical acceleration (mg) Horizontal acceleration (mg)
1 270 0.0 -1000.0
2 330 866.0 -500.0
3 345 965.9 -258.8
4 352 990.3 -139.2
5 354 994.5 -104.5
6 357 998.6 -52.3
7 0 1000.0 0.0
8 3 998.6 52.3
9 6 994.5 104.5
10 8 990.3 139.2
11 15 965.9 258.8
12 30 866.0 500.0
13 90 0.0 1000.0
Fig. 5 Schematic tilt of sensor board by an angle θ

Development and deployment of large scale wireless sensor network on a long-span bridge 531
Fig. 6 shows typical calibration results for one of the horizontal boards. The figure also shows the
linearity and range of the sensors under test. The linearly fit line extends from zero count to the full
count (65535) to extrapolate the actual range of the sensor. This line varries slightly from sensor to
sensor, and from board to board depending on manufacturing and circuitry differences.
The data confirm that all four accelerometer channels on all sensor boards have a linear response
to tilt, and hence shift and scale factors would be sufficient to calibrate the digital outputs.
3.2 Static noise characteristics tests
Every sensor has a characteristic noise level which represents sensor circuitry’s noise floor under
no external excitation. The purpose of static noise tests is to estimate this noise floor and compare the
Fig. 6 Calibration plots for horizontal Board 5

532 Shamim N. Pakzad
performance of the sensors with other devices with known noise characteristic in a quiet environment.
The static tests consist of two experiments that were conducted at Berkeley Seismological
Laboratory facilities. The first test was performed in a laboratory in McCone Hall, and the other in
a vault in Tilden Hill, near UC-Berkeley campus. The test in Berkeley Seismological Laboratory
was performed in the second floor of McCone Hall, under ambient vibrations in an active environment
of an academic building. The prototype sensor board was attached to the floor of the building and
acceleration data at the rate of 580 Hz was collected for 1600 seconds. This test was then repeated
in a seismic vault in Tilden Hill near Lawrence Berkeley Laboratories (LBL Vault), which is located
inside a cave on solid rock, and houses Berkeley Seismological Laboratory’s low-noise seismometers. A
BKS FBA-23 reference accelerometer, with the root mean square (RMS) noise level of 0.2 μg in
the [0 25] Hz interval, was used as the reference sensor to compare the recorded vibrations and
estimate the noise floors (results not shown here). Fig. 7(b) shows the prototype sensor board,
weighted down by a heavy piece of lead inside the LBL Vault during the test.
The signals from the static noise tests in both time and frequency domains are presented in
Fig. 7(a). The time histories are plotted for 1600 sec, and the power spectral densities are limited to
50 Hz. Both sets of plots confirm that the signal from McCone Lab is noisier than the one from
LBL Vault. The sensor board experienced a noticeable temperature change during the LBL Vault
Fig. 7 (a) Time and Frequency plots for static test at McCone Lab and LBL Vault, (b) sensor board in LBL
Vault, (c) zoom plot of the noise power spectral density of Silicon Designs 1221 sensor at LBL Vault
and McCone Lab and (d) zoom plot of the very low noise power spectral density

Development and deployment of large scale wireless sensor network on a long-span bridge 533
test, which is the likely source of the small bump at the beginning of the time history plot and the
slow drift afterwards. Otherwise, the signal remains between ±100 μg of the de-trended level. The
signal from the McCone Lab varies in an interval of ±2 mg, with a distinct frequency that can be
observed in plots of both time and frequency domains. The likely source of the 8 Hz peak in the power
spectral density (PSD) at McCone Lab is that this is a transverse vibration mode of the building,
which has a very stiff reinforced concrete shear walls. A zoom plot of the power spectral densities
of both signals is shown in Fig. 7(c). This graph shows that the low-frequency noise level of the
sensor is at -40 dB, so for frequencies over 0.1 Hz, the root mean square acceleration noise per
root-Hz is calculated as follows
There is, however, a significant increase in the noise level for frequencies lower than 0.1 Hz.
Assuming -20 dB noise power at DC and -37 dB at 0.1 Hz (see Fig. 7(d)), the equivalent RMS
noise level per root-Hz in the [0 0.1] Hz is estimated by
The relatively flat part of the PSD for the tests at McCone Lab and LBL Vault in Fig. 7 is due to the
characteristic noise of the accelerometer and amplifier, which shows that the self-noise of the Silicon
Designs 1221 sensor is higher than the background low frequency noise at both test locations.
The digitization sensitivity of the Silicon Designs 1221 sensors after limiting the range to ±150 mg and
using a 16-bit ADC is 300 mg/216
-1=4.6 μg, which is less than the characteristic self-noise of the
sensors. These static tests confirm that the noise floor of the low-level high-sensitivity Silicon Designs
1221 accelerometers are well within the target noise level of less than 100 μg for ambient vibration
monitoring of a long-span bridge.
3.3 Dynamic range shaking table tests
The static tests of the prototype sensor boards provided valuable information about the noise
characteristics of the sensors, but they do not say much about the response accuracy or range under
dynamic excitation. The purpose of the shaking table tests, conducted during the development of the
prototype boards, was to confirm that the sensors have predictable response when subjected to dynamic
motion. To this end, a mass-spring low-noise short-period vertical shaking table constructed from a
Johnson-Matheson Model 6840 was used to subject the sensors in the vertical direction to harmonic
vibrations with varying amplitudes. Fig. 8(a) shows the set up of the tests. A reference Wilcoxon
731-4A low-noise piezoelectric accelerometer was also placed on the shaking table. A harmonic
function generator was used to dynamically drive the table at frequencies 0.5, 1, 2, 4 and 5 Hz, each
for approximately 30 sec. Both high-level ADXL 202 and low-level Silicon Designs 1221 sensors
in vertical direction were used to collect data during the tests.
Fig. 8(b) shows the time histories of the recorded signals for the prototype sensor boards as well
as the reference accelerometer. Power spectral densities using Welch method for the signals from
three sensors are plotted in Fig. 8(c). Data from low-level Silicon Designs 1221 in both time and
frequency domains are very similar to that for the reference low-noise sensor. The ADXL 202
sensor has a higher noise floor; it is especially evident that in the low-frequency area of the plot the
ef 0.1Hz>
104–
102–
mg/ Hz 10 μg/ Hz= = =
ef 0.1Hz<
102–
2 104–
⋅+
2
---------------------------------- 0.071 mg/ Hz 71μg/ Hz= = =

534 Shamim N. Pakzad
noise floor of the ADXL 202 is about 20 dB higher than Silicon Designs 1221. All sensors in both
experiments show a higher DC noise level that particularly affects [0 0.1] Hz interval, undermining
the advantage of using Silicon Designs 1221 in the very-low-frequency range. The similar time
series of the dynamic tests and their corresponding power spectral densities demonstrate that the
MEMS accelerometers accurately measure dynamic accelerations in the frequency range of interest.
3.4 Temperature sensitivity tests
MEMS accelerometers are temperature sensitive devices because the piezoelectric and flexibility
properties of the silicon oscillators vary with temperature. The variation in the recorded acceleration
during the static test on the LBL Vault, shown in Fig. 7(a), is an example of this temperature
sensitivity. To understand this phenomenon a series of temperature tests were performed on the
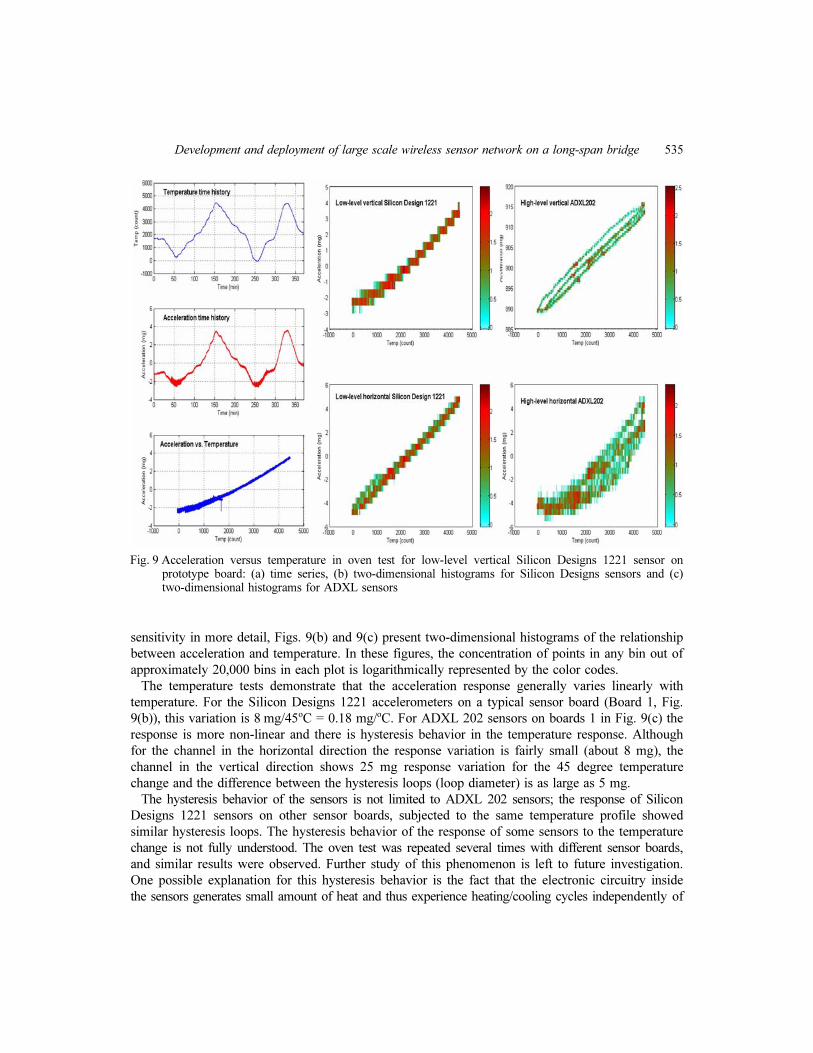
prototype sensor boards using an oven with controlled heating and cooling devices. Fig. 9(a) shows
the temperature and acceleration recording of one typical test. The temperature time history plot
represents the temperature profile of the test, which starts at room temperature. After an initial
period of soaking, the oven cools at the rate of one degree per minute for five minutes, followed by
a five-minute period of soaking until it reaches five degrees. After soaking at this temperature for
five minutes, the warming period begins, again at a rate of one degree per minute for five minutes
followed by soaking for five minutes, up to forty-five degrees, and then cooling again to twenty-
five degrees. The second part of the profile consists of continuous warming/cooling, followed by
longer soaking periods. The middle plot in Fig. 9(a) shows the acceleration response to this
temperature change. The two time histories visually match, which can be observed in the bottom
plot of Fig. 9(a) as a relatively straight line fits the two parameters. To examine the temperature
Fig. 8 (a) Sensor board and a piezoelectric reference accelerometer Wilcoxon 731-4A on the low-noise vertical
mass-spring shaking table, (b) time history plots for the dynamic test of prototype Board 1 and (c)
power spectral densities for the dynamic test of prototype Board 1
Development and deployment of large scale wireless sensor network on a long-span bridge 535
sensitivity in more detail, Figs. 9(b) and 9(c) present two-dimensional histograms of the relationship
between acceleration and temperature. In these figures, the concentration of points in any bin out of
approximately 20,000 bins in each plot is logarithmically represented by the color codes.
The temperature tests demonstrate that the acceleration response generally varies linearly with
temperature. For the Silicon Designs 1221 accelerometers on a typical sensor board (Board 1, Fig.
9(b)), this variation is 8 mg/45o
C = 0.18 mg/o
C. For ADXL 202 sensors on boards 1 in Fig. 9(c) the
response is more non-linear and there is hysteresis behavior in the temperature response. Although
for the channel in the horizontal direction the response variation is fairly small (about 8 mg), the
channel in the vertical direction shows 25 mg response variation for the 45 degree temperature
change and the difference between the hysteresis loops (loop diameter) is as large as 5 mg.
The hysteresis behavior of the sensors is not limited to ADXL 202 sensors; the response of Silicon
Designs 1221 sensors on other sensor boards, subjected to the same temperature profile showed
similar hysteresis loops. The hysteresis behavior of the response of some sensors to the temperature
change is not fully understood. The oven test was repeated several times with different sensor boards,
and similar results were observed. Further study of this phenomenon is left to future investigation.
One possible explanation for this hysteresis behavior is the fact that the electronic circuitry inside
the sensors generates small amount of heat and thus experience heating/cooling cycles independently of
Fig. 9 Acceleration versus temperature in oven test for low-level vertical Silicon Designs 1221 sensor on
prototype board: (a) time series, (b) two-dimensional histograms for Silicon Designs sensors and (c)
two-dimensional histograms for ADXL sensors

536 Shamim N. Pakzad
the outside temperature. This cyclic heating pattern adds to the outside temperature change and
affects the acceleration measurement.
4. Large-scale deployment on Golden Gate Bridge
Fig. 10 shows Golden Gate Bridge at the entrance of the San Francisco Bay, which has a 1280 m
(4200 ft) long main-span and 343 m (1125 ft) side-spans. Two stiffening trusses support an
orthotropic roadway deck and horizontal planes of wind bracing system at the bottom plane of the
truss chords. The legs of the towers, 210 m (745 ft) above the water level, have cellular box
sections, connected by horizontal struts at seven elevations (Strauss 1937, Stahl et al. 2007). The
wireless sensor network that was designed and developed in this paper was deployed on the bridge
to measure and record ambient accelerations. The sensor network consisted of 64 nodes on the
main-span and the south tower of the bridge, as shown in Figs. 10 to 12. The network was designed
to be scalable in terms of the number of the nodes, complexity of the network topology, data quality
and quantity by addressing integrated hardware and software systems such as sensitivity and range
of (MEMS) sensors, communication bandwidth of the low-power radio, reliability of command
dissemination and data transfer, management of large volume of data and high-frequency sampling
(Pakzad et al. 2008). The nodes on the main-span measure acceleration in vertical and transverse
directions (Pakzad and Fenves 2009). On the tower, the nodes measure acceleration in transverse
and longitudinal directions.
The instrumentation plan for the wireless sensor network for the bridge is shown in Fig. 10. The
nodes on the main-span were located based on the range of the radio transmission distance at 30.5
m (100 ft) spacing, but a 15.25 m (50 ft) spacing was used where an obstruction hindered radio
communication. Each main-span node was attached to the top flange of the floor girder directly
inside of the cable. The eight nodes on the south tower were placed at the ends of four struts above
Fig. 10 Instrumentation plan for 56 accelerometer sensor nodes on the main-span of Golden Gate Bridge

Development and deployment of large scale wireless sensor network on a long-span bridge 537
Fig. 11 Views of the main-span and south tower of Golden Gate Bridge as well as a node with its battery
pack and bi-directional antenna installed on the main-span
Fig. 12 Elevations of the south tower of Golden Gate Bridge, and temporary installation of a wireless sensor
node on the tower
538 Shamim N. Pakzad
the roadway. Fig. 12 shows the elevation of the south tower and maps the location of the nodes. It
also shows the temporary installation of a node on the tower with the antenna and battery pack. The
tower nodes have a clear line of sight between them and hence have greater radio range than the
main-span nodes. The node on the west side of the strut above the superstructure collects data from
all the nodes on the tower and transmits them to the network on the main-span. Fifty-three (53)
nodes were installed beginning on July 10, 2006, on the west side of the main-span. On September
15, 2006, the batteries were replaced for the nodes on the main-span and three extra nodes were
added on the east side. The east side nodes were located at the two quarter-spans and the mid-span
of the bridge and had radio communication with the west side nodes under the roadway deck. There
were a total of 174 data collection runs of the network during the deployment which lasted until
October 14, 2006, including testing and debugging, so all of the collected data sets do not contain
data from all of the nodes.
The sampling rate for all runs was 1 kHz, but since the significant vibration frequencies of the
bridge are much lower, the data were averaged on the node and downsampled to 50 to 200 Hz prior
to transmission. The averaging is very effective in reducing the noise level and improving the
accuracy of the estimated parameters. In some of the runs all five channels on a node (two high-
level motion sensors, two low-level motion sensors and the temperature sensor) were sampled, but
in other runs the channels were limited to the low-level accelerometers to reduce the volume of
data. The 512 kB flash memory of each node can buffer 250,000 samples of data, which may be
allocated to any combination of the five sensor channels on the node (four accelerometer channels
and a temperature sensor). Each run started with a pause to synchronize the network and disseminate a
command to start sampling at a future time. After the scheduled sampling took place, there was a
pause to establish the network routing. The recorded data were then transferred from each node to
the base station using the reliable data communication and pipelining. Each run generated up to 500
kB data per node, which for the network of 60 nodes produced 30 MB data for 15 million samples.
Approximately 1.3 GB data was collected during the deployment of the wireless sensor network on
Golden Gate Bridge.
5. Statistical modal identification for the south tower
The ambient vibration data from the main-span of Golden Gate Bridge described in the previous
section was examined and the result was presented in Pakzad and Fenves (2009). In this section the
results of a statistical analysis of the identified vibration modes of the south tower is presented.
Although the bridge including the south tower has been instrumented in the past, none of the earlier
studies have provided data collected over an extended period of time to allow a statistical analysis
of the modal properties. The contribution of this section is to demonstrate that the dense temporal
sensing possible with WSNs, provides a high resolution and confidence in the identified vibration
modes. The advantage of temporal density of the data is examined by estimating statistical properties for
the identified vibration modes. The distribution of the identified mode shapes is examined by their
confidence intervals.
Auto-Regressive with Moving Average (ARMA) method is used to identify the modal properties
of the tower. For more information about the method as well as the choices for parameters refer to
Pakzad and Fenves (2009), Pandit (1991), De Roeck et al. (1995), Andersen (1997), Heylen et al.
(1995), and Pappa et al. (1993). For the mode shapes, the statistics are also presented by the mean
Development and deployment of large scale wireless sensor network on a long-span bridge 539
value of the parameters and their confidence intervals (CI). A 95% CI for a point-estimated parameter
can be interpreted as an interval that is believed, with 95% confidence, to include the true value of
the parameter. In other words, if the same procedures are repeated (sampling from the population,
estimating the parameter and finding CIs), 95% of the times the estimated CIs are expected to
include the true value of the parameter.
The statistical analysis allows inference about the certainty of the estimation of modal vibration
properties. The narrower the confidence intervals are, the less uncertainty the estimated values have.
The approach can also be used as a comparison basis for other estimations of the same modal
parameters. A new estimate that lies inside the CI is consistent with the hypothesis that no change
has occurred. If it falls outside the interval, the inconsistency can be explained by a change in the
underlying parameter.
The results of system identification from all 174 runs are used to estimate statistical properties of
vibration frequencies, damping ratios and mode shapes for the longitudinal, torsional and transverse
modes of the tower.
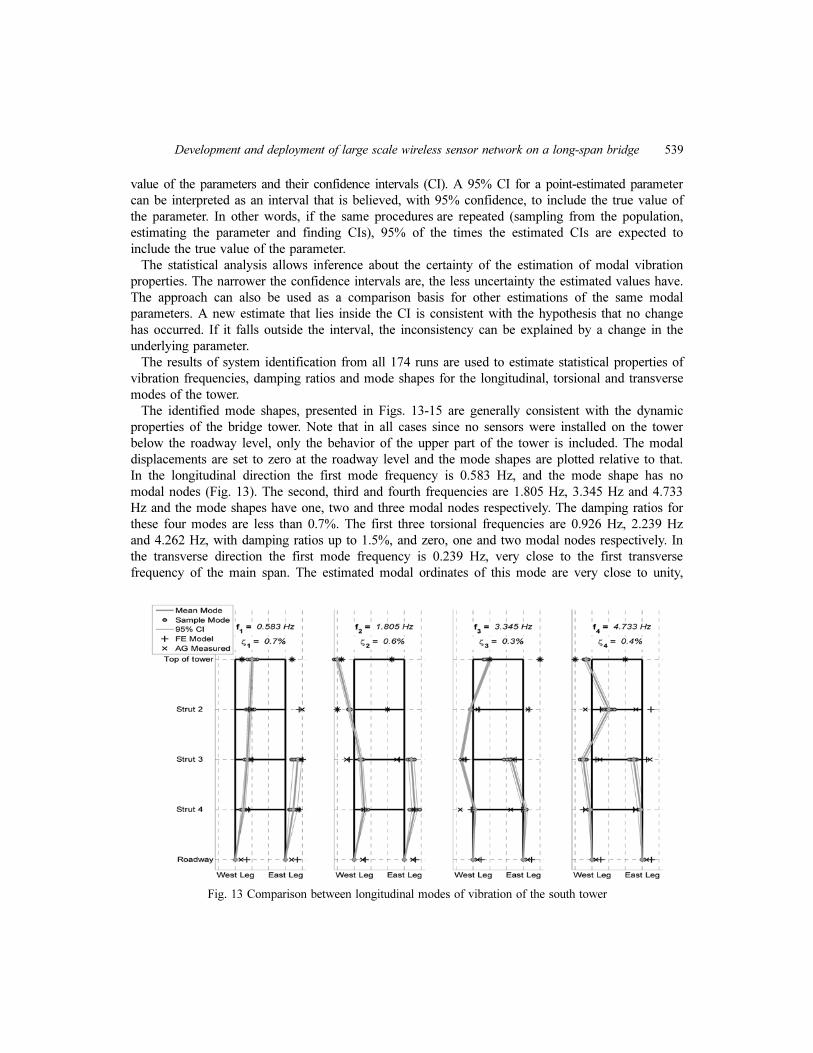
The identified mode shapes, presented in Figs. 13-15 are generally consistent with the dynamic
properties of the bridge tower. Note that in all cases since no sensors were installed on the tower
below the roadway level, only the behavior of the upper part of the tower is included. The modal
displacements are set to zero at the roadway level and the mode shapes are plotted relative to that.
In the longitudinal direction the first mode frequency is 0.583 Hz, and the mode shape has no
modal nodes (Fig. 13). The second, third and fourth frequencies are 1.805 Hz, 3.345 Hz and 4.733
Hz and the mode shapes have one, two and three modal nodes respectively. The damping ratios for
these four modes are less than 0.7%. The first three torsional frequencies are 0.926 Hz, 2.239 Hz
and 4.262 Hz, with damping ratios up to 1.5%, and zero, one and two modal nodes respectively. In
the transverse direction the first mode frequency is 0.239 Hz, very close to the first transverse
frequency of the main span. The estimated modal ordinates of this mode are very close to unity,
Fig. 13 Comparison between longitudinal modes of vibration of the south tower

540 Shamim N. Pakzad
which suggests that this mode is in fact the first transverse mode of the entire bridge. The second
mode at 0.425 Hz frequency has a linear shape consistent with the first mode of a tower structure.
The third and fourth modes at 1.397 Hz and 2.482 Hz have one and two modal nodes respectively.
The figures show the 95% confidence intervals for the mode shapes. Also included, are the results
from an earlier deployments of accelerometers (Abdel-Ghaffar and Scanlan 1985) and finite element
Fig. 14 Comparison between torsional modes of vibration of the south tower
Fig. 15 Comparison between transverse modes of vibration of the south tower

Development and deployment of large scale wireless sensor network on a long-span bridge 541
models of the bridge (Abdel-Ghaffar et al. 1985). Note that in both of these cases the mode shapes
are evaluated at all seven struts of the tower, from strut 1 at the top of the tower to strut 7 at the
water level. The results in nearly all cases generally matches the CIs, with the cases where the
modal ordinates at the roadway are closer to zero being more accurate than the others.
6. Conclusions
Development and large scale deployment of a MEMS-based wireless sensor network on a long
span bridge was described. The hardware of the sensor nodes consists of a sensing unit of high- and
low-level accelerometers and thermometers, control and filtering unit for on-board analog and digital
data processing, and radio chips for wireless communication. Extensive laboratory testing was
performed to validate the hardware system and evaluate its performance under different excitations
and environmental circumstances. Each sensor board was individually calibrated using a tilt mechanism
and the linearity of the response of each sensing channel was confirmed. Several prototype tests
were performed to characterize the static and dynamic noise levels of the sensors. Low-level Silicon
Designs has a RMS noise level of 71 μg/ in the very low frequency range (below 0.1 Hz)
which linearly reduces to 10 μg/ for larger frequencies. The accelerometers performed well in
shaking table dynamic tests with sweeping frequencies and matched the response of a reference
sensor. All of the tested accelerometers showed some hysteresis response to changing temperature.
Although the exact source of this behavior is not fully understood, but the micro heating of the
accelerometer as a result of its operation is a contributing factor. Additional testing is required to
investigate this phenomenon and address it in the future sensor design.
A large-scale wireless sensor network, consisting of 64 sensor nodes was deployed on Golden
Gate Bridge for a period of more than three months and 174 sets of data were collected. The data
consisted of a combination of ambient accelerations from low-level and high-level accelerometers
and temperature. The statistical modal analysis of the vibration data for the south tower is presented
in this paper. Longitudinal, transverse and torsional modal properties of the tower and their statistics
are estimated. The mode shapes and their 95% confidence intervals are presented and compared
with the estimated modes using finite element models as well as an earlier deployment of sensors
on the bridge. The results in most cases match, in that the confidence intervals include the point
estimates of the previous methods. It is also observed that the confidence intervals are very small,
which indicates high quality and consistency of the data.
Acknowledgements
This work reflects the advice and guidance of Professors Gregory Fenves. Dr. Sukun Kim
developed the software and closely collaborated in design of hardware and deployment of the
network on Golden Gate Bridge. The author gives special thanks to the staff and management of
Golden Gate Bridge, Highway and Transportation District, in particular Dennis Mulligan and Jerry
Kao, for their close cooperation in every step of the project. Jorge Lee provided extraordinary help
in the deployment, which made this project possible. The author thanks Siavash Dorvash for his
invaluable assistance. This research was partially supported by the National Science Foundation
under grants No. EIA-0122599 and 0926898.
Hz
Hz

542 Shamim N. Pakzad
References
Abdel-Ghaffar, A.M. and Scanlan, R.H. (1985), “Ambient vibration studies of golden gate Bridge: II Pier-Tower
Structure”, J. Eng. Mech.-ASCE, 111(4), 483-499.
Abdel-Ghaffar, A.M., Scanlan, R.H. and Diehl, J.G. (1985), Analysis of the dynamic characteristics of the Golden
Gate Bridge by ambient vibration measurements, Report No. 85-SM-1, Department of Civil Engineering, Princeton
University, Princeton, NY.
Analog Devices (1999), ADXL202/ADXL210: Low Cost ±2 g/±10 g Dual Axis iMEMS®
Accelerometers with
Digital Output Data Sheet, http://www.analog.com/en/prod/0,2877,ADXL202,00.html
Andersen P. (1997) Identification of Civil Engineering Structures Using Vector ARMA Models, PhD dissertation,
Department of Building Technology and Structural Engineering, Aalborg University, Denmark.
Aoki, S., Fujino, Y. and Abe, M. (2003), “Intelligent bridge maintenance system using MEMS and network
technology”, Proc. SPIE, 5057, 37-42.
Cho, S., Yun, C.B., Lynch, J.P., Zimmerman, A.T., Spencer, Jr., B.F. and Nagayama, T. (2008), “Smart wireless
sensor technology for structural health monitoring of civil structures”, Int. J. Steel Struct., 8(4), 267-275.
Crossbow Technology (2007), MICAz-Wirless Measurement System, Available at http://www.xbow.com/Products/
Product_pdf_files/Wireless_pdf/MICAz_Datasheet.pdf.
De Roeck, G., Claesen, W. and Van Den Broeck, P. (1995), “DDS-methodology applied to parameter identification
of civil engineering structures”, Proceedings of the Vibration and Noise ’95, Venice, Italy, April.
Hackmann, G., Sun, F., Castaneda, N., Lu, C. and Dyke, S. (2008), A Holistic Approach to Decentralized Structural
Damage Localization Using Wireless Sensor Networks, Technical Report No 2008-9, Department of Computer
Science & Engineering, Washington University in St. Louis, MO.
Heylen, W., Lammens, S. and Sas, P. (1995), Modal Analysis Theory and Testing, KUL Press, Leuven, Belgium.
Hill, J., Gay, D. and Levis, P. (2003), Index of /tinyos-1.x/tos/system, Available at http://www.tinyos.net/tinyos-
1.x/tos/system.
Lu, K.C., Wang, Y., Lynch, J.P., Loh, C.H., Chen, Y.J., Lin, P.Y. and Lee, Z.K. (2006), “Ambient vibration study
of Gi-Lu cable-stay bridge: application of wireless sensing units”, Proceedings of the SPIE 13th Annual Symposium
on Smart Structural and Materials, San Diego, CA, USA.
Lynch, J.P., Sundararajan, A., Law, K.H., Kiremidjian, A.S., Carryer, E., Sohn, H. and Farrar, C.R. (2003), “Field
validation of a wireless structural health monitoring system on the alamosa canyon bridge”, Proceedings of the
SPIE's 10th Annual International Symposium on Smart Structures and Materials, San Diego, CA, USA, March.
Lynch, J.P., Wang, Y., Law, K.H., Yi, J.H., Lee, C.G. and Yun, C.B. (2005), “Validation of a large-scale wireless
structural monitoring system on the geumdang bridge”, Proceedings of the International Conference on Safety
and Structural Reliability (ICOSSAR), Rome, Italy.
Nagayama, T., Ruiz-Sandoval, M., Spencer, Jr., B.F., Mechitov, K.A. and Agha, G. (2004), “Wireless strain
sensor development for civil infrastructure”, Proceedings of the 1st International Workshop on Networked
Sensing Systems, Tokyo, Japan, June.
Pakzad, S.N. and Fenves, G.L. (2009), “Statistical analysis of vibration modes of a suspension bridge using
spatially dense wireless sensor network”, J. Struct. Eng.-ASCE, 135(7), 863-872.
Pakzad, S.N., Fenves, G.L., Kim, S. and Culler, D.E. (2008), “Design and implementation of scalable wireless
sensor network for structural monitoring”, J. Infrastruct. Eng., 14(1), 89-101.
Pandit, S.M. (1991), Modal and Spectrum Analysis: Data Dependent Systems in State Space, John Wiley and
Sons, New York.
Pappa, R.S., Elliott, K.B. and Schenck, A. (1993), “Consistent mode indicator for eigen system realization
algorithm”, J. Guid. Control Dynam., 16(5), 852-858.
Rice, J.A. and Spencer, Jr., B.F. (2008), “Structural health monitoring sensor development for the Imtoe2 platform”,
Proceedings of the SPIE Conference, San Diego, CA, USA.
Ruiz-Sandoval, M., Nagayama, T. and Spencer, B.F. (2006), “Sensor development using berkeley mote platform”,
J. Earthq. Eng., 10(2), 289-309.
Ruiz-Sandoval, M., Spencer, Jr., B.F. and Kurata, N. (2003), “Development of a high sensitivity accelerometer
for the mica platform”, Proceedings of the 4th International Workshop on Structural Health Monitoring, Stanford,
CA, September.

Development and deployment of large scale wireless sensor network on a long-span bridge 543
Silicon Designs (2007), Low Noise Analog Accelerometer, Available at http://www.silicondesigns.com/Pdf/1221.pdf.
Spencer, Jr., B.F. (2003), “Opportunities and challenges for smart sensing technology”, Proceedings of the International
Conference on Structural Health Monitoring and Intelligent Infrastructure, Tokyo, Japan, November.
Spencer, Jr., B.F., Ruiz-Sandoval, M.E. and Kurata, N. (2004), “Smart sensing technology: opportunities and
challenges”, Struct. Control Health Monit., 11(4), 349-368.
Stahl, F.L., Mohn, D.E. and Currie, M.C. (2007), The Golden Gate Bridge, Report of the Chief Engineer,
Volume II, Golden Gate Bridge and Transportation District, San Francisco, CA.
Strauss, J.B. (1937), The Golden Gate Bridge, Report to the Board of Directors of the Golden Gate Bridge and
Highway District, California, September.
Whelan, M.J. and Janoyan, K.D. (2009), “Design of a robust, high-rate wireless sensor network for static and
dynamic structural monitoring”, J. Intel. Mat. Syst. Str., 20(7), 849-863.
Wu, H., Zonta, D., Pozzi, M., Zanon, P., Cerlonl, M., Monola, L., Picco, G.P., Murphy, A.L., Guna, S. and Carra,
M. (2009), “Real-time health monitoring of historic buildings with wireless sensor networks”, Proceedings of the
7th International Workshop on Structural Health Monitoring; From System Integration to Autonomous Systems,
Lancaster, Pennsylvania 17602, USA.