development and characterisation of nanocarrier systems of
TRANSCRIPT

Development and characterisation of
nanocarrier systems of hydrophobic drugs for
pulmonary delivery
Nattika Nimmano
Thesis submitted in accordance with the requirements of UCL for
the degree of Doctor of Philosophy
February 2019
UCL School of Pharmacy
29-39 Brunswick square
London WC1N 1AX
United Kingdom
UCL SCHOOL OF PHARMACY

2
Declaration
This thesis describes research conducted in the School of Pharmacy, University
College London between November 2014 and October 2018, under the
supervision of Professor Kevin M.G. Taylor and Dr. Satyanarayana Somavarapu.
I, Nattika Nimmano, certify that the research described is original. I also confirm
that I have written all the text herein. All source materials that have already
appeared in the publication have been clearly indicated by suitable citations.
Signature: Date:

3
Acknowledgements
I would like to express my deep and sincere gratitude to my primary supervisor,
Professor Kevin M.G. Taylor for his scientific vision, experienced guidance,
kindness, and willingness to develop my knowledge in pulmonary delivery as
well as my writing skill. Apart from academic aspect, he is very optimistic person
and he has constantly supported me throughout this PhD, which made me feel
motivated every time I meet him. I am sincerely grateful to him since he was the
most important person giving me this valuable opportunity to do my PhD in
University College London.
I would also like to thank my second supervisor, Dr. Satyanarayana Somavarapu
for contributing many ideas during my PhD and giving me a great chance to do
research in the Lab 402.
I wish to express my appreciation to my advisor at Chulalongkorn University, Dr.
Jittima Chatchawansaisin and Dr. Pongsakornpat Arunothayanunt for inspiring
me to do PhD in abroad. I am especially thankful to Dr. Jittima for contacting Prof.
Taylor and believing in my ability.
I am extremely grateful to all my labmates (Lab 402), Dr. Zahra, Dr. Norhayati,
Dr. Atiqah, Acom for sharing the ideas, their care, valuable friendship and
emotional support. This made my PhD life so memorable and joyful. I am very
lucky to meet these people who are always being by my side in every single
moment.
Also, I would like to thank my Thai friends, Dr. Wunlapa, Dr, Varin, Dr.
Natchagorn, Dr. Ukrit, Dr. Piyaphong, Dr. Supathep, Mr. Pongsakorn, Mr. Nat,
Mrs. Supanan, Mr. Akkapon, Mr.Nuphak, Mr. Wishchapol, Mr. Patchara, Mr.
Autthaporn and my closed office mates, Miss Yanling, Mr. Chin Ping and Miss
Pamela for their encouragement.
I would also like to thank to all staff of UCL School of Pharmacy, especially to
Ms. Catherine, Mr. David, Dr. Sunny, Mr. John, Mr. Chris, Ms. Isabel, Ms. Kate

4
for their kindly technical assistance. I would like to convey my gratitude to
Dr.Asma for helping me with DSC techniques.
I would like to thank my friends from Goodenough College especially Miss
Keting, Mr.Siong Kie and Miss Florence for their amazing friendship and warm
support. Thanks to running club and zumba society for giving me strength, energy
and mental and physical well-being.
Last but not least, I would like to express my truly appreciation to my parents and
brother for their unconditional love, care and endless support, all of which have
given me the power to pursue my study. My PhD would not have come this far
without their support and faith in me.
5
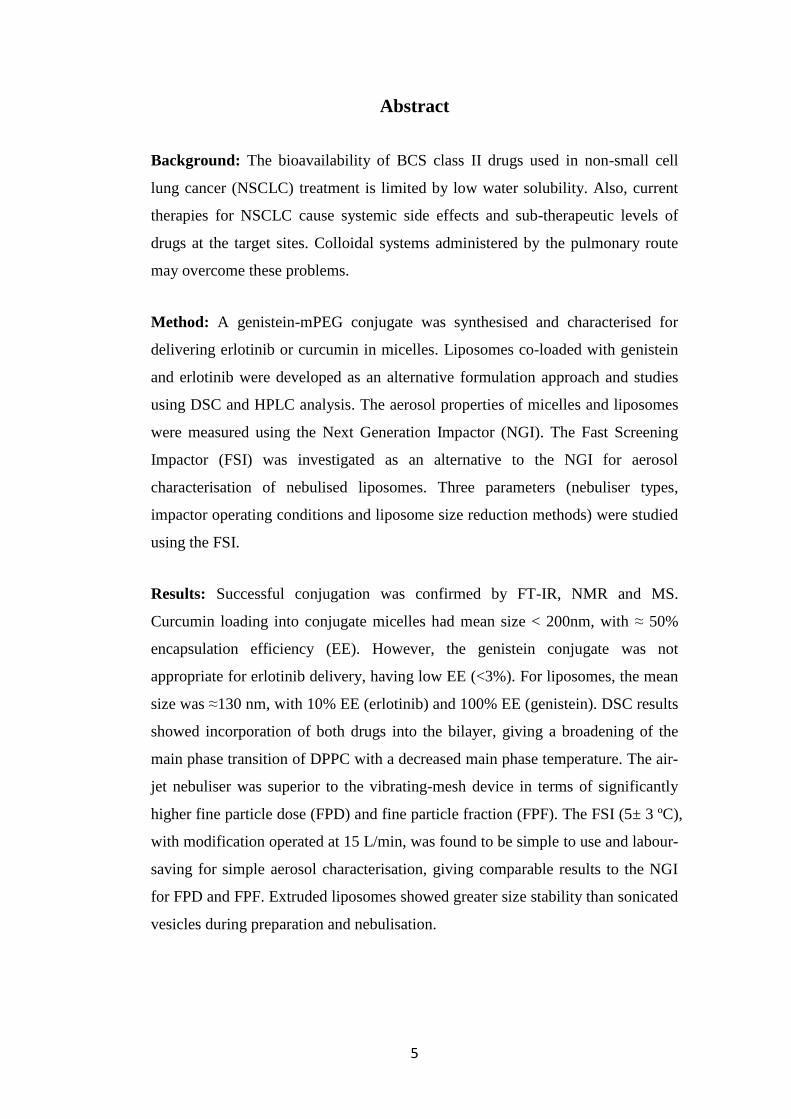
Abstract
Background: The bioavailability of BCS class II drugs used in non-small cell
lung cancer (NSCLC) treatment is limited by low water solubility. Also, current
therapies for NSCLC cause systemic side effects and sub-therapeutic levels of
drugs at the target sites. Colloidal systems administered by the pulmonary route
may overcome these problems.
Method: A genistein-mPEG conjugate was synthesised and characterised for
delivering erlotinib or curcumin in micelles. Liposomes co-loaded with genistein
and erlotinib were developed as an alternative formulation approach and studies
using DSC and HPLC analysis. The aerosol properties of micelles and liposomes
were measured using the Next Generation Impactor (NGI). The Fast Screening
Impactor (FSI) was investigated as an alternative to the NGI for aerosol
characterisation of nebulised liposomes. Three parameters (nebuliser types,
impactor operating conditions and liposome size reduction methods) were studied
using the FSI.
Results: Successful conjugation was confirmed by FT-IR, NMR and MS.
Curcumin loading into conjugate micelles had mean size < 200nm, with ≈ 50%
encapsulation efficiency (EE). However, the genistein conjugate was not
appropriate for erlotinib delivery, having low EE (<3%). For liposomes, the mean
size was ≈130 nm, with 10% EE (erlotinib) and 100% EE (genistein). DSC results
showed incorporation of both drugs into the bilayer, giving a broadening of the
main phase transition of DPPC with a decreased main phase temperature. The air-
jet nebuliser was superior to the vibrating-mesh device in terms of significantly
higher fine particle dose (FPD) and fine particle fraction (FPF). The FSI (5± 3 ºC),
with modification operated at 15 L/min, was found to be simple to use and labour-
saving for simple aerosol characterisation, giving comparable results to the NGI
for FPD and FPF. Extruded liposomes showed greater size stability than sonicated
vesicles during preparation and nebulisation.

6
Conclusions: Optimised micelles and liposomes with desired mean size and drug
entrapments have the potential for nebuliser delivery of genistein, erlotinib and
curcumin, and may be suitable for delivering other hydrophobic drugs.

7
Research Impact Statement
Lung cancer accounts for almost 20% of total cancer-related deaths worldwide in
both men and women. 85% of all lung cancer cases are classified as non-small
cell lung cancer (NSCLC). The majority of NSCLC patients have experienced
advanced local invasion and metastatic disease, as current therapies including
chemotherapy are not sufficiently curative. Currently, chemotherapeutic
molecules are administered via the oral or parenteral routes, causing systemic side
effects and sub-therapeutic doses at the target sites. Thus, this study aimed to
develop drug-carriers capable of pulmonary delivery, which may achieve the
effective localised treatment of NSCLC.
This study helps in our understanding of the potential of polymeric micelles and
liposomes for the co-delivery of hydrophobic anti-cancer molecules by the
pulmonary route. Since this delivery route allows the avoidance of first-pass
metabolism and drug is administered at the target site, lower doses can be
considered compared with oral route. Such a formulation approach may be
beneficial for NSCLC patients, improving their survival rate and quality of life,
and this can be a platform for other drugs used in the treatment of respiratory
diseases.
The findings indicate that an abbreviated impactor using the Fast Screening
Impactor (FSI) may be a useful alternative tool compared to a full-cascade
impactor (Next Generation Impactor, NGI) for simple aerosol characterisation of
nebulised formulations for routine quality control of large-scale production, or in
pharmaceutical development studies. The concept of abbreviated impactor
measurement (AIM) using Efficient Data Analysis (EDA) is receiving with
attention from medicine regulators and world pharmacopoeias for routine quality
control of inhaled products. This study presents key data informing the
development of this new methodology.

8
Table of Contents
Declaration .................................................................................................................................... 2
Acknowledgements ..................................................................................................................... 3
Abstract ......................................................................................................................................... 5
Research Impact Statement ...................................................................................................... 7
List of Tables ............................................................................................................................. 15
List of Figures ........................................................................................................................... 17
List of Abbreviations ............................................................................................................... 21
Chapter 1 Introduction ....................................................................................................... 24
Lung cancer .............................................................................................................................. 25
Background ..................................................................................................................... 25
Current treatment options ........................................................................................ 25
Targeted therapy .......................................................................................................... 26
Pulmonary drug delivery .................................................................................................... 27
Lung physiology ............................................................................................................ 29
Inhalation aerosols and aerodynamic diameter .............................................. 30
Mechanisms of aerosol deposition in the airways .......................................... 31
Challenges in pulmonary delivery .................................................................................. 33
Inhalation devices for pulmonary delivery ................................................................. 35
Pressurised metered- dose inhalers (pMDIs) ................................................... 35
Dry powder inhalers (DPIs) ..................................................................................... 36
Soft-mist inhalers (SMIs) ........................................................................................... 38
Nebulisers ........................................................................................................................ 39
Ultrasonic nebulisers ............................................................................................................. 40
Air-jet nebulisers ..................................................................................................................... 40
1.4.4.2.1 Constant output jet nebulisers ................................................................................... 42
1.4.4.2.2 Breath-enhanced jet nebulisers ................................................................................. 42
1.4.4.2.3 Breath-actuated jet nebulisers ................................................................................... 43
Vibrating-mesh nebulisers ................................................................................................... 43
Effect of fluid physicochemical properties on nebuliser performance ........... 46
Delivery of advanced formulations ................................................................................ 48
Methods of aerosol particle size analysis .................................................................... 50
Cascade impactors and impingers ......................................................................... 51
Abbreviated Impactor Measurement (AIM) ...................................................... 56

9
Therapeutic agents used in this study and their formulation approaches .... 62
Erlotinib ............................................................................................................................ 62
Genistein ........................................................................................................................... 66
Curcumin .......................................................................................................................... 70
Thesis overview ...................................................................................................................... 73
Aims and Objectives ........................................................................................................... 74
Chapter 2 Synthesis of genistein-methoxy poly (ethylene glycol) ............................ 77
Introduction ............................................................................................................................. 78
Aims ............................................................................................................................................. 79
Materials .................................................................................................................................... 79
Methods ..................................................................................................................................... 80
Synthesis of methoxypoly (ethylene glycol)-carboxyl (mPEG-COOH) ... 80
Synthesis of genistein-mPEG conjugate .............................................................. 81
Development of the genistein-mPEG conjugate synthesis ....................................... 82
Optimised methodology of the genistein-mPEG conjugate synthesis .................. 83
Characterisation of the synthesized compound .............................................. 83
Thin layer chromatography (TLC) .................................................................................... 83
Fourier transform infrared (FT-IR) spectroscopy ........................................................ 83
Nuclear magnetic resonance (NMR) spectroscopy ..................................................... 84
Matrix-Assisted Laser Desorption-Time of Flight (MALDI-TOF) mass
spectrometry ................................................................................................................................................. 84
Results and discussion ......................................................................................................... 84
Synthesis of methoxypoly(ethylene glycol)-carboxyl (mPEG-COOH) .. 84
TLC .............................................................................................................................................. 84
FT-IR ........................................................................................................................................... 86
NMR ............................................................................................................................................ 88
H-NMR .................................................................................................................................................... 88
Development of the mPEG-COOH synthesis ............................................................... 92
Synthesis of genistein-mPEG ................................................................................... 93
TLC .............................................................................................................................................. 93
FT-IR ........................................................................................................................................... 94
NMR ............................................................................................................................................ 96
H-NMR .................................................................................................................................................... 96
Mass spectroscopy ............................................................................................................... 100
Development of the genistein-mPEG conjugate synthesis .................................... 102
Conclusion ............................................................................................................................. 103
Chapter 3 Hydrophobic drug-loaded genistein-mPEG micelles ............................. 104

10
Introduction .......................................................................................................................... 105
Aims .......................................................................................................................................... 106
Materials ................................................................................................................................. 106
Methods .................................................................................................................................. 107
High performance liquid chromatography (HPLC) methods for assay of
erlotinib and curcumin ........................................................................................................... 107
Chromatographic conditions for HPLC analysis of erlotinib ............................... 107
Chromatographic conditions for HPLC analysis of curcumin ............................. 108
Preparation of HPLC calibration curve for erlotinib ............................................... 109
Preparation of HPLC calibration curve for curcumin ............................................. 109
Analytical method validation of erlotinib .................................................................... 110
3.4.1.5.1 Linearity ........................................................................................................................ 110
3.4.1.5.2 Precision ........................................................................................................................ 110
3.4.1.5.3 Accuracy ........................................................................................................................ 110
3.4.1.5.4 Limit of detection ....................................................................................................... 111
3.4.1.5.5 Limit of quantification .............................................................................................. 111
Critical micelle concentration of genistein-mPEG conjugate .................. 111
Preparation of drug-loaded genistein-mPEG polymeric micelles…… .. 112
Preparation of erlotinib-loaded genistein-mPEG polymeric micelles ............... 112
Preparation of curcumin-loaded genistein-mPEG polymeric micelles…….. . 114
Characterisation of micellar formulations ...................................................... 114
Particle size distribution .................................................................................................... 114
Surface charge of empty and erlotinib or curcumin-loaded genistein-mPEG
polymeric micelles .................................................................................................................................. 114
Drug -loading and entrapment efficiency .................................................................... 115
Transmission electron microscopy ................................................................................ 115
Optimisation of curcumin-loaded genistein-mPEG micelles ................... 115
Mass output and time to dryness for various fill volumes delivered from
air-jet and vibrating-mesh nebulisers .............................................................................. 116
Comparison of aerosol properties of nebulised curcumin micelles using
the Next Generation Impactor (NGI) ................................................................................ 116
Statistical analysis ..................................................................................................... 118
Results and discussion ...................................................................................................... 118
HPLC assay for the quantification of erlotinib and curcumin ................. 118
HPLC chromatogram of erlotinib and erlotinib-loaded genistein-
mPEGpolymeric micelles ..................................................................................................................... 118
HPLC chromatograms of curcumin and curcumin-loaded genistein-mPEG
polymeric micelles .................................................................................................................................. 119

11
Calibration curve for erlotinib ......................................................................................... 121
Calibration curve for curcumin ....................................................................................... 122
Analytical method validation ........................................................................................... 122
Critical micelle concentration of genistein-mPEG conjugate .................. 123
Characterisation of drug-loaded genistein-mPEG micelles ..................... 127
Size distribution, surface charge and drug entrapment of erlotinib-loaded
micelles… .................................................................................................................................................. 127
Size distribution, surface charge and drug entrapment of curcumin-loaded
micelles… .................................................................................................................................................. 127
Characterisation and development of curcumin-loaded micelles ......... 130
Effect of curcumin concentration on size distribution, surface charge,
entrapment efficiency and drug loading of micellar formulations ......................................... 130
3.5.4.1.1 Effect of curcumin concentration on micelle size distribution ................... 130
3.5.4.1.2 Effect of curcumin concentration on the surface charge of micelles........ 133
3.5.4.1.3 Effect of curcumin concentration on drug entrapment in genistein-mPEG
micelles 134
3.5.4.1.4 Effect of curcumin incorporation on the size distribution of genistein-
mPEG micelles ................................................................................................................................... 135
Transmission electron microscopy of empty and curcumin-loaded genistein-
mPEG polymeric micelles.................................................................................................................... 136
Effect of nebuliser fill volume on time to nebulise to dryness and
aerosol output for air-jet and vibrating-mesh nebulisers ....................................... 137
Assessment of aerosol properties of curcumin-loaded genistein-mPEG
micelles delivered from air-jet and vibrating-mesh nebulisers using the Next
Generation Impactor (NGI) ................................................................................................... 141
Conclusions ........................................................................................................................... 144
Chapter 4 Liposomes loaded with erlotinib and genistein ....................................... 146
Introduction .......................................................................................................................... 147
Aims .......................................................................................................................................... 150
Materials ................................................................................................................................. 150
Methods .................................................................................................................................. 151
Validation of HPLC analytical method for erlotinib and genistein ........ 151
Chromatographic conditions for HPLC analysis of erlotinib and genistein .... 151
Preparation of standard solutions and calibration curves for erlotinib and
genistein.. ................................................................................................................................................... 152
Analytical method validation ........................................................................................... 153
4.4.1.3.1 Linearity ........................................................................................................................ 153
4.4.1.3.2 Precision ........................................................................................................................ 153

12
4.4.1.3.3 Accuracy ........................................................................................................................ 154
4.4.1.3.4 Limit of detection ....................................................................................................... 154
4.4.1.3.5 Limit of quantification .............................................................................................. 154
Preparation method for liposomes containing erlotinib or genistein and
liposomes co-loaded with erlotinib and genistein ...................................................... 154
Effect of drug concentrations on the properties of DPPC liposomes ................. 154
Effect of cholesterol content on the properties of DPPC liposomes .................. 155
Effect of the addition of DOPE on the properties of liposomes .......................... 156
Effect of sonication time on liposome particle size distribution and drug
entrapment ................................................................................................................................................. 157
Characterisation of liposomes .............................................................................. 158
Particle size distribution measurement by dynamic light scattering .................. 158
Surface charge determination .......................................................................................... 158
Transmission electron microscopy ................................................................................ 158
Drug-loading and entrapment efficiency ..................................................................... 158
Thermal analysis ........................................................................................................ 159
Determining suitable lipid concentrations and scan rate for DSC analysis ..... 159
Investigation of effect of drugs and helper lipids of different concentrations on
DSC thermograms ................................................................................................................................... 160
Statistical analysis ..................................................................................................... 161
Results and discussion ...................................................................................................... 161
Validation of HPLC analysis ................................................................................... 161
HPLC chromatograms of erlotinib and genistein ..................................................... 161
Calibration curves for erlotinib, genistein and co-quantification of erlotinib and
genistein.. ................................................................................................................................................... 165
Analytical method validation ........................................................................................... 167
Characterisation of drug-loaded liposomes ................................................... 172
Effect of cholesterol concentration on the properties of DPPC liposomes
containing either erlotinib or genistein ............................................................................................ 172
Effect of cholesterol concentration on particle size distribution of liposomes
containing either erlotinib or genistein ............................................................................................ 175
Effect of including DOPE on the properties of DPPC/Cholesterol liposomes
loaded with either erlotinib or genistein .......................................................................................... 176
Effect of sonication time on encapsulation efficiency of erlotinib or genistein in
liposomes ................................................................................................................................................... 178
Characterisation of liposomes co-loaded with erlotinib and
genistein…….. .............................................................................................................................. 178
Transmission electron microscopy .................................................................... 183

13
Thermal analysis of liposomes ............................................................................. 183
Effect of lipid concentrations on the DSC thermogram of liposomes ............... 184
Thermal properties of DPPC liposomes reduced size by probe-sonication
method… .................................................................................................................................................... 185
Thermal properties of sonicated DPPC liposomes containing different
concentrations of erlotinib .................................................................................................................... 187
Thermal properties of sonicated DPPC liposomes containing different
concentrations of genistein .................................................................................................................. 191
Thermal properties of DPPC liposomes containing co-loaded erlotinib and
genistein of different concentrations ................................................................................................ 194
Thermal properties of DPPC liposomes containing cholesterol and DOPE .... 199
Thermal properties of erlotinib-incorporated into DPPC liposomes with and
without genistein, cholesterol and DOPE ....................................................................................... 201
Thermal properties of genistein-incorporated into DPPC liposomes with and
without erlotinib, cholesterol and DOPE ........................................................................................ 203
Conclusion ............................................................................................................................. 206
Chapter 5 Aerosol properties of liposomes loaded with erlotinib and genistein . 207
Introduction .......................................................................................................................... 208
Aims .......................................................................................................................................... 209
Materials ................................................................................................................................. 210
Methods .................................................................................................................................. 210
Assessment of aerosol properties using the Next Generation Impactor
(NGI)…. .......................................................................................................................................... 210
Effect of lipid concentrations on measured aerosol properties ............................ 210
Effect of nebuliser fill volume on measured aerosol properties .......................... 211
Optimal conditions for characterising nebulised liposomes using the NGI .... 211
Assessment of aerosol properties using the Fast Screening Impactor
(FSI)….. .......................................................................................................................................... 211
Effect of flow rates on measured aerosol properties ................................................ 212
Effect of impactor temperature on measured aerosol properties ......................... 213
Effect of nebuliser system on measured aerosol properties .................................. 213
Size stability of liposomes before and after nebulisation ....................................... 213
Transmission electron microscopy (TEM) of liposomes before and after
nebulisation ............................................................................................................................................... 214
Size reduction of liposomes co-loaded with erlotinib and genistein using
membrane extrusion method .............................................................................................. 214
Statistical analysis ..................................................................................................... 215
Results and discussion ...................................................................................................... 215

14
Effect of drug and lipid concentrations on liposome properties for
nebulisation ................................................................................................................................. 215
Comparison of aerosol properties of liposomal preparations delivered
by an air-jet nebuliser determined using the Next Generation Impactor (NGI)
and Fast Screening Impactor (FSI) .................................................................................... 217
Aerosol characterisation using the FSI; effect of impactor operating
conditions and nebuliser system ........................................................................................ 220
The influence of flow rate through the FSI on measured aerosol properties .. 220
Effect of impactor temperature on measured aerosol parameters ....................... 222
Aerosol properties of liposomal aerosols delivered from a vibrating-mesh
nebuliser.. ................................................................................................................................................... 224
Particle size distribution of liposomes before and after nebulisation ................ 227
Optimisation of liposome extrusion .................................................................. 231
Comparison of the properties of liposomes, size reduced by probe-
sonication and membrane-extrusion ............................................................................... 233
Aerosol characterisation of extruded liposomes aerosolised using air-jet
and vibrating-mesh nebulisers ........................................................................................... 235
Size stability of nebulised extruded liposome delivered by the air-jet
and vibrating-mesh nebulisers ........................................................................................... 238
Conclusions ........................................................................................................................... 240
Chapter 6 General conclusion and future work.......................................................... 241
General discussion and conclusion.............................................................................. 242
Future work .......................................................................................................................... 251
References ................................................................................................................................ 255
Publication and presentations ............................................................................................. 281

15
List of Tables
Table 1-1 Cut-off diameters for the NGI stages when operated at a flow rate of 15 L/min ............ 55
Table 1-2 Physicochemical properties of erlotinib .......................................................................... 63
Table 1-3 Formulation studies for erlotinib..................................................................................... 64
Table 1-4 Physicochemical properties of genistein ......................................................................... 67
Table 1-5 Formulation studies for genistein .................................................................................... 69
Table 1-6 Physicochemical properties of curcumin ........................................................................ 71
Table 1-7 Formulation studies for curcumin ................................................................................... 72
Table 2-1 Components used in mPEG-COOH synthesis ................................................................ 81
Table 3-1 HPLC chromatographic conditions for assay of erlotinib ............................................. 108
Table 3-2 HPLC chromatographic conditions for assay of curcumin ........................................... 109
Table 3-3 Regression characteristics, validation and system suitability for the analysis of erlotinib
(n=4) .............................................................................................................................................. 123
Table 3-4 Properties of erlotinib and curcumin and their incorporations into genistein-mPEG
polymeric micelles (n=3, mean± S.D.) .......................................................................................... 128
Table 3-5 Characterisation of curcumin-loaded genistein-mPEG micelles at different drug
concentrations (n=3, mean ± S.D.) ................................................................................................ 132
Table 3-6 Size distribution of empty and curcumin-loaded genistein-mPEG micelles (n=3, mean ±
S.D.) .............................................................................................................................................. 136
Table 3-7 Aerosol parameters of curcumin-loaded genistein-mPEG micellar aerosols delivered
from air-jet and vibrating-mesh nebulisers into the cooled NGI at a flow rate of 15L/min (n=3,
mean± S.D.) .................................................................................................................................. 142
Table 4-1 HPLC chromatographic conditions for assay of erlotinib and genistein using individual
and simultaneous methods ............................................................................................................ 152
Table 4-2 The content of DPPC and cholesterol in erlotinib or genistein liposomal formulations
....................................................................................................................................................... 156
Table 4-3 The composition of DPPC: cholesterol: DOPE in erlotinib and genistein co-loaded
liposomal formulations .................................................................................................................. 157
Table 4-4 Regression characteristics, validation and system suitability for the analysis of erlotinib
and genistein (n=4) ........................................................................................................................ 169
Table 4-5 Inter-day and Intra-day variability of the HPLC method (n=4, mean± S.D) ................ 171
Table 4-6 Effect of drug-to-lipid ratio (%w/w) on the properties of DPPC liposomes (n=3, mean±
S.D.) .............................................................................................................................................. 180
Table 4-7 Effect of DOPE concentration (%w/w) on the properties of DPPC: cholesterol (92:8)
liposomes co-loaded with erlotinib and genistein (n=3, mean± S.D.) ........................................... 182
Table 4-8 Thermal properties of sonicated and unsonicated DPPC liposomes (n=3, mean± S.D.)
....................................................................................................................................................... 186
Table 4-9 Thermal properties of erlotinib-loaded DPPC liposomes at different concentrations
(n=3, mean± S.D.) ......................................................................................................................... 190

16
Table 4-10 Thermal properties of genistein-loaded DPPC liposomes at different concentrations
(n=3, mean± S.D.) ......................................................................................................................... 193
Table 4-11 Effect of erlotinib and genistein content on the thermal properties of co-loaded DPPC
liposomes (n=3, mean± S.D.) ........................................................................................................ 196
Table 4-12 Effect of genistein and erlotinib alone or co-loaded on the thermal properties of DPPC
liposomes (n=3, mean± S.D.) ........................................................................................................ 198
Table 4-13 Thermal properties of DPPC liposomes in the presence of cholesterol, DOPE and
cholesterol with DOPE (n=3, mean± S.D.) ................................................................................... 200
Table 4-14 Characteristics of erlotinib liposomal formulations (n=3, mean± S.D.) ..................... 203
Table 4-15 Characteristics of genistein liposomal formulations (n=3, mean± S.D.) .................... 205
Table 5-1 Characterisation of liposomes co-loaded with 2.5% w/w erlotinib and 2.5% w/w
genistein at different lipid concentrations (n=3, mean± S.D) ........................................................ 216
Table 5-2 Content of erlotinib and genistein in co-loaded liposomes (lipid concentration 20
mg/mL).......................................................................................................................................... 217
Table 5-3 Aerosol parameters of co-loaded liposomal aerosols delivered from an air-jet nebuliser
into the NGI and FSI (n=3, mean ± S.D.) ..................................................................................... 218
Table 5-4 Fine particle dose for co-loaded liposomal aerosols delivered by the air-jet nebuliser
operated at 15 L/min and 30 L/min, using the cooled FSI (n=3, mean ±S.D.) .............................. 222
Table 5-5 Aerosol parameters for co-loaded liposomal aerosols delivered by the air-jet nebuliser at
different FSI temperatures and flow rates (n=3, mean ±S.D.)....................................................... 223
Table 5-6 Fine particle dose for co-loaded liposomal aerosols delivered by a vibrating-mesh
nebuliser operated at 15 L/min and 30 L/min, determined using the cooled FSI (n=3, mean ±S.D.)
....................................................................................................................................................... 225
Table 5-7 Mean hydrodynamic diameter (Z-ave) and Polydispersity Index (PDI) of nebulised
sonicated co-loaded liposomes delivered to the FSI stages, and those remaining in the nebuliser
reservoir (n=3, mean± S.D.) .......................................................................................................... 228
Table 5-8 The effect of size reduction method on mean hydrodynamic diameter, Polydispersity
Index (PDI), zeta potential and drug encapsulation for co-loaded liposomes after removing non-
incorporated drugs by filtration (n=3, mean± S.D.) ...................................................................... 234
Table 5-9 Fine particle dose for extruded co-loaded liposomal aerosols delivered by air-jet and
vibrating-mesh nebulisers into the cooled FSI operated at 15 L/min (n=3, mean ±S.D.) ............. 237
Table 5-10 Hydrodynamic diameter (Z-ave) and Polydispersity Index (PDI) of nebulised extruded
co-loaded liposomal aerosols delivered to the FSI stages, and those remaining in the nebulizer
reservoir (n=3, mean ±S.D.) .......................................................................................................... 239

17
List of Figures
Figure 1-1 The human airways (Kleinstreuer and Zhang, 2010) ..................................................... 30
Figure 1-2 Particle deposition in the respiratory tract (Mossman et al., 2011) ............................... 32
Figure 1-3 The relationship of particle size and respiratory deposition fraction of inhaled product
(Carvalho et al., 2011) ..................................................................................................................... 35
Figure 1-4 Dry powder inhaler devices; a) single-unit capsule dose, b) multiple-unit dose and c)
multiple dose inhalers (Lavorini et al., 2017).................................................................................. 38
Figure 1-5 Operating principle of breath-enhanced jet nebulisers (Coates and Ho, 1998) ............. 43
Figure 1-6 Operating principle of passively vibrating-mesh nebulisers (Ghazanfari et al., 2007) .. 45
Figure 1-7 Operating principle of actively vibrating-mesh nebulisers (Ghazanfari et al., 2007) .... 45
Figure 1-8 Airflow and particle in a cascade impactor (adapted from Copley, 2008) .................... 52
Figure 1-9 The cumulative percentage of mass less than the stated aerodynamic diameters versus
the cut-off diameter; log-probability plot (USP29 NF40) ............................................................... 53
Figure 1-10 Andersen cascade impactor (USP29 NF40) ................................................................ 54
Figure 1-11 Next Generation Impactor (Ph. Eur., 2017) ................................................................. 54
Figure 1-12 Two-stage impinger (Miller et al., 1992) ..................................................................... 57
Figure 1-13 The Fast Andersen impactor a) C-FSA (without dead space) b) T-FSA (with dead
space) (Nichols et al., 2016) ............................................................................................................ 58
Figure 1-14 The Reduced Next Generation Impactor a) rNGI-f b) rNGI-mc (Mohan et al., 2017) 59
Figure 1-15 Fast Screening Impactor (FSI), a) components of the FSI, b) additional insert and c)
assembled FSI (Nichols et al., 2016) ............................................................................................... 60
Figure 1-16 The mechanism of action of erlotinib (Hammerman et al., 2009) ............................... 62
Figure 1-17 Schematic representation of the action of genistein on inhibition of EGFR signaling
(Niero et al., 2014; Shukla et al., 2015) .......................................................................................... 67
Figure 1-18 Thesis overview describing preparation, characterisation and in vitro studies of
optimised micelles and liposomes prepared for pulmonary delivery of genistein, erlotinib and
curcumin.......................................................................................................................................... 76
Figure 2-1 The reaction scheme for esterification in the presence of DCC and DMAP to produce
the genistein-mPEG conjugate ........................................................................................................ 82
Figure 2-2 TLC plate of starting materials and product of mPEG-COOH synthesis ...................... 86
Figure 2-3 FT-IR of spectra of a) mPEG, b) succinic acid and c) mPEG-COOH ........................... 87
Figure 2-4 H-NMR spectra of a) mPEG, b) mPEG-COOH and c) succinic acid ........................... 89
Figure 2-5 C-NMR spectra of a) mPEG and b) mPEG-COOH ....................................................... 91
Figure 2-6 Scheme of mPEG-COOH synthesis .............................................................................. 92
Figure 2-7 The scheme of mPEG synthesis in the presence of erbium trifluoromethanesulfonate
and succinic anhydride .................................................................................................................... 93
Figure 2-8 TLC of starting materials and product of genistein-mPEG synthesis ............................ 94
Figure 2-9 The structure of genistein-mPEG .................................................................................. 95
Figure 2-10 FT-IR spectra of a) genistein, b) mPEG-COOH and c) genistein-mPEG .................... 96
18
Figure 2-11 H-NMR of a) genistein-mPEG synthesis and b) mPEG-COOH component of
genistein-mPEG conjugate .............................................................................................................. 98
Figure 2-12 H-NMR of a) genistein component of genistein-mPEG conjugate and b) genistein ... 99
Figure 2-13 Mass spectra of a) mPEG-COOH and b) genistein-mPEG- ...................................... 101
Figure 3-1 Preparation of erlotinib-loaded genistein-mPEG micelles........................................... 113
Figure 3-2 HPLC chromatogram of erlotinib in DMSO ............................................................... 119
Figure 3-3 HPLC chromatogram of erlotinib-loaded genistein-mPEG polymeric micelles dissolved
in DMSO ....................................................................................................................................... 119
Figure 3-4 The structure of curcumin and its derivatives .............................................................. 120
Figure 3-5 HPLC chromatogram of curcumin and its derivatives in methanol ............................. 121
Figure 3-6 HPLC chromatogram of curcumin loaded genistein-mPEG micelles dissolved in
methanol ........................................................................................................................................ 121
Figure 3-7 Calibration curve of erlotinib using HPLC analysis (n=3) .......................................... 122
Figure 3-8 Calibration curve of curcumin using HPLC analysis (n=3) ......................................... 122
Figure 3-9 Effect of increasing concentration on scattered light intensity for genistein-mPEG
solutions (n=3, mean± S.D.).......................................................................................................... 125
Figure 3-10 Effect of increasing concentration on correlation function (signal intensity to baseline
noise ratio) (n=3, mean± S.D.) ..................................................................................................... 126
Figure 3-11 Effect of increasing concentration on mean hydrodynamic diameter of genistein-
mPEG solutions (n=3, mean± S.D.) .............................................................................................. 126
Figure 3-12 Appearance of curcumin dispersed in genistein-mPEG micelles (a) pre-filtration (b)
post-filtration ................................................................................................................................. 130
Figure 3-13 Size distribution of curcumin-loaded genistein-mPEG polymeric micelles at
concentrations of a) 2.5%, b) 5%, c) 10% and d) 20% (w/w drug in polymer)............................. 133
Figure 3-14 Size distribution of a) empty genistein-mPEG polymeric micelles and b) curcumin-
loaded genistein-mPEG polymeric micelles ................................................................................. 136
Figure 3-15 TEM images of a) empty micelles and b) curcumin-loaded genistein-mPEG micelles
after filtration ................................................................................................................................ 137
Figure 3-16 Effect of fill volumes of water on (a) time to nebulise to dryness and (b) percentage
nebulised at dryness using an air-jet nebuliser (n=3, mean± S.D.) ............................................... 139
Figure 3-17 Effect of fill volumes of water on time to nebulise to dryness for the vibrating-mesh
nebuliser (n=3, mean± S.D.) ......................................................................................................... 140
Figure 3-18 Schematic diagram of the mechanism of a) air-jet and b) vibrating-mesh nebulisers
(Carvalho et al., 2016) ................................................................................................................... 141
Figure 4-1 The structure of liposomes containing hydrophobic drug, cholesterol and DOPE within
lipid bilayer (Phan et al., 2013; Monteiro et al., 2014) .................................................................. 148
Figure 4-2 Influence of temperature and cholesterol on the DPPC phospholipid bilayer (Monteiro
et al., 2014) .................................................................................................................................... 149
Figure 4-3 HPLC chromatogram of erlotinib (10 µg/mL) ............................................................ 162
Figure 4-4 HPLC chromatogram of genistein (10 µg/mL)............................................................ 162

19
Figure 4-5 HPLC chromatogram of erlotinib (10 µg/mL) and genistein (10 µg/mL) ................... 163
Figure 4-6 HPLC chromatogram of blank liposomes consisting of DPPC, cholesterol and DOPE
....................................................................................................................................................... 163
Figure 4-7 HPLC chromatogram of liposomes consisting of DPPC, cholesterol and DOPE
containing erlotinib ....................................................................................................................... 164
Figure 4-8 HPLC chromatogram of liposomes consisting of DPPC, cholesterol and DOPE
containing genistein ...................................................................................................................... 164
Figure 4-9 HPLC chromatogram of liposomes consisting of DPPC, cholesterol and DOPE
containing erlotinib and genistein ................................................................................................. 165
Figure 4-10 HPLC calibration curve of erlotinib (n= 3) ............................................................... 166
Figure 4-11 HPLC calibration curve of genistein (n=3)................................................................ 166
Figure 4-12 HPLC calibration curve of erlotinib (in presence of genistein) (n= 3) ...................... 167
Figure 4-13 HPLC calibration curve of genistein (in presence of erlotinib) (n= 3) ...................... 167
Figure 4-14 Effect of cholesterol content (mol%) on entrapment efficiency (%EE) of a) erlotinib
and b) genistein in DPPC liposomes (n=3, mean ± S.D.) ............................................................. 173
Figure 4-15 Effect of cholesterol concentration on mean hydrodynamic diameter (nm) of DPPC
liposomes containing erlotinib or genistein after 30 min sonication (n=3, mean± S.D.) .............. 176
Figure 4-16 Effect of including DOPE on entrapment efficiency of 5% w/w erlotinib or 5% w/w
genistein in DPPC: cholesterol (92:8) liposomes (n=3, mean ± S.D.) .......................................... 177
Figure 4-17 Effect of sonication time (min) on encapsulation efficiency (%EE) of 5% w/w
erlotinib or 5% w/w genistein in DPPC: cholesterol: DOPE (72: 8: 20) liposomes (n=3, mean ±
S.D.) .............................................................................................................................................. 178
Figure 4-18 TEM images of erlotinib and genistein co-loaded liposomes (a.) 17500 x and (b.)
65000 x .......................................................................................................................................... 183
Figure 4-19 DSC thermogram of DPPC liposomes (40 mg/mL) scanned at 0.5 ºC/min .............. 185
Figure 4-20 DSC thermograms of a) 10%, b) 5%, c) 2.5% erlotinib-incorporated into DPPC
liposomes and d) DPPC liposomes ............................................................................................... 188
Figure 4-21 DSC thermograms of a) 10%, b) 5% and c) 2.5% genistein-loaded DPPC liposomes
....................................................................................................................................................... 192
Figure 4-22 DSC thermograms of a) 5% erlotinib and 5% genistein and b) 2.5% erlotinib and
2.5% genistein co-loaded DPPC liposomes and c) DPPC liposomes............................................ 194
Figure 4-23 DSC thermogram of a) 2.5% erlotinib and 2.5% genistein co-loaded DPPC liposomes,
b) 2.5% genistein-loaded DPPC liposomes, c) 2.5% erlotinib-loaded DPPC liposomes and d)
DPPC liposomes............................................................................................................................ 197
Figure 4-24 DSC thermogram of a) DPPC, b) DPPC with 8% cholesterol, c) DPPC with 20%
DOPE and d) DPPC with 8% cholesterol and 20% DOPE ........................................................... 200
Figure 4-25 DSC thermograms of a) 2.5% erlotinib-loaded DPPC liposomes, b) 2.5% erlotinib and
2.5% genistein co-loaded DPPC liposomes, c) 2.5% erlotinib-loaded DPPC/cholesterol/DOPE
liposomes and d) 2.5% erlotinib and 2.5% genistein co-loaded DPPC/cholesterol/DOPE liposomes
....................................................................................................................................................... 201

20
Figure 4-26 DSC thermograms of a) 2.5% genistein-loaded DPPC liposomes, b) 2.5% genistein
and 2.5% erlotinib co-loaded DPPC liposomes, c) 2.5% genistein-loaded DPPC/cholesterol/DOPE
liposomes and d) 2.5% genistein and 2.5% erlotinib co-loaded DPPC/cholesterol/DOPE liposomes
....................................................................................................................................................... 204
Figure 5-1 Commercially available abbreviated impactors ........................................................... 209
Figure 5-2 Modification of additional FSI insert utilised at flow rate of 15 L/min ....................... 213
Figure 5-3 Aerosol parameters of co-loaded MLVs aerosols generated using an air-jet nebuliser
measured using a cooled FSI at 15 and 30 L/min (n=3, mean ±S.D.). .......................................... 221
Figure 5-4 Aerosol parameters of co-loaded liposomes aerosols generated using a vibrating-mesh
nebuliser determined using a cooled FSI at 15 and 30 L/min (n=3, mean ±S.D.). ........................ 225
Figure 5-5 TEM images of co-loaded liposomes prepared by probe-sonication before and after air-
jet nebulisation (a) freshly prepared formulation (b) vesicles remaining in air-jet reservoir
following nebulisation (c) liposomes deposited on stage 1 of the FSI and (d) liposomes deposited
on stage 2 of the FSI. ..................................................................................................................... 230
Figure 5-6 Mean VMD of liposomes extruded through: a) 3 µm pore polycarbonate membrane
filter and b) further extruded through a 1 µm pore polycarbonate membrane filter, and c) mean
hydrodynamic diameter of liposomes further extruded through a 0.1 µm pore polycarbonate
membrane filter (n=3, mean± S.D.) .............................................................................................. 232
Figure 5-7 Aerosol parameters of extruded co-loaded liposomes delivered by air-jet and vibrating-
mesh nebulisers with the cooled FSI at 15 L/min (n=3, mean ±S.D.) ........................................... 237
21
List of Abbreviations
ACI: Andersen cascade impactor
AIM: Abbreviated impactor measurement
AKT: Serine/threonine kinase
APSD: Aerodynamic particle size distribution
BCS: Biopharmaceuticals Classification System
DCC: N, N-dicyclohexylcarbodiimide
DL: Drug loading
DMAP: 4-dimethylaminopyridine
DMF: N, N-dimethylformamide anhydrous
DMSO: Dimethyl sulfoxide
DOPE: Dioleoylphosphatidylethanolamine
DPI: Dry powder inhaler
DPPC: Dipalmitoylphosphatidylcholine
DSC: Differential Scanning Calorimetry
ED: Emitted dose
EE: Encapsulation efficiency
EGFR: Epidermal growth factor receptor
EGFR-TKIs: Epidermal growth factor receptor- tyrosine
kinase inhibitors
FDA: US Food and Drug Administration
FPD: Fine Particle Dose

22
FPF: Fine Particle Fraction
FSA: Fast Screeing Andersen
FSI: Fast Screening Impactor
FT-IR: Fourier transform infrared spectroscopy
Gen-mPEG: Genistein-methoxy poly (ethylene glycol)
GSD: Geometric standard deviation
HHW: Half-height width
HSDSC: High sensitive differential scanning
calorimetry
HPLC: High performance liquid chromatography
HSPC: Hydrogenated soybean phosphatidylcholine
ICH: International Council for Harmonisation
LOD: Limit of detection
LOQ: Limit of quantification
MLV: Multilamellar vesicle
MMAD: Mass median aerodynamic diameter
MOC: Micro-orifice collector
mPEG: Methoxy poly (ethylene glycol)
mPEG-COOH: Methoxy poly (ethylene glycol) carboxyl
NF-kB: Nuclear factor kappa-light-chain-enhancer
of activated B cells

23
NGI: Next Generation Impactor
NMR: Nuclear magnetic resonance
NSCLC: Non-small cell lung cancer
PDI: Polydispersity index
pMDI: Pressurised metered-dose inhaler
RE: Relative error
rNGI: Reduced Next Generation Impactor
RSD: Relative standard deviation
SCLC: Small cell lung cancer
SUV: Small unilamellar vesicle
TFA: Trifluoracetic acid
TLC: Thin layer chromatography
TSI: Two-stage impactor
UV: Ultraviolet
VMD: Volume median diameter

Chapter 1 Introduction
24
Chapter 1 Introduction

Chapter 1 Introduction
25
Lung cancer
Background
Lung cancer causes the most cancer-related deaths (more than 1.69 million deaths,
19.20%) in both men and women worldwide (Zarogoulidis et al., 2013; Siegel et
al., 2014). Lung cancer is divided into two types: 85% of all lung cancer cases are
classified as non-small cell lung cancer (NSCLC), whereas small-cell lung cancer
(SCLC) accounts for 15% of total cases (Babu et al., 2013; Goel et al., 2013).
NSCLC is classified into three main types: squamous-cell carcinoma (25-30% of
all cases), adrenocarcinoma (40% of the cases) and large-cell carcinoma (5-10%
of lung cancers) (Zarogoulidis et al., 2013; Zappa and Mousa, 2016). The
common signs and symptoms of NSCLC are cough, wheezing, breathlessness,
loss of appetite and chest pain. However, most patients are asymptomatic. When
the cancer spreads to other organs, it may affect bones, liver and nervous systems,
causing bone pain, jaundice and fatigue. Patients who experience the common
symptoms of NSCLC are generally referred for a chest x-ray and/or CT scan to
determine whether the cancer has spreads beyond the lungs (Kayser et al., 2017;
Grapatsas et al., 2017). More than 70% of patients with NSCLC are diagnosed
with metastatic and locally advanced disease, while those having a localised
cancer account for only about 20% of NSCLC cases at the initial diagnosis
(Grapatsas et al., 2017; Rudokas et al., 2016). There are a number of risk factors
associated with lung cancers, such as smoking, alcohol, air pollution, occupational
exposure and genes. More than 80% of lung cancer deaths are attributed to
cigarette smoking (Molina et al., 2008; Zappa and Mousa, 2016).
Current treatment options
The treatment options for NSCLC are primarily based on the stage of the lung
cancer. Surgery is the most successful and consistent therapy to remove the
tumour for patients with early stages (stage I and stage II NSCLC), whereas those
who are diagnosed with locally advanced (stage III NSCLCL) or metastatic (stage
IV NSCLC) (approximately 70%) benefit better from cisplatin-based
chemotherapy or targeted therapy (personalised medicine) (Molina et al., 2008;

Chapter 1 Introduction
26
Reck et al., 2013; Zarogoulidis et al., 2013). Radiation treatment is beneficial for
those who do not respond to surgery or chemotherapy (Molina et al., 2008; Zappa
and Mousa, 2016). The combination of chemotherapy, surgery and/or radiation
therapy or adjuvant therapy is used as the standard treatment to reduce the risk of
lung cancer relapse and to increase overall survival. However, this regimen is
suitable only for certain patients with early-stage NSCLC (Schettino et al., 2008;
Sangha et al., 2010; Zarogoulidis et al., 2013).
Targeted therapy
Targeted therapy for NSCLC has been developed to treat specific molecular
targets by altering major cell-signaling and regulatory pathways (Molina et al.,
2008). The epidermal growth factor receptor (EGFR), a tyrosine kinase receptor,
plays an important role in the development and progression of NSCLC
(Zarogoulidis et al., 2013; Zappa and Mousa, 2016) and overexpresses in various
epithelial tumours including NSCLC (40- 80%) (Schettino et al., 2008). Inhibitors
of EGFR including tyrosine kinase inhibitors (TKIs) such as erlotinib and
gefitinib as well as anti-EGFR antibodies such as cetuximab and panitumumab
have shown clinical benefit in patients with NSCLC. However, TKIs are the most
promising therapy for NSCLC due to a significant response for patients with lung
adenocarcinoma (Riely and Ladanyi, 2008; Zappa and Mousa, 2016). EGFR gene
mutations, which account for 10-15% of European and Asian patients with
adrenoma carcinoma, can cause uncontrolled cell division (Zappa and Mousa,
2016; Liao et al., 2017). These mutations are sensitive to EGFR tyrosine kinase
inhibitors (EGFR-TKIs) which exhibited a good response rate of 70%, with
significantly improved overall survival for patients who received erlotinib
compared with a placebo (Zappa and Mousa, 2016). However, there was no
difference in overall survival between gefitinib and placebo groups (Nurwidya et
al., 2016; Chang et al., 2017).
The first-generation EGFR-TKIs such as erlotinib (Tarveca®, 150 mg orally
daily) and gefitinib (Iressa®, 250 mg orally daily) and the second-generation
EGFR-TKIs such as afatinib (Gilotrif®, 40 mg orally daily) have all been
approved by the US FDA as standard first-line treatment for advanced EGFR

Chapter 1 Introduction
27
mutant NSCLC (Liao et al., 2017). Among the three approved drugs, gefitinib is
limited to use in a subgroup of patients with NSCLC, while afatinib has not
improved the overall survival as compared to gefitinib and erlotinib treatment
(Nurwidya et al., 2016; Yang et al., 2017a). The next section will further discuss
erlotinib, EGFR –TKI, used in this study. The third-generation EGFR-TKIs such
as osimertinib, olmutinib and rociletinib have been developed with activity
against EGFR mutations, but with less skin rash and diarrhea adverse effect than
first and second-generation EGFR-TKIs agents. However, these drugs are still in
the trial phase (Liao et al., 2017; Yang et al., 2017a).
According to the UK National Institute for Health and Care Excellence (NICE)
and the US Food and Drug Administration (USFDA), erlotinib is approved as a
first-line treatment for initial treatment of patients with NSCLC whose cancer has
spread to other parts of the body and who have certain types of EGFR mutations,
and as second or third line treatment for maintenance treatment of advanced-stage
NSCLC (Zarogoulidis et al., 2013). However, erlotinib is associated with
dermatological toxicities through the mechanism of EGFR-associated cutaneous
toxicity, which is not completely understand since there are several steps involved
in the inhibition of EGFR-mediated signaling pathways, including premature
differentiation and stimulation of inflammation (Thatcher et al., 2009).
Erlotinib is currently marketed for the treatment of locally advanced or metastatic
NSCLC in film-coated oral tablet under the trade names of Erlocip® (Cipla),
Tarceva® (Roche) and Erloshil® (Raichem). The usual clinical oral dose of
erlotinib is 150 mg/day, which is its maximum tolerated dose (MTD) (Yeo et al.,
2010b, BNF, 2018). The mechanism of action, chemical structure as well as
formulation approaches for erlotinib will be further described in Section 1.8.1.
Pulmonary drug delivery
Approximately 70% of patients with NSCLC suffer from advanced local invasion
and/or distant metastasis stage at the time of diagnosis, meaning that surgery is
not sufficiently curative treatment for these patients (Reck et al., 2013; Rudokas et
al., 2016). Moreover, current oral drug delivery of cytotoxic drugs may cause

Chapter 1 Introduction
28
systemic side effects and sub-therapeutic doses at the target sites (Hu et al., 2013;
Rudokas et al., 2016). Pulmonary delivery may reduce the side effects of systemic
administration and enhance therapeutic efficacy by delivering a chemotherapeutic
agent directly to its site of action in order to achieve the most effective localised
treatment (Patil and Sarasija, 2012). Therefore, strategies for targeting lung cancer
locally (pulmonary drug delivery) have been considered not only for possible
remission of cancer but also for the control of lung cancer metastases. Such local
delivery can possibly enhance the effectiveness of surgery and/or radiotherapy
(Hu et al., 2013; Rudokas et al., 2016).
Pulmonary drug delivery is an attractive delivery approach as it can produce a
rapid onset of drug action, is non-invasive and is an effective route of
administration for drugs having local and systemic effects (Pilcer and Amighi,
2010). Furthermore, lower dosages can be delivered since this delivery system
allows the avoidance of first-pass metabolism and drug degradation compared
with oral route. Further, unwanted side effects and drug interactions when more
than one medication is administered concurrently can be minimised (Timsina et
al., 1994). The physiology of lung ensures it is an attractive target for drug
delivery. It provides a large absorptive surface area (approximately 70-140 m2)
and a highly permeable membrane (0.2-0.7 µm thickness) especially in the
alveolar region, the absorption site for most drugs and various macromolecules.
Furthermore, the lung has a rich blood supply and low enzymatic activity
compared to the gastrointestinal tract (GI) and liver. The pulmonary route thus
offers efficient drug absorption to the systemic circulation (Labiris and Dolovich,
2003; Patil and Sarasija, 2012). However, deposition of inhaled drugs within the
airways and the effectiveness of the inhalation route are still challenging for
multifunctional reasons including the physicochemical properties of drugs, the
characteristic properties of formulations and the types of inhaled devices available
(Rudokas et al., 2016). Adrenocarcinoma cells (40% of NSCLC cases) are found
in small peripheral airways (bronchioles and alveoli) and type II aveolar cell,
these regions are therefore major targets for NSCLC treatment (Zappa and Mousa,
2016; Gazdar et al., 1990), with delivery approaches targeting these lung regions
being be particularly appropriate.
Chapter 1 Introduction
29
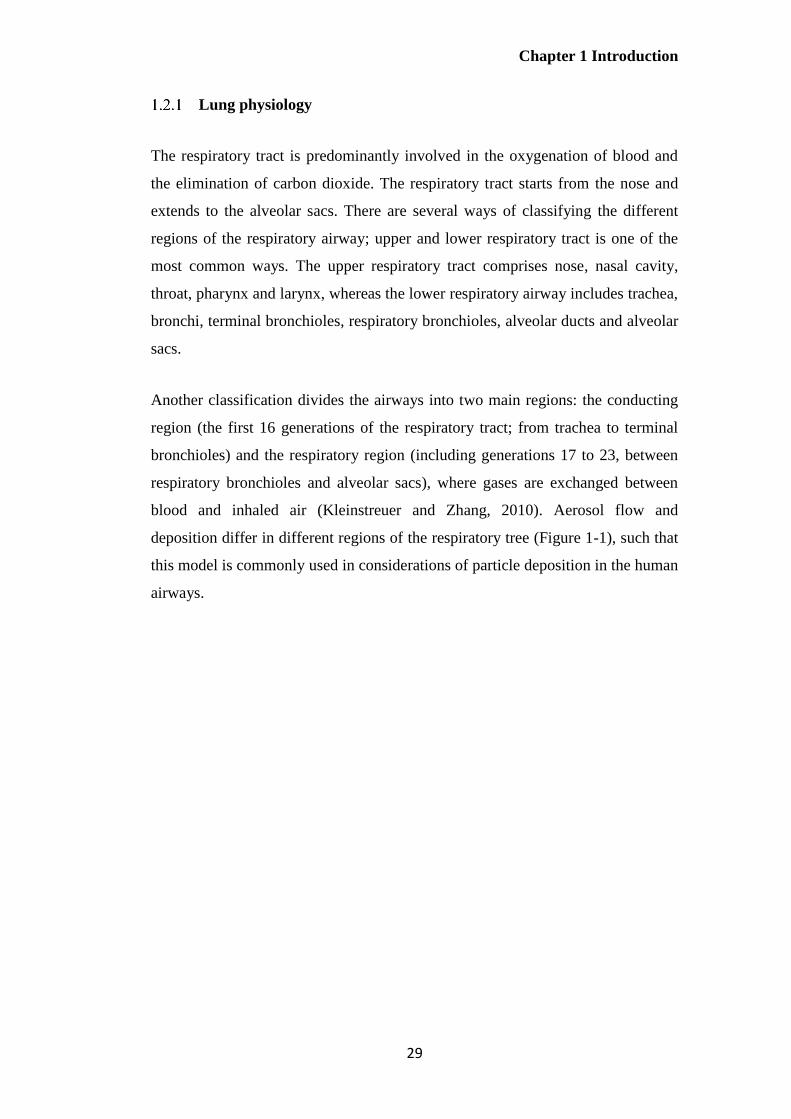
Lung physiology
The respiratory tract is predominantly involved in the oxygenation of blood and
the elimination of carbon dioxide. The respiratory tract starts from the nose and
extends to the alveolar sacs. There are several ways of classifying the different
regions of the respiratory airway; upper and lower respiratory tract is one of the
most common ways. The upper respiratory tract comprises nose, nasal cavity,
throat, pharynx and larynx, whereas the lower respiratory airway includes trachea,
bronchi, terminal bronchioles, respiratory bronchioles, alveolar ducts and alveolar
sacs.
Another classification divides the airways into two main regions: the conducting
region (the first 16 generations of the respiratory tract; from trachea to terminal
bronchioles) and the respiratory region (including generations 17 to 23, between
respiratory bronchioles and alveolar sacs), where gases are exchanged between
blood and inhaled air (Kleinstreuer and Zhang, 2010). Aerosol flow and
deposition differ in different regions of the respiratory tree (Figure 1-1), such that
this model is commonly used in considerations of particle deposition in the human
airways.

Chapter 1 Introduction
30
Figure 1-1 The human airways (Kleinstreuer and Zhang, 2010)
Inhalation aerosols and aerodynamic diameter
In order to deliver medication to the deep lung region, certain parameters should
be considered. The most critical parameter determining the site of aerosol
deposition and distribution within the airways is particle size and this term is
normally standardised to aerodynamic diameter (da, Eq.1-1). The aerodynamic
diameter (da) is the diameter of a sphere of unit density that reaches the same
terminal settling velocity in an air stream as the particle in question. This
parameter depends on the particulate properties such as geometric size, shape and
density and can be calculated using Eq. 1-1 (Chow et al., 2007).
𝑑𝑎 = 𝑑𝑔𝑒𝑜 ∗ √𝜌
𝜒 𝜌 𝜊 Eq. 1-1
where 𝑑𝑔𝑒𝑜 is the physical diameter of particle, ρ is the density of particle, χ is the
dynamic shape factor and ρ0 is unit density. Since shape can influence the motion
of the particles in the airsteam for non-spherical particles, the relationship
between da and 𝑑𝑔𝑒𝑜 can be complexed in these cases. The dynamic shape factor

Chapter 1 Introduction
31
is expressed as the ratio of the drag force on a non-sphere particle to the drag
force of a sphere with the same volume at the same velocity (Chow et al., 2007).
Most inhalation systems are polydispersed, containing a range of particle sizes.
Mass median aerodynamic diameter (MMAD), which refers to the particle
diameter that has 50% of cumulative mass above and below it, is generally
presented. The distribution of sizes or the variability of the particle diameters
within the aerosol is expressed as the geometric standard deviation (GSD) for log
normal distributions. This parameter is calculated from the ratio of the particle
diameter at 84.13% and 15.87% on the cumulative distribution curve. A GSD
equivalent to 1 indicates a monodisperse system, whilst, a GSD of > 1.2 indicates
a polydispersed system (Colombo, 2013).
Mechanisms of aerosol deposition in the airways
The particle size of an aerosol is a major factor determining the efficacy of a
therapeutic aerosol, determining airways penetration, deposition, dissolution and
clearance. More specifically, an aerosol size below approximately 5 μm is
required to penetrate to the respiratory region. In order to reach alveolar regions,
an aerosol size smaller than 2 μm is preferable. Particles with diameter less than 1
μm may be exhaled during normal tidal breathing. On the other hand, larger
droplets are deposited in the upper respiratory airways and quickly eliminated by
mucociliary clearance mechanism (Chow et al., 2007) Thus, most inhalation
products are formulated in the aerodynamic diameter range between 1 and 5 μm
(Colombo, 2013).
Three mechanisms, namely inertial impaction, gravitational sedimentation and
Brownian diffusion, are predominantly responsible for particle deposition in the
lung. All of these depend on particle diameter. Particle deposition can also occur
by other mechanisms including interception and electrostatic precipitation (Figure
1-2).

Chapter 1 Introduction
32
Figure 1-2 Particle deposition in the respiratory tract (Mossman et al., 2011)
In the upper respiratory tract and at the conducting airway bifurcations, inertial
impaction is the most important deposition mechanism for particles greater than 5
μm and particular larger than 10 μm. The change in airflow direction causes
particles having a large momentum to impact on the airway’s walls since their
momentum tends to keep them on their original trajectories instead of following
the air streamline. Hence, impaction normally occurs in the first 10 airways
generations or near the sharp-angled bifurcations, where the velocity of airflow is
high and airstream is turbulent. Particles in the size range 0.5 to 5 µm, which
escape impaction, are largely deposited by gravitational sedimentation. This
mechanism, resulting from the gravitational force, occurs in the last 5 or 6
generation of airways (bronchioles and alveolar region), where the air velocity is
low. Brownian diffusion is the most prevalent deposition mechanism for particles
with diameter smaller than approximately 0.5 µm, where airstream velocity is
near zero or absent (alveolar region). Deposition by this mechanism is caused by
the random bombardment of gas molecules against the particles. This effect can
result in an irregular motion of the particles from high to low concentrations,
causing them to diffuse from the aerosol cloud to the airways’ walls and thus to
deposit.

Chapter 1 Introduction
33
Challenges in pulmonary delivery
According to Eq.1-1, particles with smaller size, lower particle density and/or
higher dynamic shape factor will have smaller aerodynamic diameter. One
approach to enhance alveolar deposition is to create large porous hollow particles
(LPHPs). This design is to lower the density of particles to achieve a small
aerodynamic diameter. Previous studies have shown that larger porous particles
have higher dispersibility from a delivery device and improved fine particle
fraction as compared to smaller non-porous particles. This possibly due to their
smaller surface-to-volume ratio, resulting in easier deagglomeration upon
inhalation (Gharse and Fiegel, 2016). Larger particles with low density can lower
the probability of inhaled drug losses before particles enter the airways, leading to
a better systemic bioavailability as seen in the case of insulin in vivo (Edwards et
al., 1997).
Particle interactions including particle-particle and particle-surface interactions
are another crucial factor for deep lung deposition. This is associated with van der
Waals forces, which are related to particle shape, surface properties, size,
hygroscopicity and electrostatic properties. For example, particles having lower
van der Waals force (attractive force) and lower contact surface show less
aggregation during aerosolisation, resulting in better flowability, aerosolisation
and deposition (emitted dose and fine particle fraction) properties. This can be
seen in a comparison of pollen-shaped particles and other particle shapes such as
needles, cubes and plates (Hassan and Lau, 2009).
When the aerodynamic diameter of the particles is very small compared with the
dimensions of the airways, the centre of mass remains in a mainstream flow,
while the distal ends of the particles may come into contact with an airway or
alveolar wall, giving high interception deposition due to their large attractive
forces. This can be seen in the case of elongated or needled-like particles such as
fibres (Hassan and Lau, 2009; Cheng, 2014).
Nanocarriers smaller than 200 nm have been demonstrated to escape macrophage
phagocytosis. Hence, nanomaterials may remain longer in the lung fluid compared
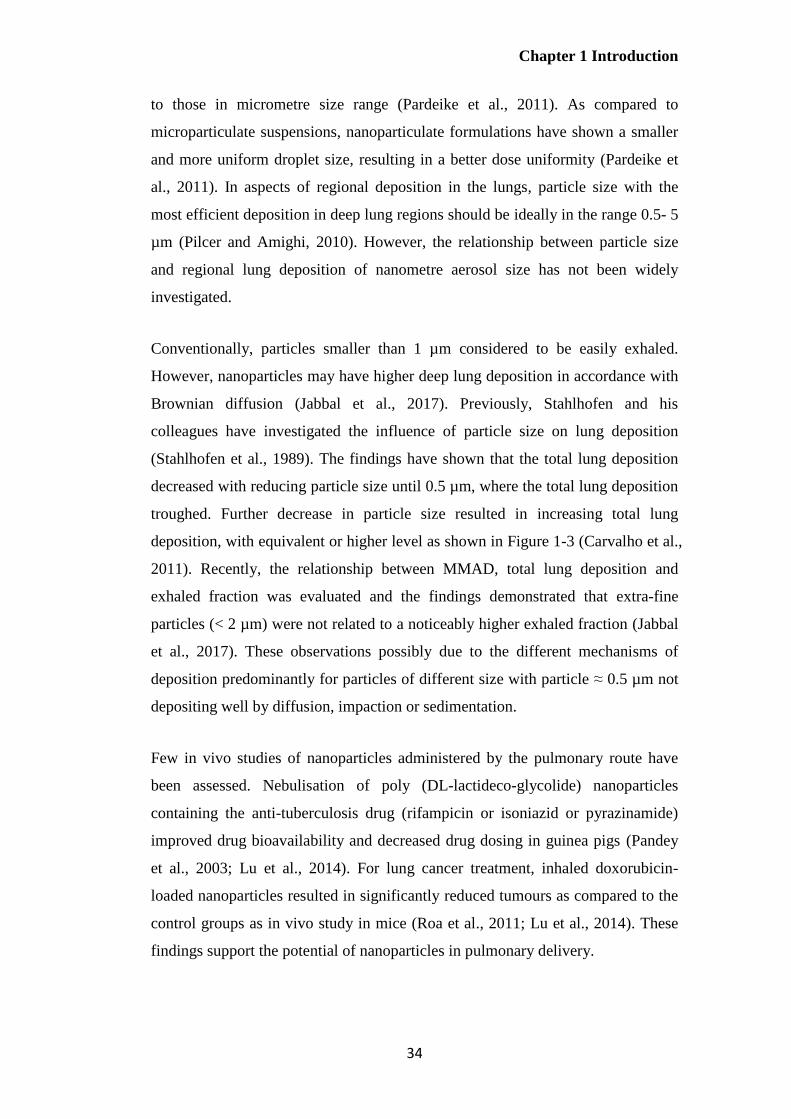
Chapter 1 Introduction
34
to those in micrometre size range (Pardeike et al., 2011). As compared to
microparticulate suspensions, nanoparticulate formulations have shown a smaller
and more uniform droplet size, resulting in a better dose uniformity (Pardeike et
al., 2011). In aspects of regional deposition in the lungs, particle size with the
most efficient deposition in deep lung regions should be ideally in the range 0.5- 5
µm (Pilcer and Amighi, 2010). However, the relationship between particle size
and regional lung deposition of nanometre aerosol size has not been widely
investigated.
Conventionally, particles smaller than 1 µm considered to be easily exhaled.
However, nanoparticles may have higher deep lung deposition in accordance with
Brownian diffusion (Jabbal et al., 2017). Previously, Stahlhofen and his
colleagues have investigated the influence of particle size on lung deposition
(Stahlhofen et al., 1989). The findings have shown that the total lung deposition
decreased with reducing particle size until 0.5 µm, where the total lung deposition
troughed. Further decrease in particle size resulted in increasing total lung
deposition, with equivalent or higher level as shown in Figure 1-3 (Carvalho et al.,
2011). Recently, the relationship between MMAD, total lung deposition and
exhaled fraction was evaluated and the findings demonstrated that extra-fine
particles (< 2 µm) were not related to a noticeably higher exhaled fraction (Jabbal
et al., 2017). These observations possibly due to the different mechanisms of
deposition predominantly for particles of different size with particle ≈ 0.5 µm not
depositing well by diffusion, impaction or sedimentation.
Few in vivo studies of nanoparticles administered by the pulmonary route have
been assessed. Nebulisation of poly (DL-lactideco-glycolide) nanoparticles
containing the anti-tuberculosis drug (rifampicin or isoniazid or pyrazinamide)
improved drug bioavailability and decreased drug dosing in guinea pigs (Pandey
et al., 2003; Lu et al., 2014). For lung cancer treatment, inhaled doxorubicin-
loaded nanoparticles resulted in significantly reduced tumours as compared to the
control groups as in vivo study in mice (Roa et al., 2011; Lu et al., 2014). These
findings support the potential of nanoparticles in pulmonary delivery.

Chapter 1 Introduction
35
Figure 1-3 The relationship of particle size and respiratory deposition fraction of inhaled product (Carvalho et al., 2011)
Inhalation devices for pulmonary delivery
Currently, there are four main types of delivery devices for inhalation
commercially available, which are pressurised metered-dose inhalers (pMDIs),
dry powder inhalers (DPIs), soft-mist inhalers and nebulisers.
Pressurised metered- dose inhalers (pMDIs)
Pressurised metered- dose inhalers (pMDIs) are the most common multi-dose
devices used for pulmonary delivery (Dolovich and Dhand, 2011; Lavorini et al.,
2017). Their portability, disposability, relatively low cost, multidose convenience,
and reproducible dose delivery has led to their popularity for the treatment of
COPD and asthma (Newman, 2005; Stein et al., 2014; Taylor, 2018).
Formulations for pMDIs can be as solutions or suspensions in liquefied propellant
together with other excipients such as surfactants, co-solvents, and solubilising
agents to solubilise and stabilise drug in the formulations (Newman, 2005;
Ibrahim et al., 2015). Traditional chlorofluorocarbon (CFC) propellants are no
longer used and have been replaced by non-ozone-depleting propellants,
Tracheobronchial region
Alveolar
region
Extrathoraic airways
Total

Chapter 1 Introduction
36
hydrofluoroalkanes (HFAs) namely heptafluoropropane (HFA-227) and
tetrafluoroethane (HFA-134a) (Ibrahim et al., 2015; Taylor, 2018).
A major drawback of pMDIs is the low fraction of drug delivered (not more than
20% of the stated emitted dose) to the lung attributed to high particle exit velocity
and poor actuation and inhalation coordination by patients (Newman, 2005; Pilcer
and Amighi, 2010; Lavorini et al., 2017). Spacer attachments (AeroChamber
Plus®), valve holding chambers (Autohaler®) and breath-actuated pMDIs
(Syncroner®, Easi-breathe®) have been developed in order to overcome problems
with inhalation-actuation coordination since the devices can fire the dose
automatically through a spring mechanism when the patients inhale. Also, these
inhalation aids may slow down the velocity of the emitted aerosol cloud and allow
efficient propellant evaporation, causing a relatively smaller size slowly moving,
with improved potential for deep lung deposition and lower throat impaction
(Ibrahim et al., 2015). However, spacer devices are not convenient to use. In
addition, the static charge on the internal walls can occur with some models of
plastic spacers, thereby decreasing the emitted dose to the patients (Newman,
2014).
Dry powder inhalers (DPIs)
Dry powder inhalers (DPIs) are convenient and simple-to use devices, with
various advantages over pMDIs (Atkins, 2005; Pilcer and Amighi, 2010;
Dolovich and Dhand, 2011). DPI formulations are propellant-free and do not
require any excipients except sometimes a carrier (e.g. lactose). Moreover, DPI
dosage forms generally have better chemical and physical stability than liquid
formulations (Pilcer and Amighi, 2010). These inhaler devices can deliver larger
drug doses than pMDIs, which are limited by the volume of the metering valve
and the highest concentration of suspension that can be employed without valve
clogging. DPIs require less coordination of breathing and actuation as compared
to pMDIs since they are generally breath-actuated devices (Ibrahim et al., 2015;
Taylor, 2018).

Chapter 1 Introduction
37
Based on the mechanism for powder aerosolisation, DPIs can be divided into two
types; passively- (relying on the patient inspiration’s effort) and actively- DPIs
(containing energy source) (Ibrahim et al., 2015). Active DPIs seem simpler to
operate than the passive devices, though none of such advanced inhalers are
currently available in the market. DPIs can also be classified into three types by
the number of doses; single-unit dose, multi-unit dose and multi-dose reservoirs
(Figure 1-4). In unit dose inhalers such as Aerolizer®, Cyclohaler® and
Handihaler® (Figure 1-4a and 1-4b), drug dose is pre-metered in a single hard
gelatin capsule which is discarded after use. This device requires the patients to
insert a new capsule before each use. Multi-unit dose inhalers (Figure 1-4c)
contain multiple pre-metered individual doses in replaceable foil blisters (Ellipta®
and Diskhaler®). Multi-dose devices (Figure 1-4d) comprise a reservoir of drug
powder (Easyhaler® and Turbuhaler®), from which the device-metered dose will
be delivered upon each inhalation (Pilcer and Amighi, 2010; Ibrahim et al., 2015;
Lavorini et al., 2017).
However, the multitude of DPIs having unit-dose and multi-dose design, which
may be complex and confusing for patients resulting in inhalation errors, and
errors in device preparation, handling with a negative effect on adherence
(Newman, 2014).
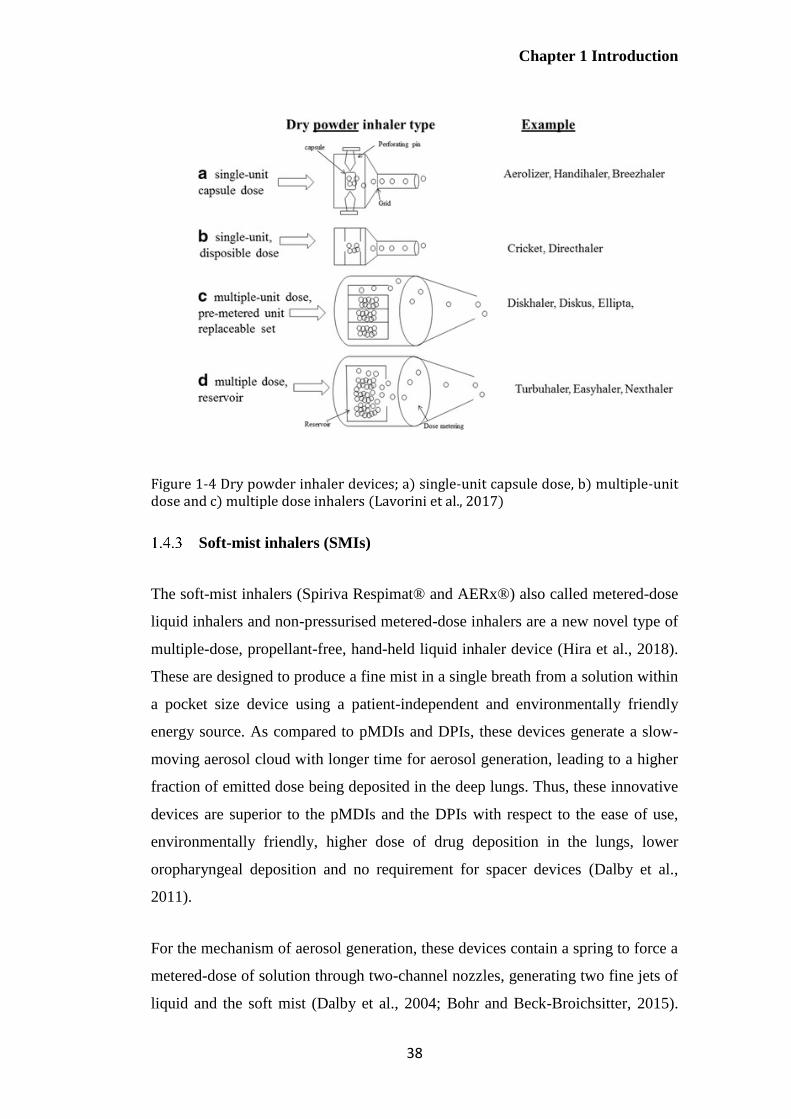
Chapter 1 Introduction
38
Figure 1-4 Dry powder inhaler devices; a) single-unit capsule dose, b) multiple-unit dose and c) multiple dose inhalers (Lavorini et al., 2017)
Soft-mist inhalers (SMIs)
The soft-mist inhalers (Spiriva Respimat® and AERx®) also called metered-dose
liquid inhalers and non-pressurised metered-dose inhalers are a new novel type of
multiple-dose, propellant-free, hand-held liquid inhaler device (Hira et al., 2018).
These are designed to produce a fine mist in a single breath from a solution within
a pocket size device using a patient-independent and environmentally friendly
energy source. As compared to pMDIs and DPIs, these devices generate a slow-
moving aerosol cloud with longer time for aerosol generation, leading to a higher
fraction of emitted dose being deposited in the deep lungs. Thus, these innovative
devices are superior to the pMDIs and the DPIs with respect to the ease of use,
environmentally friendly, higher dose of drug deposition in the lungs, lower
oropharyngeal deposition and no requirement for spacer devices (Dalby et al.,
2011).
For the mechanism of aerosol generation, these devices contain a spring to force a
metered-dose of solution through two-channel nozzles, generating two fine jets of
liquid and the soft mist (Dalby et al., 2004; Bohr and Beck-Broichsitter, 2015).
Chapter 1 Introduction
39
Drug solutions can be formulated in either water or ethanol. Ethanol can be used
as a solvent and preservative. Soft-mist inhalers are beneficial for patients who
have difficulty in coordinating inhalation and actuation may represent in the
future direction of novel delivery devices (Watts et al., 2008; Dalby et al., 2011;
De Pablo et al., 2017).
Until now, all the aforementioned devices (pMDIs, DPIs and SMIs) can deliver
only small doses of the therapeutic agent (i.e. asthma) and thus may not be
appropriate for the treatment of many diseases which large doses are needed
including cancer and infectious diseases (Rudokas et al., 2016).
Nebulisers
Nebulisers are devices which are used for converting liquid formulations (an
aqueous solution or suspension) into an aerosol where most of the drug released is
in droplets having an aerodynamic diameter of 1-5 µm (O'Callaghan and Barry,
1997). Nebulisers have several advantages over pMDIs, DPIs and SMIs in that
larger doses/volumes can be delivered over an extended period, requiring minimal
processing of formulations (e.g. lack of organic solvents and drying stages)
(Rudokas et al., 2016). Patients can inhale medication fluid through a facemask or
mouthpiece during a normal tidal breathing, and thus these devices can be used
for any patient groups and/or clinical conditions. They are alternative devices for
patients who cannot coordinate actuation and inhalation for pMDIs and/or those
who experience difficulties with the inspiration flow required by DPIs (Ibrahim et
al., 2015). Nebulisers are useful for drugs that cannot be readily formulated for
pMDIs and DPIs or where the therapeutic dose is too high for delivery by those
devices. Moreover, different compatible solutions can be concurrently nebulised
(Taylor and McCallion, 1997; Ari, 2014).
There are some disadvantages of nebulisers; for example, a longer administration
time is required, they have reduced portability, and there is a requirement for an
external power source such as battery or main electric supply and compressed air
for air-jet devices (Cipolla et al., 2013).

Chapter 1 Introduction
40
Commercially available nebulisers are divided into three categories depending on
their operating principle: ultrasonic, air-jet, and vibrating-mesh nebulisers.
Ultrasonic nebulisers
Ultrasonic nebulisers produce aerosol droplets at high frequency (1-3 MHz) using
a vibrating piezoelectric crystal at the base of the device. The vibrations are
transmitted directly to the surface of a drug solution, resulting in a fountain of
liquid on the surface in a nebuliser chamber. The size distribution of aerosols is
determined by baffles, which recycle large droplets and allow the smaller ones to
be delivered for inhalation (Elhissi et al., 2012).
During operation, heat is generated in the fluid being aerosolised which can
denature heat-sensitive materials such as proteins (Ari, 2014). These devices are
not suitable for delivering viscous liquids and suspensions, probably due to a
reduced force used to atomise the fluid (Hess, 2008; Ibrahim et al., 2015). Also,
increasing temperatures during operation may impact delicate formulations
particularly liposomes, resulting in fusion and drug loss (Elhissi et al., 2012).
Consequently, the popularity of this type of device has decreased in recent years
particular with the advent of vibrating-mesh devices (Le Brun et al., 2000; Yeo et
al., 2010a; Ari, 2014).
Air-jet nebulisers
Air-jet nebulisers are the most commonly used nebulisers due to ease of use,
convenience and relatively low cost (Hess, 2008). The driving gas passes through
a narrow aperture (Venturi nozzle) from the compressor. At the aperture, the
pressure decreases and the gas velocity increases, leading to a production of a
cone shape. Due to a negative pressure, fluid is drawn up the feeding tube system
into fine ligaments. The fine ligaments collapse into droplets due to the liquid’s
surface tension (O'Callaghan and Barry, 1997; Lavorini, 2013; Taylor, 2018).
During atomisation of liquid, coarse aerosol droplets that are the majority of
liquid mass impact on baffles and the nebuliser works depending on the design of
Chapter 1 Introduction
41
air-jet devices. The large droplets will return to the fluid reservoir, while small
droplets are emitted from the nebulisers. The design of the nebuliser device is
critical, affecting droplet size and particle deposition (Hess, 2008). Other
parameters including the characteristics of the fluid (density, viscosity, surface
tension), the velocity and the flow rate of gas and fluid also determine the droplet
size produced by nebulisers (Hess, 2000). For example, an increase in gas velocity
can reduce droplet size (Hess, 2008; Lavorini, 2013; Ibrahim et al., 2015).
Another crucial consideration relating particularly to the nebuliser design, in the
use of air-jet nebulisers is the dead or residual volume. This parameter represents
the volume that is trapped within the nebuliser and thus will not be successfully
delivered from the device. The medication loss due to dead volumes can be
minimised by optimising the internal design of the nebulisers and/or the operation
by the patients during the treatment. Using a conical shaped reservoir can reduce
the residual volume since this design decreases the surface area of the internal
surface of the nebulisers. In addition, patients and clinicians may tap the devices
to increase the aerosol and/or drug output (Hess, 2000; Lavorini, 2013). Also,
adding diluent or more medical fluid may increase the amount of therapeutic
agents delivered. However, this will prolong the administration time, potentially
causing difficulties in maintaining good inhalation technique and a reduction of
patient adherence during therapy (Rubin and Williams, 2014).
There are many designs of jet nebulisers. This may cause variations in clinical
outcomes between air-jet nebulisers combined with different flow rates,
compressors and fill volumes (Abdelrahim et al., 2010; Saeed et al., 2017). Other
drawbacks with the use of air-jet nebulisers are the noise from the compressor, a
drop in the temperature of nebuliser fluid during use, limited portability and the
requirement for a compressor (Waldrep and Dhand, 2008; Ibrahim et al., 2015).
Consequently, nebuliser design has been developed to overcome some of the
aforementioned problems. Air-jet nebulisers can be divided into three classes:
constant output jet nebulisers, breath-enhanced jet nebulisers and breath-actuated
jet nebulisers as described below.

Chapter 1 Introduction
42
1.4.4.2.1 Constant output jet nebulisers
Constant output jet nebulisers such as Misty-Neb® and SideStream® are
conventional constant-output devices producing aerosol during a patient’s
inspiration, expiration and breath- holding (L Rau et al., 2004). They are easy to
handle and use, with good patient compliance (Ari, 2014). However, aerosol
and/or drug loss during the expiration phase and a large dead volume in the
reservoir are serious problems, leading to relatively poor patient dosing and the
variability of drug dose (Chatburn and McPeck, 2007).
These problems have led to developments in air-jet nebuliser design in order to
minimise the drug wastage and enhance drug output.
1.4.4.2.2 Breath-enhanced jet nebulisers
Breath-enhanced jet nebulisers such as the PARI LC® Sprint, PARI LCD® and
NebuTech® generate aerosol droplets using a negative pressure from the patient’s
inspiratory effort. Such devices are modified conventional air-jet devices, using
two one-way valves. Figure 1-5 shows that the inspiratory valve opens and allows
additional ambient air to be entrained into the nebuliser when the patient’s inhaled
airflow is greater than the driving flow of the device. This results in higher aerosol
output compared with conventional designs. By contrast, exhaled gas passes
through an expiratory valve in the mouthpiece and the aerosol returns to the
chamber for renebulisation. This can cause less aerosol/drug wastage to the
surroundings (Ho et al., 2001; Lavorini, 2013; Ari, 2014).

Chapter 1 Introduction
43
Figure 1-5 Operating principle of breath-enhanced jet nebulisers (Coates and Ho, 1998)
1.4.4.2.3 Breath-actuated jet nebulisers
Breath-actuated jet devices are designed to generate aerosol only on inspiration,
thereby decreasing drug waste to the atmosphere (Muchão and Silva Filho, 2010).
These delivery systems can also adapt aerosol delivery in accordance with an
individual patient’s breathing pattern. For instance, the HaloLite® analyzes the
patient’s breathing pattern and then determines the precise dose delivered to each
patient (Leung et al., 2004; Van Dyke and Nikander, 2007; Muchao and Filho,
2010; Lavorini, 2013). Consequently, this type of nebuliser can reduce the
variability in the delivered dose and drug waste, and enhance the amount of
inspired aerosol as well as patient compliance (Lavorini, 2013; Ari, 2014).
However, the drawbacks of this technology are loud noise in operation and high
price (Muchao and Filho, 2010).
Vibrating-mesh nebulisers
Vibrating-mesh nebulisers have shown numerous advantages over other nebuliser
systems; in particular they are small and portable nebulisers, with quiet operation,
short administration times, improved drug/aerosol output efficiency, precise and
consistent drug delivery, low residual volume and the capability to deliver small
drug volumes. Additionally, these devices efficiently deliver a wide range of heat-

Chapter 1 Introduction
44
sensitive substances including insulin, nucleic acids and other proteins and
peptides since they do not significantly heat up the fluid during nebulisation as the
case of ultrasonic devices (Ghazanfari et al., 2007; Lavorini, 2013; Ari, 2014;
Choi et al., 2018).
However, there are several disadvantages with these devices. For example, they
are not suitable for delivering viscous liquids or those that can crystallise on
drying. Furthermore, some models are only available for specific drugs (drug-
device combinations) (Pritchard et al., 2018). Vibrating-mesh nebulisers are a
relatively recent development in nebuliser technology, therefore they are
expensive compared to ultrasonic and air-jet nebulisers (Lavorini, 2013; Ari,
2014). It has been suggested that the biological safety and durability of these
devices should be taken into considerations since the mesh metal can possibly be
broken into small pieces after repeated use (Choi et al., 2018).
Vibrating-mesh nebulisers can be divided into two main types according to their
designs: actively vibrating and passively vibrating devices. However, aerosol
production of both types is based on the same mechanism. Overall, fluid is forced
through multiple micrometre-sized apertures in a mesh or aperture plate to
generate the aerosol (Elhissi et al., 2012).
Passively vibrating-mesh devices
Passively vibrating-mesh nebulisers; for example, the Omron MicroAir NEU22®,
consist of three main parts: 1) a piezoelectric crystal 2) a transducer horn and 3) a
mesh plate containing 6000 tapered holes (3 µm in diameter). The piezoelectric
crystal transmits high frequency vibrations via a transducer horn, which induces
‘passive’ vibrations in the perforated plate, resulting in upwards and downwards
movements of the plate to extrude the fluid through the mesh apertures and
generate aerosol droplets (as Figure 1-6; Ghazanfari et al., 2007; Elhissi et al.,
2012; Lavorini, 2013).

Chapter 1 Introduction
45
Figure 1-6 Operating principle of passively vibrating-mesh nebulisers (Ghazanfari et al.,
2007)
Actively vibrating-mesh devices
Aeroneb®, eFlow® and Velox® are examples of actively vibrating-mesh nebulisers.
These contain an aerosol generator comprising 1000 electroformed dome-shaped
apertures in a plate and a vibrational element. The vibrating element creates
micropump effect by contracting and expanding on application of an electrical
current, this leads to vibration of the plate, consequently producing a slowly
moving aerosol as liquids is drawn through the mesh apertures (Figure 1-7)
(Ghazanfari et al., 2007; Elhissi et al., 2011a; Elhissi et al., 2012; Ari, 2014).
Figure 1-7 Operating principle of actively vibrating-mesh nebulisers (Ghazanfari et al.,
2007)
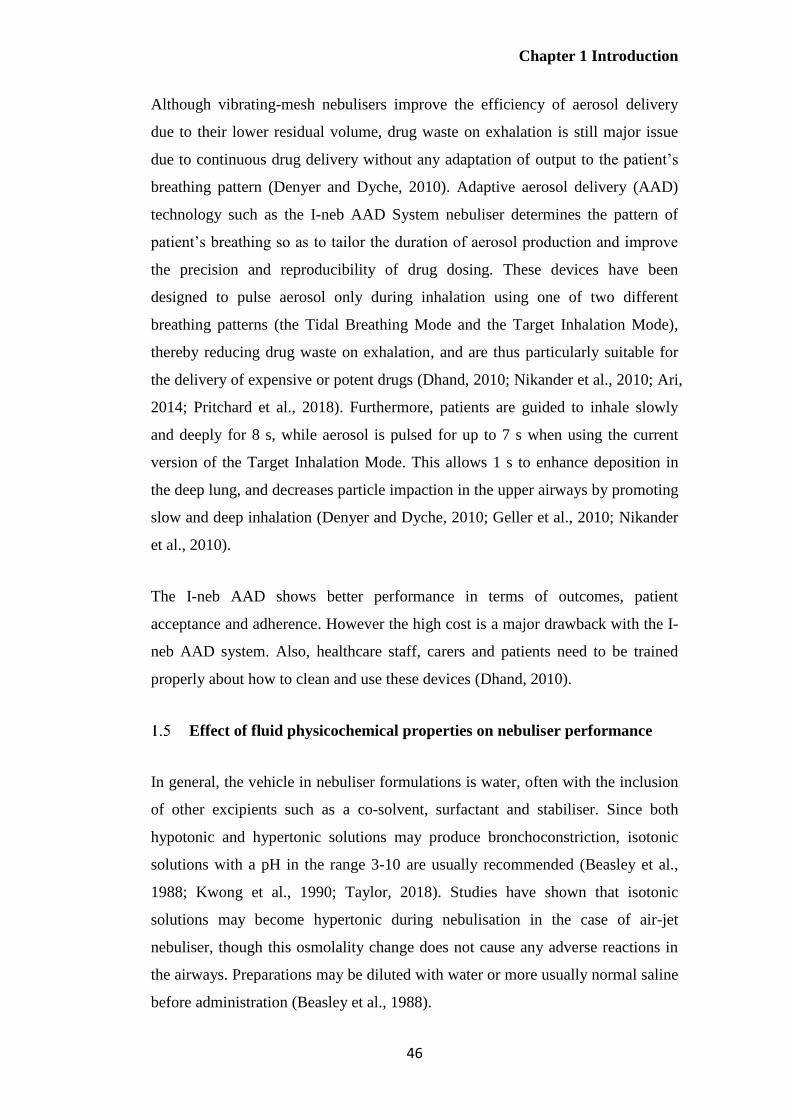
Chapter 1 Introduction
46
Although vibrating-mesh nebulisers improve the efficiency of aerosol delivery
due to their lower residual volume, drug waste on exhalation is still major issue
due to continuous drug delivery without any adaptation of output to the patient’s
breathing pattern (Denyer and Dyche, 2010). Adaptive aerosol delivery (AAD)
technology such as the I-neb AAD System nebuliser determines the pattern of
patient’s breathing so as to tailor the duration of aerosol production and improve
the precision and reproducibility of drug dosing. These devices have been
designed to pulse aerosol only during inhalation using one of two different
breathing patterns (the Tidal Breathing Mode and the Target Inhalation Mode),
thereby reducing drug waste on exhalation, and are thus particularly suitable for
the delivery of expensive or potent drugs (Dhand, 2010; Nikander et al., 2010; Ari,
2014; Pritchard et al., 2018). Furthermore, patients are guided to inhale slowly
and deeply for 8 s, while aerosol is pulsed for up to 7 s when using the current
version of the Target Inhalation Mode. This allows 1 s to enhance deposition in
the deep lung, and decreases particle impaction in the upper airways by promoting
slow and deep inhalation (Denyer and Dyche, 2010; Geller et al., 2010; Nikander
et al., 2010).
The I-neb AAD shows better performance in terms of outcomes, patient
acceptance and adherence. However the high cost is a major drawback with the I-
neb AAD system. Also, healthcare staff, carers and patients need to be trained
properly about how to clean and use these devices (Dhand, 2010).
Effect of fluid physicochemical properties on nebuliser performance
In general, the vehicle in nebuliser formulations is water, often with the inclusion
of other excipients such as a co-solvent, surfactant and stabiliser. Since both
hypotonic and hypertonic solutions may produce bronchoconstriction, isotonic
solutions with a pH in the range 3-10 are usually recommended (Beasley et al.,
1988; Kwong et al., 1990; Taylor, 2018). Studies have shown that isotonic
solutions may become hypertonic during nebulisation in the case of air-jet
nebuliser, though this osmolality change does not cause any adverse reactions in
the airways. Preparations may be diluted with water or more usually normal saline
before administration (Beasley et al., 1988).

Chapter 1 Introduction
47
Nebulisation is the process of converting bulk liquid into an aerosol. The
relationship between the properties of liquid formulations and the operating
principle of the device plays an important role in determining nebuliser
performance (Carvalho and McConville, 2016). In order to assess the
effectiveness of aerosol delivery, characteristic properties of disperse phase for
formulations such as viscosity, surface tension, and ion concentration should be
evaluated to determine whether these factors have an impact on aerosol size and
output characteristics; for instance, on the proportion of aerosol droplets smaller
than 5 µm and the total output (McCallion et al., 1995; Ghazanfari et al., 2007;
Bohr and Beck-Broichsitter, 2015).
It has been previously reported that droplet size is inversely proportional to fluid
viscosity for air-jet nebulisers and vibrating-mesh nebulisers (Najlah et al., 2013).
By contrast, a direct relationship between droplet size and fluid viscosity has been
reported for ultrasonic devices (McCallion et al., 1995; Najlah et al., 2013). The
viscosity and surface tension of nebuliser fluid also affect total drug/aerosol
output of nebulisers since both parameters require energy to generate a new
surface. For example, higher viscosity fluids result in aerosols having a smaller
droplet size and a subsequent increase in FPF and FPD in the case of air-jet and
vibrating-mesh nebulisers, but require a longer nebulisation time and are
associated with lower output and output rate (Ghazanfari et al., 2007). Ultrasonic
devices are not suitable to nebulise high viscosity (McCallion et al., 1995), whilst
for both passively and actively vibrating-mesh nebulisers, aerosol generation
ceases or becomes intermittent at higher viscosities (> 1.92cP). Consequently, air-
jet nebulisers are the most effective devices for generating aerosols from highly
viscous preparations (Ghazanfari et al., 2007; Chan et al., 2011; Najlah et al.,
2013).
The correlation between surface tension and aerosol size and/or aerosol output is
complex. However, studies have demonstrated that an increased total drug output
results for lower surface tension delivered by air-jet and ultrasonic devices for
salbutamol sulfate solutions when surface-active agent is included (Arzhavitina
and Steckel, 2010; Carvalho and McConville, 2016).

Chapter 1 Introduction
48
For vibrating-mesh nebuliser, the presence of ions at increasing concentration has
been shown to cause a reduction in droplet VMD, thereby increasing FPF and
FPD in vibrating-mesh nebulisers. It is proposed that the inclusion of ions in
solutions can reduce water adhesion to the internal wall and mesh pores of the
devices, leading to an earlier detachment of droplets from bulk solutions, a
decrease in the variability of aerosol size, aerosol output rate, nebulisation time
and increasing aerosol output. Therefore, the effective performance of vibrating-
mesh nebulisers may require the inclusion of electrolyte particularly halide ions
(Ghazanfari et al., 2007).
A recent study has reported that there was an inverse relationship between aerosol
output and halide concentration for fluoride, bromide and chloride, while aerosol
output was proportional to iodide concentration (Najlah et al., 2013). This may be
because iodide ions have the greatest polarizing ability at the air-water interface
compared to the other three ions, thereby modulating electrostatic repulsion
within the aerosol cloud. This effect may lead to the finest aerosol, resulting in the
highest aerosol output and FPF. On the other hand, other three ions are likely to
be present in bulk fluid due to their less polarizing properties at the interface. All
observations indicated that different types of halide ions affected the performance
of vibrating-mesh nebuliser (Najlah et al., 2013; Bohr and Beck-Broichsitter,
2015). Thus, the effect of various types of ion (cations and anions) requires
further work for the better understanding of the correlation between ion presence
in solutions and nebulisation performance.
Delivery of advanced formulations
In nebulisers, the main operating principle of nebulisation is based on the
atomisation of liquid into fine droplets; however, there are significant differences
in the mechanism of aerosol generation, which impacts the formulation.
Ultrasonic devices are generally considered not suitable for delivering high
viscosity fluids (greater than 6cP), microparticulate dispersions, suspension,
liposomes and thermolabile peptides or DNA (Hess, 2008; Ibrahim et al., 2015).
However, these devices seem to have applications for aerosol delivery when the
disperse phase is very small since it can be entrained into droplets, with examples

Chapter 1 Introduction
49
of radiolabelled solid lipid nanoparticles (200 nm) and itraconazole-loaded
nanostructured lipid carriers (≈100 nm) being successfully delivered (Videira et
al., 2002; Pardeike et al., 2011).
Various formulations such as protein solutions (rhDNase I), suspensions
(Pulmicort Respules®, budesonide suspensions), nanoemulsions, nanoparticles,
polymeric micelles in the nanosize range and liposomal formulations can be
effectively aerosolised using air-jet nebulisers (Moazeni et al., 2012; Carvalho and
McConville, 2016). Aerosol generation of suspensions using this type of devices
is dependent on the characteristic properties of formulation including particle size
distribution of the dispersed phase in the presence of different excipients (Tadros,
2008; Amani et al., 2010). The aggregation of nanoparticles may be observed
during aerosolisation from these devices (Dailey et al., 2003; Carvalho and
McConville, 2016). Several studies have shown partial protein degradation and
some large aggregation with and without excipients at the air-water interface,
attributed to the shear force during jet-nebulisation (Niven et al., 1996; Respaud et
al., 2014; Hertel et al., 2015).
Vibrating-mesh nebulisers have been demonstrated to be the most effective device
for delivering a number of liquid formulations with better stability during
aerosolisation (Respaud et al., 2014; Bohr and Beck-Broichsitter, 2015; Carvalho
and McConville, 2016). Vibrating-mesh nebulisers are considered preferable to
deliver protein than air-jet and ultrasonic devices since they do not significantly
generate changes in temperature and minimise recycling processes, resulting in
small changes to protein integrity (Bohr and Beck-Broichsitter, 2015).
Among a large number of drug-carriers, liposomes (bilayered phospholipid
vesicles) have shown potential to improve inhalation treatment regimens (Bohr
and Beck-Broichsitter, 2015). Several studies of liposomal formulations delivered
by these devices have shown that different device designs, lipid concentrations
and types of lipid affect the properties of nebulised liposomes and the efficiency
of delivery (Carvalho and McConville, 2016). For example, unilamellar
liposomes smaller than 200 nm are suggested as an optimal system since they can
be easily incorporated into aerosol droplets with minimal drug losses (Lehofer et
Chapter 1 Introduction
50
al., 2014). Moreover, incorporating cholesterol to make fluid state bilayers more
rigid can reduce drug leakage during nebulisation (Lehofer et al., 2014; Cipolla et
al., 2016). Delivery of liposomes using air-jet and vibrating-mesh nebulisers is
more successful than with ultrasonic devices, as these less damage to liposome
bilayers during aerosolisation (Elhissi et al., 2013). Recently, two liposomal
formulations; Arikace® and Pulmaquin® have been studied in phase II/III clinical
trials for the treatment of pulmonary infections (Paranjpe and Müller-Goymann,
2014; Bohr and Beck-Broichsitter, 2015).
In conclusion, critical formulation parameters including particle size, surface
alteration, morphology, rigidity of nanocarriers as well as type of nebuliser need
to be considered to achieve the most effective nanoparticle-based approach for
pulmonary delivery.
Methods of aerosol particle size analysis
Nebulised formulations need to be assessed for aerodynamic particle size, fine
particle dose (mass), fine particle fraction and the emitted dose in order to
compare nebulised systems and possibly to predict the clinical responses
(Abdelrahim et al., 2010). It should be noted that the properties of the aerosol are
a function of both the formulation and the particular device used for aerosolisation.
The fundamental approaches that have been used for aerosol size analysis are
microscopy, laser diffraction, particle time of flight (TOF), phase-Doppler particle
size analysis (PDA) and cascade impaction.
For routine measurements, laser diffraction has been commonly used for particle
size distribution (PSD) of aerosols to estimate the deposition characteristic in the
lung particularly in the case of nebulised aerosols (Clark, 1995). However, laser
diffraction measures geometrical particle dimensions instead of aerodynamic
particle size distribution based on volume, surface and number basis (Pilcer et al.,
2008). Volume median diameter (VMD) with the span value (distribution width)
are commonly reported for particle size analysis (De Boer et al., 2002). Since the
nebulised cloud can be sized when it emits from the mouthpiece before
evaporation occurs, this technique is recommended by Ph. Eur. to use for rapid

Chapter 1 Introduction
51
size-distribution measurement of nebulised aerosol (Ziegler and Wachtel, 2005;
Martin et al., 2006). Among all techniques, cascade impactors are the most widely
method used for measurement of the particle size distribution by mass of
inhalation products based on impaction.
Cascade impactors and impingers
The inertial size-separation of particles in a cascade impactor depends on the
aerodynamic diameter, a key parameter determining particle deposition in the
lung during inhalation (Section 1.2.2). Cascade impactors allow calculation of
FPF and other size fractions of the active pharmaceutical ingredient (API) as well
as non-active ingredients in the formulations following chemical analysis (usually
high performance liquid chromatography). Other methods cannot readily
differentiate between active and non-active components in the formulation as they
measure overall particle size distribution in the absence of chemical assay (Martin
et al., 2006). Moreover, a fine particle mass corresponding to a particle size
distribution of less than 5 µm is the key quality parameters for inhaled aerosol
drug product specifications in accordance with European Medicines Agency
guidelines (EMA, 2006). Cascade impactors provide the greatest information
concerning aerodynamic particle size distribution (APSD) for aerosolised
products with particles in the range of 0.5 to 5 µm and are therefore well suited
for inhalation aerosol characterisation. For these reasons, cascade impaction is the
standard method for characterisation of inhalation aerosols, including nebulisers
and is included in United States Pharmacopoeia, European Pharmacopeia and
British Pharmacopeia (Marple et al., 2003; Majoral et al., 2006; Taylor, 2018;
Fishler and Sznitman, 2017).
There are a number of impactors available; the two most widely employed are 1)
the Andersen Cascade Impactor (ACI; Ph. Eur. Apparatus D) and 2) the Next
Generation Impactor (NGI; Ph. Eur. Apparatus E). Both the ACI and NGI
comprise a series of stages each made up of a plate, with specific nozzle size.
Aerosolised particles are fractionated on the basis of inertial impaction according
to their aerodynamic size distribution, when the aerosol is drawn into the device at
a fixed flow rate. It should be noted that the cascade impactor is not a lung

Chapter 1 Introduction
52
simulator due to a numerous factors including the geometry at the point of impact,
the hardness of the collection surface, coatings and a constant flow rate. Moreover,
each collection stage throughout the impactor does not represent any specific
deposition sites in the lung (Marple et al., 2003). However, the data obtained from
the impactors allows prediction of the probability of an aerosol cloud’s deposition
to the lower lung according to the airborne particle’s behavior in turbulent
airsteams and they are rounetinely used in the pharmaceutical development and
quality control of inhalation products.
When aerosol droplets pass through the nozzles, large/dense particles will deposit
on the collecting plate by impaction. Smaller/less-dense particles will follow the
airstream, which is directed at a right angle to the exit of the nozzle, and they will
impact on the subsequent collecting plate if they have been given sufficient
momentum under high jet velocities (Figure 1-8).
Figure 1-8 Airflow and particle in a cascade impactor (adapted from Copley, 2008)
Deposited aerosol on each stage of the impactor is usually collected and assayed
by high performance liquid chromatography (HPLC). Mass Median Aerodynamic
Diameter (MMAD) and Geometric Standard Deviation (GSD), are calculated
from a plot of cumulative fraction of active substance on each stage versus the
cut-off diameter for that stage plotted on a log scale (Figure 1-9). MMAD is
determined as the particle size at 50% of cumulative fraction by mass for the
Collecting plate
Aerosol particle
Vacuum
Aerosol flow
Nozzle exit

Chapter 1 Introduction
53
deposited particles or droplets. GSD is calculated from the same plot as for
MMAD determination as mentioned using the equation below:
GSD = √𝑆𝑖𝑧𝑒 𝑋(𝐷84.13%)
𝑆𝑖𝑧𝑒 𝑌(𝐷15.87%)
Figure 1-9 The cumulative percentage of mass less than the stated aerodynamic diameters
versus the cut-off diameter; log-probability plot (USP29 NF40)
The ACI (Figure 1-10) and NGI (Figure 1-11) have been used for the
determination of the fine particle dose and the aerodynamic particle size
distribution of aerosols delivered by pMDIs and DPIs. The multistage liquid
impinger (Ph. Eur. Apparatus C) also works on the principle of cascade impaction,
and consists of five stages, with wet sintered glass collection plates followed by a
terminal filter. The European Pharmacopoeia indicates the NGI is also appropriate
for the evaluation of nebuliser performance by measuring the mass of active
ingredient as a function of aerodynamic diameter.
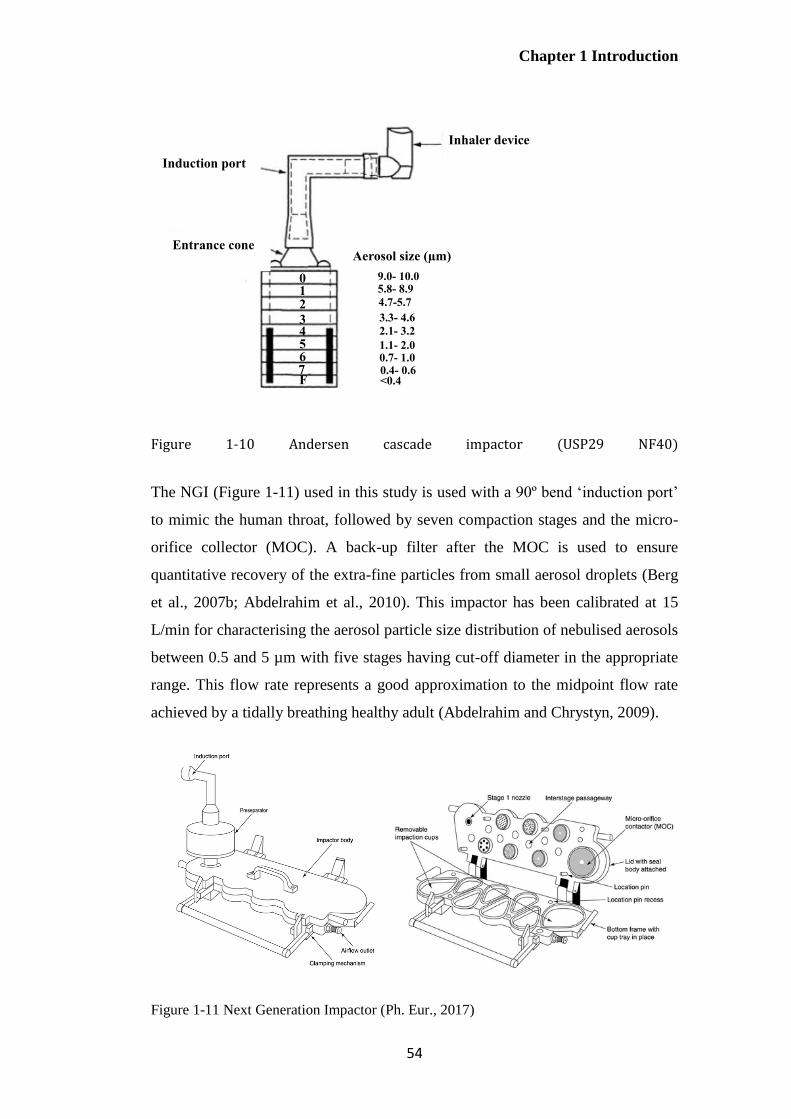
Chapter 1 Introduction
54
Figure 1-10 Andersen cascade impactor (USP29 NF40)
The NGI (Figure 1-11) used in this study is used with a 90º bend ‘induction port’
to mimic the human throat, followed by seven compaction stages and the micro-
orifice collector (MOC). A back-up filter after the MOC is used to ensure
quantitative recovery of the extra-fine particles from small aerosol droplets (Berg
et al., 2007b; Abdelrahim et al., 2010). This impactor has been calibrated at 15
L/min for characterising the aerosol particle size distribution of nebulised aerosols
between 0.5 and 5 µm with five stages having cut-off diameter in the appropriate
range. This flow rate represents a good approximation to the midpoint flow rate
achieved by a tidally breathing healthy adult (Abdelrahim and Chrystyn, 2009).
Figure 1-11 Next Generation Impactor (Ph. Eur., 2017)
Inhaler device
Induction port
Entrance cone
0 1 2
F
5 4 3
7 6
Aerosol size (µm)
9.0- 10.0 5.8- 8.9
4.7-5.7
<0.4 0.4- 0.6 0.7- 1.0 1.1- 2.0
2.1- 3.2
3.3- 4.6

Chapter 1 Introduction
55
The Ph. Eur. requires cooling of the NGI at 5 ºC for at least 90 min before use in
order to minimise evaporation effects and limit changes in droplet size during the
assessment process. Some studies have reported that the MMAD of aerosol
droplets determined with the impactor at lower temperature was larger than that
determined using a non-cooled impactor (Finlay and Stapleton, 1999; Zhou et al.,
2005). This may be explained by differences in temperature between the aerosol
exiting the nebuliser and the body of the impactor, resulting in significant droplet
shrinkage by evaporation (Finlay and Stapleton, 1999).
At 15 L/min, the cut-off diameters for each stage of the NGI are shown in Table
1-1.
Table 1-1 Cut-off diameters for the NGI stages when operated at a flow rate of 15 L/min
Stage Cut-off diameter (µm)
1 14.1
2 8.61
3 5.39
4 3.30
5 2.08
6 1.36
7 0.98
The United States and European pharmacopoeias recommend that collecting
plates of the NGI are coated with silicone oil or high viscosity coatings to reduce
particle bounce-off, particle re-entrainment and inter-stage loss of particles during
aerosolisation for DPI-based formulations, since these effects can lead to a
reduction of the collection efficiency of impactor stages, causing unreliable and
distorted APSDs data. The collecting plates do not require coating with such
materials for aerosol characterisation of nebulised products as these are no shifts
in measured size distributions when uncoated and coated collecting plates were

Chapter 1 Introduction
56
investigated (Berg et al., 2007a; Berg et al., 2008; Abdelrahim and Chrystyn,
2009).
Abbreviated Impactor Measurement (AIM)
The aerodynamic particle size distribution (ASPD) of inhaled medicinal products
is a critical quality attribute obtained with a full-cascade impactor. This parameter
is closely linked with the location of drug deposition in the human lung (Nichols
et al., 2016). Despites their advantages, cascade impactors are labour intensive
and time-consuming to use. Consequently, a traditional cascade impactor-based
analysis is not well suited for high throughput applications such as routine product
quality testing, product development and comprehensive stability studies
(Mitchell et al., 2010; Fishler and Sznitman, 2017; Mohan et al., 2017).
Furthermore, drug deposited across the eight stages of the extended impactors
may cause analytical quantification problems for formulations with low drug
concentration such as potent drugs or low dose medications (Mitchell et al.,
2009a). Therefore, the development of simpler, rapid, accurate and precise
technique has gained in the importance for product development and quality
control of orally inhaled products.
The glass/two-stage impinger (TSI; Ph. Eur.; Apparatus A; Figure 1-12) can be
employed as an alternative to a full-stage impactor. Aerosol droplets are nebulised
in the two stages of the impinger representing coarse aerosol (stage 1) and fine
particle dose (stage 2), suggesting therapeutically useful aerosol (Hallworth and
Westmoreland, 1987). The TSI has a number of drawbacks, particularly, the cut-
off diameter for the lower stage (stage 2) is 6.4 µm (Miller et al., 1992; Holzner
and Müller, 1995), rather than 5 µm, as required for determining the fine particle
dose (FPD) and fine particle fraction (FPF) (EMA, 2006). In addition, the high
flow rate of 60 L/min employed may cause solvent/water evaporation, resulting in
inaccurate measurement of aerosol size. Thus, the TSI provides less information
about aerodynamic particle size distribution than a full cascade impactor/impinger,
plus presents concerns regarding the suitability of the cut-off diameter for routine
analysis.

Chapter 1 Introduction
57
Figure 1-12 Two-stage impinger (Miller et al., 1992)
Whilst the two-stage impinger has been available for many years, it has largely
fallen into disuse. Abbreviated Impactor Measurement (AIM), has not yet been
included in international pharmacopoeias nor is it considered suitable by
regulatory agencies. It is currently being researched as a relatively simple and
quick method for aerosol analysis with improved productivity for the quality
control of inhalation products. The AIM concept has commonly employed an
abbreviated version of a full-stage NGI or ACI with two-size-fractionating stages
of the cascade impactor and a final filter for assessing aerodynamic particle size
distribution and fine particle dose of pMDIs and DPIs (Mitchell et al., 2009b;
Nichols et al., 2016; Mohan et al., 2017). Currently, three abbreviated cascade
impactors are available; Fast Screening Andersen (C- FSA; Copley Scientific Ltd.,
and T-FSA; Trudell Medical International), Reduced Next Generation Impactor
(rNGI; Copley Scientific Ltd.) and Fast Screening Impactor (FSI; Copley
Scientific Ltd. and MSP Corporation). All have been used to obtain APSD
measurements and other quality attributes for marketed pMDIs and DPIs.
The stainless steel Fast Screening Andersen impactor (FSA, Figure 1-13) is an
abbreviated version of the standard full-resolution Andersen Cascade Impactor
(ACI) used for quality control and product development for pMDI and DPI

Chapter 1 Introduction
58
formulations. The FSA consists of two inertial size-fractionation stages (with or
without internal dead space), followed by a final filter. These stages represent
coarse, fine and extra-fine particle fractions. The FPD collected from the FSA is
the summation of drug mass on the surface of the size-fractionation stage and
those deposited on the back-up filter (Mitchell et al., 2009a; Nichols et al., 2016).
Figure 1-13 The Fast Andersen impactor a) C-FSA (without dead space) b) T-FSA (with
dead space) (Nichols et al., 2016)
The reduced Next Generation Impactor (rNGI), which is an abbreviated
configuration of the NGI, can be divided into two types; the-filter-only
configuration (rNGI-f; Figure 1-14a) and the modified-cup configuration (rNGI-
mc; Figure 1-14b). The rNGI-f employs the total internal volume of the
conventional NGI, with all collecting plates in place connected to the vacuum
pump. The rNGI-mc, employs a modified cup with an outlet tube attached directly
to the vacuum pump, thus reducing the entire NGI internal volume. A filter is
placed with a special rNGI filter holder on the top of the chosen stage for both
configurations. The mass of drug deposited on all collecting plates above the
chosen stage is defined as the coarse particle mass, while the mass of drug
collected from the filter (i.e. on stage 3 or 4) is considered as the fine particle
mass (Mohan et al., 2017).
USP/Ph. Eur. Induction
port
(Size range > 9.0 µm)
Empty entry stage
(Size range >4.7µm)
Size-fractionation
stage (Size range < 1.0-
4.7µm)
A back-up filter (Size
range < 1.0 µm)
Internal dead
space (stage 0)
a) b)

Chapter 1 Introduction
59
Figure 1-14 The Reduced Next Generation Impactor a) rNGI-f b) rNGI-mc (Mohan et al.,
2017)
The Fast Screening Impactor (FSI, Figure 1-15), a two-stage abbreviated impactor
with a cut-off diameter of 5 µm between stages and equipped with the USP
induction port and a pre-separator, collects coarse particle mass or non-inhalable
mass (in a pre-separator chamber) and the fine particle mass (filter). A range of
inserts (Figure 1-15b) allows a 5µm cut-off diameter with flow rates between 30
and 100 L/min, allowing characterisation of DPIs and pMDIs (El-Gendy et al.,
2012). It should be noted that abbreviated impactors usually use the same
components as their parent-full resolution impactors. The FSI does not have a
parent-full cascade apparatus; however the NGI has been previously used as the
reference impactor for comparisons based on the pre-separator (Mitchell et al.,
2012b).
All NGI cups
in place
Filter
Connected to vacuum pump
a)
Filter
Rubber
stopper to
block the
airflow after
the chosen
stage
Modified
cup
b)

Chapter 1 Introduction
60
Figure 1-15 Fast Screening Impactor (FSI), a) components of the FSI, b) additional insert
and c) assembled FSI (Nichols et al., 2016)
The AIM concept which employs impactors with 2 or 3 stages may improve
overall method precision by eliminating impaction stages on which small amounts
of active pharmaceutical ingredient (API) which are hard to assay or on which no
drug is deposited (Mitchell et al., 2009a; Mitchell et al., 2010; Guo et al., 2013).
Sampling errors may be decreased by summing data from several collecting plates,
particularly where the mass of active substance recovered on some stages is near
to the lower limit of quantification. However, the removal of some stages from a
full-cascade impactor may produce changes in APSD metrics, resulting from
particle bounce, internal losses and differences in evaporation behaviour in the
abbreviated impactor as demonstrated for pMDIs and DPIs (Mitchell et al., 2008).
Moreover, key parameters of aerosolisation such as MMAD and GSD cannot be
calculated using an abbreviated impactor (Guo et al., 2013). However, it is
possible to use the relatively limited data; coarse, fine and/or extra-fine particle
mass obtained using AIM apparatus (Mitchell et al., 2009a).
In terms of critical quality attributes for aerosolisation, the coarse particle mass
(particle > 5µm) represents particle deposition in the throat and upper airways.
The fine particle mass (particle <5 µm) represents drug particles that potentially
penetrate into deep lung region, while particles smaller than 1 µm (extra-fine
particle dose) have the possibility to reach the alveoli or be exhaled (Guo et al.,
2013). Two metrics: the ratio of coarse particle mass and fine particle mass and
the total amount of particles sized within the impactor (impactor-sized mass; ISM)
a) b) c)
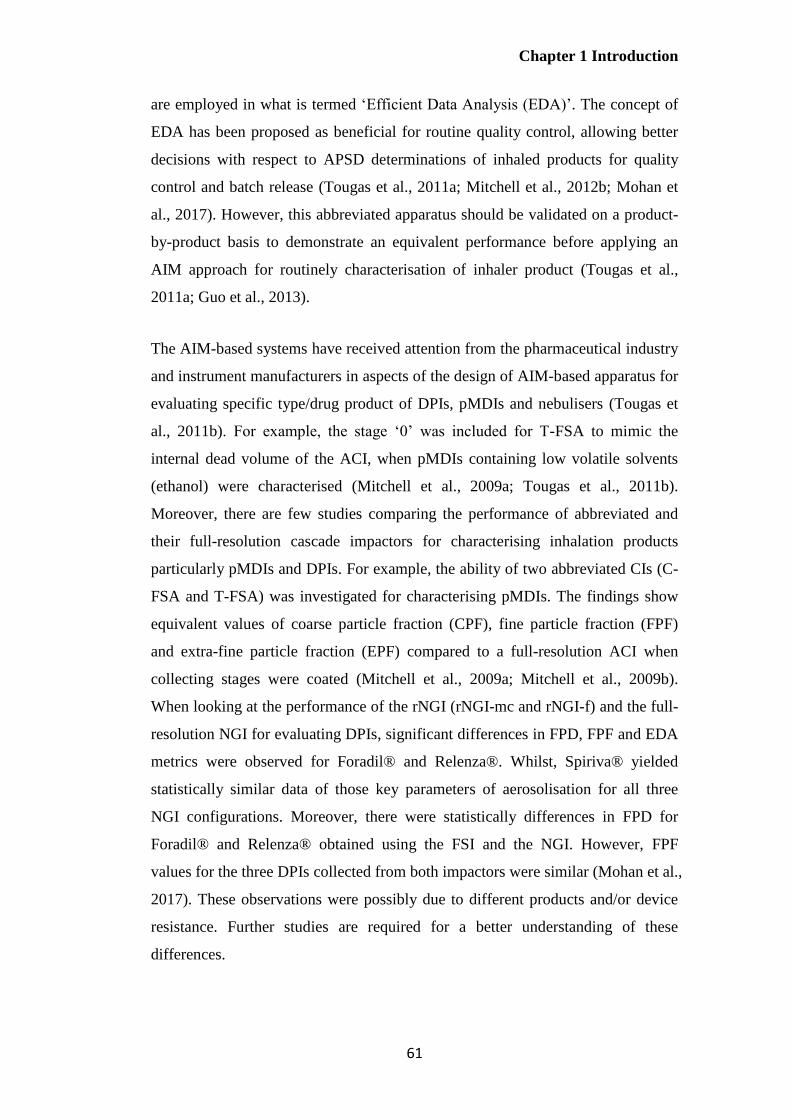
Chapter 1 Introduction
61
are employed in what is termed ‘Efficient Data Analysis (EDA)’. The concept of
EDA has been proposed as beneficial for routine quality control, allowing better
decisions with respect to APSD determinations of inhaled products for quality
control and batch release (Tougas et al., 2011a; Mitchell et al., 2012b; Mohan et
al., 2017). However, this abbreviated apparatus should be validated on a product-
by-product basis to demonstrate an equivalent performance before applying an
AIM approach for routinely characterisation of inhaler product (Tougas et al.,
2011a; Guo et al., 2013).
The AIM-based systems have received attention from the pharmaceutical industry
and instrument manufacturers in aspects of the design of AIM-based apparatus for
evaluating specific type/drug product of DPIs, pMDIs and nebulisers (Tougas et
al., 2011b). For example, the stage ‘0’ was included for T-FSA to mimic the
internal dead volume of the ACI, when pMDIs containing low volatile solvents
(ethanol) were characterised (Mitchell et al., 2009a; Tougas et al., 2011b).
Moreover, there are few studies comparing the performance of abbreviated and
their full-resolution cascade impactors for characterising inhalation products
particularly pMDIs and DPIs. For example, the ability of two abbreviated CIs (C-
FSA and T-FSA) was investigated for characterising pMDIs. The findings show
equivalent values of coarse particle fraction (CPF), fine particle fraction (FPF)
and extra-fine particle fraction (EPF) compared to a full-resolution ACI when
collecting stages were coated (Mitchell et al., 2009a; Mitchell et al., 2009b).
When looking at the performance of the rNGI (rNGI-mc and rNGI-f) and the full-
resolution NGI for evaluating DPIs, significant differences in FPD, FPF and EDA
metrics were observed for Foradil® and Relenza®. Whilst, Spiriva® yielded
statistically similar data of those key parameters of aerosolisation for all three
NGI configurations. Moreover, there were statistically differences in FPD for
Foradil® and Relenza® obtained using the FSI and the NGI. However, FPF
values for the three DPIs collected from both impactors were similar (Mohan et al.,
2017). These observations were possibly due to different products and/or device
resistance. Further studies are required for a better understanding of these
differences.

Chapter 1 Introduction
62
Among three available AIM-based apparatus, FSI with the cut-off diameter of 5
µm between coarse and fine particle fractions can be used to demonstrate
compliance with the EMA guideline for quality of orally inhaled products,
reflecting directly to FPD and FPF calculations (5 µm). It should be noted that the
use of the FSI for characterising the properties of nebulised formulations has
received very little attention. Consequently, the FSI was the focus in this thesis.
Therapeutic agents used in this study and their formulation approaches
Erlotinib
Erlotinib, an EGFR-TKI, inhibits tyrosine kinase activity on EGFR by completing
with ATP at the ATP binding site. There are three pathways downstream of
EGFR involving cell regulations (Schettino et al., 2008). Thus, the blockage of
EGFR signaling pathways promotes cell cycle arrest and apoptosis, and leads to
the inhibition of angiogenesis and cell invasion as shown in Figure 1-16.
Figure 1-16 The mechanism of action of erlotinib (Hammerman et al., 2009)
Erlotinib or N-(3-ethynylphenyl)-6,7-bis(2-methoxyethoxy)quinazolin-4-amine,
has low aqueous solubility and high permeability and therefore it is classified as
class II in the Biopharmaceutics Classification System (BCS). Previous reports
have shown that erlotinib has a pH-dependent solubility and its solubility
increases with decreasing pH. The drug molecule is completely non-ionised and
ionised at the pH values of 11 and 2, respectively (Tóth et al., 2016). Other
physicochemical properties of erlotinib including molecular structure, molecular
weight, molecular formula and log P are shown in Table 1-2.
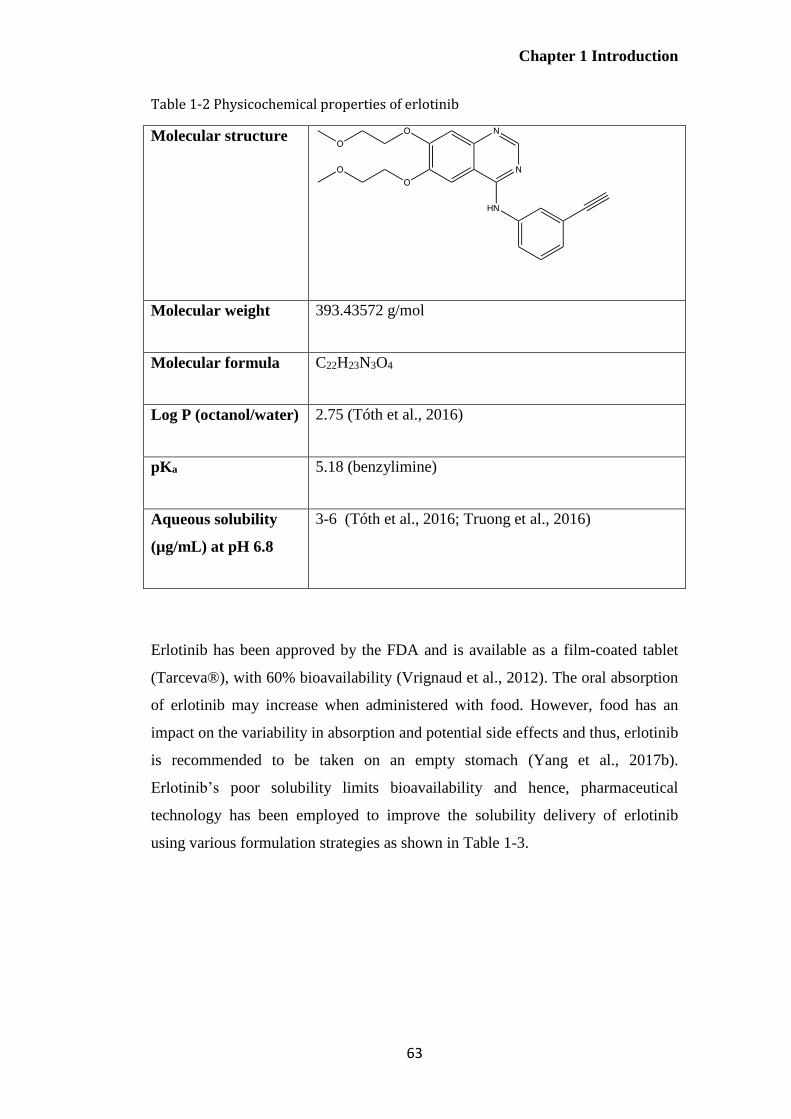
Chapter 1 Introduction
63
Table 1-2 Physicochemical properties of erlotinib
Molecular structure
Molecular weight 393.43572 g/mol
Molecular formula C22H23N3O4
Log P (octanol/water) 2.75 (Tóth et al., 2016)
pKa 5.18 (benzylimine)
Aqueous solubility
(µg/mL) at pH 6.8
3-6 (Tóth et al., 2016; Truong et al., 2016)
Erlotinib has been approved by the FDA and is available as a film-coated tablet
(Tarceva®), with 60% bioavailability (Vrignaud et al., 2012). The oral absorption
of erlotinib may increase when administered with food. However, food has an
impact on the variability in absorption and potential side effects and thus, erlotinib
is recommended to be taken on an empty stomach (Yang et al., 2017b).
Erlotinib’s poor solubility limits bioavailability and hence, pharmaceutical
technology has been employed to improve the solubility delivery of erlotinib
using various formulation strategies as shown in Table 1-3.

Chapter 1 Introduction
64
Table 1-3 Formulation studies for erlotinib
Delivery System Description Treatment Route Study
Lipid-based
nanocarriers
Reverse micelle-loaded lipid nanocarriers containing
erlotinib hydrochloride
Pancreatic cancer - (Vrignaud et al., 2012)
Liposomes co-loaded with erlotinib and doxorubicin Lung and breast
cancer
Intravenous (Morton et al., 2014)
Erlotinib-loaded core-shell type lipid-polymer hybrid
nanoparticles
NSCLC - (Mandal et al., 2016)
Microparticles containing erlotinib-loaded solid lipid
nanoparticles
NSCLC Pulmonary (Bakhtiary et al., 2017)
Co-delivery of erlotinib and IL36 siRNA in amphiphilic
lipid nanocarriers
Psoriasis Topical (Boakye et al., 2017)
Erlotinib-loaded solid lipid nanoparticles Lung cancer Pulmonary (Naseri et al., 2017)
Erlotinib-loaded liposomes modified with galactosylated
lipid
Lung cancer Intravenous (Xu et al., 2017)
Erlotinib-loaded nanoliposomal formulation NSCLC Intravenous (Zhou et al., 2018)

Chapter 1 Introduction
65
Table 1-3 (Cont) Formulation studies for erlotinib
Non-lipid based
nanocarriers
Erlotinib-loaded poly caprolactone-polyethylene glycol-
polycaprolactone PCEC) nanoparticles
NSCLC - (Barghi et al., 2014)
Inclusion of erlotinib in cyclodextrin nanosponge
complex
Pancreatic cancer Oral (Dora et al., 2016)
Solid self-emulsifying system containing erlotinib - Oral (Truong et al., 2016)
Erlotinib-conjugated dextran-coated monocrystalline
iron oxide nanoparticles
Cancer Intravenous (Ali et al., 2016)
Poly (D,L-lactic-co-glycolic acid)(PLGA) nanoparticles
co-loaded with erlotinib and paclitaxel
Breast Cancer Oral (Khuroo et al., 2018)

Chapter 1 Introduction
66
Genistein
Phytochemicals present in fruits and vegetables have been studied for their role in
the prevention and cancer treatment in various lung cancer cell lines. In-vitro and
in-vivo studies have demonstrated that the bioactive compounds present in the
diet, including genistein (soybean), curcumin (turmeric) and fisetin (fruit and
vegetables) produce alterations of cell cycle control, induce apoptosis, and inhibit
angiogenesis and metastasis (Russo et al., 2010; Khan and Mukhtar, 2015).
Consequently, the use of these dietary agents in monotherapy or in combination
with chemotherapy has been gaining in interest. In the next section, the
physicochemical properties of phytochemicals used in this study namely genistein
and curcumin as well as their pharmaceutical formulations will be discussed.
Flavonoids, chemically classified as compounds containing a phenylchromanone
structure (C6-C3-C6) with at least one hydroxyl substituent, are especially
promising candidates for cancer prevention (Yao et al., 2011). Genistein, the
major flavonoid isolated from soybeans, has attracted a great deal attentions as an
anticancer, antioxidant, antiinflammatory and antiproliferative agent (Danciu et al.,
2012; Andrade et al., 2014). Genistein can modify cancer progression by
increasing apoptosis through the inactivation of the Akt signaling pathway. As
seen from Figure 1-17, this pathway activates NF-kB, which transcribes genes
important for cell survival, invasion and metastasis. The inhibition of NF-kB also
partially explains the effects of genistein on cell cycle progression and apoptosis
(Kumi-Diaka et al., 2010; Shukla et al., 2015; Cai et al., 2017).
Genistein, through inhibition of the Akt pathway, has been shown to potentiate
the activity of EGFR-TKIs; for example, erlotinib and gefitinib in NSCLCs.
Consequently, down-regulation of Akt and NF-kB appears to correlate with the
antitumour activity of EGFR-TKIs (Gadgeel et al., 2009; Li et al., 2012a; Li et al.,
2012b). Genistein has therefore been used to concomitantly decrease the toxicity
of chemotherapeutic agents since a lower dose of cytotoxic drug is required when
used in combination.

Chapter 1 Introduction
67
Figure 1-17 Schematic representation of the action of genistein on inhibition of EGFR
signaling (Niero et al., 2014; Shukla et al., 2015)
Genistein or 5,7-dihydroxy-3-(4-hydroxyphenyl)chromen-4-one is a hydrophobic
BCS class II molecule (Chen et al., 2013), having low aqueous solubility and high
permeability as shown in Table 1-4.
Table 1-4 Physicochemical properties of genistein
Molecular structure
Molecular weight 270.24 g/mol
Molecular formula C15H10O5
Log P (octanol/ water) 2.84 (Aditya et al., 2013)
pKa
7.63, 9.67 and 10.83
Aqueous solubility (µg/mL) at pH ≈7 0.9-1.4 (Phan et al., 2013; Cai et al.,
2017)
Chapter 1 Introduction
68
Despite its attractive therapeutic properties, the low aqueous solubility of
genistein limits its potential applications (Kim et al., 2017). Pharmaceutical
technology has thus been employed for the delivery of genistein, using diverse
pharmaceutical formulations to improve its dissolution profile and bioavailability
as shown in Table 1-5.

Chapter 1 Introduction
69
Table 1-5 Formulation studies for genistein
Delivery System Description Treatment Route Study
Lipid-based
nanocarriers
Nanostructured lipid
carriers co-loaded
with genistein and
curcumin
Prostate cancer Oral (Aditya et
al., 2013)
Genistein-loaded
nanoliposomal
formulation
Breast, ovarian
and prostate
cancers
Oral (Phan et
al., 2013)
Genistein-loaded
lipid nanocarriers
Skin cancer Dermal (Andrade
et al.,
2014)
Genistein
incorporated into
nanostructured lipid
carriers coated with
a cationic Eudragit
Precorneal
retention
Ocular (Zhang et
al., 2014b)
Genistein-loaded
solid lipid
nanoparticles
- Oral (Kim et al.,
2017)
Non-lipid based
nanocarriers
Genistein-loaded
pluronic micelles
- Oral (Kwon et
al., 2007)
Folic acid-
conjugated
genistein-loaded
chitosan
nanoparticles
Cervical cancer - (Cai et al.,
2017)
Genistein-conjugated
gold nanoparticles
Lung cancer - (Stolarczyk
et al.,
2017)
Genistein
incorporated into
beta-cyclodextrin
derivatives
Anti-
inflammatory
Topical (Danciu et
al., 2012)
Chapter 1 Introduction
70
Curcumin
Curcumin (diferuloylmethane), a natural compound extracted from the rhizome of
turmeric (Curcuma longa), has been used in a wide range of therapeutic
applications; for example, it has been shown to have antimicrobial, antioxidant,
antiparasitic, antimutagenic and anticancer activity (Anand et al., 2010; Khan and
Mukhtar, 2015; Tsai et al., 2015). In this research, the anticancer activity on non-
small cell lung cancer was the interest. Although the mechanism of action in
NSCLC is still not completely clear (Chen et al., 2016a; Shindikar et al., 2016),
studies have shown that curcumin inhibits cell proliferation and induces cell
apoptosis of human NSCLC through the suppression of the PI3K/Akt pathway
(Jin et al., 2015; Tsai et al., 2015). Curcumin has been reported to significantly
increase the cytotoxicity of erlotinib, thereby enhancing erlotinib-induced
apoptosis, decreasing the expression of EGFR and inhibiting NF-kB signaling
pathway in NSCLC cells (Khan and Mukhtar, 2015). In addition, this molecule
has demonstrated synergistic antitumour activity in NSCLC when used with other
chemotherapeutic agents such as cisplatin and adiponectin. Consequently,
curcumin is one of the plant-based medicines used as an adjuvant agent in the
lung cancer treatment and was chosen for investigation in this study.
Curcumin or (1E, 6E)-1,7-bis (4-hydroxy-3-methoxyphenyl)- 1,6-heptadiene-3,5-
dione is considered a hydrophobic BCS class II drug (Hu et al., 2015),
characterised by low solubility and high permeability (Table 1-6).

Chapter 1 Introduction
71
Table 1-6 Physicochemical properties of curcumin
Molecular structure
Molecular weight 368.39
Molecular formula C21H20O6
Log P 3.29 (Aditya et al., 2013)
pKa
8.5, 10 and 10.5 (Lee et al., 2013)
Aqueous solubility (µg/mL) at
pH 7.4
0.6 (Shin et al., 2016)
Nanotechnology has been employed to produce curcumin delivery systems to
improve the water solubility, absorption rate and oral bioavailability of curcumin
(Table 1-7).
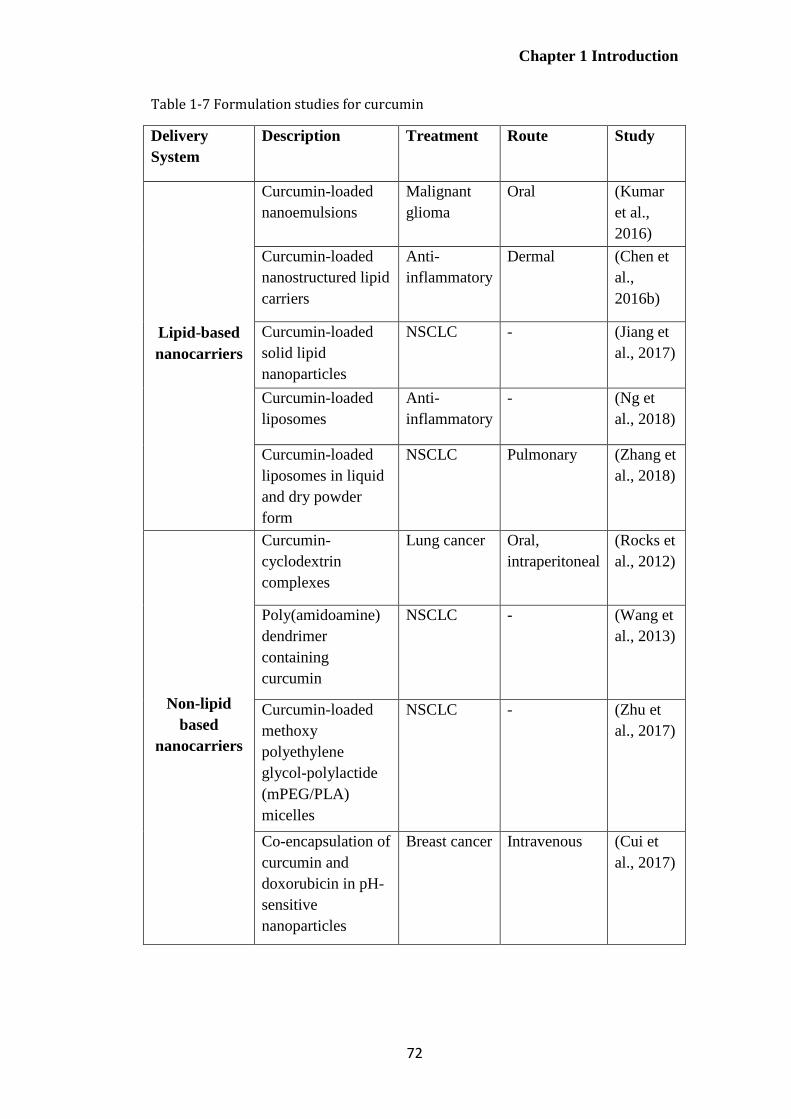
Chapter 1 Introduction
72
Table 1-7 Formulation studies for curcumin
Delivery
System
Description Treatment Route Study
Lipid-based
nanocarriers
Curcumin-loaded
nanoemulsions
Malignant
glioma
Oral (Kumar
et al.,
2016)
Curcumin-loaded
nanostructured lipid
carriers
Anti-
inflammatory
Dermal (Chen et
al.,
2016b)
Curcumin-loaded
solid lipid
nanoparticles
NSCLC - (Jiang et
al., 2017)
Curcumin-loaded
liposomes
Anti-
inflammatory
- (Ng et
al., 2018)
Curcumin-loaded
liposomes in liquid
and dry powder
form
NSCLC Pulmonary (Zhang et
al., 2018)
Non-lipid
based
nanocarriers
Curcumin-
cyclodextrin
complexes
Lung cancer Oral,
intraperitoneal
(Rocks et
al., 2012)
Poly(amidoamine)
dendrimer
containing
curcumin
NSCLC - (Wang et
al., 2013)
Curcumin-loaded
methoxy
polyethylene
glycol-polylactide
(mPEG/PLA)
micelles
NSCLC - (Zhu et
al., 2017)
Co-encapsulation of
curcumin and
doxorubicin in pH-
sensitive
nanoparticles
Breast cancer Intravenous (Cui et
al., 2017)

Chapter 1 Introduction
73
Thesis overview
Erlotinib, genistein and curcumin, all classified as BCS class II drugs, were used
as therapeutic agents in this study. The therapeutic application of the three active
compounds, which may be used in the treatment of non-small cell lung cancer
(NSCLC), is limited due to their poor aqueous solubility. In order to overcome
this, nanocarriers may be employed to improve the water solubility. No study has
previously investigated the nanocarriers co-loaded with erlotinib and genistein for
potential synergistic antitumour activity. Although the co-delivery of curcumin
and genistein has been previously reported, the route of administration and
formulation approach is different from this study. Hence, this research describes
studies to explore a strategy for delivering hydrophobic anticancer drugs using
polymeric micelles, by synthesizing a novel micelle-forming genistein-mPEG
conjugate for the delivery of either erlotinib or curcumin. Liposomes were also
investigated for the co-delivery of erlotinib and genistein by pulmonary route as
an alternative formulation approach. Lipid-based nanocarriers were chosen in this
study since lipid-based nanocarriers administered by pulmonary route have
previously shown high accumulation and long retention time in the lungs
(Garbuzenko et al., 2014).
Nebulised drug delivery has some advantages over pressurised metered-dose
inhalers (pMDIs) and dry powder inhalers (DPIs), in terms of delivering large
doses of drugs in an aqueous vehicle. The nebulised aerosols generated from the
novel lipid-based aerosols were characterised using cascade impactor. An
advantage of Abbreviated Impactor Measurement (AIM), which has been
proposed for the routine quality control of inhaler products as an alternative to full
impactors, is that it employs only 2 or 3 stages, representing coarse and fine
particle fractions. This permits rapid, accurate quantification for low dose
formulations. In this study, the Fast Screening Impactor (FSI), a two-stage
abbreviated impactor with a cut-off diameter of 5 µm between stages was
investigated as an alternative to the Next Generation Impactor (NGI) for in-vitro
studies of nebulised liposomes. This investigation was anticipated to overcome
the analytical quantification problem of drug-loaded liposomes. The properties of
aerosols generated from micelles and liposomes by air-jet and vibrating-mesh

Chapter 1 Introduction
74
nebulisers were studied and compared using the same operating conditions using
the NGI and FSI.
Ultimately, formulation strategies explored in this thesis for co-delivery of
therapeutic agents may overcome some of the problems associated with
hydrophobicity of drug molecules while reducing the use of excipients, and be
suitable for local treatment of NSCLC via nebulisation with potential for
synergistic therapeutic activity. Moreover, the use of an abbreviated apparatus
will hopefully contribute to a simpler and more rapid, accurate and precise
technique for aerosol characterisation of both formulations during product
development, whilst the data will help inform current databases about the
usefulness of AIM for characterisation of inhaler products.
Aims and Objectives
The aim of this study is to investigate new formulation approaches for the co-
delivery of genistein and curcumin, and genistein and erlotinib. Determining the
aerosol properties of the final formulations delivered by air-jet and vibrating-mesh
nebulisers is important for demonstrating future potential therapeutic applications.
To achieve these aims, the study was conducted with the following objectives:
1) To synthesise and characterise a novel genistein-methoxy poly(ethylene
glycol) conjugate
2) To develop and optimise formulations of curcumin and/or erlotinib-loaded
genistein-methoxy poly (ethylene glycol) micelles with potential for
pulmonary delivery
3) To produce, characterise and optimise liposomes co-loaded with erlotinib
and genistein with potential for pulmonary delivery
4) To investigate the FSI as an alternative impactor to the NGI for aerosol
characterisation of nebulised co-loaded liposomes using the same
operating conditions.
5) To investigate the effects of operating parameters on aerosol properties
demonstrated using the FSI:
I. Type of nebulisers (air-jet and vibrating-mesh nebulisers)

Chapter 1 Introduction
75
II. Impactor operating conditions
Impactor temperature (cooled and non-cooled FSI)
Flow rates (15 and 30 L/min)
III. Liposome size reduction methods (probe-sonication and
membrane-extrusion)
Figure 1-18 outlines the flow of the research described in this PhD thesis. The
project started with the synthesis and characterisation of genistein-methoxy poly
(ethylene glycol) conjugate (Chapter 2). This was followed by the preparation of
micellar formulations using this conjugate containing curcumin and/or erlotinib.
The aerosol characteristics of these micellar systems following delivery using air-
jet and vibrating-mesh nebulisers were determined using the NGI (Chapter 3).
Novel erlotinib and genistein co-loaded liposomes were prepared, characterised
and optimised (Chapter 4). The drug-drug and drug-lipid interaction in these
systems were studied using thermal analysis (Chapter 4). The FSI as an alternative
impactor to the NGI was investigated and the aerosol properties of the optimised
co-loaded liposomes size reduced by probe-sonication or extrusion delivered
using air-jet and vibrating-mesh nebulisers were subsequently characterised using
the FSI (Chapter 5).

Chapter 1 Introduction
76
Figure 1-18 Thesis overview describing preparation, characterisation and in vitro studies of optimised micelles and liposomes prepared for pulmonary delivery of genistein, erlotinib and curcumin
Characterisation of genistein-mPEG-
COOH conjugate (Chapter 2)
Nanocarriers for pulmonary
delivery of hydrophobic drugs
Characterisation and optimisation of
erlotinib and genistein co-loaded
liposomes (Chapter 4)
Synthesis of genistein-methoxy poly
(ethylene glycol) carboxyl (genistein-
mPEG-COOH) conjugate (Chapter 2)
Fourier transform infrared spectroscopy
Nuclear magnetic resonance spectroscopy
Mass spectroscopy
Characterisation and optimisation of
erlotinib or curcumin-loaded genistein-
mPEG-COOH polymeric micelles
(Chapter 3)
Laser diffraction
Transmission electron microscopy
High performance liquid
chromatography
High sensitive differential
scanning calorimetry
(Chapter 4)
Aerosol characterisation of nebulised
formulations (Chapter 3 and 5)
Comparison of the performance of the
NGI and FSI (Chapter 5)

Chapter 2 Synthesis of genistein-methoxy poly (ethylene glycol) conjugate
77
Chapter 2 Synthesis of genistein-methoxy
poly (ethylene glycol) conjugate

Chapter 2 Synthesis of genistein-methoxy poly (ethylene glycol) conjugate
78
Introduction
Previous reports have demonstrated that the conjugation of chemotherapeutic
agents; for example, paclitaxel, methotrexate, doxorubicin, camptothecin and
small hydrophobic drug molecules, to water-soluble polymers to form drug–
polymer conjugates, provides a useful method for formulating these hydrophobic
drugs (Qiu et al., 2010). Drug-polymer conjugates provide a potential strategy for
improving the aqueous solubility of hydrophobic drugs, protecting the activity of
drugs from metabolism or deactivation during systemic circulation, reducing the
systemic side effects of potent drugs, and also enhancing passive or active
targeting to the site of a drug’s pharmacological action (Hans et al., 2005;
Khandare and Minko, 2006). The chemical and physical properties of polymers
used in conjugation should be taken into consideration in order to modify and
enhance the pharmacokinetic and bio-distribution profiles compared with
traditional small molecular or macromolecular drugs (Larson and Ghandehari,
2012).
A number of polymers have been studied as hydrophilic drug carriers. Methoxy
poly(ethylene) glycol (mPEG) is one of the most common candidates because it is
hydrophilic, non-immunogenic, biodegradable, biocompatible and non-toxic.
mPEG-drug conjugates have been reported to enhance the aqueous solubility of
water-insoluble drugs, improve the efficacy of therapeutic agents through the
enhanced permeability and retention effect and minimise the systemic side effects
by reducing non-specific cell uptake (Hans et al., 2005; Xie et al., 2009; Banerjee
et al., 2012).
There are a numerous factors; for example, chemical structure, molecular weight,
reactive functional group and steric hindrance that influence the outcome of
conjugation of mPEG with bioactive molecules (Banerjee et al., 2012; Zhang et
al., 2014d). mPEG, with molecular weight 5kDa, has been widely used for
conjugation (Danafar et al., 2017) and consequently was chosen in this study.

Chapter 2 Synthesis of genistein-methoxy poly (ethylene glycol) conjugate
79
In order to synthesize genistein-mPEG conjugate, the terminal hydroxyl group
(-OH) of mPEG was converted to a carboxyl group (-COOH) via oxidation and
was then attached to the –OH group of genistein through esterification.
Aims
To synthesize and characterise a novel amphiphilic polymer that might be
considered as a promising compound for producing carriers for hydrophobic
drugs in further studies, by conjugation of a small hydrophobic drug to a
hydrophilic polymer (genistein-mPEG conjugate) through an ester linkage.
Materials
Genistein (4’,5,7-trihydroxyisoflavone) (GEN, LC Laboratories, USA) and poly
(ethylene glycol) methyl ether with molecular weight 5 kDa, (mPEG, Sigma-
Aldrich, UK) were used as the main materials for the synthesis of the amphiphilic
polymer conjugate. The following reagents and solvents were obtained from
Sigma-Aldrich (UK): erbium (III) trifluoromethanesulfonate 98%, 4-
dimethylaminopyridine (DMAP, 99%), N, N-dicyclohexylcarbodiimide (DCC,
99%), N, N-dimethylformamide anhydrous (DMF, 99.8%), dimethyl sulfoxide
(DMSO, >99.7%, gradient grade for HPLC), anhydrous dichloromethane (DCM,
99.8%), magnesium sulphate (MgSO4, >99 %), triethylamine (TEA, >99.5%),
chloroform (99.8%, analytical grade), methanol (99.9%, HPLC gradient grade)
and ethyl acetate (99.8%). Acetronitrile (HPLC gradient grade) acquired from
Fisher Scientific (UK) and succinic anhydride (SA) supplied by Merck (Germany)
were used as the solvent and the reagent in polymer synthesis. Deionised water
was produced by Purelab® Ultrapure Water Purification Systems (Thermo Fisher
Scientific, UK).
Silica gel 60 (0.040-0.063 mm, 99.5%) purchased from Alfa Aesar (USA) and a
column with Rotaflo™ stopcock (40 mm diameter x 400 mm length) obtained
from Fisher Scientific (UK) were used for the synthesized compound separation.

Chapter 2 Synthesis of genistein-methoxy poly (ethylene glycol) conjugate
80
Deuterated chloroform (CDCl3) and dimethyl sulfoxide-d6 99.9% for 1H NMR
and 13C NMR structural analysis were obtained from Cambridge Isotope
Laboratories (USA).
Methods
Synthesis of methoxypoly (ethylene glycol)-carboxyl (mPEG-COOH)
Carboxylic acid end-group methoxypoly (ethylene glycol) (mPEG-COOH) was
synthesized according to the method previously described (Jeon et al., 2003;
Wang and Hsiue, 2005; Jeong et al., 2008; Xie et al., 2009; Xiang et al., 2011;
Zhang et al., 2014a) with slight modification. Firstly, mPEG 5KDa (10 g, 2
mmol) was dissolved in acetronitrile (20 mL) with magnetic stirring at room
temperature. Meanwhile, succinic anhydride (0.1480 g, 1.4790 mmol) and erbium
trifluoromethanesulfonate (0.0909 g, 0.1479 mmol) as shown in Table 2-1 were
dissolved separately in acetronitrile (10 mL) and added dropwise in the flask of
mPEG solution. Then, the mixture solution was refluxed for 2 h at 85C and the
progress of the chemical reaction monitored by thin layer chromatography (TLC)
eluted with a mixture of mobile phase as described in Section 2.4.3.1.
After the reaction was complete, the solvent was removed by rotary evaporation
(RC 900, Knf Neuberger GmbH, Germany) under vacuum at 60C for 10 min.
The product, by-product, and unreacted reagents in the flask were rinsed with
deionised water and transferred to a separating funnel to extract the product. After
separation, the desired product was washed 3 times with a mixture of ethyl acetate
and deionised water (50:50 %v/v). The separated product in an ethyl acetate layer
was collected into a round-bottomed flask and all traces of water were then
eliminated using magnesium sulphate (MgSO4). The ethyl acetate solution was
afterwards passed through filter paper (110 mm diameter, Whatman®) to remove
all MgSO4 clumps, and the filtrate was subsequently evaporated once by rotary
evaporation at 60C for 5 min. The mPEG-COOH product was then obtained and
dried in a desiccator overnight.

Chapter 2 Synthesis of genistein-methoxy poly (ethylene glycol) conjugate
81
Table 2-1 Components used in mPEG-COOH synthesis
Material Molecular
weight (g/mole)
Molar ratio
mPEG 5K Da 5000 1
Succinic anhydride 100.07 0.7395
Erbium triflouromethanesulfonate
10% mole
614.47 0.07395
Synthesis of genistein-mPEG conjugate
For the mechanism of esterification in the presence of DCC and DMAP, DCC
(dicyclohexylcarbodiimide) initially reacted with mPEG-COOH. This resulted in
an O-acylisourea intermediate. Genistein, which contains 3 –OH groups, was then
added to activate –COOH group to form an ester linkage and yielded the
genistein-mPEG product together with the stable dicyclohexylurea (DCU).
However, DMAP, which is a comparatively stronger nucleophile than genistein,
also reacted with O-acylisourea and yielded a reactive amide or active ester. This
intermediate side product rapidly reacted with genistein and also produced
genistein-mPEG conjugate (Gilles et al., 2015) as shown in Figure 2-1.

Chapter 2 Synthesis of genistein-methoxy poly (ethylene glycol) conjugate
82
Figure 2-1 The reaction scheme for esterification in the presence of DCC and
DMAP to produce the genistein-mPEG conjugate
Development of the genistein-mPEG conjugate synthesis
Genistein-mPEG synthesis was undertaken according to the method previously
described (Jiang and Kuang, 2009; Qiu et al., 2010; Soto-Castro et al., 2010; Yeap
et al., 2012; Cholkar et al., 2014) with slight modification. The synthesis of
genistein-mPEG conjugate was developed by varying two main factors such as
the type of solvent and the composition of genistein and mPEG-COOH in terms
of mole ratio. Anhydrous dichloromethane (DCM), anhydrous dimethylsulfoxide
(DMSO) and anhydrous dimethylformamide (DMF) normally used for
esterification reactions in the presence of DCC and DMAP were investigated
using 1:1 mole ratio of genistein and mPEG-COOH, to obtain the suitable solvent
for this reaction (Jiang and Kuang, 2009; Soto-Castro et al., 2010; Yeap et al.,
2012; Cholkar et al., 2014). Based on the preliminary data (Section 2.5.2.5),
anhydrous DMF was the most suitable solvent and was then required for further
optimisation. The mole ratio of genistein and mPEG-COOH was compared
between 1:1 and 1:3 and the final ratio of 1:3 was chosen for the revised
methodology of the genistein-mPEG conjugate synthesis as described in Section
2.4.2.2.
Genistein mPEG-COOH Genistein-mPEG conjugate
O-acylisourea intermediate DCC mPEG-COOH
DMAP Reactive amide Ester product O-acylisourea

Chapter 2 Synthesis of genistein-methoxy poly (ethylene glycol) conjugate
83
Optimised methodology of the genistein-mPEG conjugate synthesis
Briefly, mPEG-COOH (5 g, 1.0 mmol), DMAP (12.2 mg, 0.1 mmol) and DCC
(247.6 mg, 1.2 mmol) were dissolved in anhydrous DMF (40 mL) with magnetic
stirring for 1 h. Genistein (90 mg, 0.33 mmol) was dissolved in anhydrous DMF
(10 mL) and then added to the previous solution under nitrogen with stirring for
48 h and the progress of the chemical reaction monitored by thin layer
chromatography (TLC) as explained in Section 2.4.3.1. After the reaction was
complete, the solvent was removed under vacuum by rotary evaporation at 60 °C
in a water bath for 20 min and the product was further purified by column
chromatography on a silica gel-packed column (40 mm diameter x 400 mm
length) eluted with chloroform and methanol starting from 100% v/v chloroform
to 80:20 % v/v chloroform: methanol.
Characterisation of the synthesized compound
Thin layer chromatography (TLC)
For mPEG-COOH synthesis, the solvent system for TLC using TLC plates (5x10
cm, coated with silica gel, Merck, USA) was chloroform/ methanol (70:30, %v/v)
and the spray reagent consisted of sulfuric acid (Sigma-Aldrich, UK)/ethanol
(VWR International Ltd., UK) (80:20, % v/v) and succinic vanillin (0.05% w/v,
Sigma-Aldrich, UK).
For genistein-mPEG synthesis, the solvent system for TLC was chloroform/
methanol (90:10, % v/v) using TLC plates explained above.
Fourier transform infrared (FT-IR) spectroscopy
2 mg of mPEG, succinic acid, mPEG-COOH, genistein and genistein-mPEG were
each analysed by a Perkin-Elmer Spectrum 100 FT-IR Spectrometer (Perkin-
Elmer, USA) using a KBr disk for preparation of samples. Data in the
wavenumber range of 400-4,000 cm-1 were collected at a resolution of 4 cm-1 with

Chapter 2 Synthesis of genistein-methoxy poly (ethylene glycol) conjugate
84
the number of scans at 4, and presented using the Perkin-Elmer Express software
(Perkin Elmer, USA).
Nuclear magnetic resonance (NMR) spectroscopy
10 mg samples of mPEG and mPEG-COOH were dissolved in 0.6 mL CDCl3, and
10 mg samples of succinic acid, genistein, and genistein-mPEG were dissolved in
0.6 mL of DMSO-d6. The spectra were obtained using an 500 MHz NMR
spectrometer and data were processed using TopSpinTM software 4.0 (Bruker Ltd.,
UK).
Matrix-Assisted Laser Desorption-Time of Flight (MALDI-TOF)
mass spectrometry
MALDI-TOF mass analysis was performed using a Voyager-DE Pro mass
spectrometer (Applied Biosystem, UK) equipped with a nitrogen laser (337nm, 3-
ns pulse width) and time-delayed extraction ion source. 5mg samples of mPEG-
COOH and genistein-mPEG were dissolved in alpha-cyno-4-hydroxycinnamic
acid. The analysis was measured in positive linear mode using an accelerating
voltage of 25 kV.
Results and discussion
Synthesis of methoxypoly(ethylene glycol)-carboxyl (mPEG-COOH)
TLC
Thin-layer chromatography (TLC) is a rapid analytical technique and commonly
used in synthetic chemistry and pharmaceutical analysis, e.g. for isolating the
impurities of samples, identifying individual components in a given sample, and
monitoring the progress of a reaction (Khale, 2010). Different compounds in the
sample move up a TLC plate by capillary action from its original spot at different
rates due to two main considerations, the differences in their attraction to the
stationary phase normally silica gel and differences in solubility in the mixture of
eluting solvents. The mobile phase, which is a mixture of co-solvents, has less

Chapter 2 Synthesis of genistein-methoxy poly (ethylene glycol) conjugate
85
polarity than silicon oxide (silica) due to the Si-O-H bond at the surface of the
silica gel on the TLC plate. Hence, different compounds are separated due to these
two main factors and reported as the total distance travelled by a component
divided by the distance travelled by solvent from the original point (Rf value)
(Meyers and Meyers, 2001). In general, more polar substances have stronger
interaction with the silica and are adsorbed tightly on to the TLC plate, and this
thus contributes to a lower Rf value compared with less polar components.
The compounds separated using TLC can be identified by several techniques; for
example, physical (individual colour of compound or fluorescence of substance in
short or long wavelength UV light), chemical (visualising agent needed) and
biological (biodetector needed) methods (Pyka, 2014). As mPEG-COOH does not
have any aromatic rings, it would not be directly detected on a TLC plate in UV
light. Therefore, the spray reagent, vanillin in hot sulfuric acid, was prepared to
detect the structure of hydroxyl or carbonyl or polyester compounds. The
mechanism of visualisation can be explained by the electrophilic aromatic
substitution of a phenol group of vanillin in the presence of sulfuric acid, resulting
in the formation of a coloured compound (Johnson et al., 1977). As seen from
Figure 2-2, the spot of the product, mPEG-COOH appeared at a lower position (Rf
value = 0.24) compared with the starting material, mPEG (Rf value = 0.60). This
suggests mPEG-COOH was more polar than mPEG due to the attachment of
carboxylic group, resulting in greater retention at the silica binding sites. TLC
technique was used in this study as a screening tool, the reaction was further
confirmed using FT-IR and NMR (Zhang et al., 2007b).

Chapter 2 Synthesis of genistein-methoxy poly (ethylene glycol) conjugate
86
Figure 2-2 TLC plate of starting materials and product of mPEG-COOH synthesis
FT-IR
mPEG-COOH synthesis was confirmed using FT-IR analysis (Figure 2-3a -2-3c).
The absorption bands of methylene units (-CH2-) and ether links (C-O-C) with
stretching and asymmetrical stretching vibration, which appeared at
approximately 2,880 cm-1 and 1,100 cm-1, respectively, could be observed in
spectra of both mPEG and mPEG-COOH (Zhang et al., 2007b; Castillo et al.,
2014; Gao et al., 2016). Furthermore, the sharp peaks at approximately 1,470, 960
and 840 cm-1 also demonstrated the essential polyethylene oxide backbone of
mPEG and mPEG-COOH as expected (Zhang et al., 2007b; Jeong et al., 2008;
Castillo et al., 2014; Danafar et al., 2017). The FT-IR data for the mPEG-COOH
product exhibited all mPEG bands, whereas the FT-IR spectrum of mPEG did not
show any absorption peaks in the range of 1,750-1,700 cm-1. This indicated the
absence of carbonyl group (C=O) in mPEG (Sant and Nagarsenker, 2011).
The FT-IR spectrum for succinic acid (Figure 2-3b) showed distinctive bands with
scissoring vibration at 1,410 cm-1 and stretching vibration at 1,685 cm-1,
corresponding to the skeleton carbon (-CH2-) and carbonyl group of carboxylic
acid, respectively (Castillo et al., 2014). The characteristic carbonyl peak of
succinic acid disappeared; meanwhile, a new absorption peak was detected at
1,737 cm-1 in mPEG-COOH. This new band, which appeared in three batches of

Chapter 2 Synthesis of genistein-methoxy poly (ethylene glycol) conjugate
87
mPEG-COOH product, indicated the presence of the carbonyl group (C=O) of
carboxylic acid with stretching vibration. Furthermore, a significant shift of 52
cm-1 (from 1,685 to 1,737 cm-1) implied the effect of the carboxylic acid
functional group being introduced to the end-hydroxyl group of mPEG due to
ring-opening of succinic anhydride. The IR data were in agreement with
previously reported values, supporting successful synthesis of the mPEG-COOH
(Zhang et al., 2007b; Zhang et al., 2009; Zhang et al., 2014a).
Two broad peaks for the –OH groups of alcohol and carboxylic acid molecule
were also expected to be present, ranging from 3,550 to 3,200 cm-1 (mPEG) and
3,000 to 2,500 cm-1 (mPEG-COOH), respectively. However, these were not
detected using FT-IR. This might be because the intensity of vibrational
frequencies of the 1 terminal –OH group was comparatively weaker than that of
over 100 repeating units of ethylene oxide in the same IR spectrum for both
polymers. Moreover, a KBr disk might not be translucent, possibly due to water in
the disk and/or poorly dispersed sample. Therefore, the structure of this
synthesized polymer was then further confirmed by 1H- and 13C-NMR.
Figure 2-3 FT-IR of spectra of a) mPEG, b) succinic acid and c) mPEG-COOH
a) mPEG
c) mPEG-COOH
b) succinic acid

Chapter 2 Synthesis of genistein-methoxy poly (ethylene glycol) conjugate
88
NMR
H-NMR
From Figure 2-4a - 2-4b, 1H NMR spectra of mPEG and mPEG-COOH in CDCl3
showed multiple peaks in the range of 3.60-3.67 ppm, corresponding to the
protons of repeating units (–OCH2-CH2O-)n. A single peak at 3.37 ppm was
ascribed to the protons of the terminal methyl group (O-CH3). The characteristic
mPEG-COOH peak at 4.26 ppm was assigned to the methylene protons in mPEG
adjacent to the succinyl group (CH2C(=O)OCH2CH2 ) and the multiple peaks at
2.64 ppm came from the methylene proton of the succinyl group (CH2-CH2-
COOH). A signal at 12.14 ppm in the 1H-NMR spectrum of succinic acid (Figure
2-4c), which represented the protons of –COOH, disappeared in mPEG-COOH.
All these results confirmed the existence of a carboxyl group in mPEG-COOH
due to ring-opening of succinic anhydride upon reaction, and this was in
agreement with the IR data (Section 2.5.1.2).
In order to determine the degree of conversion of hydroxyl group to carboxyl
group, the hydroxyl moiety peak area was measured and directly compared with
the areas of other peaks in the same 1H-NMR spectrum (Dust et al., 1990). In this
study, the integration ratio of peak area of the protons from the terminal mPEG
methyl group (3.37 ppm) to the methylene protons adjacent to succinyl group
(4.26 ppm) was 3:2, indicating the complete conversion of the end-hydroxyl
group of mPEG into carboxyl group with the mole ratio of 1:1 (Zhang et al.,
2007b; Zhang et al., 2009). This result was also in agreement with previously
reported values (Ishii et al., 2005; Zhang et al., 2007b; Jeong et al., 2008; Zhang
et al., 2009; Qiu et al., 2010; Wu et al., 2010; Sant and Nagarsenker, 2011; Du et
al., 2012; Liu et al., 2014a; Zhang et al., 2014a; Gao et al., 2016).

Chapter 2 Synthesis of genistein-methoxy poly (ethylene glycol) conjugate
89
Figure 2-4 H-NMR spectra of a) mPEG, b) mPEG-COOH and c) succinic acid
b)
a)

Chapter 2 Synthesis of genistein-methoxy poly (ethylene glycol) conjugate
90
Figure 2-4 (Cont.) H-NMR spectra of a) mPEG, b) mPEG-COOH and c) succinic acid
C-NMR
As shown in Figure 2-5a, the 13C-NMR spectrum of mPEG exhibited a peak at
59.21 ppm corresponding to the –O-CH3 group, and a distinctive sharp peak
around 70.73 ppm due to repeating units (–OCH2-CH2O-)n. The 13C-NMR
spectrum of mPEG-COOH (Figure 2-5b) had a peak at 28.52 ppm ascribed to -
COOCH2CH2COOH-. A peak, which implied the existence of the carboxyl group
(-COOH), appeared at 170.71 ppm in mPEG-COOH. Furthermore, there was an
obvious shift in the terminal C in mPEG adjacent to –OH group (-CH2OH) from
61.89 to 63.97 after succinic acid was introduced to its molecule. These values
were in agreement with previous reports (Jeong et al., 2008; Zhang et al., 2009).
All these combined results confirmed that a new functional group (-COOH) was
successfully attached to the terminal part of mPEG.
c)
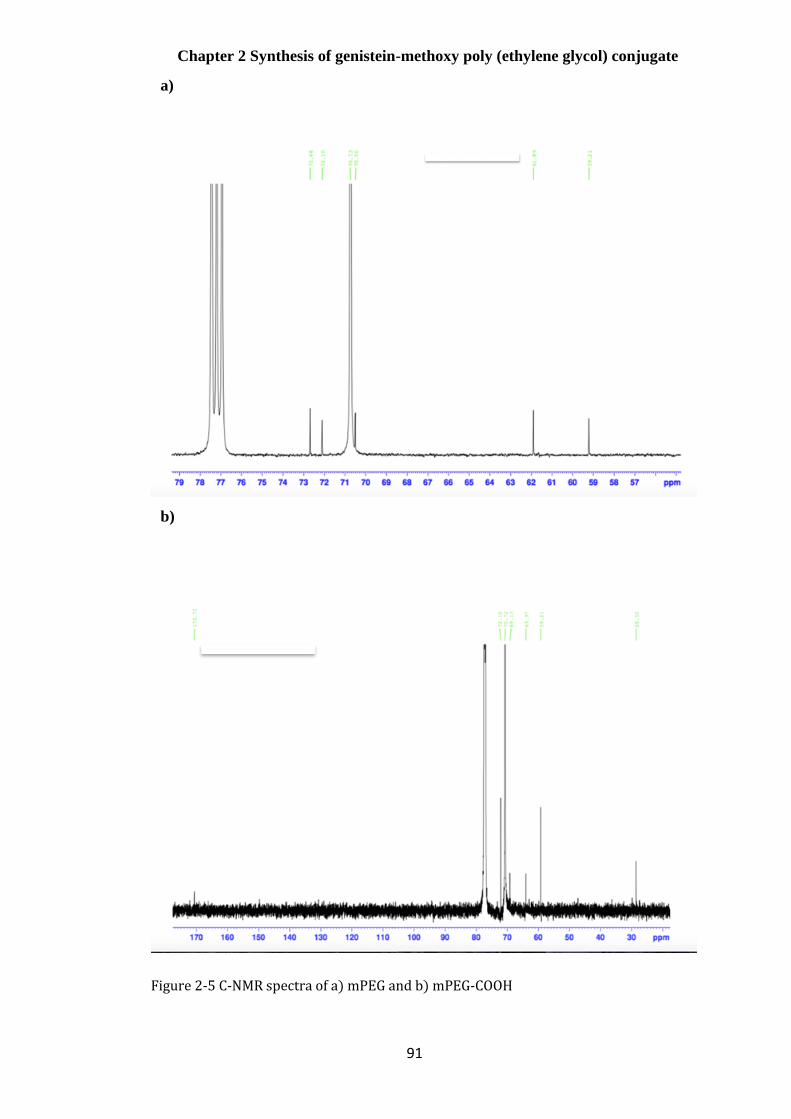
Chapter 2 Synthesis of genistein-methoxy poly (ethylene glycol) conjugate
91
Figure 2-5 C-NMR spectra of a) mPEG and b) mPEG-COOH
a)
b)

Chapter 2 Synthesis of genistein-methoxy poly (ethylene glycol) conjugate
92
Development of the mPEG-COOH synthesis
According to the procedure previously described (Jeon et al., 2003; Wang and
Hsiue, 2005; Jeong et al., 2008; Xie et al., 2009; Xiang et al., 2011; Zhang et al.,
2014a), mPEG-COOH can be synthesized using different methods based on the
same chemical reaction, shown in Figure 2-6. The ring of succinic anhydride is
opened and then introduced into the end- hydroxyl group of mPEG by a
substitution and elimination reaction. The combined results of the NMR analysis
demonstrated the existence of –COOH at the end of the mPEG molecule.
Figure 2-6 Scheme of mPEG-COOH synthesis
In general, acylation of the mPEG with excess succinic anhydride results from the
presence of 4-(dimethylamino)pyridine (DMAP) and triethylamine (TEA) in an
anhydrous non-polar solvent (Jeon et al., 2003; Xie et al., 2009; Chen et al., 2011;
Zhang et al., 2014a; Karolina et al 2016).
1,4 dioxane and pyridine are normally used as anhydrous non-polar solvents.
These are not environmental friendly and are harmful for operators. Therefore,
other solvents, which are more environmental friendly, should be used as
alternatives where possible. Additionally, humidity has to be strictly controlled
during reactions because moisture can interfere with the reaction progress.
Moreover, mPEG-COOH, which is the intermediate product for a further
synthesis step, takes at least 24 h to produce by the conventional synthesis process.
Hence, it would be useful to find other procedures that take a shorter time to
obtain this intermediate product.
Erbium trifluromethanesulfonate (Er(OTf)3 has been reported to be an efficient,
non-toxic, and recyclable catalyst in several organic reactions. This effective,
rapid, and waste-free method yields good results and can be done in a short
+

Chapter 2 Synthesis of genistein-methoxy poly (ethylene glycol) conjugate
93
reaction time with minimal amounts of waste under almost neutral conditions,
with no further requirement for a purification process (Antonio et al., 2004;
Renato et al., 2009; Tran et al., 2015; Herrera Cano et al., 2016). In this study,
Er(OTf)3 was chosen as the catalyst to investigate the transformation of the end-
hydroxyl group of mPEG to carboxylic acid. The reaction mixture was heated at
reflux for 2 h at 85°C in order to reduce the reaction time compared with other
conventional methods (Antonio et al., 2004). Therefore, the use of TEA and 10%
mole DMAP were replaced with 10% mole of erbium trifluoromethanesulfonate
in the studied reaction.
In this revised synthesis, mPEG-COOH was prepared with modifications by using
mPEG, succinic anhydride and erbium trifluromethanesulfonate in the presence of
acetronitrile with the lowest molar ratio (1:0.7350:0.0735) (Xie et al., 2009) to
lessen the unreacted succinic anhydride which would affect the subsequent
reaction step as illustrated in Figure 2-7.
Figure 2-7 The scheme of mPEG synthesis in the presence of erbium trifluoromethanesulfonate and succinic anhydride
Over all, all the results from TLC, FT-IR, 1H-NMR and 13C-NMR demonstrated
that mPEG-COOH was synthesized successfully using this revised methodology.
This product, then, had been transferred to the subsequent reaction step.
Synthesis of genistein-mPEG
TLC
TLC was used to monitor and assess the completion of reactions. From the TLC
plate (Figure 2-8), it can be seen that the spot produced by the product, genistein-
mPEG appeared in three positions compared with all starting materials, mPEG-
COOH, DCC and DMAP. This means that the product of this reaction was a
mixture and required purified to obtain the final product.
O
O
OH
n
OO
O
O
OH
O
n
OO O
+
Er (OTf)3
d-
d+

Chapter 2 Synthesis of genistein-methoxy poly (ethylene glycol) conjugate
94
Figure 2-8 TLC of starting materials and product of genistein-mPEG synthesis
FT-IR
The synthesis of genistein-mPEG (Figure 2-9) was confirmed using FT-IR. The
IR spectrum of genistein (Figure 2-10a) exhibited two broad bands at 3,403 cm-1
and 3,086 cm-1 due to the phenolic –OH and C-H stretching vibration,
respectively. The presence of carbonyl (C=O), C-O and aromatic C=C stretching
bands appeared in the range of 1,660-1,640 cm-1, 1,260-1,000 cm-1 and 1,600-
1,400 cm-1, respectively. IR data for genistein were in agreement with previous
reports (Usha et al., 2005; Crupi et al., 2007; Almahy and Alhassan, 2011; Pandit
and Patravale, 2011). The FT-IR spectrum of mPEG-COOH (Figure 2-10b)
showed characteristic absorption peaks at approximately 1,780 cm-1 corresponding
to C=O, and at 2,880, 1,470, 1,100, 950 and 840 cm-1 ascribed to the essential
polyether backbone as outlined in Section 2.5.1.2.
The absorption peaks of phenolic –OH at 3,403 cm-1 disappeared in the spectrum
for genistein-mPEG conjugate (Figure 2-10c), implying the conjugation of the
phenolic -OH group of genistein (Sojitra et al., 2010). However, the IR spectrum
of mPEG-COOH also did not show any broad bands of –OH of free –COOH in
that region. Thus, the attachment of –OH group of genistein to the –COOH group
of mPEG-COOH could not be confirmed from this absorption peak.

Chapter 2 Synthesis of genistein-methoxy poly (ethylene glycol) conjugate
95
Although most of the characteristic bands of genistein-mPEG conjugate (Figure
2-10c) were almost the same as those of mPEG-COOH (Figure 2-10b), there were
two new absorption bands at 1,654 cm-1 and in the region 1,600-1,400 cm-1. These
two bands, which were characteristic of genistein, indicated the existence of a
C=O group and the attachment of the C=C aromatic ring of genistein to mPEG-
COOH upon an esterification reaction. However, the intensity of the IR
absorption of these two bands was weaker than those for genistein. This might be
because there was less genistein in the drug-polymer conjugate compared with a
raw material of genistein. Also, the stronger absorption of mPEG-COOH could
comparatively decrease the signal of genistein in the conjugate due to numerous
repeating units of ethylene oxide.
Many peaks appeared in the range 1,500 – 800 cm-1 in the IR spectra of genistein
(Figure 2-10a) and mPEG-COOH (Figure 2.10b). This would be likely to lead to
either an overlap or an elimination of these functional vibrations merging into
boarder bands and decreased signals for genistein-mPEG conjugate, as can be
seen in the case of methotrexate in methotrexate-PEG-PAMAM conjugate
(Noorzidah et al., 2012) and naproxen conjugated mPEG-PCL (Karami et al.,
2016).
All these bands in FT-IR spectrum, which showed the characteristic mPEG-
COOH and genistein bands together with a new peak of C=O, provide evidence of
the successful conjugation of genistein to mPEG-COOH polymer. However, 1H-
NMR was also employed further to confirm the structure of the final product of
the synthesis.
Figure 2-9 The structure of genistein-mPEG
OO
O
O
O
O
O
O
OH
HO
H
n

Chapter 2 Synthesis of genistein-methoxy poly (ethylene glycol) conjugate
96
Figure 2-10 FT-IR spectra of a) genistein, b) mPEG-COOH and c) genistein-mPEG
NMR
H-NMR
The 1H NMR spectrum of the genistein-mPEG conjugate in DMSOd6 showed a
singlet peak at 3.24 ppm due to the –O-CH3 group and multiple peaks in the range
of 3.41-3.43, 3.57-3.59 and 3.63-3.65 ppm attributed to the CH2O unit of the
mPEG-COOH molecule (Figure 2.11a -2.11b). The poly (ethylene) oxide
repeating units (–OCH2-CH2O-)n of mPEG-COOH produced multiple bands
around 3.50 ppm. The peak in the region 4.09-4.11 ppm was attributed to 2H from
the CH2C(=O)OCH2CH2 group of the mPEG-COOH molecule.
Additionally, the characteristic peaks at 6.21, 6.37 and 8.31 ppm were due to 1H
on the aromatic ring and the duplex peaks between 6.81-6.83 ppm and 7.36-7.38
were due to 2H on the benzene ring of genistein (Figure 2-12a - 2.12b). There
were 2 singlet peaks at 9.59 and 12.95 ppm presenting the –OH groups of the
genistein molecule. 1H-NMR results were in agreement with previous reports for
genistein molecule (Hassan and Nafisa, 2011; Pandit and Patravale, 2011;
Stolarczyk et al., 2017).
a) genistein
b) mPEG-COOH
c) genistein-mPEG- conjugate

Chapter 2 Synthesis of genistein-methoxy poly (ethylene glycol) conjugate
97
When the NMR signals of genistein and genistein conjugate were compared
(Figure 2-12a- 2-12b), there were slight chemical shifts corresponding to 1H and
2H on the benzene rings in the range of 6.21-8.32 ppm. Also, the characteristic –
OH peak on the phenol ring at 10.87 ppm was absent in the spectrum of the
conjugate, confirming the formation of the chemical bond. In addition, the
integration ratio of peak area of the protons from the terminal methyl group of
mPEG-COOH (3.24 ppm) to the protons from the hydroxyl group of genistein
(12.95 ppm) was 3:1, indicating the complete formation of an ester linkage
between genistein and mPEG-COOH. These findings allow the conclusion that
genistein was successfully conjugated with mPEG-COOH with a mole ratio of 1:1
using 1H-NMR analysis.

Chapter 2 Synthesis of genistein-methoxy poly (ethylene glycol) conjugate
98
Figure 2-11 H-NMR of a) genistein-mPEG synthesis and b) mPEG-COOH component of genistein-mPEG conjugate
a)
b)

Chapter 2 Synthesis of genistein-methoxy poly (ethylene glycol) conjugate
99
Figure 2-12 H-NMR of a) genistein component of genistein-mPEG conjugate and b)
genistein
a)
b)

Chapter 2 Synthesis of genistein-methoxy poly (ethylene glycol) conjugate
100
Mass spectroscopy
MALDI TOF analysis is one of the most useful techniques to identify molecules
which have molecular weights lower than 10 KDa and for polymer analysis,
allowing determination of chemical structure by analyzing the mass and the
charge of ions (Riebeseel et al., 2002; Qiu et al., 2010). In this research, based on
the molecular weight of the starting materials, the average molecular weight of
genistein-mPEG conjugate was expected to be in the range 5,200-5,400 Da.
MALDI TOF analysis showed a shift in the average mass distribution of the drug-
polymer to the higher masses compared with mPEG-COOH, from 5,004.25 to
5,276.30 Da (Figure 2-13a- 2-13b). The mass distribution shift of 272.05 Da,
which was very close to the reported molecular weight of genistein (270.24 Da),
indicated that one mPEG-COOH molecule carried exactly one genistein molecule.
Thus, MALDI TOF analysis can reflect the degree of ligand loading as report
previously (Ajazuddin et al., 2013; Heath et al., 2016). All the combined results
from TLC, FT-IR, NMR and mass spectrometry have demonstrated that the
conjugation of genistein and mPEG-COOH was successful with a mole ratio of
1:1.

Chapter 2 Synthesis of genistein-methoxy poly (ethylene glycol) conjugate
101
Figure 2-13 Mass spectra of a) mPEG-COOH and b) genistein-mPEG-
b.) genistein-mPEG-COOH
%Intensity
Mass(m/z)
5004.25
b)
5276.3
%In
ten
sit
y
Mass (m/z)
a)
Chapter 2 Synthesis of genistein-methoxy poly (ethylene glycol) conjugate
102
Development of the genistein-mPEG conjugate synthesis
For anhydrous DCM, mPEG-COOH, DCC and DMAP could be dissolved freely.
However, genistein is sparingly soluble in this solvent, suggesting that anhydrous
DCM might not be a suitable solvent in this case.
Anhydrous DMSO, all reagents were freely soluble, and the solution was clear
before purifying the product. The boiling point of DMSO is 180°C. It, thus,
cannot be removed by rotary evaporation, even when using very low pressure,
indicating that this solvent was not suitable and practical for the synthesis of this
conjugate. Therefore, anhydrous DMF was the next solvent investigated.
Anhydrous DMF was chosen for this reaction for two main reasons. First, all
reagents dissolved freely, except mPEG-COOH, which needed heat to facilitate
dissolution. Second, the boiling point of DMF is lower than DMSO and therefore,
it was easier and more convenient to remove DMF by rotary evaporation.
Therefore, DMF was used for the further step to obtain the optimal mole ratio of
genistein and mPEG-COOH.
In terms of the molar ratio between genistein and mPEG-COOH, a ratio of 1:1 for
acidic and hydroxyl compound is usually employed (Liu et al., 2014a). Initially,
genistein and mPEG-COOH in the ratio of 1:1 was investigated, with TLC used to
monitor the progress of the reaction. Genistein attached to at least one mPEG-
COOH molecule was aimed in this study. However, there was a spot for genistein,
indicating that not all of genistein molecules were incorporated into mPEG-
COOH and the amount of drug used was excessive at this ratio. Due to the fact
that genistein contains three hydroxyl groups (–OH) and each group can possibly
carry one mPEG-COOH molecule through an ester bond, this factor may result in
an insufficient quantity of mPEG-COOH in the reaction. These observations
consequently led to a decrease in molar ratio of genistein and mPEG-COOH and
1:3 mole ratio of drug and polymer was subsequently further investigated.
1:1 and 1:3 ratios of genistein and mPEG-COOH were compared by the size of
the genistein spot on the TLC plate. The larger the spot, the more incomplete the

Chapter 2 Synthesis of genistein-methoxy poly (ethylene glycol) conjugate
103
reaction was. From the TLC plate, both ratios showed the spot of genistein,
indicating there was still genistein residue and the reaction was incomplete.
Increasing amount of mPEG-COOH was consequently suggested for further
optimisation. This could be because mPEG-COOH in the first step had not yet
been purified and possibly still contained a mixture of unreacted mPEG.
Therefore, adding a higher amount of mPEG-COOH or reducing the mole ratio of
genistein and mPEG-COOH in further studies was expected to be one of the
solutions to compensate for the actual required amount of mPEG-COOH,
minimise an excessive of genistein in this reaction and improve a yield of 43.7%.
Conclusion
A novel amphiphilic genistein-mPEG conjugate was synthesized via two main
reaction steps: (1) the terminal hydroxyl group of mPEG was converted into a
carboxylic group by reacting with succinic anhydride in the presence of erbium
trifluoromethanesulfonate; (2) the end-carboxyl group of mPEG-COOH was
reacted with hydroxyl group of genistein by esterification condensation with 1:3
mole ratio of genistein and mPEG-COOH through an ester linkage in the presence
of DCC and DMAP.
The production of this drug-polymer conjugate obtained as a light yellow powder,
was confirmed using TLC, FT-IR, 1H-NMR and mass spectrometry.
Consequently, this compound was then studied further for erlotinib, curcumin and
other hydrophobic drugs as new nanocarriers as outlined in Chapter 3.

Chapter 3 Hydrophobic drug-loaded genistein-mPEG micelles
104
Chapter 3 Hydrophobic drug-loaded
genistein-mPEG micelles

Chapter 3 Hydrophobic drug-loaded genistein-mPEG micelles
105
Introduction
The bioavailability of hydrophobic drugs used in the treatment of non-small-cell
lung cancer (NSCLC) is limited by their aqueous solubility. Erlotinib has been
extensively studied in patients with NSCLC, though problems with toxicity,
stability and sub-therapeutic drug levels remain (Wang et al., 2012; Truong et al.,
2016). Curcumin, a hydrophobic polyphenol extracted from Curcuma longa, has
several pharmacological applications including for the treatment of NSCLC
(Aditya et al., 2013; Tsai et al., 2015). Genistein, the major isoflavone isolated
from soybeans, has attracted a great deal of attention as a chemo-preventive agent
and has also shown synergistic activity with erlotinib in three separate NSCLC
cell lines (Gadgeel et al., 2009; Tang et al., 2011). Genistein and curcumin, are
both commonly used as major ingredients in Asian foods, and have been
previously studied in combination for their potentiation effects including anti-
cancer activity (Aditya et al., 2013). Therefore, combinations of a herbal
substance and a cytotoxic drug (genistein+ erlotinib) and of two herbal substances
(genistein+curcumin) were investigated in this study.
The therapeutic applications of these three compounds (all BCS class II; poorly
water- soluble but highly permeable) are limited due to their low aqueous
solubility (Chen et al., 2013; Hu et al., 2015; Yang et al., 2017b), consequently
formulation approaches have been investigated to overcome these problems to
enhance their therapeutic applications.
The treatment of lung cancer is impeded due to systemic side effects associated
with current oral and injected therapies and sub-therapeutic levels of drugs at the
target site. Colloidal drug delivery systems; for example, liposomes, polymeric
nanoparticles and micelles, have been used as drug carriers for pulmonary
delivery to improve the solubility of hydrophobic drugs, prolong their circulation
time and reduce drug toxicity (Yang et al., 2015). In this chapter, the amphiphilic
drug-polymer conjugate (genistein-mPEG) described in Chapter 2 will be further
assessed to determine whether it forms self-assembled polymeric micelles suitable
for the delivery of erlotinib or curcumin by the pulmonary route. Polymeric
micelles incorporating either erlotinib or curcumin were prepared and

Chapter 3 Hydrophobic drug-loaded genistein-mPEG micelles
106
characterised for drug entrapment to obtain the optimal drug/polymer mass ratio
and to study the effect of physicochemical properties such as the partition
coefficient (log P), water solubility, melting point, molecular structure and
molecular weight on the properties of the polymeric micelles formed.
Nebulised drug delivery has the advantages of delivering large doses of drugs and
nano-sized delivery systems with minimal processing compared to pressurised
metered-dose inhalers (pMDIs) and dry powder inhalers (DPIs). Therefore, the
aerosol properties of optimised formulation delivered by two nebuliser types (air-
jet and vibrating-mesh nebulisers) were determined using the Next Generation
Impactor (NGI).
Aims
1. To measure the critical micelle concentration (CMC) of genistein-mPEG
conjugate using dynamic light scattering (DLS) analysis
2. To study the incorporation of the hydrophobic drugs, erlotinib and curcumin,
into genistein-mPEG polymeric micelles
3. To characterise and optimise curcumin-loaded genistein-mPEG polymeric
micelles for potential delivery to the lung
4. To assess the aerodynamic characteristics of nebulised micelles delivered by
air-jet and vibrating-mesh nebulisers using the Next Generation Impactor (NGI)
Materials
Erlotinib 99% (LC Laboratories, USA) and curcumin 95% (Alfa Aesar, USA)
were used as hydrophobic drugs for solubilisation in genistein-mPEG polymeric
micelles. Methanol (99.9%, HPLC gradient grade), absolute ethanol (99.8%,
analytical grade) and HPLC grade water purchased from Sigma Aldrich (Poole,
UK) were used as solvents in the preparation of formulations.

Chapter 3 Hydrophobic drug-loaded genistein-mPEG micelles
107
The following reagents and solvents obtained from Sigma Aldrich (Poole, UK):
methanol (99.9%, HPLC gradient grade), dimethyl sulfoxide (DMSO, >99.7%,
HPLC gradient grade), acetronitrile (ACN, 99.9%, HPLC gradient grade), HPLC
grade water and trifluoroacetic acid (TFA, >99.0%) were used for the quantitative
HPLC determination of curcumin and erlotinib.
Methods
High performance liquid chromatography (HPLC) methods for assay
of erlotinib and curcumin
Chromatographic conditions for HPLC analysis of erlotinib
The analysis was conducted using a high performance liquid chromatography
(HPLC) system equipped with an auto sampler and UV/Vis detector (Agilent
1100 Series, USA). A Synergi 4 µm Polar-RP 80 ºA HPLC column (250 x 4.6
mm x 4 µm) was used as the stationary phase for drug separation.
For erlotinib, isocratic elution was carried out with the mobile phase comprising a
mixture of ACN and 0.1% v/v TFA in HPLC grade water (50:50 %v/v). The
eluents were degassed before pumping through the column at a flow rate of 1
mL/min. The column temperature was maintained at 25 °C and the sample
injection volume was 10 µL, with a run time of 10 min. The UV wavelength was
set at 246 nm throughout the entire experiment. To determine the quantity of
erlotinib in the genistein-mPEG micelles, it was assayed using HPLC
chromatographic parameters as present in Table 3-1. The validation of the high
performance liquid chromatography (HPLC method) for erlotinib according to
ICH Q2 (ICH Guideline, 2005) will be described in Section 3.4.1.5.

Chapter 3 Hydrophobic drug-loaded genistein-mPEG micelles
108
Table 3-1 HPLC chromatographic conditions for assay of erlotinib
HPLC parameters
Injection volume (µL) 10
UV/Vis detector wavelength (nm) 246
Mobile phase (ACN: 0.1% v/v TFA in HPLC grade water) 50:50
Column temperature (°C) 25
Flow rate (mL/min) 1
Run time (min) 10
Chromatographic conditions for HPLC analysis of curcumin
The HPLC method for assay of curcumin was developed and previously validated
in our laboratory (Merchant, 2017). HPLC chromatographic parameters such as
composition of the mobile phase, flow rate of the eluents and sample injection
volume were the same as those used in the erlotinib HPLC assay. However, the
column temperature was set at 40ºC and the UV wavelength was fixed at 420 nm,
with the run time was 15 min period.
To determine the content of curcumin in the genistein-mPEG polymeric micelles,
the HPLC conditions shown in Table 3-2 were employed.

Chapter 3 Hydrophobic drug-loaded genistein-mPEG micelles
109
Table 3-2 HPLC chromatographic conditions for assay of curcumin
HPLC parameters
Injection volume (µL) 10
UV/Vis detector wavelength (nm) 420
Mobile phase (ACN: 0.1% v/v TFA in HPLC grade water) 50:50
Column temperature (°C) 40
Flow rate (mL/min) 1
Run time (min) 15
Preparation of HPLC calibration curve for erlotinib
A standard stock solution of erlotinib 1000 g/mL was prepared by dissolving 10
mg of erlotinib in 5 mL of DMSO in a 10 mL volumetric flask. The sample was
bath-sonicated for a few min and the volume was made up to the final volume of
10 mL. To study the linearity, serial dilutions of the stock solution were made in
the range of 1- 70 g/mL; 1, 2, 3, 4, 5, 10, 20, 30, 40, 50, 60 and 70 g/mL.
Preparation of HPLC calibration curve for curcumin
A standard stock solution of curcumin 1000 g/mL was prepared by dissolving 25
mg of curcumin in 20 mL of methanol in a 25 mL volumetric flask. The sample
was subjected to bath sonication and diluted with the same solvent to the final
volume of 25 mL. Serial dilutions of stock solution were prepared in the range of
3- 50 g/mL; 3, 4, 5, 10, 20, 30, 40 and 50 g/mL in order to study the linearity.
Calibration curves for erlotinib and curcumin were obtained by plotting peak area
on the Y-axis against concentration of assay solution on the X-axis.

Chapter 3 Hydrophobic drug-loaded genistein-mPEG micelles
110
Analytical method validation of erlotinib
The HPLC method for erlotinib was validated for linearity, precision, accuracy,
limit of detection and limit of quantification following the International
Conference on Harmonisation (ICH Q2) guidelines.
3.4.1.5.1 Linearity
Linearity in this study was performed by taking four samples of all serial dilutions
of 1, 2, 3, 4, 5, 10, 20, 30, 40, 50, 60, 70 g/ mL from the stock solution and then
injecting 10 L of each concentration into the HPLC chromatographic system and
recording the response. The degree of linearity was then determined by
calculating the correlation coefficient. The slope, intercept and correlation
coefficient of erlotinib were determined from the equation describing the response.
3.4.1.5.2 Precision
Precision is an expression of the closeness of individual measurement to each
other or the degree of scatter. In this study, two parameters; namely the inter-day
and intraday precisions were assessed. Intraday precision was performed by
injecting three concentrations (8, 35 and 55 g/mL) in triplicate per concentration
onto the chromatographic system on the same day. Meanwhile, the inter-day
precision was determined with those concentrations on three consecutive days.
The repeatability study was undertaken by injecting the chosen concentration of
35 µg/mL 9 times to obtain the relative standard deviation (%RSD) calculated
using equation Eq.3-1.
𝑃𝑟𝑒𝑐𝑖𝑠𝑖𝑜𝑛 (%𝑅𝑆𝐷) = 𝑆𝑡𝑎𝑛𝑑𝑎𝑟𝑑 𝑑𝑒𝑣𝑖𝑎𝑡𝑖𝑜𝑛
𝑀𝑒𝑎𝑛 𝑣𝑎𝑙𝑢𝑒 x 100 Eq. 3-1
where; %RSD- percent relative standard deviation
3.4.1.5.3 Accuracy
Accuracy measures the closeness of agreement between the actual value and the
value found. The accuracy study was determined by the recovery method, using a
series of concentrations between 3 and 70 μg/mL for erlotinib. This analysis was

Chapter 3 Hydrophobic drug-loaded genistein-mPEG micelles
111
performed in triplicate for the quantification of erlotinib. Then, the percentage
recovery was calculated following equation Eq. 3-2.
Accuracy (%RE) =100 – (𝑅𝑒𝑓𝑒𝑟𝑒𝑛𝑐𝑒 𝑣𝑎𝑙𝑢𝑒−𝑚𝑒𝑎𝑠𝑢𝑟𝑒𝑑 𝑣𝑎𝑙𝑢𝑒)
𝑅𝑒𝑓𝑒𝑟𝑒𝑛𝑐𝑒 𝑣𝑎𝑙𝑢𝑒 x100 Eq. 3- 2
where; %RE- relative error
3.4.1.5.4 Limit of detection
The limit of detection (LOD) is defined as the lowest concentration of an analyte
that can be detected under the prescribed conditions, but not quantified. It can be
calculated using the following equation Eq. 3-3 according to ICH guidelines:
𝐿𝑂𝐷 = 3.3 𝜎
𝑆 Eq. 3- 3
where; σ = the standard deviation of the response
S = the slope of the calibration curve estimated from calibration curve
3.4.1.5.5 Limit of quantification
The limit of quantification (LOQ) is the lowest concentration of substance in a
sample that can be determined with acceptable precision and accuracy under the
stated operational conditions of the method. It can be calculated using the
following equation Eq. 3-4 according to ICH guidelines:
𝐿𝑂𝑄 = 10 𝜎
𝑆 Eq. 3- 4
Critical micelle concentration of genistein-mPEG conjugate
A stock solution of polymeric micelles was prepared by the thin-film hydration
method. 50 mg of genistein-mPEG was dissolved in 20 mL of methanol in a 250
mL round-bottomed flask and then a rotary evaporator (RC 900, Knf Neuberger
GmbH, Germany) was used to remove the solvent under low pressure at 150 bars
for 20 min at 70 ºC, with a rotation speed of 150 rpm to produce a thin film of
polymer. The resultant film was flushed with nitrogen gas to remove residual

Chapter 3 Hydrophobic drug-loaded genistein-mPEG micelles
112
solvent and then hydrated with 5 mL of HPLC grade water with vigorous hand-
shaking and rotated on the rotary evaporator at 250 rpm for 10 min at 60 ºC in a
water bath to obtain a micellar solution of 10 mg/mL genistein-mPEG. To
determine the critical micelle concentration (CMC) of the conjugate, serial
dilutions of the stock solution were made in the range of 10-0.078 mg/mL; 10, 5,
2.5, 1.25, 0.625, 0.3125, 0.156, 0.078 mg/mL.
The CMC was determined from the linear relationship between the intensity of
scattered light and concentration (Topel et al., 2013), using the Malvern Nano ZS
Zetasizer (Malvern Instruments Ltd, UK) containing a 4mW He-Ne laser,
operating at 633 nm. 1.0 mL of each diluted solution was placed without further
dilution into the zeta potential DTS1070 folded capillary cell (Malvern, UK), and
light scattering measured at 25°C by non-invasive back scatter (NIBS) optics, at
an angle of 173º, for high sensitivity and good quality of signal.
The data were plotted as scattered light intensity (the derived count rate in kilo
counts per second, kcps) on the Y-axis against concentration of genistein-mPEG
conjugate in HPLC grade water (in a logarithmic scale) on the X-axis. The
intersection of two linearly extrapolated lines yielded the CMC value of genistein-
mPEG conjugate in mg/mL.
Preparation of drug-loaded genistein-mPEG polymeric micelles
Preparation of erlotinib-loaded genistein-mPEG polymeric micelles
A stock solution of erlotinib (1.25 mg/mL) was prepared in a 28 mL glass vial by
dissolving 25 mg of erlotinib in 20 mL of absolute ethanol. Erlotinib-loaded
genistein-mPEG polymeric micelles were prepared by the thin-film hydration
method as shown in Figure 3-1.
2 mL of stock solution was added to 50 mg of genistein-mPEG dissolved in 20
mL of absolute ethanol in a 250 mL round-bottomed flask. The mixture was
subjected to bath sonication (Ultrawave U95 Ultrasonic Cleaner, Ultrawave
Precision Ultrasonic Cleaning Equipment, UK) to ensure the complete dissolution

Chapter 3 Hydrophobic drug-loaded genistein-mPEG micelles
113
of drug and polymer, and solvent was subsequently removed by rotary
evaporation using the conditions described in Section 3.4.2. The resultant film
was flushed with nitrogen and then hydrated with 10 mL of HPLC grade water to
form polymeric micelles having polymer concentration of 5 mg/mL. Freshly
prepared micelles were bath-sonicated for a few minutes to aid dispersion. Then,
non-incorporated drug was removed by passing once through a 0.45 μm cellulose
acetate syringe filter membrane (Merck Millipore Ltd., UK), to give a filtrate of a
drug-loaded micellar solution (Moazeni et al., 2012).
Empty (drug-free) micelles were also prepared using the same method in the
absence of drug for comparative purposes to study the effect of drug incorporation
on the properties of the polymeric micelles.
All formulations were characterised (Section 3.4.4) for mean hydrodynamic
diameter, size distribution (polydispersity index, PDI), zeta potential and drug
entrapment (entrapment efficiency and drug loading). The data are presented as
mean values± standard deviation for triplicate experiments using three different
batches.
Figure 3-1 Preparation of erlotinib-loaded genistein-mPEG micelles
OO
HOO
OHO
curcumin
1) Erlotinib solution + 50 mg of
conjugate in absolute ethanol was
evaporated using a rotary evaporator
2) The thin film was hydrated
with 10 mL of HPLC water with
vigorous hand-shaking
3) The solution was rotated
on the rotary evaporator to
yield a micellar solution
4) Micellar dispersion was bath-
sonicated for few min to aid
dispersion
5) Non-incorporated erlotinib
was removed by filtration to
obtain drug-loaded micelles

Chapter 3 Hydrophobic drug-loaded genistein-mPEG micelles
114
Preparation of curcumin-loaded genistein-mPEG polymeric micelles
A stock solution of curcumin (1.25 mg/mL) was prepared in a 28 mL glass vial by
dissolving 25 mg of curcumin in 20 mL of methanol. Curcumin-loaded genistein-
mPEG polymeric micelles were prepared by the thin-film hydration method under
the operating conditions outlined in Section 3.4.3.1.
Characterisation of micellar formulations
Particle size distribution
The hydrodynamic diameter (expressed as Z-average value) and the particle size
distribution (polydispersity index, PDI) were measured using the Malvern Nano
ZS Zetasizer (Malvern Instruments Ltd, UK) by dynamic light scattering (DLS).
1.0 mL of drug-loaded micelles was placed undiluted into the zeta potential
DTS1070 folded capillary cell (Malvern Instrument Ltd, UK), and then the
hydrodynamic diameter and the size distribution of micelles undergoing Brownian
motion within the aqueous dispersion were determined at 25°C in triplicate.
A PDI value < 0.1 indicates a monodispersed sample, < 0.3 is typically considered
a relatively monodispersed system, whereas > 0.7 is determined as a
polydispersed system (ISO-22412, 2008).
Surface charge of empty and erlotinib or curcumin-loaded genistein-
mPEG polymeric micelles
For zeta potential measurements, 1.0 mL of hydrophobic drug-loaded polymeric
micelles and empty micelles was measured using the Malvern Nano ZS Zetasizer
and zeta potential determined based on electrophoretic mobility using the
Helmholtz- Smoluchowski equation.

Chapter 3 Hydrophobic drug-loaded genistein-mPEG micelles
115
Drug -loading and entrapment efficiency
The content of erlotinib in micelle formulations was determined using HPLC. 1
mL of micelle solutions was diluted with DMSO to a final volume of 10 mL prior
to quantification using the HPLC conditions shown in Table 3-1.
For curcumin, 1 mL of formulations was diluted with methanol to a final volume
of 10 mL prior to determination by the HPLC chromatographic parameters
presented in Table 3-2.
The entrapment efficiency (%EE) and drug loading (%DL) were calculated using
the following equations:
Encapsulation efficiency (%EE) = mass of drug in micelles
mass of drug available for encapsulation × 100 Eq. 3-5
Drug loading (%DL) = mass of drug in micelles
mass of polymer and drug × 100 Eq. 3-6
Transmission electron microscopy
The morphology and aggregation behaviour of empty and curcumin-loaded
genistein-mPEG micelles were observed using a transmission electron microscope
(TEM; Philips Electron Optics BV, Netherlands). To prepare the samples for
TEM, a drop of micelle solution was placed on a copper grid and the excess fluid
removed with filter paper. The sample was negatively stained with a drop of
uranyl acetate (1%, w/v), and left in place 2 min. The sample was then dried under
ambient conditions prior to loading into the TEM.
Optimisation of curcumin-loaded genistein-mPEG micelles
The incorporation of curcumin into genistein-mPEG polymeric micelles was
varied to identify the optimal drug/polymer concentration (as % w/w). To prepare
different initial concentrations of curcumin-loaded micelles (2.5%, 5%, 10% and
20% w/w drug in polymer); 1, 2, 4 and 8 mL of stock solution of curcumin (1.25
mg/mL) were directly pipetted into 50 mg of genistein-mPEG dissolved in 20 mL
of methanol. The method for preparing polymeric micelles having polymer

Chapter 3 Hydrophobic drug-loaded genistein-mPEG micelles
116
concentration of 5 mg/mL was as described in Sections 3.4.2 and 3.4.3. The final
preparations were characterised for mean hydrodynamic diameter and
polydispersity index (Section 3.4.4.1), zeta potential (Section 3.4.4.2) and drug
entrapment (Section 3.4.4.3) in each experiment making three independent
measurements.
Mass output and time to dryness for various fill volumes delivered
from air-jet and vibrating-mesh nebulisers
2, 4 and 8 mL of HPLC grade water were directly pipetted into a pre-weighed air-
jet nebuliser (Pari LC® Sprint Reusable nebuliser, PARI Medical Ltd, UK). The
compressor (Pari TurboBoy, PARI Medical Ltd, UK) produced a medium flow
rate of 4.0-6.0 L/min through the air-jet nebuliser reservoir (Kendrick et al., 1997;
Dennis et al., 2008). Fluid was nebulised to dryness, with hand tapping of the
nebuliser to maximise the mass output.
For the vibrating-mesh nebuliser (Pari Velox®, PARI Medical Ltd, UK), 2, 4 and
6 mL of HPLC water were placed in the reservoir and nebulisation was
commenced and continued to dryness. The differing fill volumes of water for
these two devices were based on their minimum and maximum fill volumes.
The nebulisation time to dryness (min) for both nebulisers was recorded after
aerosol generation ceased completely. After that, the nebuliser was weighed to
determine the weight or mass of residual volume. Aerosol mass output (%) was
calculated for the different fill volumes using Equation 3-7.
Aerosol mass output= Weight difference of nebuliser before and after nebulisation
Weight of fluid placed into the nebuliser reservoir x100% Eq. 3-7
Comparison of aerosol properties of nebulised curcumin micelles
using the Next Generation Impactor (NGI)
The NGI (Copley Scientific, UK) was set up according to the requirements of
European Pharmacopoeia (Ph. Eur. 9.0, 2017, Section 2.9.44 Preparations for
nebulization characterization), after cooling the impactor at 2-8ºC for at least 90

Chapter 3 Hydrophobic drug-loaded genistein-mPEG micelles
117
min to prevent water evaporation during use. The air-jet and vibrating-mesh
nebulisers with mouthpiece adapter were connected to the induction port, and the
NGI was attached to the vacuum pump (Copley Scientific, UK). The air-flow rate
generated by the Pari TurboBoy compressor was monitored using flow meter
(Copley Scientific, UK) at 15 L/min which represents the midpoint flow of tidal
breathing for adult (Abdelrahim and Chrystyn, 2009). The removable cups of the
NGI did not require coating with silicone as for dry powder inhaler
characterisation (Abdelrahim and Chrystyn, 2009). A microfibre back-up filter (7
mm diameter Grade GF/D, Whatman®, UK), recommended by previous studies,
was placed after the Micro Orifice Collector (MOC, which is the final stage in the
NGI), to retain the smallest aerosol droplets when the NGI is operated at 15 L/min
(Abdelrahim and Chrystyn, 2009). 4 mL of optimised curcumin-loaded micelles
(containing curcumin at a concentration of 114.01 µg/mL, based on encapsulation
efficiency of curcumin-loaded polymeric micelles at 5% w/w drug in total
conjugate (45.60% EE; Table 3-5)) was placed in both nebuliser reservoirs and
nebulisation continued for 10 min based on the results of time to dryness for 4 mL
fill volume of water using an air-jet nebuliser. This was to compare the
performance of these two devices for delivering curcumin-loaded micelles under
the same operating conditions.
Deposited material was collected by rinsing with methanol from the nebuliser
reservoir, induction port, NGI collection cups and the back-up filter. All collected
samples were made up to fixed volumes for HPLC assay. The curcumin deposited
on the induction port, all NGI stages, internal filter and that still remaining in the
nebuliser was quantified by HPLC analysis (Section 3.4.1.2). Mass balance,
Emitted Dose (ED), Fine Particle Dose (FPD) and Fine Particle Fraction (FPF)
were calculated as follows:
Mass balance (%) = Mass of drug from nebuliser to filter
Mass of drug initially placed into the nebuliserx 100 Eq. 3-8
Emitted Dose (%ED) = Mass of drug from induction port to filter
Mass of drug from nebuliser to filterx 100 Eq. 3-9

Chapter 3 Hydrophobic drug-loaded genistein-mPEG micelles
118
Fine Particle Dose (FPD) = Drug mass less than 5 µm determined from the plot of
cumulative mass of active substance versus cut-off diameter.
Fine Particle Fraction (FPF) = Percentage cumulative fraction of drug less than 5
µm from the plot of cumulative fraction of active substance versus cut-off
diameter.
Statistical analysis
All measurements were carried out in triplicate and the data are presented as the
mean standard deviation. Comparison of the data from two groups or more was
statistically analysed by Student’s t-test and analysis of variance (ANOVA)
followed by Tukey’s post hoc test, using SPSS Statistic 22 Software. A p value of
< 0.05 was considered significant.
Results and discussion
HPLC assay for the quantification of erlotinib and curcumin
HPLC chromatogram of erlotinib and erlotinib-loaded genistein-
mPEG polymeric micelles
Figure 3-2 and 3-3, show the chromatograms of erlotinib and erlotinib-loaded
genistein-mPEG micelles in DMSO using the erlotinib HPLC assay. The peak for
DMSO (solvent font) occurred at a retention time of approximately 3 min for both
chromatograms. For erlotinib, the symmetrical chromatogram appeared at the
retention time of 4.57 min (Figure 3-2). Two peaks appeared at different retention
times of approximately 4.57 and 5.79 min were due to erlotinib and genistein-
mPEG, respectively (Figure 3-3). This indicated that neither the drug-polymer
conjugate nor DMSO would interfere with quantification of erlotinib. The run
time for the HPLC analysis of erlotinib was set at 10 min based on these HPLC
chromatograms.

Chapter 3 Hydrophobic drug-loaded genistein-mPEG micelles
119
Figure 3-2 HPLC chromatogram of erlotinib in DMSO
Figure 3-3 HPLC chromatogram of erlotinib-loaded genistein-mPEG polymeric micelles dissolved in DMSO
HPLC chromatograms of curcumin and curcumin-loaded genistein-
mPEG polymeric micelles
Commercial grade curcumin contains not only curcumin, but also approximately
10-20% of desmethoxycurcumin and less than 5% of bisdesmethoxycurcumin as
shown in Figure 3-4 (Sharma et al., 2005). The HPLC chromatogram of curcumin

Chapter 3 Hydrophobic drug-loaded genistein-mPEG micelles
120
(Figure 3-5) exhibited three peaks comprising curcumin and its derivatives with
good peak resolutions. The major peak appeared at a retention time of
approximately 10.54 min was ascribed to curcumin, whereas the two minor peaks
corresponding to bisdemethoxycurcumin and demethoxycurcumin presented at
retention times of approximately 8.99 and 9.73 min, respectively. A solvent peak
of methanol was detected at approximately 2.95 min. This was in a good
agreement with previous reports; using similar conditions for the HPLC analysis
of curcumin (Mollaei et al., 2013; Fonseca-Santos et al., 2016). Genistein-mPEG
was not detected under the same HPLC conditions (Figure 3-5 and 3-6), ensuring
that genistein-mPEG conjugate will not interfere the quantitative result of
curcumin throughout the further studies.
Figure 3-4 The structure of curcumin and its derivatives

Chapter 3 Hydrophobic drug-loaded genistein-mPEG micelles
121
Figure 3-5 HPLC chromatogram of curcumin and its derivatives in methanol
Figure 3-6 HPLC chromatogram of curcumin loaded genistein-mPEG micelles dissolved in methanol
Calibration curve for erlotinib
To study the linearity of erlotinib, dilutions were made in the range of 1-70 µg/
mL. A plot of erlotinib concentration against peak area response was linear over
this concentration range (Figure 3-7).

Chapter 3 Hydrophobic drug-loaded genistein-mPEG micelles
122
Figure 3-7 Calibration curve of erlotinib using HPLC analysis (n=3)
Calibration curve for curcumin
A plot of curcumin concentration against peak area was found to be linear over
the range of 3-50 µg/mL (Figure 3-8).
Figure 3-8 Calibration curve of curcumin using HPLC analysis (n=3)
Analytical method validation
The results of analytical method validation including linearity, precision, accuracy,
limit of detection and limit of quantification were shown the acceptable values
following ICH guidelines in Table 3-3.
y = 45.902x + 10.54R² = 0.9997
0
500
1000
1500
2000
2500
3000
3500
0 20 40 60 80
Pe
ak
Are
a (
mA
u)
Erlotinib Concentration (μg/mL)
y = 63.12x - 28.677R² = 0.9998
0
500
1000
1500
2000
2500
3000
3500
0 20 40 60
Pe
ak
Are
a (
mA
u)
Curcumin concentration (μg/mL)

Chapter 3 Hydrophobic drug-loaded genistein-mPEG micelles
123
The developed reverse phase high performance liquid chromatography (RP-
HPLC) for the determination of erlotinib does not require any buffer solutions
throughout the analysis compared with the reported methods (Latha et al. 2017;
Faivre et al., 2011; Bolandnazar et al., 2013). However, erlotinib was still eluted
in the short running time with the good result of precision, accuracy and linearity.
These validation results were achieved using ICH guidelines in the term of
validation of analytical procedures; therefore, this novel method can be used to
determine the amount of erlotinib in laboratories through at the remaining studies.
Table 3-3 Regression characteristics, validation and system suitability for the analysis of
erlotinib (n=4)
Parameters
Retention time (min) 4.6
Linearity range (µg/ mL) 3-70
Number of samples per curve 10
Limit of detection (µg/ mL) 0.78
Limit of quantification (µg/ mL) 3.00
Accuracy (%) 97.60 – 108.69
Precision (%RSD, n=3) 1.89- 7.52
Repeatability (%RSD) at 35 µg/mL (n=9) 2.70
Critical micelle concentration of genistein-mPEG conjugate
The critical micelle concentration (CMC), which is the minimum concentration of
surfactants and/or polymers required for micelle formation, is an important
parameters to define the characteristics of surface active agents and micelles
(Owen et al., 2012). A number of direct and indirect methodologies are available

Chapter 3 Hydrophobic drug-loaded genistein-mPEG micelles
124
for its measurement; for example, fluorescence intensity, electrical conductivity,
surface tension, UV absorbance, and scattered light intensity have been used to
determine the CMC value based on a sudden change in physical properties upon
micelle formation. Fluorescence spectroscopy and light scattering are the two
most commonly employed techniques due to their high precision and sensitivity to
the thermodynamic properties of micelles (Torchilin, 2001; Topel et al., 2013; Fu
et al., 2015).
Compared to fluorescence spectroscopy, DLS has shown equivalent performance
in terms of its sensitivity, but is more practical for routine use. Three main
parameters: the intensity of scattered light, correlation function of scattering
intensity and measured size changed were determined by DLS in this study, in
order to confirm micelles were formed from the conjugate in an aqueous medium,
and to measure the CMC of genisten-mPEG-COOH (Topel et al., 2013).
Figure 3-9 shows that there were two distinct slopes from the plot of the average
intensity of scattered light (Derived Count Rate, in kilo counts per second, kcps)
against various concentrations of genistein-mPEG (mg/mL, on a logarithmic
scale). The intensity of scattered light remained at the same level for the polymer
concentrations between 0.08 and 0.83 mg/mL. This was due to the background
scattering from either monomers of drug-polymer conjugate or HPLC grade water
in the preparations (Davis et al., 2011; Topel et al., 2013). However, there was an
increase in scattering intensity with increasing polymer concentration from 1.25 to
10 mg/mL, resulting from the self-aggregation of monomer/surfactant molecules
or micelles.

Chapter 3 Hydrophobic drug-loaded genistein-mPEG micelles
125
Figure 3-9 Effect of increasing concentration on scattered light intensity for genistein-mPEG solutions (n=3, mean± S.D.)
In theory, at low concentrations (below CMC), there are single polymer chains/
monomers dispersed insufficiently in the bulk solution and at the interface of air-
water phase. As the polymer concentration reaches the CMC, both polymer chains
and micellar aggregates are saturated in an aqueous environment and at the
interface (Owen et al., 2012). To determine the CMC, best curve fitting was
employed to obtain the intersection of two lines drawn through all data points. In
this work, the intersection of two straight lines corresponding to the CMC of
genistein-mPEG conjugate was 1.35 mg/mL (2.56 x 10⁻⁴ M).
The correlation function curve indicates the formation of micelles. Figure 3-10
shows that there were poor signal to noise ratios when very low concentrations
were studied. This means that hydrodynamic diameter of very diluted micelles
could not be detected since the time-dependent correlation function of the
scattering intensity was not reproducible, being similar to water (Ogino et al.,
1988; Topel et al., 2013). However, the intercepts of correlation functions
increased markedly when the polymer concentrations were above the CMC,
suggesting the presence of micelles (Topel et al., 2013). The measured size was
determined and the results demonstrate that there was a rapid change in size
around the CMC (Figure 3-11), in good agreement with a previous report using
the DLS technique (Topel et al., 2013)
y = 36253ln(x) + 1276.1R² = 0.97512
y = 1492.2ln(x) + 11668R² = 0.78411
0
10000
20000
30000
40000
50000
60000
70000
80000
90000
100000
0.01 0.1 1 10
Inte
nsi
ty o
f sc
att
ere
d l
igh
t(k
cps)
Polymer concentration(mg/mL)

Chapter 3 Hydrophobic drug-loaded genistein-mPEG micelles
126
Thus, changes in the intensity of scattered light, measured size and correlation
function depended on the concentration of amphiphilic polymer. This confirms
that genistein was successfully attached to mPEG and that this conjugate self-
assembled into micelles.
Figure 3-10 Effect of increasing concentration on correlation function (signal intensity to baseline noise ratio) (n=3, mean± S.D.)
Figure 3-11 Effect of increasing concentration on mean hydrodynamic diameter of genistein-mPEG solutions (n=3, mean± S.D.)
1.25mg/mL
10mg/mL
0.078mg/mL
0
200
400
600
800
1000
1200
1400
1600
1800
2000
0.1 1 10
Hy
dro
dy
na
mic
dia
mte
r (n
m)
Polymer concentration (mg/mL)

Chapter 3 Hydrophobic drug-loaded genistein-mPEG micelles
127
Characterisation of drug-loaded genistein-mPEG micelles
Size distribution, surface charge and drug entrapment of erlotinib-
loaded micelles
Erlotinib at 5%, 10% and 20% w/w drug in total conjugate was incorporated into
polymeric micelles, prepared above the CMC of genistein-mPEG-COOH (1.35
mg/mL). From preliminary studies, %EE could not be accurately determined
because drug concentrations for all formulations were lower than the LOD (0.78
µg/mL) and LOQ (3.00 µg/mL) of HPLC determination, being approximately 3%,
1% and less than 1% for 5%, 10% and 20% w/w drug in polymer, respectively.
Moreover, a turbid white suspension due to the colour of erlotinib powder was
seen during preparation, suggesting that this polymer conjugate was not
appropriate for a micelle formulation of erlotinib, in terms of the ability to
accommodate erlotinib and the stability.
Size distribution, surface charge and drug entrapment of curcumin-
loaded micelles
A transparent yellowish micellar solution of curcumin with no precipitation was
formed in which curcumin could be accurately quantified by HPLC analysis in the
desired concentration range. This indicates the successful incorporation of
curcumin into genistein-mPEG polymeric micelles.
Physical entrapment of drug is generally considered to dominate for micelles
formed from drug-polymer conjugates, especially for hydrophobic drugs
(Batrakova et al., 2006). Previous studies have shown that physical entrapment
depends on a number of factors; for example, solubility of the drug in water
(hydrophilicity/ hydrophobicity); the preparation method (dialysis, oil-in-water
emulsification, solvent evaporation, etc.); and the interrelations of drug and the
core-forming block of polymeric micelle including the steric properties, the block
length of hydrophobic and hydrophilic segments of polymer and the physical
properties of inner core segment (crystallinity, glass transition temperature, etc.)
(Batrakova et al., 2006; Raval et al., 2012; Takahashi et al., 2014; Rao et al.,

Chapter 3 Hydrophobic drug-loaded genistein-mPEG micelles
128
2015). It is noted that parameters such as the preparation method for loading
drugs into polymeric micelles and the amount as well as the type of polymer used
were constant for the two drugs studied here. Thus, the physicochemical
properties of erlotinib and curcumin are likely to affect drug entrapment, and
hence micellisation may not be suitable for incorporating all drugs as discussed
below.
The partition coefficient (log P value) or the octanol/water coefficient (Kow)
expresses the ratio of concentrations of a compound in a mixture of organic and
aqueous phases. The solubility of a solid compound depends on the energy
required to break its crystal lattice. Curcumin has a higher log P value
(respectively; 3.29 and 2.75 for curcumin and erlotinib) but lower water solubility
(respectively; 0.6 and 3-6 µg/mL for curcumin and erlotinib) compared to
erlotinib; these factors are likely to lead to the differences in drug incorporation.
Curcumin molecules are more likely to reside within the hydrophobic core of the
micelles than erlotinib based on their physicochemical properties, resulting in a
significantly higher in drug entrapment (Table 3-4).
Table 3-4 Properties of erlotinib and curcumin and their incorporations into genistein-mPEG polymeric micelles (n=3, mean± S.D.)
Hydrophobic
drugs
Erlotinib Curcumin
Molecular
structure
Entrapment
efficiency
(%EE)
N/A 45.60± 6.19
Drug loading
(%DL)
N/A 2.17± 0.29
*5% w/w drug in polymer; drug and polymer concentrations were 0.25 and 5
mg/mL in water, respectively
Chapter 3 Hydrophobic drug-loaded genistein-mPEG micelles
129
Considering the chemical structures of these two hydrophobic drugs, nitrogen
atoms from the quinazolinamine ring and oxygen from methoxyethoxy chains of
the erlotinib molecule may form weak electrostatic bonding with the carboxylic
group (-COOH) of genistein-mPEG conjugates at the surface of micelles.
Furthermore, the rigid structure and the steric hindrance of erlotinib comprising
three benzene rings attached to alkyne (C C; Triple bond) could limit the
rotation of the erlotinib molecule to penetrate and align into the hydrocarbon
region and inner core of micelles. These effects may result in weakening of van
der Waals’ force, π-π stacking interaction and H-bonding with genistein within
the hydrophobic core, such that, the entrapment efficiency was very low.
For curcumin, the molecular structure is more flexible; there are fewer aromatic
rings, and the molecule is smaller than erlotinib, with no bulky aliphatic side
chains, so that it may pack more easily into the polymeric micelles. Hydrophobic
interaction (van der Waals’s force) and/or π-π stacking interaction and H-bonding
between curcumin and genistein within the hydrophobic core can enhance the
encapsulation of curcumin, due to the two benzene rings of curcumin.
Furthermore, the two hydroxyl groups (-OH group) on the benzene rings of
curcumin are easier to protonate and have stronger ionic interaction and H-
bonding with the carboxylic group (-COOH) of genistein-mPEG. This can ensure
higher entrapment efficiency as compared to erlotinib, being approximately
45.6%.
Overall, the results demonstrate that the amphiphilic drug-polymer conjugate can
self-assemble to form micelles. This synthetic polymer seems unsuitable for
erlotinib delivery possibly due to its molecular structure limiting micellar
incorporation. However, it has shown that genistein-mPEG can be considered a
promising compound for producing drug-carriers for curcumin, and may be the
applicable for other hydrophobic drugs. Therefore, curcumin-loaded genistein-
mPEG polymeric micelles were studied further for potential pulmonary delivery.

Chapter 3 Hydrophobic drug-loaded genistein-mPEG micelles
130
Characterisation and development of curcumin-loaded micelles
The aim of this study was to investigate whether the synthesis of genistein-mPEG
conjugate would improve the water solubility of curcumin by including the drug
molecule in the hydrophobic core of micelles. As seen from Figure 3-12,
curcumin-incorporated into genistein-mPEG-COOH micelles after passage
through a 0.45µm membrane filter were transparent yellow, suggesting curcumin
is well-dispersed in an aqueous solution (Yang et al., 2015). This can be attributed
to the structure of amphiphilic micelles, allowing PEG segments to serve as
hydrophilic shell in water. Meanwhile, the genistein components of the conjugate
were packed in the hydrophobic core of the micelle, serving as a binding site for
curcumin (Danafar et al., 2014). Figure 3-12 demonstrates that this amphiphilic
drug-polymer conjugate could serve as a carrier for curcumin, and curcumin-
loaded genistein-mPEG micelles were consequently characterised for further
studies.
Figure 3-12 Appearance of curcumin dispersed in genistein-mPEG micelles (a) pre-
filtration (b) post-filtration
Effect of curcumin concentration on size distribution, surface charge,
entrapment efficiency and drug loading of micellar formulations
3.5.4.1.1 Effect of curcumin concentration on micelle size distribution
Particle of size larger than about 200 nm can be easily recognised and
phagocytosed by alveolar macrophage within the alveolar airspace, resulting in an
(a) (b)
Chapter 3 Hydrophobic drug-loaded genistein-mPEG micelles
131
insufficient concentration of drug at the tumour site and the failure of treatment
(Menon et al., 2014; Lee et al., 2015b; Nakamura et al., 2016).
Considering delivery to the lungs, nanocarriers in the range 50 -200 nm, achieve
alveolar deposition, as reported for nanosuspensions (Dandekar et al., 2010;
Amini et al., 2014; Menon et al., 2014), and can be readily incorporated into the
droplets during aerosol generation from nebulisers (Kamali et al., 2016).
Polydispersity Index (PDI), which is a measure of the size distribution or the size
uniformity in the sample, can be a measure of physical stability of nanoparticles,
indicating particle aggregation (Masarudin et al., 2015; Clayton et al., 2016).
Therefore, the mean size of the genistein-mPEG polymeric micelles produced in
this study was considered ideally to be approximately 200 nm or smaller, with a
PDI <0.3 representing a stable micelle formulation, suitable for nebulised delivery
to the airways.
The DLS results showed that mean diameter of curcumin-loaded micelles was
approximately 200 nm with one peak of narrow size distribution (PDI<0.2) for all
drug concentrations, representing as a relatively monodispersed system of
appropriate size (Table 3-5, Figure 3-13). When curcumin concentration was
increased from 2.5% to 20% w/w drug in conjugate, a significant increase in
hydrodynamic diameter from 173.62 to 215.18 nm (p<0.05) was observed. These
results were in agreement with previous reports, suggesting that physically-
encapsulated curcumin could expand the inner core and the space within the
micelles, contributing to a larger measured size (Song et al., 2014; Gao et al.,
2015).

Chapter 3 Hydrophobic drug-loaded genistein-mPEG micelles
132
Table 3-5 Characterisation of curcumin-loaded genistein-mPEG micelles at different drug concentrations (n=3, mean ± S.D.)
Curcumin
concentration
Hydrodynamic
diameter (nm)
Polydispersity Index Zeta Potential
(mV)
Entrapment
Efficiency (%)
Drug Loading
(%)
2.5% 173.62± 2.16 0.08± 0.03 -14.52± 2.81 43.36± 3.67 1.06± 0.09
5% 197.54± 2.27 0.07± 0.04 -15.88± 0.86 45.60± 6.19 2.17± 0.29
10% 211.80± 1.65 0.06± 0.02 -16.70± 1.49 32.48± 9.67 2.95± 0.88
20% 215.18± 5.12 0.18± 0.14 -16.72± 0.99 10.20± 3.85 1.69± 0.65

Chapter 3 Hydrophobic drug-loaded genistein-mPEG micelles
133
Figure 3-13 Size distribution of curcumin-loaded genistein-mPEG polymeric micelles at concentrations of a) 2.5%, b) 5%, c) 10% and d) 20% (w/w drug in polymer)
3.5.4.1.2 Effect of curcumin concentration on the surface charge of micelles
Surface charge is an important factor determining whether the nanocarriers will
adhere to cells having opposite charge and also impacts the physical stability of
colloids (Danafar et al., 2014); a high value of zeta potential either negative or
positive is recommended for long-term stability (Mahajan and Mahajan, 2016).
Nanocarriers with positive charge interact through electro-static forces with
negatively-charged cell membranes, resulting in highly effective internalisation
(Wang et al., 2011). On the other hand, nanoparticles with negative charge; for
instance, PLGA and gold nanoparticles, have been described as penetrating cell
membranes through caveolae-mediated pathways (Wang et al., 2011).
The surface modification of nanocarriers using PEG has been demonstrated to
enhance passive targeting through a stealth effect, due to a protective barrier
against the adherence of serum proteins. This can contribute to a reduction of
nanocarriers being taken by macrophages (Iyer et al., 2015; Hassanzadeh et al.,
2017). In this study, all curcumin-loaded genistein-mPEG formulations were

Chapter 3 Hydrophobic drug-loaded genistein-mPEG micelles
134
negatively charged; between -14 and -16 mV as shown in Table 3-5. This value
was in agreement with previous reports using mPEG 5kDa in conjugates (Yin et
al., 2013; Danafar et al., 2014; Gao et al., 2015). The negative-charge may
possibly be due to protonation of the carboxylic group (–COOH) from the
presence of residual mPEG-COOH in genistein conjugate in deionised water (pH
values between 5.5 and 6.5), resulting in the COO- ion.
Overall, the conjugate of genistein and mPEG was likely to be suitable for
forming polymeric micelles for cancer delivery, due to the small hydrodynamic
diameter (< 200 nm), narrow size distribution, and high negative charge (ranging
from -14 to -16 mV) of the micelles. However, in order to achieve optimal
therapy, drug entrapment was further considered.
3.5.4.1.3 Effect of curcumin concentration on drug entrapment in genistein-
mPEG micelles
Drug entrapment of hydrophobic drugs in micelles may be attributed to chemical
conjugation or physical entrapment. Physical entrapment was expected to be the
main factor in this study (Mahajan and Mahajan, 2016). There was a marked
increase in drug loading between 2.5% and 5% w/w curcumin-encapsulated
genistein-mPEG micelles (p<0.05), being approximately 1.06 % and 2.17%,
respectively (Table 3-5). However, entrapment efficiency for both formulations
was similar (p>0.05). When 5% and 10% w/w curcumin-loaded micelles were
compared, entrapment efficiency and drug loading for both preparations showed
no significant differences (p>0.05), suggesting that 5% curcumin is the optimal
content for efficient entrapment. Interestingly, there was a noticeable drop in
entrapment efficiency and drug loading (p<0.05) for 20% w/w curcumin. This
might be because micelles were saturated with curcumin at high concentration,
with no available space to accommodate further molecules of curcumin. Therefore,
higher amounts of curcumin in the initial formulation used to generate micelles
resulted in the lower drug entrapments calculated according to Equations 3-1 and
3-2.
Higher concentrations of curcumin in curcumin-loaded polymeric micelles
significantly increased the mean hydrodynamic diameter (Table 3-5; p<0.05).

Chapter 3 Hydrophobic drug-loaded genistein-mPEG micelles
135
However, changes in PDI and surface charge were not evident (p>0.05). The
initial weight ratio between curcumin and the synthesized conjugate of 1:20 (5%
w/w) was chosen for further characterisation as due to the maximum
solubilisation of curcumin in the conjugate, with mean micelle size < 200nm.
3.5.4.1.4 Effect of curcumin incorporation on the size distribution of
genistein-mPEG micelles
When empty micelles (drug-free) and the 5% w/w curcumin-loaded genistein-
mPEG micelles were compared, the mean diameter of blank micelles was
considerably larger than those in the presence of drug (p<0.05; Table 3-6). This
may be attributed to the intermolecular forces between curcumin and genistein in
the conjugate. It is possible that encapsulated curcumin molecule caused stronger
van der Waal’s interactions and/or electrostatic forces with genistein compared
with empty micelles. Furthermore, the phenyl groups of curcumin could possibly
also have hydrophobic-hydrophobic interaction with alkyl chain of mPEG-COOH
as seen in the case of the incorporation of meso- tetraphenyl porphine into
polyethylene glycol – distearoyl phosphatidyl ethanolamine and the incorporation
of norcantharidin into poly (ethylene glycol) -poly (caprolactone) polymeric
micelles (Ahmad et al., 2014). All of these factors result in a more tightly packed
micelle core as in previously reported (Chen et al., 2012; Scarano et al., 2014; Li
et al., 2016; Gong et al., 2017).
The size distribution was also affected by the incorporation of curcumin. The
value of PDI was significantly lower (p<0.05) and the size distribution curve
showed only one peak for drug-loaded micelles, indicating a relatively uniformly
dispersed or more homogeneous population compared to empty self-assembled
micelles as shown in Figure 3-14. Whereas empty micelles show broader size
distribution peak, possibly indicating aggregation.
The data suggest that the strong physical interactions consisting of hydrophobic-
hydrophobic interactions, H-bonding and π-π stacking between curcumin and
genistein-mPEG conjugate contributed to a reduced mean size of the carriers and
relatively lower PDI for curcumin-encapsulated micelles compared with blank
micelles (p<0.05).

Chapter 3 Hydrophobic drug-loaded genistein-mPEG micelles
136
Table 3-6 Size distribution of empty and curcumin-loaded genistein-mPEG micelles (n=3, mean ± S.D.)
Formulationsa Hydrodynamic
diameter (nm)a
Polydispersity Index
(PDI)
Empty genistein-mPEG-
micelles
274.48± 27.41 0.38± 0.05
5% curcumin-loaded
genistein-mPEG micelles
197.54± 2.27 0.07± 0.04
a Polymer concentration = 5 mg/mL
Figure 3-14 Size distribution of a) empty genistein-mPEG polymeric micelles and b) curcumin-loaded genistein-mPEG polymeric micelles
Transmission electron microscopy of empty and curcumin-loaded
genistein-mPEG polymeric micelles
TEM images of empty genistein-mPEG micelles (Figure 3-15a) and curcumin-
containing genistein-mPEG micelles (Figure 3-15b) demonstrate that micelles for
both preparations were well-dispersed in aqueous medium as individual spherical
micelles with narrow size distribution. The sizes of both formulations observed
under TEM were smaller as compared to those measured by DLS, being
approximately 140 nm and 190 nm for curcumin-loaded micelles, and 30 nm and
250 nm for empty micelles, respectively. This is in agreement with previous

Chapter 3 Hydrophobic drug-loaded genistein-mPEG micelles
137
reports and may be explained by the different techniques and physical conditions
of TEM and DLS for measuring particle size (Qiu et al., 2009; Gao et al., 2013).
The combined results of the morphology, mean particle size and size distribution
of blank and curcumin-loaded micelles determined by TEM and DLS confirm the
molecular self-association of genistein-mPEG conjugate into polymeric micelles,
into which curcumin can be incorporated.
Figure 3-15 TEM images of a) empty micelles and b) curcumin-loaded genistein-mPEG micelles after filtration
Effect of nebuliser fill volume on time to nebulise to dryness and
aerosol output for air-jet and vibrating-mesh nebulisers
In general, nebulisers do not release all of the fluid-loaded into the nebuliser
chamber as an aerosol. The amount of liquid that remains in the device at the end
of nebulisation is referred to as ‘the residual volume’ or ‘dead volume’ (Elhissi et
al., 2013). The weight output or aerosol mass output, represents the weight of
product successfully delivered by the nebuliser, and depends on a combination of
factors; including the fill volume of fluid at the beginning of nebulisation, the
efficiency of device, the nebulisation time, the design of the nebuliser reservoir,
and the physicochemical properties of the formulation such as the viscosity, the
surface tension, the concentration of drug solution and sometimes ion content
(Kendrick et al., 1997; Ghazanfari et al., 2007). It is noted that drug output, which
a.) b)

Chapter 3 Hydrophobic drug-loaded genistein-mPEG micelles
138
expresses the percentage of drug or active ingredient emitted from the nebuliser,
considered a critical factor for clinical outcomes, is not necessarily the same as
aerosol mass output (Kendrick et al., 1997; Elhissi et al., 2013). The aim of this
study was to measure the time taken to nebulise 2, 4 and 8 mL of HPLC grade
water to ‘dryness’ i.e. the point at which aerosol output ceased and to determine
the percentage nebulised at a specific time, in order to establish the suitable
nebuliser fill volume before micellar aerosols were characterised.
From previous literature, the suitable fill volume should be at least twice the
residual volume and sufficient to deliver a therapeutic dose of medicine with
minimal drug loss (Kendrick et al., 1997). A large residual volume indicates that a
large amount of drug remains in the nebuliser and cannot be inhaled, and thus in
practice, adding a diluent to small fill volumes is recommended in order to
maximise drug delivery over the nebulisation period (Rubin and Williams, 2014)).
However, larger volumes of medical fluid increase administration time (Rubin
and Williams, 2014). A period of nebulisation in the range of 5-10 min is
recommended, as a prolonged nebulisation time may affect patience adherence
(Kendrick et al., 1997; Jevon and Ewens, 2001; Chan et al., 2011).
There are various types of air-jet nebuliser designs as mentioned in Chapter 1; for
example, constant output, breath-actuated and breath-enhanced air-jet nebulisers
which have different output rates due to the design of the device and the
positioning of internal baffles (Lavorini, 2013; Ibrahim et al., 2015). For all
designs, the driving pressure or driving gas flow is the major determinant of
output (O'Callaghan and Barry, 1997). The Pari® LC Sprint jet nebuliser used in
this study is a breath-enhanced jet nebuliser, that is modified from a conventional
device to increase the output rate, and decrease the nebulisation time and aerosol
waste (Lavorini, 2013).
Increasing in fill volumes of water from the minimum of 2 mL to the maximum
volume of 8 mL in the Pari air-jet nebuliser reservoir based on manufacturer’ s
literature required a longer time for nebulisation to dryness, from approximately 3
min to 20 min (Figure3-16a). A shorter time is usually preferable for patient

Chapter 3 Hydrophobic drug-loaded genistein-mPEG micelles
139
convenience; however, the percentage aerosolised in specific time should also be
considered, so as to achieve the most effective localised treatment.
Figure 3-16b shows that greater than 50 % of water in the reservoir was nebulised
for all fill volumes. A fill volume of at least 2 mL in an air-jet nebuliser is usually
recommended by manufacturers (Clay et al., 1983); however, only 56.19 %
released as aerosol in this study. In order to increase the proportion of water
emitted from an air-jet device, increasing the fill volume was required. Increasing
the fill volume to 4 and 8 mL considerably enhanced the percentage nebulised,
being 78.34% and 87.12%, respectively. The time taken to nebulise 8 mL was
approximately double as that for a 4 mL fill (respectively; 20 min and 9 min)
(Figure 3-16a).
Figure 3-16 Effect of fill volumes of water on (a) time to nebulise to dryness and (b) percentage nebulised at dryness using an air-jet nebuliser (n=3, mean± S.D.)
Vibrating-mesh nebulisers are more efficient and provides more consistent and
higher doses of drug to patients with smaller residual volume than air-jet devices
(Ari, 2014; Pritchard et al., 2018). However, these devices are more expensive
due to the increased number of tolerance critical components that associated with
the electronic control circuit as well as the material used in the mesh manufacture
(i.e. platinum, palladium, nickel and stainless steel) and require thorough cleaning
(Ghazanfari et al., 2007; Ari, 2014; Pritchard et al., 2018). A vibrating-mesh
nebuliser was used as the alternative device in this study to improve output
efficiency. In these devices, vibration of a perforated plate results in extrusion of
liquid through the mesh pores, causing aerosol generation as described in Chapter
1 (Figure 1-7). The times taken to nebulise defined volumes of water to ‘dryness’
for the vibrating-mesh nebuliser (Pari Velox®) was studied and compared with
0
5
10
15
20
25
2 4 8
Dry
nes
s ti
me
(min
)
Volume (mL)
a)
20
40
60
80
100
2 4 8Per
cen
tag
e re
lease
d (
%)
Volume (mL)
b)

Chapter 3 Hydrophobic drug-loaded genistein-mPEG micelles
140
the air-jet nebuliser (Figure 3-17). For 2 and 4 mL fill volumes, it took less time
(p<0.05) for the vibrating-mesh nebuliser (respectively; 2.23 and 6.41 min)
compared to the air-jet nebuliser (respectively; 3.39 and 9.15 min).
Figure 3-17 Effect of fill volumes of water on time to nebulise to dryness for the vibrating-mesh nebuliser (n=3, mean± S.D.)
All fill required less than 10 min to reach dryness state with the vibrating-mesh
device. However, the percentage aerosolised could not be measured for the
vibrating-mesh device due to the mechanism of aerosol generation, which leads to
the deposition of most of the aerosol at the base of the device housing, resulting in
high residual volume (Chan et al., 2011) unless the aerosol is drawn from the
device by patient breaths. For air-jet nebulisers, the compressed air produces the
aerosol droplets and directs them towards the patient for inhalation. By contrast,
the direction of the aerosol stream is directed downwards for vibrating-mesh
nebuliser as demonstrated in Figure 3-18 (Ghazanfari et al., 2007).
0
2
4
6
8
10
12
2 4 6
Dry
nes
s ti
me
(min
)
Volume (mL)
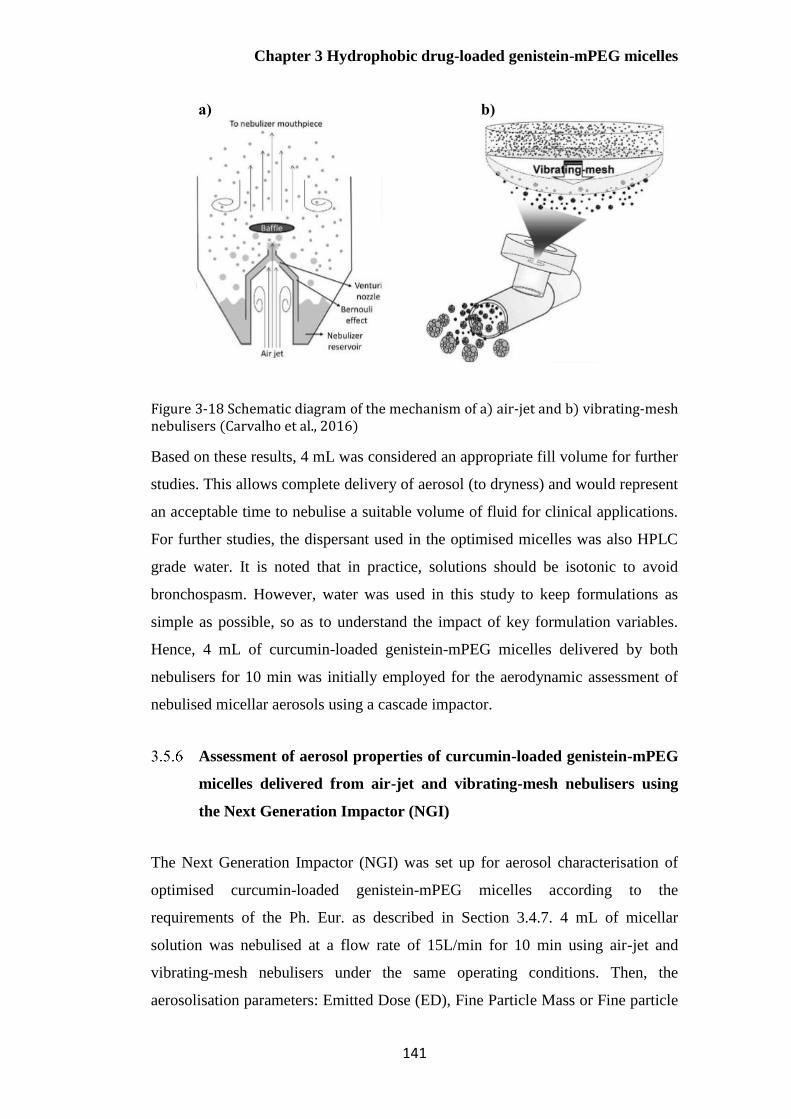
Chapter 3 Hydrophobic drug-loaded genistein-mPEG micelles
141
Figure 3-18 Schematic diagram of the mechanism of a) air-jet and b) vibrating-mesh nebulisers (Carvalho et al., 2016)
Based on these results, 4 mL was considered an appropriate fill volume for further
studies. This allows complete delivery of aerosol (to dryness) and would represent
an acceptable time to nebulise a suitable volume of fluid for clinical applications.
For further studies, the dispersant used in the optimised micelles was also HPLC
grade water. It is noted that in practice, solutions should be isotonic to avoid
bronchospasm. However, water was used in this study to keep formulations as
simple as possible, so as to understand the impact of key formulation variables.
Hence, 4 mL of curcumin-loaded genistein-mPEG micelles delivered by both
nebulisers for 10 min was initially employed for the aerodynamic assessment of
nebulised micellar aerosols using a cascade impactor.
Assessment of aerosol properties of curcumin-loaded genistein-mPEG
micelles delivered from air-jet and vibrating-mesh nebulisers using
the Next Generation Impactor (NGI)
The Next Generation Impactor (NGI) was set up for aerosol characterisation of
optimised curcumin-loaded genistein-mPEG micelles according to the
requirements of the Ph. Eur. as described in Section 3.4.7. 4 mL of micellar
solution was nebulised at a flow rate of 15L/min for 10 min using air-jet and
vibrating-mesh nebulisers under the same operating conditions. Then, the
aerosolisation parameters: Emitted Dose (ED), Fine Particle Mass or Fine particle
a) b)

Chapter 3 Hydrophobic drug-loaded genistein-mPEG micelles
142
Dose (FPD), Fine Particle Fraction (FPF), Mass Median Aerodynamic Diameter
(MMAD) and Geometric Standard Deviation (GSD) delivered for both nebulisers
were determined and compared as shown in Table 3-7.
Table 3-7 Aerosol parameters of curcumin-loaded genistein-mPEG micellar aerosols
delivered from air-jet and vibrating-mesh nebulisers into the cooled NGI at a flow rate of
15L/min (n=3, mean± S.D.)
Type of nebulisers Air-jet (Pari LC® Sprint
nebuliser)
Vibrating-mesh (Pari
Velox®)
Mass balance (%) 88.16± 0.80 % 89.19± 2.11 %
Emitted Dose (ED) 60.79± 0.19 % 50.83± 1.38 %
Fine Particle Dose (µg) 123.00± 13.11 88.33± 15.28
Fine Particle Fraction
(%)
47.00± 1.00 % 36.33± 2.89 %
MMAD (µm) 5.24± 0.09 6.09± 0.21
GSD 1.96± 0.02 1.65± 0.02
The mass balances for both air-jet and vibrating-mesh devices were within
European Pharmacopeia acceptance limits. Therefore, the NGI can be used to
compare these two nebulisers in order to assess the suitable device for delivering
curcumin-loaded micelles. Emitted Dose, which represents the dose of drug
emitted from the nebuliser, was considerably higher for the air-jet nebuliser
(p<0.05) compared with vibrating-mesh nebuliser. The MMAD for the air-jet
device was smaller than vibrating-mesh device (p<0.05), whereas the GSD values
were similar, being in the range of 1.65-1.96, indicating a polydispersed aerosol.
Moreover, the air-jet nebuliser produced significantly higher FPD and FPF
(p<0.05) compared to the vibrating-mesh nebuliser, as expected based on the
MMAD values for both nebulisers.
The lower efficiency of the vibrating-mesh device in this study was at variance
with other reports. In previous studies, vibrating-mesh nebulisers were more
efficient than air-jet nebulisers in terms of shorter time to complete nebulisation
and/or yielding higher output rate (Ghazanfari et al., 2007; Elhissi et al., 2012; Ari,

Chapter 3 Hydrophobic drug-loaded genistein-mPEG micelles
143
2014). However, the performance of vibrating-mesh devices is highly affected by
the physicochemical properties of the fluid being nebulised, particularly viscosity,
surface tension, drug concentration and ion content (Zhang et al., 2007a; Chan et
al., 2011; Elhissi et al., 2011a). The less efficient output of vibrating-mesh
nebuliser could be due to the high negative surface charge of curcumin-loaded
micelles (-18 mV), or drug crystallisation with particles adhering to and blocking
the mesh apertures during aerosol generation. Furthermore, high electrostatic
charge has been previously reported to inhibit the flow of fluid through mesh
pores and/or the detachment of aerosol droplet, and also to increase the aerosol
deposition on the wall of nebuliser (Manunta et al., 2011). These factors could
possibly cause the lower energy input for atomisation and output rate as reported
in the case of the delivery of receptor-targeted nanocomplexes with high surface
charge by a vibrating-mesh nebuliser for gene therapy (Manunta et al., 2011).
According to Poiseuille’s law (Equation 3-10), the performance of vibrating-mesh
nebuliser depends on fluid properties. A higher density and lower viscosity of
solution result in higher liquid flow through the mesh pores and greater aerosol
output (Zhang et al., 2007a). Therefore, the inclusion of viscosity reducing agents
may alter fluid output as seen in the reports for solutions and liposomes
(Ghazanfari et al., 2007; Zhang et al., 2007a; Elhissi et al., 2011a; Elhissi et al.,
2012).
𝑄 = 𝜋𝜌 △ Ρ𝑅2 4𝔶𝐿⁄ Eq. 3-10
where ρ= the density, R= the radius of aperture, △ Ρ= the pressure drop across
aperture, L= the length of solution pumped through aperture, η= the fluid viscosity
and Q= liquid flow
Previous studies have also shown that the inclusion of electrolyte or surfactant can
reduce water adhesion to the internal structure of reservoir surfaces and mesh
pores of the mesh nebuliser by increasing the electrical conductivity and the
repulsive force towards the bulk solution and decreasing the droplet surface
charge (Ghazanfari et al., 2007). These effects lead to an earlier detachment of
droplets from the bulk solution and consequently decrease the nebulised aerosol

Chapter 3 Hydrophobic drug-loaded genistein-mPEG micelles
144
size, resulting in an enhanced emitted dose and drug output (Deshpande et al.,
2002; Ghazanfari et al., 2007; Chan et al., 2011). Furthermore, the presence of ion
in solution (especially halide ions; for example NaCl solution) can reduce the
droplet size and cause an increase in output rate, FPF and FPD (Ghazanfari et al.,
2007).
The lack of excipients in this study may result in non-ideal properties of fluid,
reflected in the lower efficiency of vibrating-mesh nebuliser as compared to air-jet
nebuliser (Beck-Broichsitter and Oesterheld, 2017). Further formulation
development would be appropriate to enhance the delivery of a micelle solution
from these devices.
Overall, the curcumin-encapsulated genistein-mPEG micelles were effectively
delivered by an air-jet nebuliser with satisfactory values for the key aerosol
quality parameters (Kendrick et al., 1997). However, the characteristic properties
of the formulation are likely to be the predominant reason for an unexpected
performance of vibrating-mesh nebuliser. Thus, further investigations of nebuliser
performance for micelle delivery should be conducted to determine the effect of
physicochemical properties of medical fluids in the presence of suitable types and
concentrations of surfactants, electrolytes and viscosity modifying agents during
aerosol generation to achieve the specific requirements for lung delivery.
Conclusions
The incorporation of curcumin into genistein-mPEG micelles was successfully
achieved using the thin-film hydration method. This synthesized conjugate was
not suitable for the delivery of erlotinib due to its molecular structure limited
micellar incorporation. However, curcumin-encapsulated micelles with desired
mean size and drug entrapment have shown the potential for pulmonary delivery,
performed by air-jet and vibrating-mesh nebulisers as demonstrated using the NGI.
The results showed that the performance of the air-jet device was superior to
vibrating-mesh device in terms of higher %ED, FPD and FPF for this formulation
(5% w/w curcumin-loaded genistein-mPEG micelles), which are the key
parameters of aerosolisation. However, further studies on physicochemical

Chapter 3 Hydrophobic drug-loaded genistein-mPEG micelles
145
properties of micellar formulations in the presence of surfactants, electrolytes and
viscosity agents during nebulisation are required for the better understanding of
the differences in nebuliser performance.

Chapter 4 Liposomes loaded with erlotinib and genistein
146
Chapter 4 Liposomes loaded with
erlotinib and genistein

Chapter 4 Liposomes loaded with erlotinib and genistein
147
Introduction
In Chapter 3, curcumin was successfully incorporated into genistein-mPEG
polymeric micelles, though these nanocarriers could not adequately incorporate
erlotinib. Liposomes are considered safe, biocompatible and biodegradable lipid-
based drug carriers, which have previously been proposed for pulmonary delivery,
for various applications including cancer treatment (Elhissi et al., 2011a;
Sercombe et al., 2015; Rudokas et al., 2016). Liposomes consist of one or more
bilayers of amphiphilic molecules that have a hydrophilic head and two
hydrophobic chains (Bozzuto and Molinari, 2015).
The degree of drug loading into liposomes depends on various factors including
the physicochemical properties of drugs, the nature of the lipid membrane, the
composition of the formulations (type of lipid, lipid-to-cholesterol ratio, drug-to-
lipid ratio) as well as the method of preparation (Pattni et al., 2015; Chountoulesi
et al., 2017). Liposomes can be classified on the basis of their lamellarity, namely
uni-, oligo- and multilamellar vesicles, which depends on the method used for
their preparation and post-formation processing (Bozzuto and Molinari, 2015;
Pattni et al., 2015).
Dipalmitoylphosphatidylcholine (DPPC) was chosen as the major component of
the liposome formulation in this study as it is the predominant constituent of lung
surfactant (Kaviratna and Banerjee, 2012; Joshi et al., 2014). DPPC liposomes
containing erlotinib and genistein individually or together were prepared by thin-
film hydration to obtain multilamellar vesicles (MLVs). This classical
manufacturing technique is suggested for hydrophobic drugs since those
molecules become incorporated in the phospholipid bilayer upon the formation of
self-assembled liposomes (Pattni et al., 2015). Multilamellar vesicles were then
reduced in size by probe-sonication to yield unilamellar vesicles. Unilamellar
liposomes are ideal since they can easily fit into smaller aerosol, with minimal
drug leakage during nebulisation (Lehofer et al., 2014; Cipolla et al., 2016).
Cholesterol and DOPE used as stabiliser and helper lipid respectively were also
included to obtain the desired characteristics of liposomes co-loaded with
erlotinib and genistein, in terms of vesicle size, surface charge, encapsulation

Chapter 4 Liposomes loaded with erlotinib and genistein
148
efficiency and the stability of liposomes. Furthermore, the incorporation of
cholesterol into liposomes may improve stability during aerosolisation (Cipolla et
al., 2016).
Hydrophobic molecules are incorporated into liposomal bilayers (Figure 4-1).
Cholesterol as well DOPE and hydrophobic drugs used in the formulation may
complete for the same region within the DPPC bilayer. Therefore, an
understanding of the effect of drugs and excipients on the properties of the lipid
bilayer is important with respect to drug entrapment efficiency, drug release and
in-vitro stability (Budai et al., 2003; Wu et al., 2012).
Figure 4-1 The structure of liposomes containing hydrophobic drug, cholesterol and DOPE within lipid bilayer (Phan et al., 2013; Monteiro et al., 2014)
The mobility of the molecules within and across the lipid bilayer is dependent on
the temperature. The DPPC bilayer undergoes a pre-transition (transformations in
the orientation of the polar head groups of DPPC) and a main phase transition
(transformations in the orientation of acyl chains of hydrophobic region) when
increasing the temperature. These thermotropic behaviours play an important role
in bilayer fluidity, permeability and stability (Gardikis et al., 2006; Wu et al.,
2012; Monteiro et al., 2014). Specifically, the DPPC bilayer has low fluidity and
permeability to encapsulated exogenous compounds at a temperature below the
main gel phase to the liquid-crystalline phase transition (Tc = 41 °C). However,
DPPC bilayers have high fluidity at a temperature above the Tc (Monteiro et al.,
2014).
The Tc of phospholipids depends on a number of factors; for example, the degree
of saturation of the acyl chains, the length of the hydrocarbon chains and the type
Hydrophobic drug Cholesterol Unsaturated lipid
i.e. DOPE
Saturated phospholipid
i.e. DPPC

Chapter 4 Liposomes loaded with erlotinib and genistein
149
of the polar head group (Monteiro et al., 2014). Figure 4-2 shows the effect of
cholesterol incorporation into the bilayer of a saturated PC such as DPPC on the
bilayer properties. As results of the addition of cholesterol, the fluidity and
permeability of DPPC bilayer decrease in a fluid state as compared to DPPC
bilayer at above the Tc. By contrast, the bilayer becomes less condensed but more
fluidity and permeable when compared with the pure DPPC at below the Tc. The
inclusion of unsaturated lipids (DOPE), cholesterol and biomolecules, which
affect bilayer packing may have a significant impact on the thermal properties and
permeability of DPPC-based bilayer.
Figure 4-2 Influence of temperature and cholesterol on the DPPC phospholipid bilayer (Monteiro et al., 2014)
Differential Scanning Calorimetry (DSC) has proved a valuable thermal analytical
approach for investigating the thermodynamic lipid phase transition and the
interaction of agents with saturated lipid such as DPPC by measuring thermal
changes of the lipid bilayer. Multichannel Differential Scanning Calorimetry
(MCDSC) was therefore used in this study to investigate drug interactions with
the phospholipid bilayer membrane and to determine maximum drug
incorporation (drug/lipid ratio) for a better understanding of the co-loaded
liposomal formulation during pre-formulation studies.

Chapter 4 Liposomes loaded with erlotinib and genistein
150
Aims
4.2.1 To develop and validate a reversed-phase high-performance liquid
chromatography (RP-HPLC) method for quantification and co-quantification of
erlotinib and genistein in accordance with International Conference on
Harmonisation (ICH) guidelines.
4.2.2 To investigate the lipid composition of DPPC-based liposomes for the
delivery of erlotinib and genistein as individual and co-loaded formulations and to
characterise the properties of liposomes in terms of particle size distribution,
surface charge and encapsulation efficiencies of both drugs.
4.2.3 To characterise individual and co-loaded liposomal formulations using two
methodologies (HPLC and MCDSC analysis) that may be useful to estimate the
maximum incorporation and to understand bilayer interactions of erlotinib and
genistein in DPPC-based liposomes.
Materials
Erlotinib >99% (N-(3-ethynylphenyl)-6,7-bis(2-methoxyethoxy)quinazolin-4-
amine) and genistein >99% (4’,5,7-trihydroxyisoflavone) (LC Laboratories, USA)
were used as hydrophobic drugs in the liposomal formulations. The phospholipids,
hydrogenated soy phosphatidylcholine (HSPC, L-α-phosphatidylcholine,
hydrogenated (Soy)), DPPC (1,2- dipalmitoyl- sn- glycerol- 3- phosphocholine)
and DOPE (1,2-dioleyl- sn- glycerol- 3- phosphoethanolemine), supplied by
Lipoid (Ludwigshafen, Germany), were used without further purification as the
major and helper lipids, respectively. Cholesterol (Sigma-Aldrich; Poole, UK)
was used as the bilayer stabiliser in the liposomes. Absolute ethanol (99.8%,
analytical grade), chloroform (99.8%, analytical grade) and HPLC grade water
acquired from Sigma-Aldrich (Poole, UK) were used as solvents and a diluent in
liposomes. The following reagents and solvents were obtained from Sigma-
Aldrich (Poole, UK): dimethyl sulfoxide (DMSO, >99.7%, HPLC gradient grade),
acetonitrile (99.9%, HPLC gradient grade), trifluoroacetic acid (TFA, >99.0%)
and HPLC grade water, and used for a validated HPLC method for the

Chapter 4 Liposomes loaded with erlotinib and genistein
151
quantitative determination of genistein and erlotinib, and simultaneous analysis of
the drugs in combination.
Methods
Validation of HPLC analytical method for erlotinib and genistein
Chromatographic conditions for HPLC analysis of erlotinib and
genistein
A validated HPLC analysis was developed for the quantitative determination of
erlotinib and genistein individually and for co-quantification of the two drugs in
combination, to allow calculation of entrapment efficiency for individually load
and co-loaded liposomes. Preliminary studies on the UV absorbance of erlotinib
and genistein performed by UV-Vis Spectrophotometer (Agilent Cary 100, UK),
gave the λmax values for erlotinib and genistein as 246 and 260 nm, respectively.
Quantification was carried out using an HPLC system equipped with an auto
sampler and UV/Vis detector (Agilent 1100 Series, USA) at a wavelength of 246
nm for quantification of erlotinib and 260 nm for genistein. A Synergi Polar-RP
80A HPLC Column (250 x 4.6 mm x 4 m) acquired from Phenomenex,
Torrance, California, an ether-linked phenyl phase suitable for the separation of
polar and aromatic components, was used as the stationary phase for separation in
this study. As erlotinib and genistein have benzene rings in their main structures
and different polarities, this column was considered appropriate for the separation
of these two compounds, and also suitable for the isolation of these two drugs
from other materials used in the formulations.
Isocratic elution was carried out with a mobile phase comprising a mixture of
acetonitrile and 0.1 % v/v TFA in HPLC grade water (50:50 % v/v). The eluents
were degassed before being pumped through the column at a flow rate of 1
mL/min. The column temperature was maintained at 25C and the sample
injection volume was 10 L, with a run time of 10 min. The UV wavelength was
set to shift from 246 nm to 260 nm after 5.2 min for simultaneous quantification

Chapter 4 Liposomes loaded with erlotinib and genistein
152
of the two drugs, while the wavelength for individual analyses remained fixed
throughout the entire experiment.
HPLC chromatographic conditions of erlotinib and genistein for individual and
co-quantification analysis are summarised in Table 4-1.
In order to ensure there was no interference between other components present in
the liposomes preparation and the two drugs, empty liposomes (formulation
without drug) comprising DPPC, cholesterol and DOPE (72:8:20 mol%) were
studied using the same HPLC chromatographic systems.
Table 4-1 HPLC chromatographic conditions for assay of erlotinib and genistein using
individual and simultaneous methods
Drug Erlotinib Genistein Simultaneous
Injection volume (L) 10 10 10
UV/Vis detector
wavelength (nm)
246 260 246 and 260
Mobile phase (100% v/v
acetronitrile : 0.1% TFA in
HPLC grade water)
50:50 50:50 50:50
Column temperature (C) 25 25 25
Flow rate (mL/min) 1 1 1
Run time (min) 10 10 10
Retention time (min) 4.6 5.8 4.6 (Erlo)
5.8 (Gen)
Preparation of standard solutions and calibration curves for
erlotinib and genistein
Two standard stock solutions of erlotinib and genistein of 1000 g/mL were
individually prepared by dissolving 25 mg of erlotinib in 20 mL of DMSO and 25
mg of genistein in 20 mL of methanol in separate 25 mL volumetric flasks. The
sample was bath-sonicated for a few minutes to ensure complete dissolution of

Chapter 4 Liposomes loaded with erlotinib and genistein
153
drug, and solutions made up to the final volume of 25 mL. After that, 0.35 mL of
the stock solution was diluted to 5 mL in a 5 mL volumetric flask to obtain the
highest concentration of 70 g/mL. For the linearity study, serial dilutions of
standard solutions were made in the range of 1 - 70 g/mL; 1, 2, 3, 4, 5, 10, 20, 30,
40, 50, 60 and 70 g/mL. Individual calibration curve for erlotinib and genistein
were plotted, with taking peak area on the Y axis and analyte concentration on the
X axis.
For simultaneous quantification of erlotinib and genistein, both stock solutions
were prepared individually in DMSO before mixing to avoid potential chemical
reaction between these two drugs at high concentrations. Subsequently, equal
volumes of each stock solution were diluted with DMSO in the same volumetric
flask, in order to make an equivalent series of concentrations ranging from 1 to 70
µg/mL for both drugs.
Analytical method validation
4.4.1.3.1 Linearity
Linearity in this study was performed by taking four samples of all serial dilutions
of 1, 2, 3, 4, 5, 10, 20, 30, 40, 50, 60, 70 g/mL from the stock solution and then
injecting 10 L of each concentration into the HPLC chromatographic system and
recording the response. The degree of linearity was then determined by
calculating the correlation coefficient. The slope, intercept and correlation
coefficient of erlotinib, genistein and co-quantification were determined from the
equation describing the response. It is noted that the ranges of tested
concentrations for preparing individual and co-quantification HPLC analysis of
erlotinib and genistein were the same.
4.4.1.3.2 Precision
Intraday precision was performed by injecting three concentrations (8, 35 and 55
g/mL) in triplicate per concentration onto the chromatographic system on the
same day. Inter-day precision was determined with those concentrations on three
consecutive days. The repeatability study was undertaken by injecting the chosen

Chapter 4 Liposomes loaded with erlotinib and genistein
154
concentration of 35 µg/mL 9 times to obtain the relative standard deviation
(%RSD) calculated as mentioned (Eq.3-1).
4.4.1.3.3 Accuracy
The accuracy was determined by the recovery method, using a series of
concentrations between 3 and 70 μg/mL for erlotinib and between 2 and 70 μg/mL
for genistein in triplicate for the quantification and co-quantification of erlotinib
and genistein. The percentage recovery was calculated using as mentioned (Eq. 3-
2).
4.4.1.3.4 Limit of detection
As mentioned in Section 3.4.1.5.4
4.4.1.3.5 Limit of quantification
As mentioned in Section 3.4.1.5.5
Preparation method for liposomes containing erlotinib or genistein
and liposomes co-loaded with erlotinib and genistein
Effect of drug concentrations on the properties of DPPC liposomes
The aim of this study was to investigate the maximum drug loading into DPPC
liposomes and to characterise the properties of co-loaded liposomes for mean size,
particle size distribution, surface charge and encapsulation efficiency. Two stock
solutions of erlotinib and genistein (each 1.25 mg/mL) were prepared individually
by dissolving 25 mg of erlotinib and 25 mg of genistein in 20 mL of absolute
ethanol in separate 28 mL glass vials. DPPC liposomes with incorporated drug
were prepared by the thin-film hydration method. To prepare formulations of
different initial drug/lipid concentrations (% w/w), 1 mL, 2 mL and 4 mL of drug
solution was added to 50 mg of DPPC to obtain 2.5, 5 and 10% w/w drug in
DPPC individually, respectively. The phospholipid (DPPC) and drug (erlotinib or
genistein) were dissolved together in 30 mL of a mixture of absolute ethanol and
chloroform (4:1 v/v) in a 250 mL round-bottomed flask. The mixture was then
placed into a bath sonicator and sonicated to ensure the complete dissolution of

Chapter 4 Liposomes loaded with erlotinib and genistein
155
drug and lipid. Solvent was removed using a rotary vacuum evaporator (RC 900,
Knf Neuberger GmbH, Germany) at 150 bars for 20 min at 60C to acquire a thin
film of drug and lipid. The dry thin film was flushed with nitrogen gas at ambient
temperature for 5 min to remove residual solvent and then hydrated with 20 mL of
HPLC water with vigorous hand-shaking, followed by gentle rotation on the
rotary evaporation equipment at 200 rpm for 30 min at 60°C in a water bath to
produce MLVs of 2.5 mg/mL lipid content.
For co-loaded formulations, erlotinib and genistein co-loaded liposomes were
prepared using the thin-film hydration method as outlined above. 1 mL, 2 mL and
4 mL of stock solution of each drug (1.25 mg/mL in absolute ethanol) was added
to 50 mg of DPPC, yielding a series of drug concentrations in lipid of
approximately 2.5, 5 and 10% for each drug w/w.
Empty liposomes, without either drug, were also prepared using the same method.
This was to compare and study the effect of drug incorporation on the properties
of the liposomes.
Upon successful production of the MLVs, their sizes were reduced by probe
sonication to achieve the required mean size of 100- 200 nm (Dandekar et al.,
2010; Amini et al., 2014). Liposomes in this range can be readily into the droplets
during nebulisation (Cipolla et al., 2016) with minimal drug waste as well as
achieving greater avoidance of alveolar macrophage uptake within alveolar
airspace compared with those larger than 200 nm (Kamali et al., 2016; Nakamura
et al., 2016).
Non-incorporated drug was removed by syringe filtration. Each 2 mL of
formulations was filtered through a 0.45-μm cellulose acetate membrane filter
(Merck Millipore Ltd., UK) once, yielding a filtrate of drug-loaded liposomes.
Effect of cholesterol content on the properties of DPPC liposomes
Drug concentration was initially fixed at 5% w/w drug in total lipid, while the
content of cholesterol in DPPC (mol%) for erlotinib or genistein liposomal
formulations was varied as shown in Table 4-2. The range of these concentrations

Chapter 4 Liposomes loaded with erlotinib and genistein
156
was chosen based on values successfully employed in a previous study of
genistein liposomes (Phan et al., 2013). 2mL of drug solutions (1.25 mg/mL from
each stock solution in absolute ethanol) and lipid phase (50 mg in total,
comprising DPPC and cholesterol) were dissolved in 30 mL of a mixture of
absolute ethanol and chloroform (4:1 v/v). Liposomes were prepared, sonicated
and characterised as described in Section 4.4.2.1. The results were reported as the
mean and standard deviation (mean ± S.D.) of three separate experiments.
Table 4-2 The content of DPPC and cholesterol in erlotinib or genistein liposomal
formulations
Composition
Quantity (mg)
F1
0 mol%
cholesterol
F2
8 mol%
cholesterol
F3
15 mol%
cholesterol
F4
30 mol%
cholesterol
DPPC 100 mol%
= 50 mg
92 mol%
= 47.81 mg
85 mol%
= 45.75 mg
70 mol%
= 40.79 mg
Cholesterol 0 mol%
= 0 mg
8 mol%
= 2.19 mg
15 mol%
= 4.25 mg
30 mol%
= 9.21 mg
Effect of the addition of DOPE on the properties of liposomes
The aim of this study was to investigate the effect of the inclusion of 20 mol%
DOPE (as previously successfully employed in a genistein liposome preparation
(Phan et al., 2013)) on the properties of liposomes by comparing the liposomal
formulation with and without DOPE. Drug-loaded liposomes (5% w/w erlotinib
or 5% w/w genistein in total phospholipid) comprising 8 mol% of cholesterol
(2.18 mg), 20 mol% of DOPE (10.51 mg) and 72 mol% of DPPC (37.31 mg) were
prepared individually as described in Section 4.4.2.1.

Chapter 4 Liposomes loaded with erlotinib and genistein
157
For co-loaded preparations, erlotinib (2.5% w/w) and genistein (2.5% w/w),
cholesterol (8% w/w) in total lipid were fixed (based on the results of individual
formulations), whereas the concentrations of DOPE in total phospholipid (0, 10,
20, 30 and 40 mol% of lipid contents) and DPPC up to 100% w/w lipid were
varied as shown in Table 4-3. All liposomal formulations were characterised as
outlined in Section 4.4.3.
Table 4-3 The composition of DPPC: cholesterol: DOPE in erlotinib and genistein co-loaded liposomal formulations
Composition
Quantity (mg)
F1 = 0%
DOPE
F2 = 10%
DOPE
F3 = 20%
DOPE
F4 = 30%
DOPE
F5 = 40%
DOPE
Erlotinib 1.25 mg 1.25 mg 1.25 mg 1.25 mg 1.25 mg
Genistein 1.25 mg 1.25 mg 1.25 mg 1.25 mg 1.25 mg
DPPC 47.81 mg 42.55 mg 37.31 mg 32.08 mg 26.87 mg
Cholesterol 2.18 mg 2.18 mg 2.18 mg 2.18 mg 2.18 mg
DOPE 0.00 mg 5.26 mg 10.51 mg 15.74 mg 20.95 mg
Effect of sonication time on liposome particle size distribution and
drug entrapment
The purpose of this experiment was to study the influence of duration of probe-
sonication on mean particle size, polydispersity index (PDI) and entrapment
efficiency (%EE) of erlotinib and genistein individually. Optimised genistein or
erlotinib-loaded MLVs liposomes, with lipid phase DPPC: cholesterol: DOPE
(72:8:20 mol%), were prepared individually and their size reduced by 30 min
probe-sonication. 20 mL of MLVs were placed in a 20 mL glass vial and kept in
an ice bath throughout the size reduction. Probe sonication (MSE Soniprep 150,
MSE, UK) was undertaken at a constant output of 12 watts (5 min/cycle and 1
min cooling at 4 ºC, to avoid overheating). The titanium probe (9.5 mm diameter)
was immersed to a depth of 15 mm above the bottom of the glass vial. The time
Chapter 4 Liposomes loaded with erlotinib and genistein
158
for sonication (15, 30, 45 and 60 min) was varied to obtain a mean diameter of
100 to 200 nm. After that, optimal sonication time was fixed for the preparation of
liposomes co-loaded with erlotinib and genistein.
Characterisation of liposomes
Particle size distribution measurement by dynamic light scattering
The mean hydrodynamic diameter and the particle size distribution were
measured using the Malvern Nano ZS Zetasizer (Malvern Instruments, UK). 1.0
mL of liposomes was placed without further dilution into the zeta potential DTS
1070 folded capillary cell (Malvern instrument, UK). Three measurements were
determined at 25 ºC. The data are expressed as mean Z-average particle diameter
and polydispersity index (PDI).
Surface charge determination
For zeta potential measurements, the samples were prepared and assessed using
the Malvern Nano ZS Zetasizer as described in Section 4.4.3.1. Three independent
measurements based on electrophoretic mobility using the Helmholtz-
Smoluchowski equation were determined and reported as mean values± S.D.
Transmission electron microscopy
The morphology and aggregation behaviour of co-loaded liposomes was studied
following placement on a carbon grid and negative staining with one drop of
uranyl acetate (1% w/v), and observation using a transmission electron
microscope (Philips Electron Optics BV, Netherlands), as described in Section
3.4.4.4.
Drug-loading and entrapment efficiency
1 mL of each formulation was diluted with ethanol to a final volume of 5 mL
prior to HPLC analysis. The entrapment efficiency (%EE) and drug loading

Chapter 4 Liposomes loaded with erlotinib and genistein
159
(%DL) of erlotinib and genistein were calculated using equations (Eq. 3-5 and Eq.
3-6) as outlined in Section 3.4.4.3.
Thermal analysis
Differential Scanning Calorimetry (DSC) has been extensively used as a highly
sensitive technique for studying the interaction of biomolecules with phospholipid
bilayers (Taylor and Morris, 1995; Elhissi et al., 2006b; Chiu and Prenner, 2011).
In general, the incorporation of exogenous molecules into a lipid bilayer has more
pronounced effect on the pre-transition than the main transition (Elhissi et al.,
2006b; Saunders et al., 2007). Changes in the thermotropic behaviour of the main
transition phase are dependent on the localisation of drug, with more obvious
change when drug is located between C1 and C10 of the hydrophobic hydrocarbon
region (Saunders et al., 2007).
In recent times, DSC instrumentation with increased sensitivity or High
Sensitivity DSC (HSDSC) has been employed in a number of studies to provide
more accurate and reliable data, especially for small thermal events such as the
pre-transition which are difficult to accurately measure by conventional DSC
(Saunders et al., 2007). HSDSC was used for studying the interaction of
hydrophobic drugs (erlotinib and genistein), cholesterol and DOPE with DPPC
bilayer that may affect drug incorporation during pre-formulation studies.
Determining suitable lipid concentrations and scan rate for DSC
analysis
DPPC liposomes were prepared by the lipid thin-film hydration method (Section
4.2.2.1) and sonicated for 30 min. To identify suitable lipid concentrations, DPPC
concentrations of 2.5, 20 and 40 mg/mL were studied with the aim of achieving
good resolution in the DSC thermogram at the minimum lipid concentration. The
pre (Tpre) and main phase transition temperatures (Tm) and enthalpy of transition
for DPPC-based liposomes (kJ/mol) were compared with previous reports.
Chapter 4 Liposomes loaded with erlotinib and genistein
160
For scan rate, 0.5 and 1 °C/min were studied for DPPC liposomes using a High
Sensitivity Differential Scanning Calorimeter (HSDSC), a Multi cell DSC (TA
instruments, Newcastle, UK).
Investigation of effect of drugs and helper lipids of different
concentrations on DSC thermograms
1 mL of formulations having total lipid concentration 40 mg/mL were each placed
into a DSC sample cell (TA Instruments, Newcastle, UK), which was sealed using
a rubber O-ring and cell cap to ensure an airtight fit. The reference cell was empty.
Nitrogen was supplied to prevent vapour condensation on the sample cells during
cooling (Elhissi et al., 2006b; Saunders et al., 2007). Fifteen liposomal
formulations characterised in this study were listed below:
DPPC
DPPC/Cholesterol
DPPC/DOPE
DPPC/Cholesterol/DOPE
DPPC containing erlotinib at concentrations of 2.5, 5% and 10%
DPPC containing genistein at concentrations of 2.5%, 5% and 10%
DPPC containing both drugs at concentrations of 2.5% and 5%
DPPC/Cholesterol/DOPE containing erlotinib at concentration of 2.5%
DPPC/Cholesterol/DOPE containing genistein at concentration of 2.5%
DPPC/Cholesterol/DOPE containing erlotinib and genistein at
concentrations of 2.5%
All scans were undertaken at a rate of 0.5 °C/min from 15 to 70°C. The thermal
behaviour of liposomes was evaluated based on the temperature of the pre-
transition (Tpre), main phase transition temperature (Tm), enthalpy (∆H) and half-
height width (HHW) of the main endothermic peak using the instrument software.
Three independent DSC measurements were determined and values are reported
as mean ± SD.
Chapter 4 Liposomes loaded with erlotinib and genistein
161
Statistical analysis
All experiments were carried out in triplicate and results are present as the mean ±
S.D. Data were statistically analysed using either Student’s t-test or analysis of
variance (ANOVA) and Tukey’s post hoc test, using IBM SPSS Statistic 22
software. A p value < 0.05 was considered significant.
Results and discussion
Validation of HPLC analysis
HPLC chromatograms of erlotinib and genistein
The retention times for erlotinib and genistein were approximately 4.6 (Figure 4-
3) and 5.8 min (Figure 4-4), respectively. In order to ensure there was no chemical
reaction between two drugs prior to the pre-formulation studies of this
combination, the retention times and the peak responses of HPLC methods for
individual and simultaneous determination of erlotinib and genistein were
assessed. Based on the comparison of chromatograms (Figure 4-3, Figure 4-4 and
Figure 4-5), no difference in the retention times and the peak areas of both drugs
individually and in combination was evident. This suggests no interaction
between these two active ingredients impacting the HPLC analysis at the
concentrations investigated.
Blank liposomes (formulation without any drugs) containing DPPC, cholesterol
and DOPE were injected into the HPLC system, with only one chromatographic
peak at 2.7 min as seen in Figure 4-6, Figure 4-7, Figure 4-8 and Figure 4-9. This
observation indicates that the three components used in the formulation will not
interfere in the quantitative of both drugs in the remaining studies.

Chapter 4 Liposomes loaded with erlotinib and genistein
162
Figure 4-3 HPLC chromatogram of erlotinib (10 µg/mL)
Figure 4-4 HPLC chromatogram of genistein (10 µg/mL)
=====================================================================
Acq. Operator : NATTIKA Seq. Line : 11
Acq. Instrument : Instrument 1 Location : Vial 31
Injection Date : 6/20/2016 1:30:42 PM Inj : 1
Inj Volume : 10.000 µl
Acq. Method : C:\CHEM32\1\DATA\NATTIKA\200616 2ND GENISTEIN CALIBRATION CURVE 2016-06-20
11-30-15\NATTIKA 50 50M AT 260NM.M
Last changed : 1/23/2016 3:19:31 PM by NATTIKA
Analysis Method : C:\CHEM32\1\METHODS\PARACETAMOL.M
Last changed : 9/4/2013 3:23:30 PM by NAIB
min0 1 2 3 4 5 6 7 8 9
mAU
0
100
200
300
400
500
VWD1 A, Wavelength=260 nm (C:\CHEM32\...6 2ND GENISTEIN CALIBRATION CURVE 2016-06-20 11-30-15\031-1101.D)
3.0
38
5.8
37
=====================================================================
Area Percent Report
=====================================================================
Sorted By : Signal
Multiplier: : 1.0000
Dilution: : 1.0000
Use Multiplier & Dilution Factor with ISTDs
Signal 1: VWD1 A, Wavelength=260 nm
Peak RetTime Type Width Area Height Area
# [min] [min] [mAU*s] [mAU] %
----|-------|----|-------|----------|----------|--------|
1 3.038 BB 0.5136 208.78206 6.57083 4.9320
2 5.837 BB 0.1155 4024.39063 534.99316 95.0680
Totals : 4233.17268 541.56399
=====================================================================
*** End of Report ***
Data File C:\CHEM32\...0616 2ND GENISTEIN CALIBRATION CURVE 2016-06-20 11-30-15\031-1101.D
Sample Name: 50MCG/ML
Instrument 1 10/3/2017 10:40:39 AM PLERNTA Page 1 of 1

Chapter 4 Liposomes loaded with erlotinib and genistein
163
Figure 4-5 HPLC chromatogram of erlotinib (10 µg/mL) and genistein (10 µg/mL)
Figure 4-6 HPLC chromatogram of blank liposomes consisting of DPPC, cholesterol and DOPE
=====================================================================
Acq. Operator : NATTIKA Seq. Line : 11
Acq. Instrument : Instrument 1 Location : Vial 80
Injection Date : 6/14/2016 3:34:30 PM Inj : 1
Inj Volume : 10.000 µl
Acq. Method : C:\CHEM32\1\DATA\NATTIKA\140616 1ST CO CALIBRATION CURVE 2016-06-14 13-32-
46\NATTIKA SIMULTANEOUS 50 50.M
Last changed : 3/8/2016 5:05:56 PM by NATTIKA
Analysis Method : C:\CHEM32\1\METHODS\PARACETAMOL.M
Last changed : 9/4/2013 3:23:30 PM by NAIB
min0 1 2 3 4 5 6 7 8 9
mAU
0
100
200
300
400
500
VWD1 A, Wavelength=246 nm, TT (C:\CHEM32\...16 1ST CO CALIBRATION CURVE 2016-06-14 13-32-46\0000000010.D)
2.9
82
4.6
60
5.8
23
=====================================================================
Area Percent Report
=====================================================================
Sorted By : Signal
Multiplier: : 1.0000
Dilution: : 1.0000
Use Multiplier & Dilution Factor with ISTDs
Signal 1: VWD1 A, Wavelength=246 nm, TT
Peak RetTime Type Width Area Height Area
# [min] [min] [mAU*s] [mAU] %
----|-------|----|-------|----------|----------|--------|
1 2.982 VB 0.4779 2932.44238 93.57441 31.8737
2 4.660 BB 0.1269 2258.15015 257.92606 24.5446
3 5.823 VB 0.1147 4009.60303 528.94226 43.5817
Totals : 9200.19556 880.44273
=====================================================================
Data File C:\CHEM32\...KA\140616 1ST CO CALIBRATION CURVE 2016-06-14 13-32-46\0000000010.D
Sample Name: 50MCG/ML
Instrument 1 10/3/2017 10:38:16 AM PLERNTA Page 1 of 1
=====================================================================
Acq. Operator : NATTIKA Seq. Line : 2
Acq. Instrument : Instrument 1 Location : Vial 2
Injection Date : 8/7/2016 8:33:55 PM Inj : 1
Inj Volume : 10.000 µl
Acq. Method : C:\CHEM32\1\DATA\NATTIKA_EE\070816 BLANK FORMU TO STUDY INTEFERENCE 2016-
08-07 20-11-01\NATTIKA SIMULTANEOUS 50 50.M
Last changed : 3/8/2016 5:05:56 PM by NATTIKA
Analysis Method : C:\CHEM32\1\METHODS\PARACETAMOL.M
Last changed : 9/4/2013 3:23:30 PM by NAIB
min0 1 2 3 4 5 6 7 8 9
mAU
0
10
20
30
40
50
60
70
80
VWD1 A, Wavelength=246 nm, TT (C:\CHEM32\...NK FORMU TO STUDY INTEFERENCE 2016-08-07 20-11-01\002-0201.D)
2.7
81
=====================================================================
Area Percent Report
=====================================================================
Sorted By : Signal
Multiplier: : 1.0000
Dilution: : 1.0000
Use Multiplier & Dilution Factor with ISTDs
Signal 1: VWD1 A, Wavelength=246 nm, TT
Peak RetTime Type Width Area Height Area
# [min] [min] [mAU*s] [mAU] %
----|-------|----|-------|----------|----------|--------|
1 2.781 VB 0.3412 2154.95703 84.51225 100.0000
Totals : 2154.95703 84.51225
=====================================================================
*** End of Report ***
Data File C:\CHEM32\...816 BLANK FORMU TO STUDY INTEFERENCE 2016-08-07 20-11-01\002-0201.D
Sample Name: DF=5 BLANK FORMULATION
Instrument 1 10/3/2017 10:50:44 AM PLERNTA Page 1 of 1
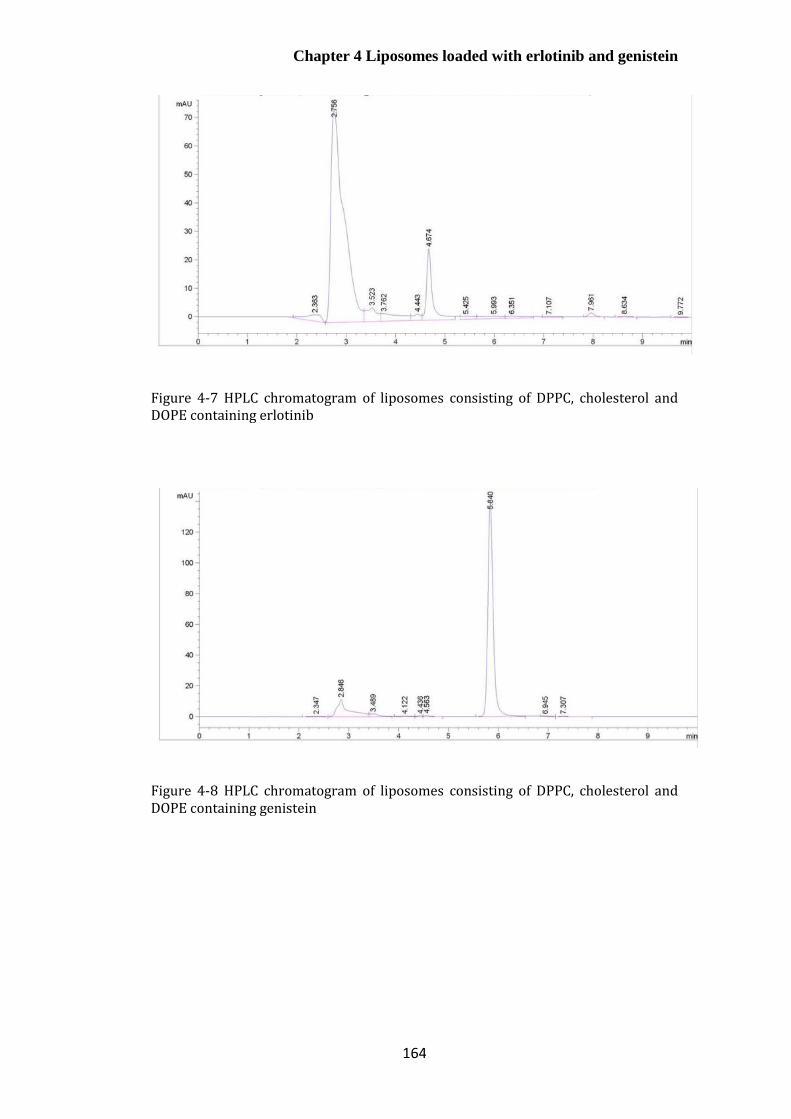
Chapter 4 Liposomes loaded with erlotinib and genistein
164
Figure 4-7 HPLC chromatogram of liposomes consisting of DPPC, cholesterol and DOPE containing erlotinib
Figure 4-8 HPLC chromatogram of liposomes consisting of DPPC, cholesterol and DOPE containing genistein

Chapter 4 Liposomes loaded with erlotinib and genistein
165
Figure 4-9 HPLC chromatogram of liposomes consisting of DPPC, cholesterol and DOPE containing erlotinib and genistein
Calibration curves for erlotinib, genistein and co-quantification of
erlotinib and genistein
In order to examine the linearity of HPLC methods for quantification and co-
quantification of erlotinib and genistein, serial dilutions of both standard solutions
were prepared ranging from 1 to 70 µg/mL. Each graph was plotted as peak
response (mAU) versus concentration of drug (µg/ mL), yielding an equation for
the line as shown in Figure 4-10 to Figure 4-13. Based on the obtained analysis of
the least-square regression, correlation coefficients that present the linear
relationship between the peak areas of analyte and analyte concentrations were
achieved with R2 > 0.999 for the determined calibration curves. This represents
good linearity for the analytical procedures over the drug concentration range
investigated (Sistla et al., 2005; Faivre et al., 2011).

Chapter 4 Liposomes loaded with erlotinib and genistein
166
Figure 4-10 HPLC calibration curve of erlotinib (n= 3)
Figure 4-11 HPLC calibration curve of genistein (n=3)
y = 45.902x + 10.54R² = 0.9997
0
500
1000
1500
2000
2500
3000
3500
0 10 20 30 40 50 60 70 80
Pe
ak
Are
a (
mA
u)
Erlotinib Concentration (μg/mL)
y = 80.792x + 18.129R² = 1
0
1000
2000
3000
4000
5000
6000
0 10 20 30 40 50 60 70 80
Pe
ak
Are
a (
mA
u)
Genistein Concentration (μg/mL)

Chapter 4 Liposomes loaded with erlotinib and genistein
167
Figure 4-12 HPLC calibration curve of erlotinib (in presence of genistein) (n= 3)
Figure 4-13 HPLC calibration curve of genistein (in presence of erlotinib) (n= 3)
Analytical method validation
The developed HPLC method for quantification of erlotinib and genistein did not
require any buffer solutions throughout the analysis as compared to previous
methods for erlotinib (Faivre et al., 2011; Bolandnazar et al., 2013; Latha et al.,
2017) and genistein (Supko and Phillips, 1995; Da Costa César et al., 2006;
y = 45.403x + 10.543R² = 0.9999
0
500
1000
1500
2000
2500
3000
3500
0 10 20 30 40 50 60 70 80
Pe
ak
Are
a (
mA
u)
Erlotinib Concentration (μg/mL)
y = 78.324x + 21.142R² = 1
0
1000
2000
3000
4000
5000
6000
0 10 20 30 40 50 60 70 80
Pe
ak
Are
a (
mA
u)
Genistein Concentration (μg/mL)

Chapter 4 Liposomes loaded with erlotinib and genistein
168
Pandit and Patravale, 2011). The results for analytical method validation, which
included linearity, precision, accuracy, LOD and LOQ were achieved according to
ICH guidelines with short analysis times (Table 4-4). The LOD and LOQ values
were calculated based on the slope and standard deviation of the Y-intercept of
the regression analysis of linear curves, as opposed to alternatives used to
determine these critical values; for example, the signal to noise ratio (Latha et al.,
2017).

Chapter 4 Liposomes loaded with erlotinib and genistein
169
Table 4-4 Regression characteristics, validation and system suitability for the analysis of erlotinib and genistein (n=4)
Parameters
Individual HPLC analysis Simultaneous HPLC
analysis
Erlotinib Genistein Erlotinib Genistein
Retention time
(min) 4.6 5.8 4.6 5.8
Linearity range
(µg/mL) 3-70 2-70 3-70 2-70
Number of samples
per curve 10 11 10 11
Limit of detection
(µg/mL) 0.78 0.18 0.34 0.25
Limit of
quantification
(µg/mL)
3.00 2.00 3.00 2.00
Accuracy (% RE) 97.60–
108.69
97.46-
102.53
94.76–
101.63
96.53-
109.60
Precision (%RSD,
n=3) 1.89- 7.52 0.55- 2.84 1.03- 9.86 1.26- 5.11
Repeatability
(%RSD) at 35
µg/mL (n=9)
2.70 3.27 3.29 1.32
Table 4-5 shows that the intra-day and inter-day precisions determined by %RSD
and the accuracy values (%RE) for individual and simultaneous HPLC analysis of
erlotinib and genistein (8, 35 and 55 µg/mL), were within the acceptance criteria,
being less than 5% SD (Sistla et al., 2005).

Chapter 4 Liposomes loaded with erlotinib and genistein
170
These HPLC methods show the similar retention time using a simpler
composition of mobile phase compared with previous reports of the quantitative
determination of erlotinib and genistein individually, providing a rapid, simple
and cost-effective analytical method. Co-quantification of erlotinib and genistein
has not been previously reported. This method can be used to simultaneously
quantify erlotinib and genistein throughout the remaining studies.

Chapter 4 Liposomes loaded with erlotinib and genistein
171
Table 4-5 Inter-day and Intra-day variability of the HPLC method (n=4, mean± S.D)
Nominal
concentration
(µg/mL)
Intra-day Inter-day Intra-day Inter-day
Measured
concentration
(µg/mL)
%RSD %RE Measured
concentration
(µg/mL)
%RSD %RE Measured
concentration
(µg/mL)
%RSD %RE Measured
concentration
(µg/mL)
%RSD %RE
Individual analysis of erlotinib Individual analysis of genistein
8 8.09± 0.10 1.19 -1.11 8.09± 0.24 2.94 -1.07 7.97± 0.09 1.19 0.32 7.93± 0.28 3.47 0.83
35 34.91± 0.17 0.49 0.27 34.44± 0.93 2.70 1.61 35.15± 0.26 0.73 -0.43 34.71± 1.13 3.27 0.82
55 54.09± 0.70 1.29 1.66 53.90± 1.27 2.36 2.00 55.16± 0.20 0.36 -0.29 54.05± 1.44 1.73 1.73
Co-quantification analysis of erlotinib Co-quantification analysis of genistein
8 8.30± 0.18 2.11 -3.81 8.04± 0.28 3.50 -0.51 7.93± 0.08 0.97 0.89 7.89± 0.07 0.93 1.34
35 34.74± 0.22 0.63 0.73 34.28± 1.13 3.29 2.05 35.02± 0.12 0.35 -0.07 34.81± 0.46 1.32 0.55
55 54.30± 0.21 0.40 1.27 53.90± 1.26 2.34 2.01 54.55± 0.08 0.16 0.82 54.51± 0.62 1.14 0.89

Chapter 4 Liposomes loaded with erlotinib and genistein
172
Characterisation of drug-loaded liposomes
Saturated lipid hydrogenated soybean phosphatidylcholine (HSPC) and
cholesterol have previously been used in the preparation of liposomes
encapsulating either erlotinib or genistein (Phan et al., 2013; Mandal et al., 2016;
Li et al., 2017; Zhou et al., 2018). However, co-encapsulation of erlotinib (log
P=2.75) and genistein (log P=2.84) into liposomes has not yet been reported. This
combination was studied as an interesting and rational challenge for pulmonary
delivery.
Dipalmitoylphosphatidylcholine (DPPC), which contains two 16-carbon
(palmitoyl) chains as compared to a mixture of 16 and 18–carbon chains for
HSPC, was chosen as the main phospholipid component in the liposomal
formulations studied here (Monteiro et al., 2014). DPPC and HSPC are not
commercially available in inhalation products, though DPPC has been used for
delivering ciprofloxacin in clinical trials. The use of DPPC as a major lipid in
liposomes for the delivery of erlotinib and genistein individually and in
combination was investigated since it was challenging for preparation,
characterisation and optimisation. Secondly, the phase transition temperature of
DPPC (41° C) is above 37° C, ensuring that there is no rapid loss of drug at body
temperature (Chen et al., 2014). Importantly, DPPC is a major component of lung
surfactant and may be more suitable for pulmonary delivery than HSPC
(Kaviratna and Banerjee, 2012; Joshi et al., 2014).
Effect of cholesterol concentration on the properties of DPPC
liposomes containing either erlotinib or genistein
A previous study demonstrated that the incorporations of cholesterol and DOPE
into HSPC liposomes at the appropriate ratio improved the entrapment efficiency
and stability of genistein-loaded liposomes compared with those of the HSPC
alone (Phan et al., 2013). This was due to changes in the lipid packing and fluidity
of the phospholipid bilayer (Phan et al., 2013). Initially in this study, 5% w/w

Chapter 4 Liposomes loaded with erlotinib and genistein
173
erlotinib or 5% w/w genistein in DPPC was fixed, and then cholesterol content
was varied (ranging from 0 to 30 mol% of total lipid content), to study the effect
of cholesterol concentrations on the properties of erlotinib or genistein-containing
DPPC liposomes.
DPPC liposomes in the absence of cholesterol and those containing 8 mol% of
cholesterol showed the similar encapsulation efficiency of genistein (Figure 4-14,
respectively; 45% and 38.5% EE). This suggests that adding cholesterol content
up to 8 mol% in the presence of genistein had no measurable impact on the
packing of genistein within the saturated hydrocarbon chains of DPPC. As the
inclusion of cholesterol was increased from 8% to 30%, a decrease in entrapment
efficiency of genistein was seen (p<0.05). This may be because greater
concentrations of cholesterol cause phase separation in the bilayer with a
formation of cholesterol domain and/or a reduced free volume of the hydrocarbon
chains, resulting in an exclusion of genistein from the liposomal bilayer and a
decrease in genistein entrapment as described previously for other hydrophobic
drugs (Elhissi et al., 2006b; Kępczyński et al., 2008). Cholesterol thus plays an
important role in the molecular interaction of all other molecules present in the
lipid bilayer, resulting in changes in bilayer properties and having a consequent
effect on the incorporation of hydrophobic drugs (Chountoulesi et al., 2017).
Figure 4-14 Effect of cholesterol content (mol%) on entrapment efficiency (%EE) of a) erlotinib and b) genistein in DPPC liposomes (n=3, mean ± S.D.)
The entrapment efficiency for erlotinib did not change with increasing cholesterol
content (range 3.50 – 8.86 % EE), indicating no significant effect of cholesterol
0
2
4
6
8
10
12
14
16
18
0 8 15 30
En
tra
pm
ent
Eff
icie
ncy (
%E
E)
Cholesterol content (%M)
0
10
20
30
40
50
60
70
0 8 15 30
En
tra
pm
ent
Eff
icie
ncy
(%
EE
)
Cholesterol content (%M)
a) b)

Chapter 4 Liposomes loaded with erlotinib and genistein
174
on entrapment efficiency for erlotinib over the range investigated. This could be
due to the differences in partitioning and orientation between erlotinib and
cholesterol in the liposomal membrane (Zhao et al., 2007). Erlotinib may be
predominantly located near the polar head groups of DPPC liposomes, whereas
cholesterol was oriented within the bilayer (Monteiro et al., 2014). Moreover,
entrapment efficiency of erlotinib was comparatively lower than genistein for all
loading concentrations (p<0.05).
The incorporation of therapeutic agents into the liposomal bilayer depends on the
nature of drugs (e.g. its molecular structure, polarity and oil/water partition
coefficient) and the properties of lipid (hydrocarbon chain length, packing density
and bilayer fluidity). These can all determine the localisation of drugs within the
bilayer and their incorporation into liposomes, especially for hydrophobic drugs
(Bozzuto and Molinari, 2015). This is because hydrophobic molecules tend to
reside in the acyl chain regions within the bilayer rather than near the polar head
groups of phospholipids in the liposomes (Bozzuto and Molinari, 2015).
Cholesterol in DPPC bilayer modifies liposomal membrane properties particularly
molecular packing and bilayer fluidity and consequently impacts drug
incorporation into the bilayer especially for genistein. Differences in the
molecular structures of erlotinib and genistein seem to affect the orientation of the
drug molecules within the DPPC-based bilayer, reflected in differences in drug
incorporation for the two drugs at the same cholesterol contents. Specifically,
genistein appears to partition deeper than erlotinib within the bilayer in the
hydrocarbon chain region, such that changes in packing order of the DPPC bilayer
by cholesterol highly affected genistein incorporation.
Inclusion of 8 mol% cholesterol significantly reduced the variability in the
entrapment efficiencies for both drugs, indicating a more reproducible and stable
liposome production. Previously, research has shown cholesterol has a great effect
on bilayer and thermal properties in a concentration dependent manner (Demetzos,
2008; Monteiro et al., 2014). Cholesterol increases the number of gauche
configurations (kinks) in the phospholipid hydrocarbon chains at or below Tc (less
rigid), which is associated with an increased lipid mobility and permeability in the
gel phase compared to bilayers of the pure phospholipid (Cortijo and Chapman,

Chapter 4 Liposomes loaded with erlotinib and genistein
175
1981; Monteiro et al., 2014). By contrast, there is a decrease in the changes from
trans to gauche configuration in lipids above the Tc, causing a reduction in bilayer
fluidity and permeability in the fluid state (Cortijo and Chapman, 1981). The
steroid rings of cholesterol are dense, and incorporation of cholesterol into the
bilayer increases the density of hydrocarbon chains, decreases the fluidity, leading
to higher rigidity of the liposomal bilayer (Monteiro et al., 2014). This effect was
dependent on cholesterol concentration. At very high cholesterol concentration
(i.e. 50 mol%) and greater, the phospholipid phase transition is effectively
abolished (Cortijo and Chapman, 1981; Taylor and Morris, 1995).
Effect of cholesterol concentration on particle size distribution of
liposomes containing either erlotinib or genistein
Mean particle size was not significant different for sonicated liposome
formulations in the absence of cholesterol and those containing 8 mol% of
cholesterol (Figure 4-15, p>0.05). However, there was an increase in mean size
when cholesterol content was greater than 8 mol% for formulations containing
either erlotinib or genistein (p<0.05). These findings were in accordance with
previous reports of sonicated DPPC liposomes containing various cholesterol
concentrations, indicating a concentration-dependent effect on mean size (Lopez-
Pinto et al., 2005; Pattni et al., 2015). There was considerable variability in
measurement of the hydrodynamic diameter for higher cholesterol contents (15%
and 30% mole) particularly for erlotinib formulations. Moreover, some
aggregation was apparent at ambient temperature for 30 mol% of cholesterol for
both preparations, and also found for 15 mol% of cholesterol for erlotinib
formulations within 5 min. These observations may suggest a phase separation,
with a formation of cholesterol-rich domain. By contrast, there was no difference
in PDI values (p>0.05). These results show that 8 mol% cholesterol in bilayer
provides a restriction on the radius of vesicles that can be achieved by sonication.

Chapter 4 Liposomes loaded with erlotinib and genistein
176
Figure 4-15 Effect of cholesterol concentration on mean hydrodynamic diameter (nm) of DPPC liposomes containing erlotinib or genistein after 30 min sonication (n=3, mean± S.D.)
Cholesterol is frequently included in liposome bilayers to control drug release or
increase their in vivo and in vitro stability by stabilising the bioactive agent in the
core of the liposome (Taylor and Morris, 1995; Monteiro et al., 2014)). Based on
the findings for size stability and drug incorporation, a formulation including 8
mol% cholesterol was taken into further studies.
Effect of including DOPE on the properties of DPPC/Cholesterol
liposomes loaded with either erlotinib or genistein
The degree of fatty acid saturation influences the permeability and packing of the
phospholipid bilayer (Monteiro et al., 2014). Unsaturated lipids can have
increased spaces between the tightly packed hydrocarbon tails within a bilayer.
This may cause an increased bilayer fluidity and permeability compared with
saturated hydrocarbon chains (Monteiro et al., 2014).
DOPE has previously been used as an unsaturated lipid to alter the bilayer
packing and fluidity, thereby increasing the diffusivity and partitioning of
exogenous compounds (Phan et al., 2013; Joshi et al., 2014). Formulations
comprising DPPC and DOPE were not toxic upon inhalation, since DOPE acts as
0
50
100
150
200
250
300
350
400
0 8 15 30
Hy
dro
dy
nam
ic d
iam
eter
(nm
)
Cholesterol content (mol%)
Erlotinib
Genistein

Chapter 4 Liposomes loaded with erlotinib and genistein
177
a surfactant and is similar to the surfactant Protein-B (SP-B) present in
endogenous lung surfactant (Joshi et al., 2014). Furthermore, fusogenic lipid like
DOPE is usually used as a helper lipid in liposomes for enhancement of
membrane permeability and improvement in intracellular drug delivery, due to its
structural features. Consequently, DOPE, was considered in this study.
No studies have so far investigated the use of DPPC, cholesterol and DOPE for
the incorporation of erlotinib and/or genistein into liposomes for delivery by
pulmonary route. In this study, 20 mol% DOPE was initially studied based on a
previous report of genistein incorporation (Phan et al., 2013). Encapsulation
efficiency of erlotinib increased by approximately 16% (p<0.05) compared to
those without DOPE (Figure 4-16). Differences in drug incorporation between the
two drugs due to the inclusion of DOPE may be resulted from the orientation of
drug molecules and DOPE, as found for inclusion of cholesterol. This suggests
that the presence of 20% mole of this flexible unsaturated phospholipid (DOPE)
enhanced incorporation of both drugs and would potentially be advantageous for
the co-incorporation of erlotinib and genistein. However, the mole ratios between
DPPC, cholesterol and DOPE should be further investigated to allow
accommodation of both erlotinib and genistein molecules within the bilayer.
Figure 4-16 Effect of including DOPE on entrapment efficiency of 5% w/w erlotinib or 5% w/w genistein in DPPC: cholesterol (92:8) liposomes (n=3, mean ± S.D.)
0
10
20
30
40
50
60
Erlotinib Genistein
En
trap
men
t E
ffic
ien
cy (
%E
E)
Drug
Formulation Without
DOPE
Formulation With 20%
DOPE

Chapter 4 Liposomes loaded with erlotinib and genistein
178
Effect of sonication time on encapsulation efficiency of erlotinib or
genistein in liposomes
The mean size of DPPC: cholesterol: DOPE (72:8:20) liposomes containing either
erlotinib or genistein was reduced using probe-sonication from the initial size of
approximately 7µm. From 15 min to 30 min sonication, encapsulation efficiencies
of erlotinib and genistein evidently increased before remaining almost the same
level (Figure 4-17). Consequently, 30 min sonication was chosen based on the
high encapsulation efficiency of both drugs.
Figure 4-17 Effect of sonication time (min) on encapsulation efficiency (%EE) of 5% w/w erlotinib or 5% w/w genistein in DPPC: cholesterol: DOPE (72: 8: 20) liposomes (n=3, mean ± S.D.)
Characterisation of liposomes co-loaded with erlotinib and genistein
The inclusion of cholesterol (8 mol%) and DOPE (20 mol%) into DPPC bilayers
gave improvements in drug entrapment for both drugs individually (5% w/w drug
in total lipid). Since hydrophobic molecules are located within phospholipid
bilayer, not only lipid composition but also the drug-to-lipid ratio will impact
encapsulation efficiency (Bozzuto and Molinari, 2015; Chountoulesi et al., 2017).
In this study, the weight ratio of total lipid: drug was investigated to identify the
maximum drug incorporation for erlotinib and genistein when incorporated
0
10
20
30
40
50
60
70
15mins 30mins 45mins 60mins
% E
E
Sonication time (mins)
Erlotinib
Genistein
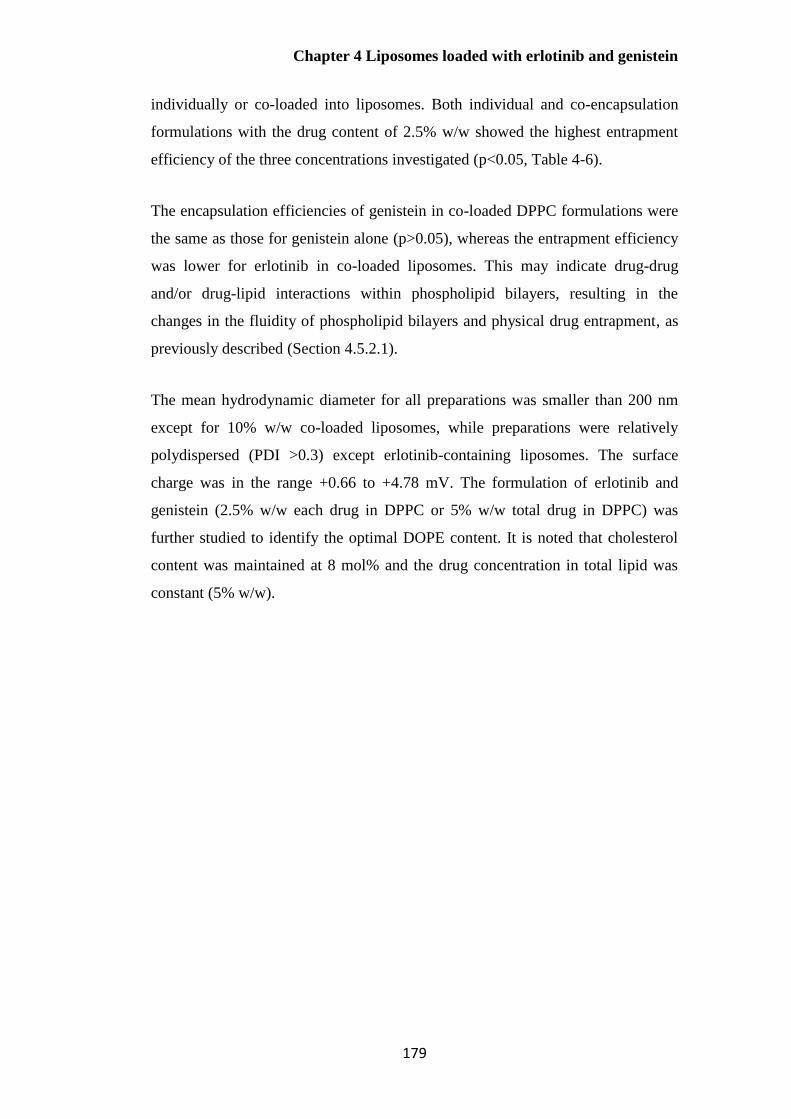
Chapter 4 Liposomes loaded with erlotinib and genistein
179
individually or co-loaded into liposomes. Both individual and co-encapsulation
formulations with the drug content of 2.5% w/w showed the highest entrapment
efficiency of the three concentrations investigated (p<0.05, Table 4-6).
The encapsulation efficiencies of genistein in co-loaded DPPC formulations were
the same as those for genistein alone (p>0.05), whereas the entrapment efficiency
was lower for erlotinib in co-loaded liposomes. This may indicate drug-drug
and/or drug-lipid interactions within phospholipid bilayers, resulting in the
changes in the fluidity of phospholipid bilayers and physical drug entrapment, as
previously described (Section 4.5.2.1).
The mean hydrodynamic diameter for all preparations was smaller than 200 nm
except for 10% w/w co-loaded liposomes, while preparations were relatively
polydispersed (PDI >0.3) except erlotinib-containing liposomes. The surface
charge was in the range +0.66 to +4.78 mV. The formulation of erlotinib and
genistein (2.5% w/w each drug in DPPC or 5% w/w total drug in DPPC) was
further studied to identify the optimal DOPE content. It is noted that cholesterol
content was maintained at 8 mol% and the drug concentration in total lipid was
constant (5% w/w).

Chapter 4 Liposomes loaded with erlotinib and genistein
180
Table 4-6 Effect of drug-to-lipid ratio (%w/w) on the properties of DPPC liposomes (n=3, mean± S.D.)
Concentration (%w/w
drug in lipid)
Formulation Entrapment
Efficiency (EE; %)
Mean particle
size (nm)
Polydispersity Index
(PDI)
Zeta Potential
(mV)
2.5% Erlo (Ind.) 32.53± 6.05 106.37± 1.84 0.25± 0.02 +4.78± 0.99
Erlo (Comb.) 14.65± 3.42 159.22± 19.42 0.44± 0.09 +2.42± 1.82
Gen (Ind.) 84.66± 2.70 139.03± 11.70 0.43± 0.02 +1.34± 0.77
Gen (Comb.) 90.03± 10.99 159.22± 19.42 0.44± 0.09 +2.42± 1.82
5% Erlo (Ind.) 13.20± 5.53 99.68± 2.18 0.22± 0.01 +4.78± 1.63
Erlo (Comb.) 7.02 ±1.13 200.07± 45.81 0.50±0.12 +2.35± 0.43
Gen (Ind.) 58.54± 8.06 158.17± 7.27 0.43± 0.05 +0.74± 0.46
Gen (Comb.) 71.48± 9.03 200.07± 45.81 0.50±0.12 +2.35± 0.43
10% Erlo (Ind.) 11.45± 10.70 106.67± 23.80 0.35± 0.17 +4.47± 2.09
Erlo (Comb.) 3.09± 0.87 317.8± 57.06 0.86± 0.16 +3.54± 0.26
Gen (Ind.) 24.05± 3.92 146.03± 16.49 0.51± 0.04 +0.66± 0.28
Gen (Comb.) 41.24± 6.74 317.8± 57.06 0.86± 0.16 +3.54± 0.26
*Ind = Individual formulation and Comb= Combination formulation

Chapter 4 Liposomes loaded with erlotinib and genistein
181
Based on preliminary experiments, the incorporations of 20 mol% of DOPE and 8
mol% of cholesterol into DPPC liposomes improved the entrapment efficiency for
erlotinib alone compared with the formulation without DOPE (p<0.05). Therefore,
the content of DOPE (0-40 mol% of total lipid contents) was varied to determine
the effect on co-loading of the two drugs. As seen in Table 4-7, there was no
significant difference in encapsulation efficiency for genistein when DOPE was
increased (p>0.05). By contrast, the highest drug entrapment (p<0.05) for
erlotinib (23.16%) was achieved in the presence of 20 mol% DOPE before
decreasing to approximately 12.5% EE (p<0.05). This may be because the
inclusion of DOPE at lower contents increases the fluidity of the bilayer and
consequently enhances drug incorporation. However, as higher concentrations of
DOPE (>20 mol%), the internal volume to accommodate both drugs is reduced
due to its localisation within bilayer. Hence, the formulation (DPPC: cholesterol:
DOPE, 72:8:20) was considered optimal and used for further studies. In terms of
mean hydrodynamic diameter, all formulations had mean size< 200 nm as desired.
Co-encapsulation of more than one drug into the same phospholipid bilayer may
alter the liposome properties such as drug entrapment, mean size and the
lipophilicity of membrane (Ingebrigtsen et al., 2017). There were significant
increase in mean hydrodynamic diameter and particle size distribution when
comparing liposomes co-loaded with erlotinib and genistein with those containing
erlotinib (p<0.05). Considering drug entrapment, encapsulation efficiencies of
erlotinib in co-loaded liposomes containing cholesterol (8 mol%) and DOPE (20
mol%) were significantly higher than co-loaded formulations without those two
molecules (p<0.05), suggesting that the incorporation of genistein in the presence
of cholesterol and DOPE into lipid bilayer may significantly alter the mobility and
permeability of the lipids within bilayer (Table 4-6 and Table 4-7). Genistein and
the other two molecules were expected to have a stronger association with the
lipid bilayer than erlotinib and be localised within both superficial and deep layer
of hydrocarbon chains. Hence, this effect may cause a change in membrane
properties, causing an enhanced incorporation of erlotinib within the aqueous part
and/or first few layers of fatty acyl chains of the liposomes.

Chapter 4 Liposomes loaded with erlotinib and genistein
182
To sum up, the co-delivery of erlotinib and genistein in liposomes comprising
DPPC, cholesterol and DOPE (mole ratio of 72:8:20) would be beneficial to
reduce the excipients used in individually prepared composition and potentially
simplify administration. This co-loaded formulation was therefore considered
appropriate for further studies.
Table 4-7 Effect of DOPE concentration (%w/w) on the properties of DPPC: cholesterol
(92:8) liposomes co-loaded with 2.5% w/w erlotinib and 2.5% w/w genistein in total lipid
(n=3, mean± S.D.)
Concentration
of DOPE
(%w/w drug
in lipid)
Drug Entrapment
Efficiency
(EE; %)
Mean
particle
size
(nm)
Polydispersity
Index (PDI)
Zeta
Potential
(mV)
0%
Erlotinib 12.87± 5.11
139.3±
16.18
0.42± 0.01
+1.88±
0.84
Genistein 88.26± 7.15
10 %
Erlotinib 11.96± 0.51
147.03±
38.41
0.52± 0.15
-2.18±
1.28
Genistein 99.34± 0.47
20%
Erlotinib 23.16± 2.08
128.00±
13.70
0.44± 0.05
-3.23±
0.05
Genistein 101.58±
12.72
30%
Erlotinib 16.67± 2.64
113.25±
7.58
0.37± 0.03
-7.31±
0.51
Genistein 96.07± 2.51
40%
Erlotinib 12.50± 0.76
102.69±
6.71
0.39± 0.02
-8.97±
0.54
Genistein 98.22± 0.90

Chapter 4 Liposomes loaded with erlotinib and genistein
183
Transmission electron microscopy
TEM images of co-loaded liposomes, size reduced by probe sonication, showed a
population of small spherical liposomes between 100 and 200 nm in diameter
(Figure 4-18). This was in good agreement with other previous reports of
multilamellar vesicles (MLVs) prepared by thin-film hydration method and
reduced size by probe-sonication (Bozzuto and Molinari, 2015; Pattni et al., 2015;
Rudokas et al., 2016).
Figure 4-18 TEM images of erlotinib and genistein co-loaded liposomes (a.) 17500 x and
(b.) 65000 x
Thermal analysis of liposomes
Differential Scanning Calorimetry (DSC), a highly sensitive thermal analytical
technique, has been used extensively to study liposomal systems, giving
information on drug-liposome interactions that may impact entrapment efficiency,
stability and drug release (Taylor and Morris, 1995; Budai et al., 2003; Demetzos,
2008; Chen et al., 2014). DSC is a quick, simple and relatively low-cost technique
compared with other thermoanalytical methods and provides accurate information
about melting point and melting range, glass transitions, interactions,
compatibility, decomposition, purity, and polymorphism based on changes on
thermotropic properties (Demetzos, 2008). For liposomes, changes in the thermal
a.) b.)

Chapter 4 Liposomes loaded with erlotinib and genistein
184
parameters of the lipid bilayers (i.e., Tm, HHW and ∆H) after incorporating drugs
are associated with drug-lipid interactions, the stability of the formulation, and the
percentage of active ingredient that can be incorporated into liposomal bilayer.
This information allows for rational formulation design and development
(Gardikis et al., 2006; Demetzos, 2008). In this study, calorimetric parameters,
namely the pre-transition temperature (Tpre), main transition temperature (Tm),
enthalpy (∆H) and half height width (HHW) were investigated to determine drug-
bilayer interactions and to determine the maximum drug incorporation into DPPC
bilayers for both individual and co-loaded formulations.
Effect of lipid concentrations on the DSC thermogram of liposomes
The lipid concentration was investigated to determine the lowest concentration of
DPPC yielding consistent and reproducible DSC results with good peak resolution.
This is beneficial to minimise the waste and cost for formulations with a high
content of expensive synthetic lipids. However, high concentrations of lipid may
be necessary to give a clear pre- and/or main transition peaks with measureable
enthalpies. DPPC liposomes were prepared (Section 4.4.2.1) and their reduced
size by probe-sonication to achieve final DPPC concentrations of 2.5, 20 and 40
mg/mL. These were scanned in the DSC at a rate of 1ºC/min. There was no
endothermic peak observed for the concentration of 2.5 mg/mL (data not shown).
A main phase transition peak was evident at 20 mg/mL, though a clear pre-
transition of DPPC was not present (data not shown).
Two different heating rates of 0.50 and 1.00°C/min with DPPC (40mg/mL) were
employed to obtain high resolution of DSC thermograms to allow accurate
calculation of Tpre, Tm, HHW and enthalpy. From previous reports, a slow scan
rate is recommended for a highly purified phosphatidylcholines (PCs) as it yields
high resolution and minimises broad and/or overlapping transitions (Sturtevant,
1987). Slower heating rates may however lead to low sensitivity, resulting in the
requirements for higher instrumental sensitivity (Sturtevant, 1987; Chiu and
Prenner, 2011). High Sensitivity Scanning Calorimeter (HSDSC) was thus
performed in this study to overcome these problems. Based on a preliminary study,
0.5°C/min was determined to be a suitable scanning rate since it gave the

Chapter 4 Liposomes loaded with erlotinib and genistein
185
expected thermal events with peaks for the main and pre-transition evident
(Figure 4-19), while there was no pre-transition apparent at 1.0 °C/min.
Figure 4-19 DSC thermogram of DPPC liposomes (40 mg/mL) scanned at 0.5 ºC/min
Thermal properties of DPPC liposomes reduced size by probe-
sonication method
As DSC is very sensitive and able to detect slight changes in bilayer properties,
DPPC liposomes (40 mg/mL) before and after size reduction were studied by
HSDSC with a scan rate of 0.5°C/min (Chiu and Prenner, 2011). For non-
sonicated DPPC liposomes, the values of thermal transitions such as a small broad
pre-transition at 36 ºC and a sharp acyl chain melting transition at 41 ºC are in
accordance with previous reports (Zhao et al., 2004; Wu et al., 2012; Hadian et al.,
2014).
The pre-transition corresponds to a change in the orientation of the polar head
groups of DPPC from a one-dimensional lamellar (Planar Gel Phase, Lβ’) to a
two-dimensional monoclinic lattice (Rippled Gel Phase, Pβ’) (Taylor and Morris,
1995; Beni et al., 2006; Elhissi et al., 2006b). Probe sonication of DPPC

Chapter 4 Liposomes loaded with erlotinib and genistein
186
liposomes prepared by the thin-film hydration method, resulted in a decrease in
the enthalpy of the pre-transition and main transition (p<0.05; Table 4-8). The
pre-transition temperature significantly increased from 36.55ºC to 39.36 ºC for
sonicated liposomes (p<0.05) as shown in Table 4-8, implying decreased mobility
in the head group region of DPPC (Beni et al., 2006).
Table 4-8 Thermal properties of sonicated and unsonicated DPPC liposomes (n=3, mean± S.D.)
Preparation
method
Pre-transition Main transition
1T pre
(ºC)
2ΔΗ
(KJ/mol)
3Tonset
(ºC)
4Tm (ºC) 5HHW
(ºC)
ΔΗ
(KJ/mol)
Sonicated 39.36±
0.29
2.29±
0.66
41.36±
0.09
42.74±
0.28
1.68±
0.16
37.35±
3.05
Non-
sonicated
36.55±
0.51
3.15±
1.28
41.54±
0.00
42.72±
0.27
1.62±
0.03
43.88±
0.89
1= The temperature of the pre-transition 2= Enthalpy 3= The onset temperature 4= The main temperature of the main transition 5= Half-height width
The onset temperature of the main transition (T0) and the temperature at the peak
(Tm), are commonly used to express the main lipid phase transition temperature
(Tc) when carbon-carbon single bonds change from the gel phase (all-trans
hydrocarbon chain configuration) to liquid-crystalline phase (some acyl chains
present in the gauche (kinked) conformation) (Taylor and Morris, 1995; Elhissi et
al., 2006b). In this study, T0 significantly decreased for sonicated liposomes
(p<0.05). Furthermore, the enthalpy values (main transition endotherm)
significantly decreased for both pre- and main transition when the size of DPPC
liposomes was reduced (p<0.05), suggesting the modifications to the ordered lipid
structure of the DPPC bilayers. These observations are in agreement with
previous reports for sonicated vesicles, indicating packing differences within the

Chapter 4 Liposomes loaded with erlotinib and genistein
187
hydrocarbon chains between the two preparations (Chiu and Prenner, 2011;
Hadian et al., 2014).
The width at half-peak (HHW) of the main transition indicates the hydrophobic-
hydrophobic interactions within hydrocarbon hydrophobic regions during the
transition. The increase in HHW of the main transition represents a reduction in
the packing order within the lipid chains, or an increase in the bilayer fluidity,
leading to a decrease in the overall transition cooperativity (Budai et al., 2003;
Saunders et al., 2007). HHW values for liposomes before and after sonication
were similar (p>0.05), indicating no measurable impact on the co-operative
movement of the rigid hydrocarbon chains.
Overall, liposomes reduced in size by probe-sonication showed some changes in
the enthalpies of transition and the melting of the hydrocarbon chains. The data
suggest that changes in thermal parameters result from the smaller radius of the
sonicated liposomes and disrupted packing of the bilayers, given the highly
curved membrane surface of the small sonicated liposomes. Changes in the
intermolecular distance between carbon-carbon bonds may affect adjacent
molecules, resulting in a reduction in main phase transition (Taylor and Morris,
1995; Beni et al., 2006).
Thermal properties of sonicated DPPC liposomes containing
different concentrations of erlotinib
DSC thermograms of erotinib-loaded DPPC liposomes at various drug contents
(2.5%, 5% and 10% w/w drug in lipid) and empty DPPC liposomes are shown in
Figure 4-20, with calculated parameters in Table 4-9. Two thermal events; the
pre-transition and main phase transition were measured for empty DPPC
liposomes, at 39.36 ºC and 42.74 ºC, respectively. With 2.5% w/w erlotinib,
thermograms still showed the pre-transition peak of DPPC liposomes at 39.21 ºC,
whereas this transition disappeared at high contents of erlotinib. Since the pre-
transition is particularly sensitive when additives are included, the loss of this
peak cannot be attributed to any specific molecular changes (Budai et al., 2003;
Elhissi et al., 2006b; Zhao et al., 2007). The disappearance of this peak at

Chapter 4 Liposomes loaded with erlotinib and genistein
188
concentrations higher than 2.5% implies the presence of erlotinib in the
phospholipid head group interfacial region. This observation was previously
reported for DPPC liposomes after incorporating hydrophobic and amphiphilic
materials (Zhao et al., 2004; Elhissi et al., 2006b).
Figure 4-20 DSC thermograms of a) 10%, b) 5%, c) 2.5% erlotinib-incorporated into DPPC liposomes and d) DPPC liposomes
There was no significant change in Tc for all loadings of erotinib compared with
DPPC liposomes (Table 4-9, p>0.05). The inclusion of erlotinib for the three
concentrations investigated did not cause a change in enthalpy (p>0.05),
indicating no significant impact on the main phase transition. The inclusion of
2.5%, 5% and 10% w/w erlotinib significantly increased the HHW values of
DPPC liposomes (p<0.05), suggesting a reduction in the overall transition
cooperativity, though there was no difference in HHW between the concentrations.
This parameter can be used to estimate the maximum level of drug incorporation
by either the concentration above which phase separation occurs, or at which no
further changes in the main phase transition (Elhissi et al., 2006b). This data was
not sufficient to define the precisely maximum erlotinib incorporation;
concentrations lower than 2.5% w/w require further studies. Increasing the
amount of erlotinib to 10% gave the lowest enthalpy (p<0.05), possibly due to
phase separation and/or generation of an unstable formulation. Based on these

Chapter 4 Liposomes loaded with erlotinib and genistein
189
DSC results, it seems that erlotinib may be located in the upper region of
hydrocarbon chains in the bilayer, close to the polar head groups (Beni et al.,
2006).

Chapter 4 Liposomes loaded with erlotinib and genistein
190
Table 4-9 Thermal properties of erlotinib-loaded DPPC liposomes at concentrations between 2.5% and 10% w/w drug in total lipid (n=3, mean± S.D.)
Erlotinib content
(%w/w)
Pre-transition
temperature (ºC)
Main transition
Tpre ( ºC) Tonset ( ºC) Tm (ºC) HHW (ºC) ∆H
(KJ/mol)
%EE Mean particle
size (nm)
PDI
DPPC 39.36± 0.29 41.36± 0.09 42.74± 0.28 1.68± 0.16 37.35± 3.06 - 109.05± 7.50 0.36±
0.03
2.5% 39.21± 0.28 41.50± 0.11 42.73± 0.27 2.26± 0.11 39.30± 1.50 32.53± 6.05 106.37± 1.84 0.25±
0.02
5% - 41.43± 0.21 42.54± 0.01 2.27± 0.18 36.73± 2.61 13.20± 5.53 99.68± 2.18 0.22±
0.01
10% - 41.25± 0.13 42.54± 0.01 2.39± 0.05 28.29± 2.06 2.23± 2.58 122.13±
15.35
0.37±
0.23
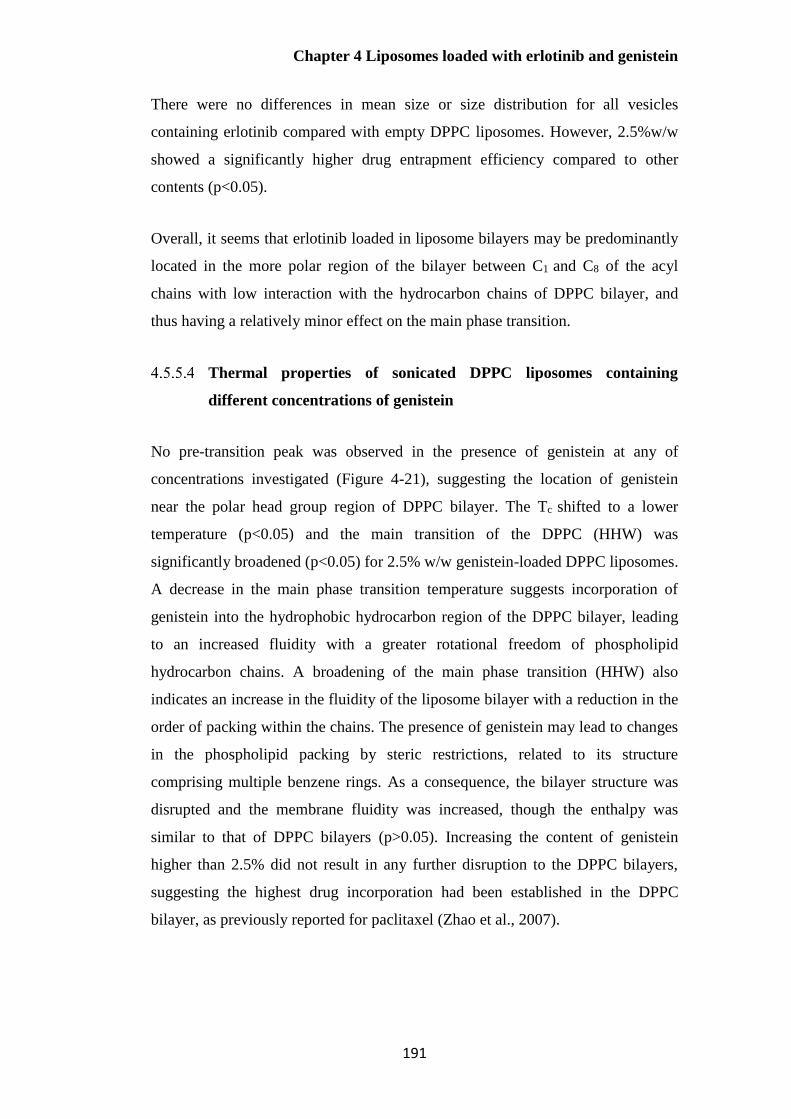
Chapter 4 Liposomes loaded with erlotinib and genistein
191
There were no differences in mean size or size distribution for all vesicles
containing erlotinib compared with empty DPPC liposomes. However, 2.5%w/w
showed a significantly higher drug entrapment efficiency compared to other
contents (p<0.05).
Overall, it seems that erlotinib loaded in liposome bilayers may be predominantly
located in the more polar region of the bilayer between C1 and C8 of the acyl
chains with low interaction with the hydrocarbon chains of DPPC bilayer, and
thus having a relatively minor effect on the main phase transition.
Thermal properties of sonicated DPPC liposomes containing
different concentrations of genistein
No pre-transition peak was observed in the presence of genistein at any of
concentrations investigated (Figure 4-21), suggesting the location of genistein
near the polar head group region of DPPC bilayer. The Tc shifted to a lower
temperature (p<0.05) and the main transition of the DPPC (HHW) was
significantly broadened (p<0.05) for 2.5% w/w genistein-loaded DPPC liposomes.
A decrease in the main phase transition temperature suggests incorporation of
genistein into the hydrophobic hydrocarbon region of the DPPC bilayer, leading
to an increased fluidity with a greater rotational freedom of phospholipid
hydrocarbon chains. A broadening of the main phase transition (HHW) also
indicates an increase in the fluidity of the liposome bilayer with a reduction in the
order of packing within the chains. The presence of genistein may lead to changes
in the phospholipid packing by steric restrictions, related to its structure
comprising multiple benzene rings. As a consequence, the bilayer structure was
disrupted and the membrane fluidity was increased, though the enthalpy was
similar to that of DPPC bilayers (p>0.05). Increasing the content of genistein
higher than 2.5% did not result in any further disruption to the DPPC bilayers,
suggesting the highest drug incorporation had been established in the DPPC
bilayer, as previously reported for paclitaxel (Zhao et al., 2007).

Chapter 4 Liposomes loaded with erlotinib and genistein
192
Figure 4-21 DSC thermograms of a) 10%, b) 5% and c) 2.5% genistein-loaded DPPC liposomes
Table 4-10 shows that the mean hydrodynamic diameter increased when genistein
was incorporated into DPPC vesicles (p<0.05), suggesting that physically-
encapsulated genistein could expand the space within the DPPC bilayer. However,
there were no differences in particle size and size distribution between the three
genistein formulations. A content of 2.5% w/w gave the highest genistein
encapsulation efficiency (p<0.05) and this may explain why particle size and size
distribution of formulations loading at higher contents of genistein were similar
(p>0.05) to that at 2.5% w/w.
These DSC results suggest that the maximum drug incorporation into DPPC
liposomes was 2.5% w/w. Furthermore, genistein is likely localised within
hydrophobic interior of the lipid membrane and close to the polar head groups of
DPPC since it significantly decreased the peak melting temperature of DPPC and
the size of co-operative unit within bilayer and eliminated the pre-transition phase
of DPPC vesicles.
a)
b)
c)

Chapter 4 Liposomes loaded with erlotinib and genistein
193
Table 4-10 Thermal properties of genistein-loaded DPPC liposomes at concentrations between 2.5% and 10% w/w drug in total lipid (n=3, mean± S.D.)
Genistein-
content (%w/w)
Pre-transition
(ºC)
Main transition
Tpre ( ºC) Tonset ( ºC) Tm (ºC) HHW (ºC) ∆H
(KJ/mol)
%EE Mean particle
size (nm)
PDI
DPPC 39.36± 0.29 41.36± 0.09 42.74± 0.28 1.68± 0.16 37.35± 3.06 - 109.05± 7.50 0.36±
0.03
2.5% - 39.81± 0.34 41.63± 0.22 2.29± 0.11 40.53± 1.01 84.66± 2.70 139.03±
11.70
0.43±
0.02
5% - 41.10± 0.22 42.34± 0.28 1.86± 0.08 41.68± 1.58 58.54± 8.06 158.17± 7.27 0.43±
0.05
10% - 40.67± 0.18 41.83± 0.27 1.88± 0.04 40.30± 1.28 24.05± 3.92 146.03±
16.49
0.51±
0.04

Chapter 4 Liposomes loaded with erlotinib and genistein
194
Thermal properties of DPPC liposomes containing co-loaded
erlotinib and genistein of different concentrations
No pre-transition peak was observed for formulations co-loaded with erlotinib and
genistein investigated (2.5% and 5% of each), which may be attributed
particularly to the inclusion of genistein (Figure 4-22). The onset and peak
temperature of the main transition for 2.5% w/w co-loaded liposomes
significantly decreased (p<0.05) compared with empty DPPC liposomes. A
significant increase in HHW (p<0.05) was detected for the lower concentration of
drugs. These suggest an increased fluidity of the DPPC bilayer with a reduction in
the overall transition cooperativity. However, both concentrations of co-loaded
DPPC liposomes had the same enthalpy for the main transition as DPPC (p>0.05).
Including erlotinib and genistein beyond 2.5% w/w did not show any further
changes in the main phase transition of DPPC vesicles, suggesting 2.5% w/w
erlotinib and 2.5% w/w genistein were the maximum drug incorporations into the
DPPC bilayer.
Figure 4-22 DSC thermograms of a) 5% erlotinib and 5% genistein and b) 2.5% erlotinib and 2.5% genistein co-loaded DPPC liposomes and c) DPPC liposomes

Chapter 4 Liposomes loaded with erlotinib and genistein
195
Loading drugs into DPPC liposomes increased their mean hydrodynamic diameter
(p<0.05, Table 4-11); however, the mean size and size distribution of both co-
loaded formulations were similar. These observations can be explained as for
genistein-loaded DPPC formulations (Section 4.5.5.4). When considering drug
entrapment, 2.5% of each drug showed greatest encapsulation efficiencies. These
results suggest that 2.5% w/w each drug co-incorporated into DPPC was the
maximum drug incorporation in the DPPC bilayer.

Chapter 4 Liposomes loaded with erlotinib and genistein
196
Table 4-11 Effect of erlotinib and genistein content (2.5% and 5% w/w each drug) on the thermal properties of co-loaded DPPC liposomes (n=3, mean± S.D.)
Combined drug
content (%w/w)
Pre-transition
(ºC)
Main transition
Tpre ( ºC) Tonset( ºC) Tm (ºC) HHW (ºC) ∆H (KJ/mol) %EE Mean
particle size
(nm)
PDI
DPPC 39.36± 0.29 41.36± 0.09 42.74±
0.28
1.68± 0.16 37.35± 3.06 - 109.05± 7.50 0.36±
0.03
2.5%/ 2.5% - 39.42± 0.14 41.34±
0.28
2.40± 0.07 40.02± 0.69 14.65±
3.42 (Erlo)
90.03±
10.99
(Gen)
159.22±
19.42
0.44±
0.09
5%/ 5% - 41.10± 0.20 42.04±
0.00
1.86± 0.05 42.74± 1.58 7.02± 1.13
(Erlo)
71.48±
9.03 (Gen)
200.07±
45.81
0.50±
0.12

Chapter 4 Liposomes loaded with erlotinib and genistein
197
When the thermograms of DPPC liposomes containing erlotinib, genistein and co-
loaded (2.5% each drug) were compared, the shape of the DSC curve and phase
transition behaviour for genistein and co-loaded formulations were similar (Figure
4-23), suggesting that the inclusion of genistein had the more pronounced effect
on the thermal properties of co-loaded liposomes.
Figure 4-23 DSC thermogram of a) 2.5% erlotinib and 2.5% genistein co-loaded DPPC liposomes, b) 2.5% genistein-loaded DPPC liposomes, c) 2.5% erlotinib-loaded DPPC liposomes and d) DPPC liposomes
The mean hydrodynamic diameter and size distribution for genistein and co-
loaded liposomes (2.5% w/w of each drug) were similar (p>0.05, Table 4-12).
The encapsulation efficiencies of genistein in individual and co-incorporated
formulations were very similar (p>0.05), whereas drug entrapment decreased
approximately two- fold for erlotinib in combined liposomes, from approximately
33% to 15% EE (p<0.05).

Chapter 4 Liposomes loaded with erlotinib and genistein
198
Table 4-12 Effect of genistein and erlotinib alone or co-loaded at 2.5% w/w drug in lipid on the thermal properties of DPPC liposomes (n=3, mean± S.D.)
Drug-to-DPPC ratio
(%w/w)
Pre-transition
(ºC)
Main transition
Tpre ( ºC) Tonset( ºC) Tm (ºC) HHW (ºC) ∆H (KJ/mol) %EE Mean
particle size
(nm)
PDI
2.5% Erlotinib 39.21± 0.28 41.50± 0.11 42.70±
0.26
2.27± 0.10 39.30± 1.50 32.53±
6.05
106.37± 1.84 0.25±
0.02
2.5% Genistein - 39.81± 0.34 41.63±
0.22
2.29± 0.11 40.53± 1.01 84.66±
2.70
139.03±
11.70
0.43±
0.02
2.5% Co-loaded - 39.42± 0.14 41.34±
0.28
2.40± 0.07 40.02± 0.69 14.65±
3.41 (Erlo)
90.03±
10.99
(Gen)
159.22±
19.42
0.44±
0.09

Chapter 4 Liposomes loaded with erlotinib and genistein
199
Due to the earlier findings that suggested genistein was localised both in the
hydrophobic hydrocarbon chains of lipid bilayer and adjacent to the water-lipid
interface (Section 4.5.5.4), this may limit penetration of erlotinib into the acyl
chain region of the bilayer and/or the available polar head groups of DPPC. When
the molecular structures of the two drugs are compared, the three –OH groups on
the aromatic rings of genistein are easily protonated and will form a stronger ionic
bonding with the amine and/or phosphate group of DPPC molecules, whereas the
three nitrogen atoms and oxygen atom from quinazolinamine ring and
methoxyethoxy chains of erlotinib will have weaker ionic interaction with the
polar region of the phospholipids. These suggest the exclusion of erlotinib by the
others.
Thermal properties of DPPC liposomes containing cholesterol and
DOPE
No pre-transition phase was observed for DPPC liposomes containing cholesterol
and/or DOPE, implying the presence of these molecules at the interfacial region.
The phase transition temperature shifted to lower values when 8 mol% cholesterol,
20 mol% DOPE and 8 mol% cholesterol + 20 mol% DOPE were incorporated
into DPPC liposomes (Figure 4-24), indicating greater freedom rotation of
hydrocarbon chains within bilayer. The enthalpy decreased significantly and the
main phase transition noticeably broadened (HHW) as reported in Table 4-13.
This suggests that these molecules were inserted into the hydrophobic region of
the DPPC bilayer. As cholesterol contains a tricyclic ring, hydrocarbon chains and
hydroxyl group, the tricyclic ring was localised between the first few carbons of
the fatty acyl chains into the hydrophobic core of DPPC bilayer and the
hydrocarbon chains aligned parallel to acyl chains of DPPC phospholipid bilayer,
while, its hydroxyl group orients towards the polar interface (Taylor and Morris,
1995; Bhattacharya and Haldar, 2000; Monteiro et al., 2014). For DOPE, this
molecule comprises two longer hydrocarbon chains as compared to cholesterol.
DOPE acyl chains (18-C) would be expected to align across the acyl chains of
DPPC bilayer, while its phosphatidyl ethanolamine head group would orient
towards the aqueous phase. Consequently, the inclusion of 20 mol% of DOPE
seems have more pronounced effect on hydrophobic hydrocarbon chains of DPPC

Chapter 4 Liposomes loaded with erlotinib and genistein
200
bilayer than 8 mol% cholesterol, due to stronger hydrophobic-hydrophobic
interaction associated with their structures.
Figure 4-24 DSC thermogram of a) DPPC, b) DPPC with 8% cholesterol, c) DPPC with 20% DOPE and d) DPPC with 8% cholesterol and 20% DOPE
Table 4-13 Thermal properties of DPPC liposomes in the presence of cholesterol, DOPE,
and cholesterol with DOPE (n=3, mean± S.D.)
Formulations
Pre-
transition
(ºC)
Main transition
Tpre (ºC) Tonset (ºC) Tm (ºC) HHW
(ºC)
∆H
(KJ/mol)
DPPC 39.36±
0.29
41.36±
0.09
42.74±
0.28
1.68±
0.16
37.35±
3.06
DPPC + 8%
cholesterol
- 40.29±
0.23
42.54±
0.00
2.83±
0.35
27.93±
1.21
DPPC + 20%
DOPE
- 28.63±
0.11
36.54±
0.00
8.09±
0.09
18.86±
0.62
DPPC + 8%
cholesterol +
20% DOPE
- 26.48±
0.45
36.37±
0.58
10.87±
0.24
12.14±
1.42

Chapter 4 Liposomes loaded with erlotinib and genistein
201
Thermal properties of erlotinib-incorporated into DPPC liposomes
with and without genistein, cholesterol and DOPE
A decrease in the main transition temperature and enthalpy was observed (Figure
4-25), while DSC endotherm broadened in the presence of genistein (2.5%
erlotinib and 2.5% genistein co-loaded DPPC liposomes), 8 mol% cholesterol+ 20
mol% DOPE (2.5% erlotinib formulation) and genistein+ 8 mol% cholesterol+ 20
mol% DOPE (2.5% erlotinib and 2.5% genistein co-loaded formulation) within
DPPC bilayer. These observations indicated modifications in the ordered lipid
structure of the DPPC bilayer, which can result in the greater thermotropic
changes in main transition phase. As the pre-transition phase was eliminated,
these findings supported the molecular interactions of exogenous compounds with
the DPPC head group. All combined results suggested that the inclusion of
biomolecules into liposomes was located within hydrophobic hydrocarbon chains
of the bilayer and/or adjacent to the interface of liposomes.
Figure 4-25 DSC thermograms of a) 2.5% erlotinib-loaded DPPC liposomes, b) 2.5% erlotinib and 2.5% genistein co-loaded DPPC liposomes, c) 2.5% erlotinib-loaded DPPC/cholesterol/DOPE liposomes and d) 2.5% erlotinib and 2.5% genistein co-loaded DPPC/cholesterol/DOPE liposomes
The mean particle size and polydispersity index increased for 2.5% erlotinib-
loaded DPPC/cholesterol/DOPE liposomes, 2.5% erlotinib and 2.5% genistein co-

Chapter 4 Liposomes loaded with erlotinib and genistein
202
loaded DPPC liposomes, and 2.5% erotinib and 2.5% genistein co-loaded
DPPC/cholesterol/DOPE liposomes as compared to 2.5% w/w erlotinib-loaded
DPPC liposomes (Table 4-14), supporting the incorporation of these biomolecules
into bilayer. The entrapment efficiency of erlotinib in DPPC formulations
significantly decreased when cholesterol and DOPE were included (p<0.05). As
cholesterol and DOPE were expected to orient parallel acyl chains of DPPC
bilayer and towards the interfacial region, this may lead to a reduced space within
the bilayer to accommodate erlotinib. Also, the addition of only genistein (2.5%
erlotinib and 2.5% genistein co-loaded DPPC liposomes) decreased the
encapsulation efficiency of erlotinib as that of cholesterol and DOPE.
By contrast, erlotinib incorporation noticeably increased when genistein,
cholesterol and DOPE were included together (p<0.05). This observation suggests
that genistein in the presence of cholesterol and DOPE had the greatest impact on
bilayer properties in a fluid state (T>Tm), resulting in more mobile and flexible
structure of acyl chains. This fluid state of lipid membrane appears to have
allowed incorporation of erlotinib within bilayer to a greater extent during the
formation of liposomes.

Chapter 4 Liposomes loaded with erlotinib and genistein
203
Table 4-14 Characteristics of erlotinib liposomal formulations at 2.5% w/w drug in total
lipids (n=3, mean± S.D.)
Erlotinib in different
formulations (2.5% w/w
drug in lipids)
Encapsulation
Efficiency (%
EE)
Mean particle
size (nm)
PDI
Erlotinib-loaded DPPC
liposomes
32.53± 6.05 106.37± 1.84 0.25± 0.02
Erlotinib-loaded
DPPC+cholesterol+DOPE
liposomes
14.20± 5.44 150.77± 37.28 0.36± 0.08
Erlotinib and genistein
co-loaded DPPC
liposomes
14.65± 3.42 159.22± 19.42 0.44± 0.09
Erlotinib and genistein
co-loaded
DPPC+cholesterol+
DOPE liposomes
23.16± 2.08 128.00± 13.70 0.44± 0.05
Thermal properties of genistein-incorporated into DPPC liposomes
with and without erlotinib, cholesterol and DOPE
For genistein, the trends in DSC endotherm were similar to those with erlotinib
incorporation in DPPC/cholesterol/DOPE liposomes (Figure 4-26).

Chapter 4 Liposomes loaded with erlotinib and genistein
204
Figure 4-26 DSC thermograms of a) 2.5% genistein-loaded DPPC liposomes, b) 2.5% genistein and 2.5% erlotinib co-loaded DPPC liposomes, c) 2.5% genistein-loaded DPPC/cholesterol/DOPE liposomes and d) 2.5% genistein and 2.5% erlotinib co-loaded DPPC/cholesterol/DOPE liposomes
There was no significant difference in mean size, polydispersity index and
encapsulation efficiency for all formulations shown in Table 4-15 (p>0.05).
Encapsulation efficiency of genistein was similar for 2.5% genistein-loaded
DPPC liposomes, 2.5% genistein-loaded DPPC/cholesterol/DOPE liposomes and
2.5% genistein and 2.5% erlotinib-loaded DPPC liposomes (p>0.05). However,
genistein entrapment showed the highest value when erlotinib, cholesterol and
DOPE were included.
.

Chapter 4 Liposomes loaded with erlotinib and genistein
205
Table 4-15 Characteristics of genistein-loaded liposomal formulations at 2.5% w/w drug in total lipids (n=3, mean± S.D.)
Genistein in different
formulations (2.5% w/w
drug in lipids)
Encapsulation
Efficiency (%
EE)
Particle size
(nm)
Polydispersity
Index (PDI)
Genistein-loaded DPPC
liposomes
84.66± 2.70 139.03± 11.70 0.43± 0.02
Genistein-loaded
DPPC+cholesterol+DOPE
liposomes
83.78± 4.62 136.87± 13.19 0.45± 0.09
Erlotinib and genistein
co-loaded DPPC
liposomes
90.03± 10.99 159.22± 19.42 0.44± 0.09
Erlotinib and genistein
co-loaded
DPPC+cholesterol+
DOPE liposomes
101.58± 12.72 128.00± 13.70 0.44± 0.05
Thus, the DSC results suggest that the co-incorporation of erlotinib and genistein
into DPPC bilayer disrupted the packing order of the acyl chain region and
increased the bilayer fluidity resulting in changes in the main phase transition (Tm,
HHW and ∆H). Also, cholesterol and DOPE were incorporated within
hydrophobic hydrocarbon chains of DPPC bilayer and the polar regions of both
molecules was oriented towards the water phase based on their structures. The
properties of lipids in liposomes in terms of their Tm is a crucial parameter to
consider for pre-formulation studies of these delivery systems. Tm for the
optimised formulation was approximately body temperature and this can ensure
that drug would not escape or leak out from bilayer before reaching the target site
under physiological conditions (T ≈37ºC).
All the combined data confirm the successful co-incorporation of erlotinib and
genistein into DPPC /cholesterol/DOPE liposomes up to approximately 10% for

Chapter 4 Liposomes loaded with erlotinib and genistein
206
erlotinib and 100% for genistein. This developed formulation would be
advantageous for further formulation development since excipients quantities are
less than for two individual formulations. Consequently, DPPC/cholesterol/DOPE
co-loaded liposomes with erlotinib and genistein were considered for further
investigations in the following chapter.
Conclusion
DPPC liposomes containing either erlotinib or genistein and in combination (2.5-
10% w/w) were successfully prepared by thin-film hydration and size reduced by
probe-sonication. A validated HPLC analysis for the co-quantification of this
combination was achieved following ICH guideline. The HPLC results showed
that the maximum incorporation of individual and co-loaded drugs in DPPC
liposomes was 2.5% w/w.
DSC proved a valuable tool for understanding the interaction between formulation
components in the liposome bilayers. The DSC thermograms of the drug-loaded
liposomes showed changes in the main phase transition peak width, main
transition and onset temperature, and the disappearance of the pre-transition peak
compared to the empty liposomes. This suggests that both drug molecules were
located close to the upper regions of the hydrophobic chains and polar head group
of DPPC bilayers. Incorporation of 2.5% w/w drug individually and co-loaded
into the liposomes resulted in higher HHW values and a decrease in phospholipid
phase transition temperature. This suggests that the fluidity of bilayer was
increased, caused by the reduced order of packing of phospholipid molecules in
the presence of both drugs individually and in combination. Furthermore,
genistein in the presence of cholesterol and DOPE have pronounced effects on
bilayer fluidity and subsequently enhanced drug entrapment for erlotinib.
Multichannel differential scanning calorimetry (MCDSC) was able to provide
information for a better understanding of the molecular interactions between drugs
and lipids within the phospholipid bilayer membrane. This analysis also helps to
determine maximum drug incorporation for designing and optimising liposomal
formulations.

Chapter 5 Aerosol properties of liposomes loaded with erlotinib and genistein
207
Chapter 5 Aerosol properties of
liposomes loaded with erlotinib and
genistein

Chapter 5 Aerosol properties of liposomes loaded with erlotinib and genistein
208
Introduction
For delivery of liposomes, air-jet and vibrating-mesh nebulisers are considered
more effective than ultrasonic devices, causing less disruption of the liposomal
bilayers. (Elhissi et al., 2012; Elhissi et al., 2013). Air-jet nebulisers may result in
significant leakage of entrapped hydrophilic drug from liposomes because of the
shearing forces within the nebuliser, though drug losses can be reduced by
incorporating cholesterol to make fluid-state bilayers more rigid, and by reducing
the size of the liposomes being aerosolised (Bridges and Taylor, 2000; Cipolla et
al., 2013; Lehofer et al., 2014). There are only minor losses of lipophilic drugs
since hydrophobic materials remain incorporated within the liposome bilayer
during air-jet nebulisation (Elhissi et al., 2011a; Cipolla et al., 2013; Elhissi et al.,
2013). Vibrating-mesh nebulisers have been reported to minimise hydrophilic
drug loss from liposomes compared to other nebulisers, and thus have been
proposed as particularly suitable devices for liposome delivery (Elhissi et al.,
2006a; Elhissi et al., 2012; Elhissi et al., 2013).
As outlined in Chapter 1, the Andersen Cascade Impactor (ACI), the Next
Generation Impactor (NGI) and the Multistage liquid impinger (MSLI) are full
cascade impactors comprising a series of stages that fractionate aerosolised
sample based on the aerodynamic size distribution of aerosols delivered by
pMDIs and DPIs, though only the NGI is routinely used for the determination of
the aerosol properties of nebulised aerosols. However, low dose formulations
including formulations with potent drugs are challenging for analytical
quantification due to the small amounts of drug deposited across the eight stages
of the NGI.
It has been proposed that the measurement of coarse and fine particle fractions
obtained with an abbreviated impactor may be useful to describe the behaviour of
aerosolised products, supplementing data from a full cascade impactor.
Abbreviated Impactor Measurement (AIM) using an impactor with only 2 or 3
stages representing coarse and fine particle doses/fractions, has been proposed for
routine quality control as well as for product development applications of orally
inhaled products. However, removal of the stages may possibly affect the whole

Chapter 5 Aerosol properties of liposomes loaded with erlotinib and genistein
209
particle size distribution of an aerosol cloud due to particle losses to internal
surface of an abbreviated impactor (Mitchell et al., 2009a).
Three abbreviated impactors have been described (Figure 5-1); namely the Fast
Screening Andersen (FSA), Reduced Next Generation Impactor (rNGI) and the
Fast Screening Impactor (FSI).
Figure 5-1 Commercially available abbreviated impactors
Of the three abbreviated impactors, the Fast Screening Impactor (FSI; Figure 1-
15), which has been developed by Copley Instrument as a simple and labour-
saving approach for the in-vitro characterisation of FPD/FPF for pMDIs and DPIs,
was investigated with nebulisers in this study, for two main reasons. Firstly, the
FSI has only two collecting stages with the cut-off diameter of 5 µm between
upper and lower stages, and there was no modification of the internal surfaces of
the impactor as required for the rNGI. However, the use of the FSI for aerosol
characterisation has not been investigated widely and no abbreviated impactors
are currently included in the European, United States or Japanese Pharmacopoeias.
Aims
1. To investigate the FSI as an alternative impactor to the NGI for aerosol
characterisation of nebulised liposomes co-loaded with erlotinib and genistein
using the same operating conditions.
Fast-Screening Andersen
(C-FSA): A three-stage
abbreviated system
Fast-Screening Impactor
(FSI): A two-stage system
Reduced Next Generation
Impactor (rNGI):
Ø The filter-only
configuration (rNGI-f)
Ø The modified-cup
configuration (rNGI-mc)
Abbreviated Impactors

Chapter 5 Aerosol properties of liposomes loaded with erlotinib and genistein
210
2. To investigate the effects of the method for aerosolisation (nebuliser system,
flow rates), impactor conditions (temperature) and properties of co-loaded
liposomes (size reduction by either probe sonication or extrusion) on the
aerosol properties determined using the FSI.
Materials
The materials used in the preparation of erlotinib and genistein co-loaded
liposomes and for the reversed-phase HPLC method allowing simultaneous
determination of this drug combination are outlined in Section 4.3.
Methods
Assessment of aerosol properties using the Next Generation Impactor
(NGI)
Effect of lipid concentrations on measured aerosol properties
The aim of this study was to investigate the optimal drug and lipid concentrations
to allow accurate quantification of low drug contents when characterising
nebulised liposomes using a full cascade impactor. Liposomal preparations: 2.5%
w/w erlotinib and 2.5% w/w genistein co-loaded into DPPC, cholesterol and
DOPE (72:8:20 % mole ratio) liposomes, were prepared using the thin-film
hydration method described in Section 4.4.2.1. In this study, drug and lipid
concentrations were increased proportionately in comparison with the formulation
described in chapter 4. The lipid concentration was increased from 2.5 mg/mL to
20 mg/mL, while the drug: lipid ratio was maintained (2.5% w/w erlotinib and
2.5% w/w genistein in lipids). To ensure that increased concentrations did not
affect formulation properties, the following were determined: hydrodynamic
diameter, surface charge and encapsulation efficiency (as described in Sections
4.4.3.1, 4.4.3.2 and 4.4.3.4, respectively).

Chapter 5 Aerosol properties of liposomes loaded with erlotinib and genistein
211
Effect of nebuliser fill volume on measured aerosol properties
After cooling the NGI at 5± 3 °C for at least 90 min, 2 mL or 4 mL of the final
liposome formulation (lipid concentration = 20 mg/mL) was added into Pari LC®
Sprint air-jet nebuliser and nebulisation conducted for 5 and 10 min, respectively
at a flow rate of 15 L/min generated by a Pari TurboBoy compressor (Section
3.4.6). The duration of aerosolisation was based on the time to nebulise to dryness
this fill volume using water (Section 3.5.5). Deposited erlotinib and genistein
were collected by rinsing with absolute ethanol including the nebuliser reservoir,
induction port, NGI collection cups and back-up filter as outlined in Section 3.4.7
and then assayed by the simultaneous HPLC method as described in Section
4.4.1.1.
Optimal conditions for characterising nebulised liposomes using the
NGI
The Pari LC® Sprint air-jet and Pari Velox® vibrating-mesh nebulisers were
filled with 4 mL of liposomal suspension (containing 1.0 mg/mL erlotinib and 10
mg/mL genistein) which was nebulised into the NGI at an air flow rate of 15
L/min for 10 min, after cooling the impactor for at least 90 min at 5± 3 ºC. All
collected samples from the induction port and collection cups across the impactor
were made up to 5 mL with ethanol, whereas the volume of absolute ethanol for
rinsing the nebuliser reservoir was 10 mL, prior to simultaneous HPLC assay.
Aerosolisation parameters included mass balance, emitted dose (ED), Fine
Particle Dose (FPD) and Fine Particle Fraction (FPF) were calculated as
mentioned in Chapter 3.
Assessment of aerosol properties using the Fast Screening Impactor
(FSI)
The Fast Screening Impactor (FSI; Copley Scientific, UK) was employed using
the same operating conditions as for the NGI. The effect of air-flow rate, impactor
temperatures and nebuliser types on aerosol properties were studied as outlined in
Sections 5.4.2.1 to 5.4.2.3. Nebulisation of liposomes co-loaded with erlotinib and

Chapter 5 Aerosol properties of liposomes loaded with erlotinib and genistein
212
genistein (4 mL) was conducted using an air-jet nebuliser into the cooled FSI,
through the induction port, at a flow rate of 15 L/min for 10 min. After
nebulisation, the FSI was dismantled and quantification of deposited drugs was
determined by HPLC analysis from the nebuliser reservoir, mouthpiece,
mouthpiece adapter, induction port, additional insert of the FSI housing and back-
up filter together with the filter holder using appropriate volumes of absolute
ethanol. 10 mL of absolute ethanol was used for rinsing nebulised liposomes in
the nebuliser reservoir and the additional insert of the FSI, whereas the induction
port and a back-up filter with filter holder required 5 mL of solvent. Fine Particle
Dose (FPD) and Fine Particle Fraction (FPF) for the FSI were calculated as
follows:
Fine Particle Dose (FPD) = Drug mass from lower stage of the FSI
Fine Particle Fraction (FPF) = Mass of drug from stage 2
Mass of drug from stage 1 and stage 2 × 100 % Eq. 5-1
Effect of flow rates on measured aerosol properties
The FSI contains an additional insert calibrated at 30 L/min to give a cut-off for 5
µm aerodynamic diameter. This insert was modified by alternately covering three
of the six nozzles using wet glass microfiber filter when a flow rate of 15 L/min
was employed (personal communication; Copley Instrument) as shown in Figure
5-2. A cut-off diameter of 5 µm is used for calculation of Fine Particle Fraction
(FPF) and Fine Particle Dose (FPD) at this lower flow rate (Johal et al., 2013;
Mohan et al., 2017). Each individual experiment was determined after the
impactor was cooled at 5± 3°C for at least 90 min.

Chapter 5 Aerosol properties of liposomes loaded with erlotinib and genistein
213
Figure 5-2 Modification of additional FSI insert utilised at flow rate of 15 L/min
Effect of impactor temperature on measured aerosol properties
The FSI was initially used in accordance with the European pharmacopoeia
requirements for the NGI, i.e. cooling at 5± 3 °C for at least 90 min. In additional
studies, a non-cooled FSI (at ambient temperature; 20 °C) was also employed.
Both impactor temperatures were studied with the FSI operated at flow rates of 15
L/min and 30 L/min, and the aerosol properties of the nebulised liposomes were
determined.
Effect of nebuliser system on measured aerosol properties
Experiments were conducted with an air-jet and vibrating-mesh nebulisers
(respectively; Pari LC® Sprint and Pari Velox®, PARI Medical Ltd, Byfleet, UK)
generating aerosols which were directed into the induction port of the FSI using a
mouthpiece adaptor. The FSI measurements were undertaken after cooling the
impactor at 5± 3°C for at least 90 min, at flow rates of 15 L/min and 30 L/min.
Size stability of liposomes before and after nebulisation
The aim of this experiment was to study the effects of nebulisation on the physical
stability of liposomes. After nebulisation, nebulisers and FSI stages were rinsed
with 1 mL of HPLC water for particle size analysis. The Z-average mean
hydrodynamic diameter and Polydispersity Index (PDI) were measured in
triplicate by dynamic light scattering (DLS) as described in Sections 4.4.4.1 for

Chapter 5 Aerosol properties of liposomes loaded with erlotinib and genistein
214
liposomal formulations before and after nebulisation. The mean values and
standard deviation are reported.
Transmission electron microscopy (TEM) of liposomes before and
after nebulisation
The morphology and aggregation behaviour of freshly prepared liposomal
formulations, liposomes remaining in air-jet and vibrating-mesh nebuliser
reservoirs and those deposited on each stage of the FSI were determined by TEM.
Samples were negatively stained with a drop of uranyl acetate (1% w/v) and
observed using a transmission electron microscope (Philips Electron Optics BV,
Netherlands) as described in Section 3.4.4.4.
Size reduction of liposomes co-loaded with erlotinib and genistein
using membrane extrusion method
The MLVs were repeatedly extruded through a series of polycarbonate membrane
filters of reducing pore sizes (Cyclopore®, Whatman, UK) using nitrogen gas.
The dispersion was extruded through 3 µm and 1 µm polycarbonate membrane
filters of 47 mm diameter held in a stainless-steel holder at 10 psi. Preparations
were further extruded through a 100 nm pore filter at 120 psi (LiposoFast-LF50
extruder, Avestin, Ottawa, Canada). During extrusion the temperature was
maintained at least 10°C above the main phase transition temperature of the
mixture of phospholipids (i.e. at 50 ºC) (Hadian et al., 2014). The particle size
distribution of extruded liposomes was measured using laser diffraction size
analysis (Mastersizer 3000 laser diffraction particle size analyzer, Malvern
Instrument Ltd, UK). The data are presented as volume median diameter (VMD)
for micrometre-sized vesicles.
For nanometre-sized vesicles, dynamic light scattering (DLS) was employed and
size expressed as Z-average hydrodynamic diameter and polydispersity index
(PDI) as described in Section 4.4.4.1. A PDI < 0.1 is typically considered as
representing a monodispersed system, < 0.3 is a relatively monodisperse system,
while > 0.7 is classified as a polydispersed system (ISO-22412, 2008; Kannan et

Chapter 5 Aerosol properties of liposomes loaded with erlotinib and genistein
215
al., 2015; Holmkvist et al., 2016). The pore size of membrane filters and number
of extrusions were optimised to achieve a final mean particle size between 100
and 200 nm, with PDI <0.3.
The final formulation was also characterised for encapsulation efficiency (Section
4.4.4.4) using Eq. 3-5 and Eq. 3-6 (Section 3.4.4.3). The aerosol properties of
extruded liposomes were characterised using the FSI under the same operating
conditions as those for sonicated formulations (Section 5.4.2).
Statistical analysis
All experiments were carried out in triplicate and data are expressed as the mean
standard deviation (SD). The data were statistically analyzed by either Student’s t-
test or analysis of variance (ANOVA) and Tukey’s post hoc test, using IBM SPSS
Statistic 22 software. A p value of < 0.05 was considered significant.
Results and discussion
Effect of drug and lipid concentrations on liposome properties for
nebulisation
The final liposome preparation intended for nebuliser delivery was chosen based
on optimal liposome size and high content of encapsulated erlotinib and genistein.
Table 5-1 shows the characteristics of the 2.5% w/w erlotinib and 2.5% w/w
genistein co-loaded liposomal formulation at different lipid concentrations. Drug
and lipid concentrations (2.5% w/w each drug in total phospholipids) were
increased in comparison with the optimised formulation (lipid concentration of
2.5 mg/mL) to enhance drug content (Section 5.4.1.1). The 2.5% w/w erlotinib
and 2.5% w/w genistein co-loaded liposomal formulation (50 mg of total lipid
content in 20 mL of dispersion or lipid concentration of 2.5 mg/mL) for loading
into nebuliser reservoir contained 0.25 mg of erlotinib and 1.25 mg of genistein,
based on their encapsulation efficiencies. A fill volume of 4 mL contained 10 mg
lipid (2.5 mg/mL) and 0.05 mg of erlotinib and 0.25 mg of genistein.
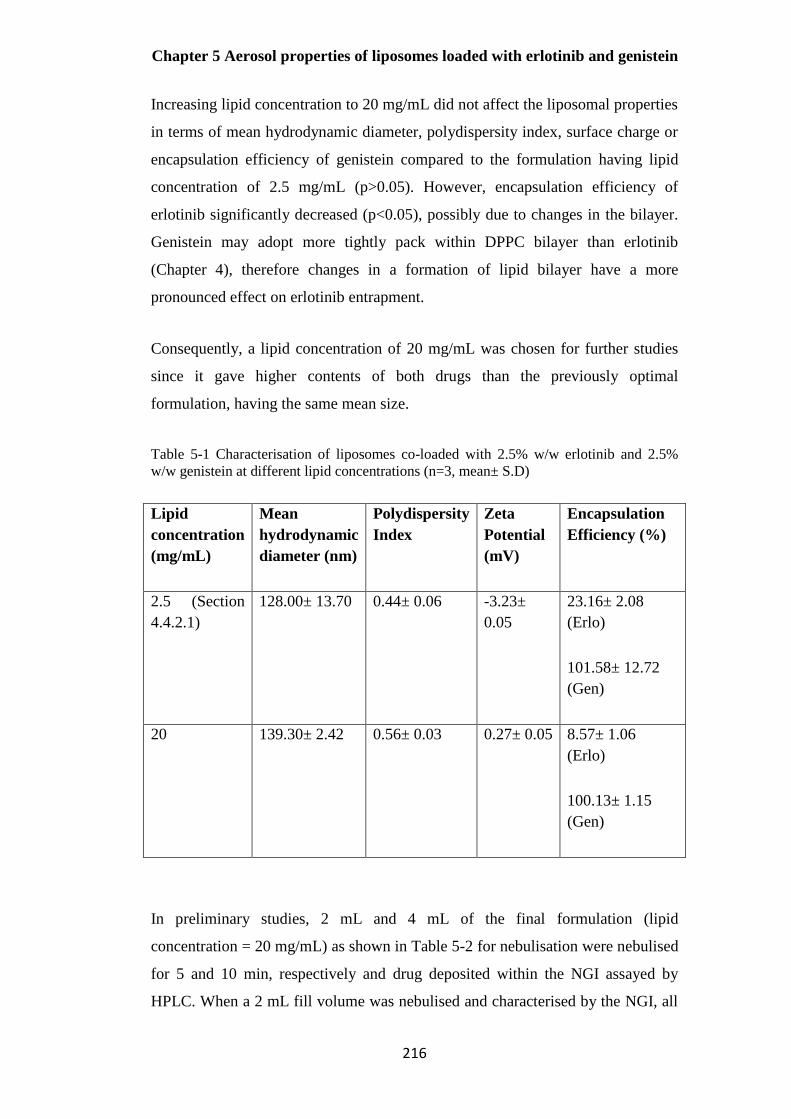
Chapter 5 Aerosol properties of liposomes loaded with erlotinib and genistein
216
Increasing lipid concentration to 20 mg/mL did not affect the liposomal properties
in terms of mean hydrodynamic diameter, polydispersity index, surface charge or
encapsulation efficiency of genistein compared to the formulation having lipid
concentration of 2.5 mg/mL (p>0.05). However, encapsulation efficiency of
erlotinib significantly decreased (p<0.05), possibly due to changes in the bilayer.
Genistein may adopt more tightly pack within DPPC bilayer than erlotinib
(Chapter 4), therefore changes in a formation of lipid bilayer have a more
pronounced effect on erlotinib entrapment.
Consequently, a lipid concentration of 20 mg/mL was chosen for further studies
since it gave higher contents of both drugs than the previously optimal
formulation, having the same mean size.
Table 5-1 Characterisation of liposomes co-loaded with 2.5% w/w erlotinib and 2.5%
w/w genistein at different lipid concentrations (n=3, mean± S.D)
Lipid
concentration
(mg/mL)
Mean
hydrodynamic
diameter (nm)
Polydispersity
Index
Zeta
Potential
(mV)
Encapsulation
Efficiency (%)
2.5 (Section
4.4.2.1)
128.00± 13.70 0.44± 0.06 -3.23±
0.05
23.16± 2.08
(Erlo)
101.58± 12.72
(Gen)
20 139.30± 2.42 0.56± 0.03 0.27± 0.05 8.57± 1.06
(Erlo)
100.13± 1.15
(Gen)
In preliminary studies, 2 mL and 4 mL of the final formulation (lipid
concentration = 20 mg/mL) as shown in Table 5-2 for nebulisation were nebulised
for 5 and 10 min, respectively and drug deposited within the NGI assayed by
HPLC. When a 2 mL fill volume was nebulised and characterised by the NGI, all

Chapter 5 Aerosol properties of liposomes loaded with erlotinib and genistein
217
concentrations of both drugs were below the limit of quantification (LOQ). The
genistein concentration was above the LOQ for the 4 mL fill volume, but erlotinib
concentration was lower than the LOQ for all stages of the NGI. Consequently, 4
mL of liposomal formulation was used in further studies based on full
quantification of genistein. 4 mL was nebulised for 10 min into the NGI and then
deposited erlotinib and genistein were recovered from the NGI by rinsing with
absolute ethanol prior to quantification by HPLC analysis.
Table 5-2 Content of erlotinib and genistein in co-loaded liposomes (lipid concentration
20 mg/mL)
Initial content of
drug (2.5% w/w
each drug in 400
mg lipids in 20
mL of
preparation)
Encapsulation
efficiency
(EE)
Content of
drug in 20
mL of
dispersion
(mg)
Content of
drug in 4
mL of
dispersion
(mg)
Content of
drug in 2
mL of
dispersion
(mg)
10 mg
(Erlotinib)
8.57± 1.06 0.86 0.17 0.08
10 mg
(Genistein)
100.13± 1.15 10 2 1
Comparison of aerosol properties of liposomal preparations delivered
by an air-jet nebuliser determined using the Next Generation
Impactor (NGI) and Fast Screening Impactor (FSI)
Erlotinib deposited on each of the eight impaction stages of the NGI could not be
accurately quantified by the validated HPLC analysis as concentrations of
solutions collected from some stages were below the limit of quantification
(LOQ). The two-stage abbreviated impactor (FSI) was subsequently evaluated as
an alternative to overcome this problem. Table 5-3 shows that the values of mass

Chapter 5 Aerosol properties of liposomes loaded with erlotinib and genistein
218
balance for genistein with both the NGI and FSI were within European
Pharmacopeia acceptance limits, being in the range of 75- 125%. There was no
significant difference in emitted dose (%ED) (p>0.05) as determined using both
impactors, being approximately 30%. These results are in agreement with
previous reports of in vitro aerodynamic characterisation of the dose emitted using
Pari LC®, where %ED was in the range 15-40% (Sahib et al., 2010; Zhang et al.,
2014c; Mashat et al., 2016). The aerosol parameters for nebulised erlotinib could
not be calculated due to the inability to quantify accurately drug deposition on
each stage of the NGI. The aerosol parameters for genistein could be accurately
calculated using both impactors and therefore, the performance of the NGI and
FSI is best compared based on full quantification of genistein.
Table 5-3 Aerosol parameters of liposomal aerosols delivered from an air-jet nebuliser into the NGI and FSI determined by the quantification of genistein (n=3, mean ± S.D.)
Aerosol
parameters NGI FSI
Mass balance
(%) 85.44± 1.49 82.91± 2.28
ED1 (%) 34.42± 0.92 34.31± 5.86
FPD2 (µg) 328.33± 36.17 224.24± 10.14
FPF3 (%) 58.33± 4.51 42.55± 6.28
1 ED= Emitted dose 2 FPD= Fine particle dose 3 FPF= Fine particle fraction
The concentration of drug substance in the nebuliser chamber may increase during
aerosolisation as a result of water evaporation (Pritchard et al., 2018), whilst
disruption of liposomal bilayers may cause accumulation of large liposomes
and/or aggregation of the vesicles, as discussed in Section 5.5.3.4. In addition,
lipid composition may affect output. For example, beclometasone dipropionate-
loaded liposomes prepared from lipids with a higher Tm (DPPC) gave lower drug
outputs than those containing phospholipids with a lower Tm, possibly due to an
increased rigidity of vesicles, resulting in greater resistance to delivery from
nebulisers (Darwis and Kellaway, 2001; Sahib et al., 2010; Elhissi et al., 2011b).
The remaining fluid in the reservoir represents drug wastage, which can be

Chapter 5 Aerosol properties of liposomes loaded with erlotinib and genistein
219
proportionately reduced using a higher fill volume as well as by modifying
nebuliser fluid properties.
There were differences in the calculated values of Fine Particle Fraction (FPF)
and Fine Particle Dose (FPD) using the two impactors (Table 5-3). Using the NGI,
the FPF and FPD for genistein was significantly higher than that obtained with the
FSI (p<0.05). Differences in FPF and FPD values for the NGI and FSI may result
from differences in the internal volume of the full cascade impactor and
abbreviated impactor system. For the NGI, there is a longer distance and transit
time as the aerosol passes through the impactor compared to the FSI. This allows
an increase in heat-transfer related water evaporation from the nebulised droplets,
resulting in the droplets shrinking (Dennis et al., 2008; Kuhli et al., 2009). Further,
a difference in the internal volume of these two impactors could affect aerosol
generation at the earliest stage of the evaluation when the air-flow rate quickly
increased from zero to the constant value of 15 L/min. Another possible cause for
differences in values is the method used for calculating FPF/FPD with the two
impactors. For the NGI, values are determined by the interpolation of the plot of
cumulative fraction or cumulative mass of active drug collected in all stages of the
impactor versus cut-off diameter, whilst for the FSI the dose and fraction less than
5 µm are based on the mass of drug deposited on the lower stage of the impactor.
Under the same operating conditions, the two impactors produced different but
comparable values for the key parameter of aerosolisation (FPF and FPD) with
the same value for emitted dose (ED). Overall, the FSI had great utility as a
relatively rapid method for formulation development and evaluation of nebulised
liposomal formulations, and overcame the analytical quantification problems
associated with erlotinib when using the full impactor.
As differences in tidal breathing patterns (tidal volumes and flow rates) between
patients may affect the delivered dose of nebulised drug, the use of a breath
simulator for in vitro aerosol analysis may be used with a cascade impactor.
Recently, using cascade impactors with breathing simulators, the breathing profile
of an adult; for example, tidal volume= 500 mL, 15 breaths per minute with the
inhalation and exhalation ratio of 1:1 has been recommended for delivered dose

Chapter 5 Aerosol properties of liposomes loaded with erlotinib and genistein
220
testing and evaluating nebuliser performance (Copley, 2014). In this study, the
experiments were conducted without this additional step for characterising the
nebulised liposomes in order to keep the process simple, and to follow the
requirements of and EMA guidelines (EMA, 2006; Ph. Eur. 9.0, 2017).
Aerosol characterisation using the FSI; effect of impactor operating
conditions and nebuliser system
Several factors such as air-flow rate through the FSI, impactor temperature and
nebuliser systems were investigated to determine their influence on the measured
aerosol properties.
The influence of flow rate through the FSI on measured aerosol
properties
The additional insert (Stage 1) of the FSI calibrated at 30 L/min with six nozzles
was used in these experiments. Additionally, a flow rate of 15 L/min, as
recommended by the Ph. Eur. for the NGI was investigated, with three of the six
nozzles covered with wet microglass filter as described in Section 5.4.2. When
comparing the two impactor flow rates, FPF increased almost two-fold, from
approximately 40% to 70% for both drugs when using a higher flow rate (30
L/min; Figure 5-3). As seen in Table 5-4, the FPD for both drugs delivered by the
air-jet nebuliser through the FSI was higher at a flow rate of 30 L/min. This is
because the higher flow rate can entrain relatively warmer air, causing enhanced
evaporation effect and consequently droplet shrinkage prior to deposition within
the impactor, as described in the previous studies of the NGI and Anderson
Cascade Impactor (ACI) (Abdelrahim, 2011; Lewis et al., 2016). A decreased
droplet size may yield higher values for FPF and FPD as shown in this study. A
different value of FPD was observed for the nebulised aerosol of genistein
(p<0.05), but not erlotinib, which demonstrated larger variability at the higher
flow rate (p>0.05).
The explanation for the differences between these two drugs is unclear. A
decrease in temperature of aerosol leaving the air-jet nebuliser (T < Tc of

Chapter 5 Aerosol properties of liposomes loaded with erlotinib and genistein
221
liposomes) during aerosolisation may not affect disruption of liposomal bilayers,
causing no impact on drug solubility and loss of entrapped hydrophobic drug,
since liposomal bilayers are rigid and stable when the temperature is lower than
their Tc (36.37°C). However, the content of erlotinib on the lower stage of the FSI
was slightly higher than the LOQ of the HPLC assay, though these values were in
the middle concentration range of calibration curve for genistein. Accordingly,
this may explain the differences between erlotinib and genistein for FPD values.
However, both drugs showed the same trend in FPD and FPF when increasing air
flow rate through the FSI.
Figure 5-3 Aerosol parameters of co-loaded MLVs aerosols generated using an air-jet nebuliser measured using a cooled FSI at 15 and 30 L/min (n=3, mean ±S.D.).
0
10
20
30
40
50
60
70
80
90
%ED %FPF %ED %FPF
15L/min 30L/min
Aer
oso
l p
ara
met
ers
(%)
Air-flow rate
Erlotinib
Genistein

Chapter 5 Aerosol properties of liposomes loaded with erlotinib and genistein
222
Table 5-4 Fine particle dose for co-loaded liposomal aerosols delivered by the air-jet
nebuliser operated at 15 L/min and 30 L/min, using the cooled FSI (n=3, mean ±S.D.)
Type of nebulisers Air-flow rate (L/min) Fine Particle Dose (µg)
Air-jet
15 18.02± 2.51 (Erlo)
224.24± 10.14 (Gen)
30 25.93± 9.17 (Erlo)
326.87± 37.91 (Gen)
Effect of impactor temperature on measured aerosol parameters
The FSI was cooled at 5± 3ºC as this is recommended in the Ph. Eur. for the NGI.
Experiments were also conducted with a non-cooled FSI (ambient temperature,
20 °C). The FPF values of erlotinib and genistein were not significantly different
(p>0.05) at the two temperatures at a flow rate of 15 L/min (Table 5-5), whereas
the measured FPD was relatively higher for both drugs at ambient temperature. At
the flow rate of 30 L/min, a decrease in FPF for genistein was evident (p<0.05)
when ambient temperature was employed, while the value of FPD was similar
(p>0.05; Table 5-5). The FPD (which is a function of FPF and emitted dose) of
erlotinib was comparatively higher for those collected from the non-cooled FSI at
30 L/min, while there was no significant difference in FPF as compared to the
cooled FSI (p>0.05).

Chapter 5 Aerosol properties of liposomes loaded with erlotinib and genistein
223
Table 5-5 Aerosol parameters for co-loaded liposomal aerosols delivered by the air-jet nebuliser at different FSI temperatures and flow rates (n=3, mean ±S.D.)
The data revealed that the impactor temperature had less effect on the
performance of the FSI, than the NGI which needs cooling as recommended by
the Ph. Eur in order to avoid evaporation-related bias and to reduce the variability
in the data when compared to use at ambient temperature (Dennis et al., 2008).
Cascade impactor temperature has previously shown effects on heat transfer and
droplet evaporation, especially for aqueous droplets produced by nebulisers
(Bonam et al., 2008). Due to the latent heat associated with evaporation resulting
from energy absorption, the temperature of nebulised aerosol is relatively cooler
than the surrounding air (approximately 10°C) (Dennis et al., 2008). The cooled
aerosol comes into contact with the warmer metal of the interior surfaces of the
NGI. In order to maintain the moisture saturation, further evaporation takes place
from the droplets, resulting in reduced droplet sizes throughout the non-cooled
NGI (Dennis et al., 2008). However, omission of cooling nebulisers, air-stream
Initial
Temperature
of the FSI
Air-flow
rate (L/min)
Emitted Dose
(%)
Fine Particle
Fraction
(%)
Fine Particle
Dose (µg)
5± 3°C 15 30.52±2.84
(Erlo)
34.31±5.86
(Gen)
45.55±6.16
(Erlo)
42.55±6.28
(Gen)
18.02±2.51
(Erlo)
224.24±10.14
(Gen)
Ambient
temperature
15 53.23±4.37
(Erlo)
47.57±1.96
(Gen)
48.03±9.57
(Erlo)
42.97±10.50
(Gen)
38.19±2.76
(Erlo)
327.66±91.77
(Gen)
5± 3°C 30 26.92±4.17
(Erlo)
27.93±1.81
(Gen)
73.37±11.83
(Erlo)
73.17±6.10
(Gen)
25.93±9.17
(Erlo)
326.87±37.91
(Gen)
Ambient
temperature
30 60.88±7.82
(Erlo)
56.99±7.16
(Gen)
55.17±7.15
(Erlo)
50.17±6.44
(Gen)
48.44±10.44
(Erlo)
420.74±101.61
(Gen)

Chapter 5 Aerosol properties of liposomes loaded with erlotinib and genistein
224
and the impactor at a fixed temperature would increase simplicity, be labour and
time-saving for aerosol characterisation and beneficial for routine quality control.
Artefactual reduction in droplet size arising from thermal transfer-related
evaporation may be less significant with the FSI since the FSI flight path is
comparatively shorter than the NGI, causing a lower thermal capacity through the
internal volume of the FSI; both impactors are made of stainless steel. By contrast,
a larger headspace in the FSI may allow enhanced water evaporation when
drawing nebulised liposomes through the cooled FSI using ambient air, leading to
the similar results for nebulisation parameters at the two impactor temperatures
(non-cooled and cooled FSI).
The magnitude of the trend to the finer droplets caused by heat transfer-related
evaporation is dependent on nebuliser type. This is because surface area,
concentration and size distribution of the droplets initially produced by inhaler
devices have a significant impact on mass transfer from liquid to vapour state
(Dennis et al., 2008). Consequently, further studies such as the use of different
formulations having various physicochemical properties and other nebulisers are
required. A vibrating-mesh nebuliser was subsequently investigated further to
allow comparison with an air-jet nebuliser under the same operating conditions.
Aerosol properties of liposomal aerosols delivered from a vibrating-
mesh nebuliser
The trends in measured aerosol properties of both drugs in the liposomal
formulation delivered by air-jet and vibrating-mesh nebulisers were similar when
determined using an FSI at two air-flow rates. Figure 5-4 shows the performance
of a vibrating-mesh nebuliser for delivering liposomal aerosols at flow rates of 15
L/min and 30 L/min for a 10 min nebulisation period. When increasing the flow
rate through the FSI from 15 L/min to 30 L/min, the FPF for erlotinib and
genistein increased from approximately 20% to 40%, with the same emitted dose
(p>0.05). Furthermore, FPD was higher for both drugs at the higher flow rate
(p<0.05; Table 5-6). Thus overall, increasing the flow rate through the impactor
using both types of nebuliser (air-jet and vibrating-mesh) affected measured

Chapter 5 Aerosol properties of liposomes loaded with erlotinib and genistein
225
aerosol parameters, likely resulting from a decrease in droplet sizes, due to
evaporative losses as outlined in Section 5.5.3.1.
Figure 5-4 Aerosol parameters of co-loaded liposomes aerosols generated using a vibrating-mesh nebuliser determined using a cooled FSI at 15 and 30 L/min (n=3, mean ±S.D.).
Table 5-6 Fine particle dose for co-loaded liposomal aerosols delivered by a vibrating-
mesh nebuliser operated at 15 L/min and 30 L/min, determined using the cooled FSI (n=3,
mean ±S.D.)
0
10
20
30
40
50
60
70
%ED %FPF %ED %FPF
15L/min 30L/min
Aer
oso
l p
ara
met
ers
(%)
Air-flow rate
Erlotinib
Genistein
Type of nebuliser Air-flow rate (L/min) Fine Particle Dose (µg)
Vibrating- mesh
15
17.25± 1.72 (Erlo)
149.14± 41.52 (Gen)
30
32.83± 4.44 (Erlo)
269.83± 13.33 (Gen)

Chapter 5 Aerosol properties of liposomes loaded with erlotinib and genistein
226
The air-jet nebuliser appears more appropriate for delivering liposomal aerosols
than the vibrating-mesh nebuliser based on a two-fold higher FPF of both drugs at
both flow rates (Figure 5-3 and Figure 5-4). The values of FPD, a critical
parameter for medical aerosols reflected FPF, and were more similar for these two
nebulisers. This was because the emitted dose was significantly higher with the
vibrating-mesh nebuliser (p<0.05), in good agreement with previous studies (Lass
et al., 2006; Pitance et al., 2010). For both flow rates, the air-jet nebuliser
produced significantly higher FPD for genistein (p<0.05; Table 5-4 and Table 5-
6), while there were no differences in FPD for erlotinib delivered using the two
devices (p>0.05).
Previously, vibrating-mesh nebulisers have been reported to give higher aerosol
mass and drug outputs compared to air-jet nebulisers (Ari, 2014). However, the
air-jet devices appeared superior in this study, which may be specific for this
particular liposomal formulation. The physicochemical properties of the
formulation including viscosity and surface tension, particle size distribution and
zeta potential of dispersed systems have an impact on nebuliser performance and
aerosol characteristics, particularly for both active and passive vibrating-mesh
nebulisers (Chan et al., 2011; Carvalho and McConville, 2016). The lower
efficiency of the vibrating-mesh nebuliser for delivering this specific formulation
may be due to the absence of an ionic component (particularly a halide) or
surfactant in the formulation as reported for curcumin-loaded genistein-mPEG
polymeric micelles (Chapter 3). The presence of ions is also crucial for providing
an enhanced output rate and for less variable aerosol characteristics (Carvalho and
McConville, 2016). Moreover, vibrating-mesh technology could possibly cause
the generation of heat over a 10 min aerosolisation period, resulting in the
aggregation/degradation of liposomes as reported for thermobile proteins (Hertel
et al., 2014; Beck-Broichsitter and Oesterheld, 2017).
An additional concern is that the mesh aperture could possibly be blocked because
of inappropriate properties of the liposomal formulation, drug crystallisation or
repeated use, causing a decrease in the diameter of mesh pore and consequently
higher resistance to aerosol generation (Chan et al., 2011; Manunta et al., 2011;
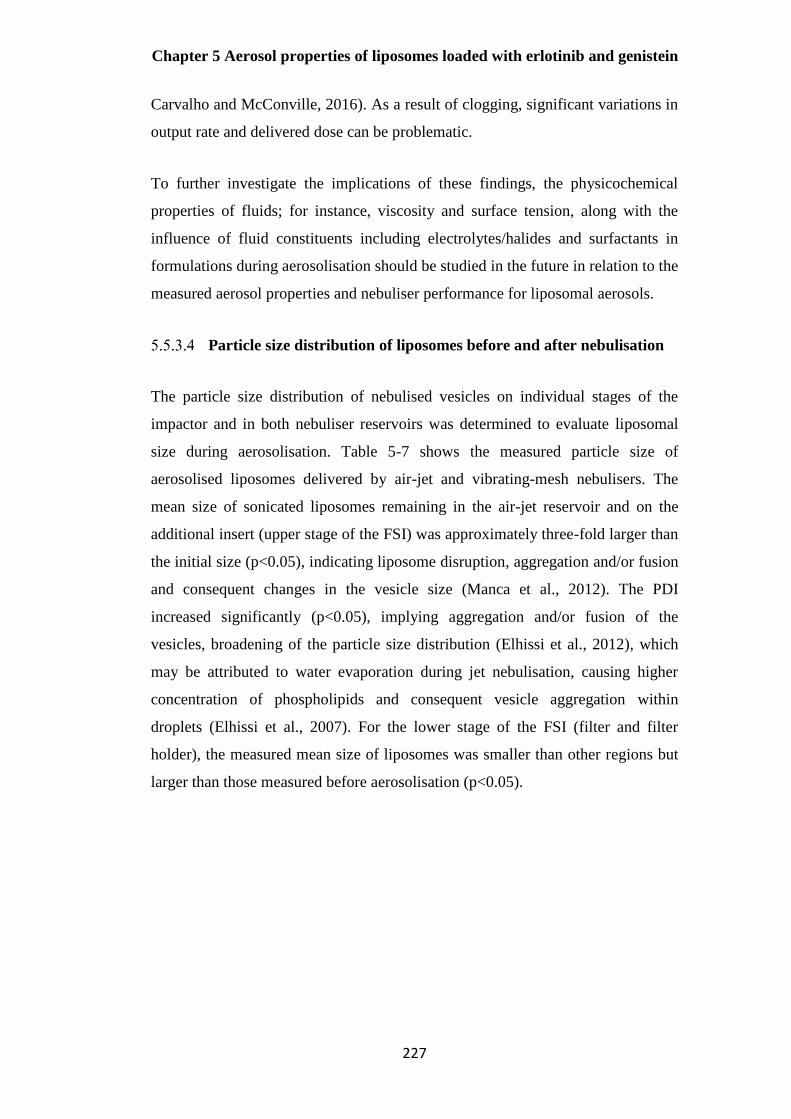
Chapter 5 Aerosol properties of liposomes loaded with erlotinib and genistein
227
Carvalho and McConville, 2016). As a result of clogging, significant variations in
output rate and delivered dose can be problematic.
To further investigate the implications of these findings, the physicochemical
properties of fluids; for instance, viscosity and surface tension, along with the
influence of fluid constituents including electrolytes/halides and surfactants in
formulations during aerosolisation should be studied in the future in relation to the
measured aerosol properties and nebuliser performance for liposomal aerosols.
Particle size distribution of liposomes before and after nebulisation
The particle size distribution of nebulised vesicles on individual stages of the
impactor and in both nebuliser reservoirs was determined to evaluate liposomal
size during aerosolisation. Table 5-7 shows the measured particle size of
aerosolised liposomes delivered by air-jet and vibrating-mesh nebulisers. The
mean size of sonicated liposomes remaining in the air-jet reservoir and on the
additional insert (upper stage of the FSI) was approximately three-fold larger than
the initial size (p<0.05), indicating liposome disruption, aggregation and/or fusion
and consequent changes in the vesicle size (Manca et al., 2012). The PDI
increased significantly (p<0.05), implying aggregation and/or fusion of the
vesicles, broadening of the particle size distribution (Elhissi et al., 2012), which
may be attributed to water evaporation during jet nebulisation, causing higher
concentration of phospholipids and consequent vesicle aggregation within
droplets (Elhissi et al., 2007). For the lower stage of the FSI (filter and filter
holder), the measured mean size of liposomes was smaller than other regions but
larger than those measured before aerosolisation (p<0.05).

Chapter 5 Aerosol properties of liposomes loaded with erlotinib and genistein
228
Table 5-7 Mean hydrodynamic diameter (Z-ave) and Polydispersity Index (PDI) of nebulised sonicated co-loaded liposomes delivered to the FSI stages, and those remaining in the nebuliser reservoir (n=3, mean± S.D.)
Type of nebuliser Before nebulisation After nebulisation
Nebuliser reservoir Upper stage of FSI Lower stage of FSI
Z-ave (nm) PDI Z-ave (nm) PDI Z-ave (nm) PDI Z-ave (nm) PDI
Air-jet 139.3± 2.42 0.56± 0.03 363.50± 31.05 0.75 ±0.14 258.40± 14.4 0.83± 0.19 172.50± 18.36 0.35± 0.08
Vibrating-mesh 146.2± 4.58 0.53± 0.01 210.90 ±22.78 0.77± 0.10 250.00± 88.02 0.72± 0.16 112.60± 13.51 0.37± 0.03

Chapter 5 Aerosol properties of liposomes loaded with erlotinib and genistein
229
For the vibrating-mesh nebuliser, the mean particle size and PDI for nebulised
liposomes remaining in the vibrating-mesh reservoir and on the upper stage of the
FSI (stage 1 of the FSI housing) was significantly larger than the starting size
(p<0.05), indicating that the accumulation of large liposomes and/or liposome
aggregates can occur, which fail to pass through or be extruded through the mesh
apertures during aerosolisation (Elhissi et al., 2011a; Carvalho and McConville,
2016). However, liposomes collected on the lower stage of the FSI showed the
smallest vesicle size (p<0.05).
The mean size and size distribution of liposomes measured on the lower stage of
the FSI was smaller than those remaining in both nebuliser reservoirs and on stage
1 of the impactor. This may be due to water loss when aerosol droplets pass
through the impactor or liposome disruption after being emitted from the devices
(Elhissi et al., 2007). For both nebulisers, further studies are required to determine
whether a marked size reduction of liposomes collected on the lower stage of the
impactor causes drug leakage, though drug losses on size reduction are not usually
a major issue for hydrophobic drugs unlike hydrophilic materials (Desai et al.,
2002). The impaction on metal surfaces and subsequent drying of the deposited
droplets in the FSI may be a further possible reason leading to vesicle disruption
and aggregation on the upper stage of the FSI. Overall, the physical stability of
nebulised liposomal aerosols generated by air-jet and vibrating-mesh nebulisers
was similar.
Based on these findings particularly for FPF, the air-jet nebuliser was considered
the more appropriate delivery device for delivering the developed liposomal
formulation. The morphology of liposomes delivered using the air-jet nebuliser
was studied by TEM (Figure 5-5 a and 5-5 b), revealing a population of small
relatively uniform spherical vesicles (50-250 nm) before and after nebulisation.
This observation was in good agreement with previous reports of multilamellar
vesicles (MLVs) reduced in size by probe-sonication and nebulised (Bozzuto and
Molinari, 2015; Pattni et al., 2015; Rudokas et al., 2016). The lamellarity of the
vesicles did not change during nebulisation (Figure 5-5 c and 5-5 d), suggesting
that air-jet nebuliser is a suitable device for delivering aerosols of the freshly
sonicated liposomes.

Chapter 5 Aerosol properties of liposomes loaded with erlotinib and genistein
230
It was noted that sonicated liposomes became cloudy within 30 min after
preparation, suggesting poor physical stability. It has been reported that extrusion
of MLVs through 1-µm polycarbonate filter improved physical stability of
liposomes during air-jet nebulisation and enhanced drug output for air-jet and
vibrating-mesh nebulisers (Carvalho and McConville, 2016). Therefore,
membrane extrusion was investigated as an alternative size reduction method.
Figure 5-5 TEM images of co-loaded liposomes prepared by probe-sonication before and after air-jet nebulisation (a) freshly prepared formulation (b) vesicles remaining in air-jet reservoir following nebulisation (c) liposomes deposited on stage 1 of the FSI and (d) liposomes deposited on stage 2 of the FSI.
a) b)
d) c)

Chapter 5 Aerosol properties of liposomes loaded with erlotinib and genistein
231
Optimisation of liposome extrusion
The composition of extruded co-loaded liposomes was the same as those
previously size reduced by probe-sonication. The extrusion process would not be
expected to affect drug encapsulation for both erlotinib and genistein since both
drug molecules were incorporated within the liposome bilayers prior to this step
(Morton et al., 2012). Consequently, optimisation of extrusion was initially aimed
at improving the physical stability of liposomal formulations during their
preparation.
The initial mean volume median diameter (VMD) of freshly prepared erlotinib
and genistein co-loaded liposomes (lipid concentration of 20 mg/mL) before
extrusion was 7.83± 0.40 µm. Figure 5-6 a shows an exponential decrease in
mean VMD (p<0.05) on repeated extrusion cycles through a 3 µm pore membrane
and that there was only a small further reduction in VMD after 5 extrusion passes.
In this case, VMD was less than the pore size which is contrary to previous
reports whereby mean vesicle size is normally larger than the pore size of the
filter used, due to a reversible elastic deformation of the liposomes when passing
through the filter pores (Hinna et al., 2015). In this study, it is possible that lipid
bilayers ‘squeezed off’ during extrusion and reformed vesicles having mean
diameter smaller than the pore size of membrane filter. Another feasible cause is
that extruded liposomes have large particles of unentrapped drug removed, during
the extrusion process. The co-loaded liposomal formulation extruded 5 times
through a 3 µm pore polycarbonate filter was then extruded further, through a 1
µm pore filter. The trend for VMD was similar to that obtained with a 3 µm pore
filter, 5 cycles was the optimal number of extrusion passes to reduce mean size to
approximately 1 µm (Figure 5-6 b).
Figure 5-6 c shows that when further extruded through a 0.1µm filter, a final
constant value of approximately 0.13 µm was achieved. This was in accordance
with previous reports using pore size < 0.2 µm (Morton et al., 2012; Ong et al.,
2016). Hence, 5 extrusion cycles using a polycarbonate filter with 0.1 µm pore
size resulted in the desired mean size of 130 nm, when combined with the earlier
extrusion steps at 3 and 1 µm.

Chapter 5 Aerosol properties of liposomes loaded with erlotinib and genistein
232
Figure 5-6 Mean VMD of liposomes extruded through: a) 3 µm pore polycarbonate membrane filter and b) further extruded through a 1 µm pore polycarbonate membrane filter, and c) mean hydrodynamic diameter of liposomes further extruded through a 0.1 µm pore polycarbonate membrane filter (n=3, mean± S.D.)
In summary, when membrane extrusion was used as a method of size reduction,
the mean size decreased with an increasing number of extrusion cycles, as
previously reported (Morton et al., 2012; Ong et al., 2016), reaching a size plateau
after approximately 5 cycles for each membrane pore size (Figure 5-6 a, 5-6 b and
5-6 c). Low nitrogen pressure was required to extrude liposomes through large
membrane pores, whereas a higher pressure was required for extrusion through
the smallest pore sizes and to increase the homogeneity of liposomes (Morton et
al., 2012). The mean diameter of extruded liposomes passing through larger
membrane pore size (5 and 3 µm) was smaller than or approximated the pore size
of filter, while that of liposomes passed through 100 nm pore membranes was
slightly larger than the nominal pore size, due to the flexibility of liposomal
membranes, in accordance with previous reports of the relationship between
liposome particle size and extrusion membrane pore size (Mayer et al., 1986;
Hunter and Frisken, 1998; Ong et al., 2016).
0
2
4
6
8
10
0 2 4 6 8 10 12
Mean
VM
D (µ
m)
Number of extrusion passes
0
0.5
1
1.5
2
0 2 4 6 8 10 12
Mea
n V
MD
( µ
m)
Number of extrusion passes
0
50
100
150
200
250
0 2 4 6 8 10 12
Mea
n h
yd
rod
yn
am
ic
dia
met
er (
nm
)
Number of extrusion passes
a) b)
c)

Chapter 5 Aerosol properties of liposomes loaded with erlotinib and genistein
233
Comparison of the properties of liposomes, size reduced by probe-
sonication and membrane-extrusion
In Chapter 4, size reduction of erlotinib and genistein co-loaded liposomes
comprising DPPC, cholesterol and DOPE (72:8:20 mole %) was achieved using
30 min probe-sonication, giving a final mean size of approximately 130 nm after
removing free drugs (Table 5-8). In this chapter, membrane extrusion was used as
an alternative method of size reduction to achieve vesicles with a mean size in the
same range.
Liposomes pre-filtration were cloudy and opalescent, due to non-incorporated
drugs and/or liposome aggregates. Table 5-8 shows the mean particle size after
passing sonicated or extruded liposomes through the cellulose acetate filters was
smaller than the nominal pore size of 0.45 µm membrane filters, suggesting that
only incorporated drugs in small liposomes remained in samples (Elhissi et al.,
2013). The mean measured surface charge for all liposome preparations were not
significantly different (p>0.05), the value being approximately neutral as expected
based on the individual bilayer components. Commensurately, extruded
liposomes had a relatively homogeneous size distribution, with small PDI value
(PDI<0.03) indicative of a monodispersed population (Castile and Taylor, 1999;
Hadian et al., 2014).

Chapter 5 Aerosol properties of liposomes loaded with erlotinib and genistein
234
Table 5-8 The effect of size reduction method on mean hydrodynamic diameter,
Polydispersity Index (PDI), zeta potential and drug encapsulation for co-loaded
liposomes after removing non-incorporated drugs by filtration (n=3, mean± S.D.)
Size reduction
method
Hydrodynamic
diameter (nm)
PDI Zeta
potential
(mV)
Encapsulation
Efficiency (%)
Probe-
sonication
Post-filtration
139.30± 2.42
0.56±
0.03
+0.27±
0.05
10.65± 1.69 (Erlo)
98.69± 3.14 (Gen)
Extrusion
Post-filtration
125.60± 2.15
0.13±
0.05
+0.43±
0.22
11.45± 1.13 (Erlo)
105.30± 4.24 (Gen)
Extrusion parameters were optimised using the chosen lipid composition, to
generate liposomes in the desired size range with maximum incorporation of both
drugs. The entrapment efficiencies of erlotinib and genistein-loaded liposomes
prepared by probe-sonication and membrane extrusion were compared after
removing unentrapped drugs using syringe-filtration. Previous research has
demonstrated that the entrapment of sonicated hydrophobic steroid-containing
liposomes was mainly dependent on lipid composition (Elhissi et al., 2013). The
total content of erlotinib and genistein including free drug and drug-loaded
liposomes for pre-filtered MLVs after 30 min probe-sonication compared with
initial weight of drug in liposome preparation was 100%, indicating no drug was
lost during preparation and sonication before non-incorporated drugs were
removed by filtration. However, the total content of erlotinib and genistein
including free drug and drug-incorporated liposomes after passing through a
series of membrane filters was approximately 10% and 100% of initial weight of
drug in formulations, respectively, indicating that unentrapped erlotinib was
retained on the polycarbonate membrane filters during size reduction, while
almost 100% of initial genistein was successfully incorporated into liposomes and

Chapter 5 Aerosol properties of liposomes loaded with erlotinib and genistein
235
passed through the series of polycarbonate membranes. The entrapment
efficiencies determined after separating non-incorporated drugs by passing
through 0.45 µm cellulose acetate membrane filters did not show differences
between sonicated and extruded liposomes for either drug (p>0.05). Thus, loading
erlotinib and genistein (2.5% w/w each drug) into DPPC/cholesterol/DOPE
liposomes (72:8:20 mol%) was not dependent on the method of size reduction
since both encapsulated drugs were incorporated within the liposomal bilayer
during preparation (Eckert et al., 2011; Rasti et al., 2012; Hadian et al., 2014).
Considering the physical stability of liposomal formulations, the aggregation of
liposomes was clearly observed within 30 min at ambient temperature for
sonicated liposomes, and therefore freshly prepared formulations were used for
determining the properties of nebulised aerosol. By contrast, there was no change
in mean particle size (approximately 125 nm), but slightly increase in PDI of
extruded liposomes, from 0.13 to 0.26 after 1-day; storage at 4ºC. However, no
liposomal aggregates were observed. These combined observations suggested that
membrane extrusion produced a more stable co-loaded liposomal formulation
than sonication.
Long-term stability studies are required; however, these findings support the
development of liposomal formulation prepared by extrusion for enhanced
stability.
Overall, extruded liposomes comprising DPPC, cholesterol and DOPE (72:8:20),
prepared by thin-film hydration with size reduction using extrusion represented
the best manufacturing and formulation approaches in terms of particle size
distribution and co-loading of drugs.
Aerosol characterisation of extruded liposomes aerosolised using air-
jet and vibrating-mesh nebulisers
Aerosol properties of nebulised extruded liposomes were studied using the cooled
FSI, operated at the air-flow rate of 15 L/min for 10 min to investigate whether
the method of size reduction affected aerosol properties. The air-jet nebuliser

Chapter 5 Aerosol properties of liposomes loaded with erlotinib and genistein
236
generated significantly higher FPF and FPD than the vibrating-mesh nebulisers
(p<0.05) after 10 min nebulisation (Figures 5-3 and Figure 5-4, Table 5-4 and
Table 5-6). Comparing the findings for sonicated and extruded liposomes (Figures
5-3 and 5-4 for sonicated liposomes and Figure 5-7 for extruded liposomes), there
were no significant differences in FPF for liposomes prepared by the different
methods of size reduction using air-jet nebulisers (p>0.05), while vibrating-mesh
nebulisers generated significantly higher FPF for extruded liposomes (p<0.05).
However, the values of FPD of extruded erlotinib and genistein liposomes
generated by both nebulisers were significantly higher than for sonicated
liposomes (p<0.05) as seen in Tables 5-4, 5-6 and 5-9. This possibly resulted from
the more monodispersed liposome population produced by membrane extrusion,
passing more readily through the multiple aperture mesh of the nebulisers
compared with those prepared by sonication.
From these findings, the air-jet device would appear superior to the vibrating-
mesh device for delivering liposomes prepared by both methods of size reduction.
Based on the combined results of FPD from Tables 5-4, 5-6 and 5-9, for the
liposomal system, size reduction by extrusion, the air-jet nebuliser would appear
preferable, with the aerosol properties less dependent on the properties of the
liposomal formulations than the vibrating-mesh device.
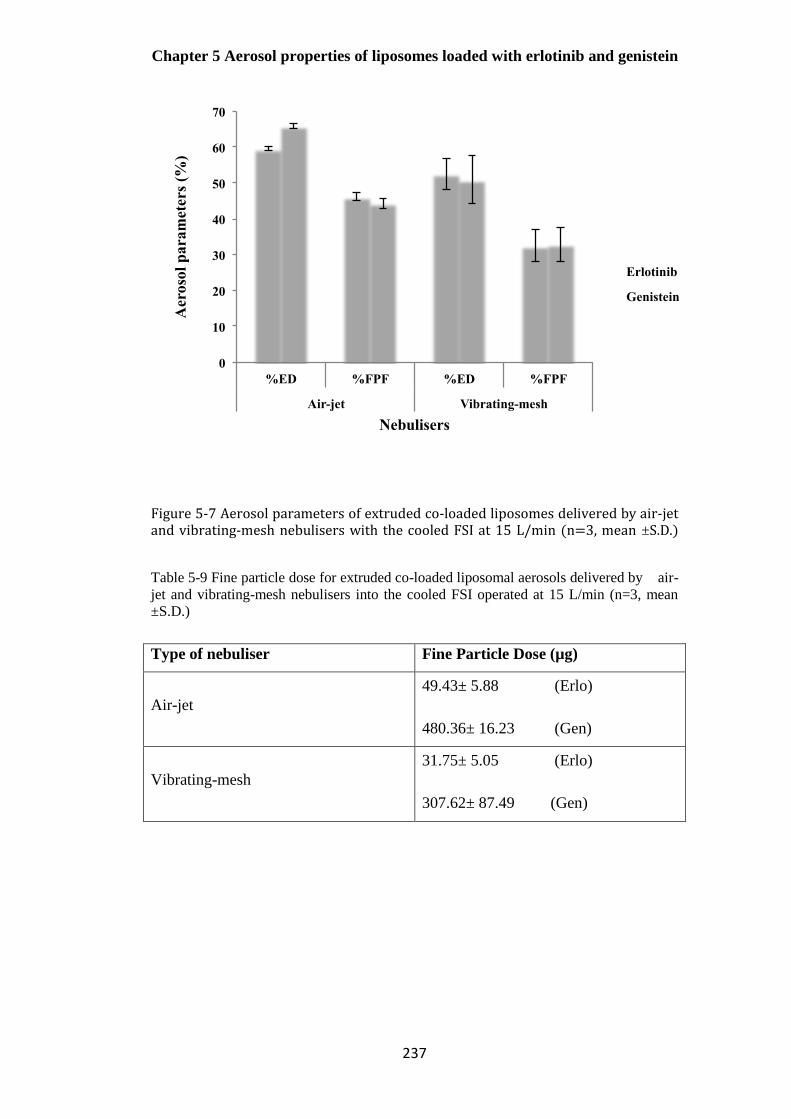
Chapter 5 Aerosol properties of liposomes loaded with erlotinib and genistein
237
Figure 5-7 Aerosol parameters of extruded co-loaded liposomes delivered by air-jet and vibrating-mesh nebulisers with the cooled FSI at 15 L/min (n=3, mean ±S.D.)
Table 5-9 Fine particle dose for extruded co-loaded liposomal aerosols delivered by air-
jet and vibrating-mesh nebulisers into the cooled FSI operated at 15 L/min (n=3, mean
±S.D.)
Type of nebuliser Fine Particle Dose (µg)
Air-jet
49.43± 5.88 (Erlo)
480.36± 16.23 (Gen)
Vibrating-mesh
31.75± 5.05 (Erlo)
307.62± 87.49 (Gen)
0
10
20
30
40
50
60
70
%ED %FPF %ED %FPF
Air-jet Vibrating-mesh
Aer
oso
l p
ara
met
ers
(%)
Nebulisers
Erlotinib
Genistein

Chapter 5 Aerosol properties of liposomes loaded with erlotinib and genistein
238
Size stability of nebulised extruded liposome delivered by the air-jet
and vibrating-mesh nebulisers
For liposomes prepared by extrusion, there was a very small increase in mean
particle size and PDI of liposomes remaining in the main reservoir of the air-jet
and vibrating-mesh devices, upper and lower stage of the FSI compared with
freshly prepared formulations (p<0.05; Table 5-10).
When Table 5-7 and Table 5-10 are compared, liposomes sized reduced by
extrusion process showed better size stability than those size-reduced by
sonication during aerosolisation using both nebulisers in terms of changes in mean
size after nebulisation, particularly for those remaining in the nebuliser reservoirs
and deposited on stage 1 of the FSI. The mechanism underlying this is unclear and
merits further investigation. In this study, liposomes were nebulised immediately
after size reduction. Sonication is a physically much more disruptive and energy
intensive process than extrusion, resulting in fracturing of vesicles and formation
of new liposomes from bilayer fragments. With insufficient time for annealing of
these newly formed structures, aggregation and fusion of vesicles may occur more
readily than for extruded liposomes, which are size reduced by the relatively
gentle process of squeezing through pores of defined size (Lawaczeck et al., 1976).

Chapter 5 Aerosol properties of liposomes loaded with erlotinib and genistein
239
Table 5-10 Hydrodynamic diameter (Z-ave) and Polydispersity Index (PDI) of nebulised extruded co-loaded liposomal aerosols delivered to the FSI stages,
and those remaining in the nebulizer reservoir (n=3, mean ±S.D.)
Type of nebuliser
Before nebulisation
After nebulisation
Nebuliser reservoir Upper stage of the impactor Lower stage of the impactor
Z-ave (nm) PDI Z-ave (nm) PDI Z-ave (nm) PDI Z-ave (nm) PDI
Air-jet
117.9± 2.27 0.08± 0.02 129.90± 0.87 0.25± 0.01 139.50± 10.21 0.28± 0.00 125.40± 5.55 0.22± 0.03
Vibrating-mesh
115.4± 1.97 0.14± 0.09 116.10± 4.78 0.10± 0.03 138.70± 6.60 0.29± 0.03 113.60± 3.27 0.15± 0.04

Chapter 6 General conclusion and future work
240
Conclusions
Sonicated and extruded co-loaded liposomes with potential for pulmonary
delivery were successfully prepared by the conventional thin-filmed hydration
method, followed by probe-sonication or membrane extrusion to reduce the mean
size. The effects of probe sonication and membrane extrusion methods on drug
incorporation and size stability during aerosol generation using air-jet and
vibrating-mesh nebulisers has been studied and shown that the performance of air-
jet nebulisers was more effective than vibrating-mesh nebulisers for delivering
liposomes reduced in size by both methods. The use of full impactors to
characterise inhaler formulations may be limited by the need to accurately
quantify deposited drug across multiple stages and they are labour intensive to use.
The Fast Screening Impactor (FSI), comprising only two impaction stages with
minor modifications, was found to be simple, labour and time-saving for aerosol
characterisation, representing a useful alternative technique for characterising the
aerosol properties of nebulised formulations, particularly when pre-cooled and
used at 15 L/min. An air-jet nebuliser was found superior to a vibrating-mesh
nebuliser, for delivering the co-loaded liposomes over a 10-min period, in terms
of higher fine particle fraction. Extrusion was superior to probe sonication during
preparation of formulations and aerosolisation process, giving greatest size
stability of co-loaded liposomes as determined by size analysis before and after
nebulisation.
Overall, liposomes co-loaded with erlotinib and genistein prepared by extrusion
were effectively delivered using an air-jet nebuliser.

Chapter 6 General conclusion and future work
241
Chapter 6 General conclusion and future
work

Chapter 6 General conclusion and future work
242
General discussion and conclusion
Non-small cell lung cancer (NSCLC) is the most common cause of cancer-related
deaths worldwide (Zarogoulidis et al., 2013). Currently, oral and injected
therapies for lung cancer are limited due to the systemic side effects and sub-
therapeutic levels of chemotherapeutic agents at the target site (Hu et al., 2013;
Rudokas et al., 2016). Pulmonary drug delivery is an attractive route of
administration and has been used to deliver drugs for local treatment of
respiratory diseases including asthma, COPD and cystic fibrosis (Pilcer and
Amighi, 2010). Thus, this delivery route may achieve effective localised treatment
for NSCLC.
Targeted therapy, one treatment approach in NSCLC, has been studied to treat
specific molecular targets, including the epidermal growth factor receptor (EGFR)
(Molina et al., 2008). Erlotinib, an epidermal growth factor receptor tyrosine
kinase inhibitor (EGFR-TKIs), has been approved as 1st line treatment for patients
who have EGFR mutations and as 2nd and 3rd line treatments for those with
advanced-stage NSCLC. However, the toxicity of erlotinib is problematic
(Thatcher et al., 2009; Zarogoulidis et al., 2013). Combinations of a
phytochemical (e.g. genistein, curcumin, fisetin) and a chemotherapeutic agent
have attracted a great deal of attention for reducing drug toxicity on normal cells
and for their potentiation effects. Among a number of phytochemicals that have
been studied on multiple targets in cancer cells, more than 60% are flavonoids,
which can be found in fruits and vegetables. For example, the combination of
erlotinib and genistein has shown synergistic anti tumour activity in three
different NSCLC cell lines (Gadgeel et al., 2009).
One factor that can limit the bioavailability for NSCLC treatment is the low
aqueous solubility of many hydrophobic anticancer agents. Formulation
approaches using colloidal drug carriers (e.g. polymeric micelles, liposomes,
cyclodextrin, dendrimer) have been proposed to improve water solubility, which
when administered by the pulmonary route may achieve drug dose uniformity,
decrease the frequency of drug dosing and reduce the incidence of potential
systemic side effects (Mansour et al., 2009). This PhD research explores a

Chapter 6 General conclusion and future work
243
potential strategy to enhance the treatment of lung cancer, by using polymeric
micelles or liposomes for co-delivery of hydrophobic anticancer agents by the
pulmonary route. Polymeric- and lipid-based carriers may be particularly suitable
for pulmonary delivery, due to their biocompatibility and reduced drug toxicity
(Li et al., 2015).
For in-vitro aerosol characterisation of nebulised aerosols, the Next Generation
Impactor (NGI) is routinely used. However, the quantification of nebulised low
dose formulations is challenging, due to the small absolute amounts of drug
deposited across many stages of a full impactor. Also, the use of full cascade
impactors is time-consuming and labour intensive. Therefore, Abbreviated
Impactor Measurement (AIM) using the Fast Screening Impactor (FSI), which
yields limited information about the whole particle size distribution of an aerosol
cloud was considered in this study. This was to investigate whether this faster
method for aerosol analysis gave comparable results for key quality parameters
for aerosolised drug carriers using medical nebulisers.
This PhD investigated whether a hydrophobic drug-hydrophilic polymer
conjugate could self-assembly to form micelles for delivering hydrophobic
anticancer agents. Secondly, whether nebulisation of micelles and liposomes for
the co-delivery of hydrophobic drugs delivered by air-jet and vibrating-mesh
nebulisers could produce desirable aerosol characteristics, with high drug output
and fine particle dose. Thirdly, this thesis studied whether the FSI could be used
as an alternative impactor to the NGI, giving comparable values for key
parameters for inhaler products including emitted dose, mass balance, fine particle
fraction and fine particle dose. The work in this thesis was divided into three main
sections; 1) synthesis and characterisation of drug-polymer conjugate, 2)
preparation and characterisation of hydrophobic drugs-loaded polymeric micelles
and liposomes and 3) aerosol characterisation of nebulised aerosols determined by
the NGI and the FSI.
The first part of this thesis studied a potential strategy for formulating
hydrophobic drugs using hydrophilic polymer-hydrophobic drug conjugates.
Drug-polymer conjugates have demonstrated a number of advantages including

Chapter 6 General conclusion and future work
244
enhancing the aqueous solubility of hydrophobic drugs (Hans et al., 2005;
Khandare and Minko, 2006). In this approach, the drug-polymer conjugate forms
micelles, encapsulating another drug for co-delivery. Recently, phytochemicals
have received great attention as chemo-preventive agent. Genistein, one of the
most extensively studied isoflavones, has shown synergistic anti-carcinogenic
activities with both cytotoxic drug (i.e. erlotinib) and a herbal medicine (i.e.
curcumin) against different cancer cell lines including lung, breast, ovarian and
prostate cancer, without exerting toxic effects on normal cells (Liu et al., 2014b).
Therefore, genistein was considered for co-delivery with a conventional cytotoxic
drug; namely erlotinib in this study since co-delivery may allow the dose of
cytotoxic drug to be reduced.
The hydrophilic polymer, methoxy poly (ethylene glycol) (mPEG) has been
frequently used in hydrophilic drug carriers. mPEG has been used in approved
PEGylated biopharmaceutical products for clinical use namely mPEG-epoetin
beta and mPEG-filgrastim (Turecek et al., 2016, BNF, 2018). Thus, mPEG was
chosen to form a genistein- mPEG conjugate as described in Chapter 2 for
producing drug carriers. Such carriers may retain the biological activity of
genistein and be capable of delivering erlotinib or curcumin. The synthesis of
amphiphilic genistein-mPEG conjugate involved two main steps: 1) oxidation and
2) esterification. The successful synthesis of genistein-mPEG conjugate yielded a
pale yellow powder, with a yield of 43.7% was confirmed by FT-IR, 1H-NMR
and mass spectroscopy.
Initially, this drug-polymer conjugate was studied to determine whether it could
self-assembly to form micelles. The critical micelle concentration (CMC),
measured using DLS was 1.35 mg/mL (2.56 x 10⁻⁴ M) as outlined at the
beginning of Chapter 3, indicating self-assembly into micelles. The main body of
the experimental work described in this chapter investigated the preparation and
characterisation of genistein-mPEG micelles loaded with hydrophobic drug
(erlotinib or curcumin). The aerodynamic characteristics of micelles delivered in
aerosol generated by air-jet and vibrating-mesh nebulisers were measured using
the NGI.

Chapter 6 General conclusion and future work
245
A preliminary study of erlotinib loading into the synthesized conjugate, showed
an encapsulation efficiency of approximately 3%, with the generation of a turbid
white suspension during preparation. This indicated that this conjugate was not
appropriate for the delivery of erlotinib. On the other hand, curcumin was
successfully incorporated into genistein-mPEG micelles, giving a transparent
yellow solution with no precipitation. These observations suggest that the polymer
was not suitable for erlotinib, possibly due to its molecular structure which limited
drug incorporation into the micelles. Nevertheless, this new amphiphilic
compound was a suitable drug carrier for curcumin. Curcumin was incorporated
into genistein-mPEG at a range of concentrations to identify the optimal drug
concentration (% w/w drug in total polymer content) for further studies.
Based on effect of curcumin concentration on drug entrapment, surface charge,
mean particle size and size distribution, 5% w/w drug in polymer was found to be
the optimal content. This concentration gave the maximum solubilisation of
curcumin, combined with other desirable properties; a high negative charge, mean
size < 200 nm and PDI <0.3. Consequently, this final formulation was chosen for
delivery by nebulisers.
The aerosol properties of curcumin-loaded micelles (5%w/w drug in conjugate)
delivered from air-jet and vibrating-mesh nebulisers, were determined using the
NGI. The air-jet nebuliser produced significantly higher fine particle dose (FPD)
and fine particle fraction (FPF) compared with the vibrating-mesh nebuliser. The
predominant reason for the unexpected relatively poor performance of the
vibrating-mesh nebuliser may be the physicochemical properties of the
formulation investigated. Thus, further investigation is required to improve
understanding to develop appropriate formulation strategies as outlined in future
work.
In summary, genistein-mPEG micelles incorporating curcumin at 5% w/w were
successfully delivered using both nebulisers, with emitted dose greater than 50%
(ED). The values of FPD and FPF for air-jet and vibrating-mesh nebulisers were
in the range of 73-136 µg, and 33-48%, respectively. This indicates the potential
of the micelle formulation approach for pulmonary co-delivery of anticancer

Chapter 6 General conclusion and future work
246
agents. Few studies of nebulised polymeric micelles have been previously
reported; for instance, amphotericin B and budesonide micelles (Gilani et al.,
2011; Sahib et al., 2011; Moazeni et al., 2012). The drug-polymer conjugate
developed in this thesis may have application for nebulisation of other
hydrophobic molecules, which have similar structural properties to genistein.
Since genistein-mPEG conjugate was not suitable for the delivery of erlotinib,
another lipid-based formulation approach was explored for this drug in Chapter 4.
Liposomes are lipid-based carriers used for various therapeutic applications
including cancer treatment (Sercombe et al., 2015; Rudokas et al., 2016). These
drug-carriers have more available space to accommodate exogenous compounds
within different lipid bilayers compared to micelles, due to their size and
lamellarity, and they are thermodynamically more stable than micelles following
dilution (Bozzuto and Molinari, 2015), retaining incorporation and maintaining
their size and structure better than micelles. Consequently, liposomes were
considered for the co-delivery of erlotinib and genistein in Chapter 4.
Erlotinib and genistein co-loaded liposomes were prepared by the traditional thin-
film hydration method, followed by probe-sonication. The in-vitro
characterisation of the developed liposome formulation co-loaded with erlotinib
and genistein was the major focus of this chapter. In order to develop
formulations, an understanding of the effect of drugs and excipients on the
properties of the lipid bilayer is important to optimise the quality attributes
liposomal system especially entrapment efficiency, drug release and in-vitro
stability (Demetzos, 2008; Chen et al., 2014). Thermal analysis using DSC, which
is commonly employed to explore drug interactions with the phospholipid bilayer,
is useful for liposomal formulation development. Two analytical methodologies
(HPLC and DSC) were employed to study drug incorporation and the molecular
interactions between drugs and lipids within the DPPC bilayer.
A new HPLC analytical method developed and validated according to ICH was
used to show that the maximum incorporation of erlotinib and genistein
individually and co-loaded in DPPC liposomes was 2.5% w/w. DSC thermograms
showed that the incorporation of both drugs into DPPC liposomes reduced the

Chapter 6 General conclusion and future work
247
packing of the acyl chain domain observed by a broadening of the main phase
transition, measured as an increase in the half-height width (HHW), with a
significant decrease in the main transition temperature of DPPC. This indicates an
increase in the fluidity of the hydrocarbon chains and a reduction of cooperative
unit within the phospholipid bilayer, suggestive of incorporation of the
hydrophobic drugs close to the upper regions of the bilayer and polar head group
of DPPC liposomes. The pre-transition was abolished on incorporation of the
drugs. These combined results confirm that erlotinib and genistein were
successfully incorporated into DPPC liposomes.
The highest HHW value was found with 2.5% w/w erlotinib and 2.5% w/w
genistein co-loaded liposomes, suggesting maximum drug incorporation. The
final liposome formulation co-loaded with erlotinib and genistein in the presence
of cholesterol (8 mol% of total lipid content) and DOPE (20 mol% of total lipid
content) after 30 min sonication showed mean hydrodynamic diameter and PDI of
approximately 136 nm and 0.45, respectively. The inclusion of cholesterol and
DOPE caused a change in membrane properties, resulting in enhanced drug
incorporation into the liposomes. The DSC data showed changes in the main
phase transition (Tm, HHW and ∆H) as compared to formulations containing only
drugs and DPPC, supporting that the incorporation of the two biomolecules into
DPPC bilayer disrupted the packing order of the hydrophobic hydrocarbon chains
and increased bilayer fluidity. The entrapment efficiency of genistein was 10
times higher than for erlotinib, being approximately 100% and 10%, respectively.
Thermal analysis using DSC showed that genistein had a more pronounced effect
on the bilayer properties than erlotinib. Specifically, it seems that the three
hydroxyl groups on the benzene rings of genistein are easier to protonate and can
form stronger ionic bonding with the phosphate and/or amine group of DPPC
compared with oxygen from the methoxyethoxy chains and nitrogen atoms from
the quinazolinamide ring of the erlotinib molecule. Moreover, the rigid structure
of erlotinib containing three benzene rings attached to alkyne may limit the
rotation and penetration of erlotinib molecules into the bilayer. From this,
differences in their molecular structure may be the main reason for differences in
partitioning into the bilayer and consequently encapsulation efficiency.

Chapter 6 General conclusion and future work
248
Since DSC can provide information about energetic properties, this method plays
an important role in the development of drug delivery systems such as for
prediction of maximum drug incorporation into membranes (Casado et al., 2016).
2.5% w/w erlotinib and 2.5% w/w genistein co-loaded liposomes were chosen for
future studies based on these findings and optimal liposome size. In Chapter 5,
nebulisation of 4 mL of this liposomal preparation for 10 min was considered
optimal, to give high delivery of erlotinib and genistein.
At the same flow rate of 15 L/min, the FSI (cooled at 5 ºC for 90 min) with
modifications was evaluated as an alternative to the NGI to overcome the
analytical drawbacks associated with the NGI for evaluating erlotinib delivered by
an air-jet nebuliser. An additional insert calibrated at 30 L/min of the FSI was
modified by covering three of six nozzles alternately with wet glass microfiber
filter to maintain a cut-off for 5 µm at the employed flow rate of 15 L/min. This
two-stage abbreviated impactor was found to be simple to use and labour-saving
for simple aerosol characterisation, with similar performance compared to the
NGI. This suggests the FSI may have great utility as a relatively quick method for
formulation development and evaluation of nebulised liposomal preparations.
There were differences in absolute values for FPD and FPF calculated using the
two impactors, but trends for both drugs were the same. The NGI gave higher
values for FPD and FPF compared to FSI (p<0.05).
The differences in absolute values may result from the longer distance that the
aerosol must pass as it travels through the full impactor, resulting in solvent loss
from the nebulised droplets. There are also differences in the way FPF/FPD are
calculated with the two impactors: by interpolation of cumulative fraction or
cumulative mass of active substance versus cut-off diameter plot for the NGI,
drug mass deposited on the lower stage for the FSI. The low absolute values for
FPF and FPD reflect that large volumes of formulation were nebulised, not to
dryness. Also, an internal dead space upstream of the FSI gives an internal
geometry of the FSI dissimilar to that of the NGI, resulting in differences in
particle deposition behaviour between the two impactors. Using the cooled FSI (5
ºC) at a flow rate of 15 L/min for 10 min demonstrated that for the developed

Chapter 6 General conclusion and future work
249
liposomal formulation the air-jet, rather than vibrating-mesh nebuliser, was the
more appropriate delivery device, giving higher FPF and FPD.
Whilst the majority of studies reported were conducted with sonicated liposomes,
the aerosol properties of nebulised extruded liposomes were also studied. Based
on the results, the membrane extrusion method improved the size stability of
liposomes during preparation and aerosolisation process as determined by particle
size distribution before and after nebulisation.
To conclude, the vibrating-mesh nebuliser was efficient; reaching dryness in a
short time (3-10 min) for both sonicated and extruded preparations under the same
operating conditions (Ari, 2014; Pritchard et al., 2018). However, the performance
of these devices is dependent on formulation physicochemical properties; for
example, ionic content, viscosity, surfactant, and particle size for dispersed
systems (Chan et al., 2011; Carvalho and McConville, 2016). The lower
efficiency of the vibrating-mesh nebuliser for delivering this specific formulation
may be due to the lower energy input for atomisation and absence of an ionic
component (particularly halides) or surfactant (Ghazanfari et al., 2007; Beck-
Broichsitter and Oesterheld, 2017). Pari GmbH has reported that nebulisation of
2.5 mL of salbutamol sulfate solutions in the presence of 0.9% w/v NaCl for 3
min using Pari Velox mesh nebuliser produced aerosol with MMAD and FPF, of
3.8 µm and 74%, respectively. Consequently, the inclusion of the appropriate type
and concentration of ionic solutions (usually chloride) and/or viscosity reducing
agent should be conducted in future work.
In terms of dose, formulations of curcumin, genistein and erlotinib for pulmonary
delivery are not commercially available; therefore the appropriate local dose given
via the pulmonary route should be evaluated. Clinical studies have suggested that
1500 mg daily is the recommended oral dose of curcumin for patients with lung
cancer (Gupta et al., 2013; Fadus et al., 2017). The dose required for the oral
treatment of NSCLC using erlotinib is 150 mg once daily (Yeo et al., 2010b, BNF,
2018). For genistein, an oral dose of 50 mg/kg body weight has been suggested
based on in vivo studies (Spagnuolo et al., 2015). Based on the present findings of
nebulised aerosols emitted from air-jet nebuliser, the fine particle doses of
Chapter 6 General conclusion and future work
250
curcumin in micelles, erlotinib and genistein in co-loaded liposomes are 123 mg,
49 mg, and 480 mg, respectively. Since a decrease in drug metabolised prior to
reaching the target site (pre-systemic metabolism) is one of the main benefits of
pulmonary delivery, a lower dose is often required for inhalation compared to oral
delivery for local lung co-delivery. In order to increase aerosol dosing,
preparation of formulations as a dry powder by spray-drying or freeze-drying
process, followed by reconstitution in a small volume of water is suggested. This
is to increase the concentration of drug in the final dispersion before nebulisation.
Also, dosing can be adjusted by increasing nebulisation time or frequency of
administration to achieve the desired dose of drug in the deep lung.
To sum up, all the findings of this thesis together support the development of two
formulation approaches for the co-delivery of a herbal substance (genistein) and a
cytotoxic drug (erlotinib) using liposomes and the combination of two herbal
substances (genistein and curcumin) using micelles as suitable for delivery as an
aerosol from a medical nebuliser. From previous reports of aerosol
characterisation for DPIs and pMDIs, the utility of the FSI has shown equivalent
performance to the NGI in terms of similar FPD and FPF (Mitchell and Nichols,
2011). In this study, the FSI was found to be a useful alternative to the NGI based
on the nebulised liposomal formulation containing genistein. The FSI is not able
to provide all the information that the NGI or other full cascade impactors do,
such as MMAD and GSD since these require plotting of multiple data points and
interpolation of data, which is not available with the FSI. This applies also to the
other two abbreviated impactors, namely the Fast Screening Andersen (FSA) and
Reduced Next Generation Impactor (rNGI), which employ two or three-sized
fractionating stages. However, the data obtained with abbreviated impactor is
sufficient and adequate for routine quality control and inhaler product
development including using ‘Efficient Data Analysis (EDA)’. Consequently, it
may be beneficial to use the FSI as an alternative impactor for quality control
where the purpose is to check for batch-to-batch variation as well as product
development applications of nebuliser formulations.

Chapter 6 General conclusion and future work
251
Future work
The findings presented in this thesis have demonstrated that the two studied
formulation approaches; micelles and liposomes can be considered for the co-
delivery of hydrophobic anticancer agents and their aerosol properties can be
characterised by a full-cascade impactor or an abbreviated impactor, following
nebulisation. There are four areas that future work could focus upon as listed
below.
1) Study of the biological activity of genistein in genistein-mPEG
conjugate
The aim of this study was to synthesize a new compound that may produce
polymeric micelles, which retain the biological activity of genistein. The hydroxyl
groups (-OH) attached to the benzene rings of genistein are responsible for its
biological activities (Pavese et al., 2010; Rusin et al., 2010; Yoon and Park, 2014).
For example, genistein can act as an antioxidant via protonation at –OH groups,
thereby protecting against oxidative damage (Yoon and Park, 2014). The
antiproliferative activity of genistein via inhibition of tyrosine kinase,
topoisomerase II and G2/M block of the cell cycle is also related to the structural
features of genistein. Consequently, the genistein-mPEG conjugate requires
further investigation to determine whether the activity of genistein such as
anticancer and antioxidant properties remain after being hydrolysed by
carboxylesterase enzyme in bronchial epithelial cell (Mutch et al., 2007).
Many studies have been carried out on the antioxidant activity of compounds
found in natural substances and medicinal herbs. In vitro studies, the antioxidant
activity of genistein in soybean can be determined by DPPH radical-scavenging
activity and ABTS radical-scavenging activity in future since these two methods
are sensitive to detect antioxidant activity within a short time (Mihaylova and
Schalow, 2013; Lee et al., 2015a).
To study the in vitro cytotoxic effect of genistein, A549 cells should be
considered since this NSCLC cell line has been used to study the anticancer

Chapter 6 General conclusion and future work
252
activity of genistein in combination with erlotinib or curcumin. The assessment of
cell viability can be determined using the 3-(4,5-dimethylthiazol-2-yl)-2,5-
diphenyltetrazolium bromide (MTT assay) to reflect the inhibition of cell growth
for human lung carcinoma cells (Liu et al., 2014b; Yang et al., 2016; Zhang et al.,
2017). Moreover, other hydrophobic drugs for cancer-related diseases may be
delivered using this conjugate.
2) Study of the synergistic activity of curcumin-loaded genistein-mPEG
polymeric micelles and liposomes co-loaded with erlotinib and
genistein
It should be noted that the genistein content in genistein-mPEG micelles could not
be accurately determined in this study. This is because the ester bond of genistein
and mPEG-COOH was not hydrolysed prior to HPLC determination. Further
studies should consider the hydrolysis of genistein from genistein-mPEG (Qiu et
al., 2010). Also, the potential synergistic anticancer activity in NSCLC may allow
dose reduction in combinations of genistein and curcumin and for genistein and
erlotinib. Therefore, a cell viability (A549 cell line) study should be carried out by
MTT assay to determine the lowest dose needed in the two drug combinations.
The data of in vitro cytotoxicity of combinations may suggest an appropriate
formulation approach as well as suitable dosing and treatment durations for
patients.
3) Study of the effect of fluid properties on the discriminatory ability of
the cascade impactors
The concept of Abbreviated Impactor Measurement (AIM) has received attention
from the pharmaceutical industry and instrument manufacturers as a quick method
of measuring Aerodynamic Particle Size Distribution (ASPD) using a reduced
number of stages in the impactor. The lower number of stages in the FSI as
compared to a full cascade impactor makes it possible for higher accuracy due to
low internal losses and less opportunity for analyst error, as well as for faster data
acquisition (Mitchell et al., 2009b). Various studies have previously been
conducted to compare the results obtained using the NGI or ACI and the FSI;
Chapter 6 General conclusion and future work
253
however, the use of FSI as an interchangeable impactor with the NGI for fluid
nebuliser for routine quality control and product development has not been
investigated widely.
In this work, liposomes were studied to explore the comparability of the full and
abbreviated cascade impactor methods. Future work should evaluate the effect of
changes in formulation properties (e.g. viscosity and surface tension) and
formulation strategies (solution, complexation, dendrimer etc.) on the
performance of the two cascade impactors with respect to critical quality
attributes such as emitted dose and fine particle dose to explore the relative ability
of full and abbreviated impactors to determine differences in aerosol properties
resulting from changes in fluid properties. Also, variations from multiple
operators should be tested for sensitivity of the NGI and the FSI.
4) Study of the effect of fluid properties on the performance of air-jet and
vibrating-mesh nebulisers
Based on the studies in this thesis, the air-jet nebuliser was found to be more
efficient than vibrating-mesh nebuliser, with significantly higher FPD and FPF for
curcumin-loaded genistein-mPEG micelles and for extruded liposomes co-loaded
with erlotinib and genistein. These findings were at variance with some previous
reports.
There are a number of factors affecting the aerosolisation performance of
vibrating-mesh devices. For example, components of the mesh itself (i.e. the size
of pore, the mode of vibration, shape of mesh, material used and the
aerosolisation mechanism) can vary widely between different manufacturers
(Pritchard et al., 2018). Additionally, various physicochemical properties; for
instance, surface tension, viscosity, salt and halide content and particle size in
dispersed systems also have effects on drug output rate delivered by vibrating-
mesh nebulisers (Ari, 2014; Pritchard et al., 2018). As stated in Chapter 3 and 5,
HPLC grade water was used to prepare micelles and liposomes to keep
formulations as simple as possible. For aerosol properties of nebulised droplet
delivered by air-jet and vibrating-mesh nebulisers, both formulations showed the

Chapter 6 General conclusion and future work
254
same trends. This may be because the particle size of drug-carriers (micelles and
liposomes) and fluid viscosity were similar.
The Velox mesh nebuliser used in this work, is based on the eFlow technology
(active-mesh nebuliser) and was launched by Pari GmbH in 2015 (Pritchard et al.,
2018). A further systematic investigation of various drug-carriers and fluid
properties should be considered for a better understanding of the droplet size, the
dose emitted from a particular device and the nebuliser output efficiency.

255
References
ABDELRAHIM, M. E. 2011. Aerodynamic characteristics of nebulized
terbutaline sulphate using the Andersen Cascade Impactor compared to the
Next Generation Impactor. Pharm Dev Technol, 16, 137-145.
ABDELRAHIM, M. E. & CHRYSTYN, H. 2009. Aerodynamic characteristics of
nebulized terbutaline sulphate using the Next Generation Impactor (NGI)
and CEN method. J Aerosol Med Pulm Drug Deliv, 22, 19-28.
ABDELRAHIM, M. E., PLANT, P. & CHRYSTYN, H. 2010. In-vitro
characterisation of the nebulised dose during non-invasive ventilation. J
Pharm Pharmacol, 62, 966-972.
ADITYA, N. P., SHIM, M., LEE, I., LEE, Y., IM, M. H. & KO, S. 2013.
Curcumin and genistein coloaded nanostructured lipid carriers: in vitro
digestion and antiprostate cancer activity. J Agric Food Chem, 61, 1878-
1883.
AHMAD, Z., SHAH, A., SIDDIQ, M. & KRAATZ, H. B. 2014. Polymeric
micelles as drug delivery vehicles. RSC Advances, 4, 17028-17038.
AJAZUDDIN, A., ALEXANDER, A., AMARJI, B. & KANAUJIA, P. 2013.
Synthesis, characterization and in vitro studies of pegylated melphalan
conjugates. Drug Dev Ind Pharm, 39, 1053-1062.
ALI, A. A., HSU, F. T., HSIEH, C. L., SHIAU, C. Y., CHIANG, C. H., WEI, Z.
H., CHEN, C. Y. & HUANG, H. S. 2016. Erlotinib-conjugated iron oxide
nanoparticles as a smart cancer-targeted theranostic probe for MRI. Sci
Rep, 6, 1-16.
ALMAHY, H. & ALHASSAN, N. 2011. Studies on the chemical constituents of
the leaves of ficus bengalensis and their antimicrobial activity. J Sci
Technol, 12, 118-124.
AMANI, A., YORK, P., CHRYSTYN, H. & CLARK, B. J. 2010. Evaluation of a
nanoemulsion-based formulation for respiratory delivery of budesonide by
nebulizers. AAPS PharmSciTech, 11, 1147-1151.
AMINI, M. A., FARAMARZI, M. A., GILANI, K., MOAZENI, E.,
ESMAEILZADEH-GHAREHDAGHI, E. & AMANI, A. 2014.
Production, characterisation, and in vitro nebulisation performance of
budesonide-loaded PLA nanoparticles. J Microencapsul, 31, 422-429.
ANAND, P., NAIR, H. B., SUNG, B., KUNNUMAKKARA, A. B., YADAV, V.
R., TEKMAL, R. R. & AGGARWAL, B. B. 2010. Design of curcumin-
loaded PLGA nanoparticles formulation with enhanced cellular uptake,
and increased bioactivity in vitro and superior bioavailability in vivo.
Biochim Pharmacol, 79, 330-338.
ANDRADE, L. M., DE FÁTIMA REIS, C., MAIONE-SILVA, L., ANJOS, J. L.
V., ALONSO, A., SERPA, R. C., MARRETO, R. N., LIMA, E. M. &
TAVEIRA, S. F. 2014. Impact of lipid dynamic behavior on physical
stability, in vitro release and skin permeation of genistein-loaded lipid
nanoparticles. Eur J Pharm BioPharm, 88, 40-47.
ANTONIO, P., RENATO, D., ANTONIO, D. N., MONICA, N., GIOVANNI, S.
& ANTONIO, T. 2004. Erbium(III) triflate: a valuable catalyst for the
rearrangement of epoxides to aldehydes and ketones. Synlett, 14, 2633-2635.

256
ARI, A. 2014. Jet, ultrasonic, and mesh nebulizers: an evaluation of nebulizers for
better clinical outcomes. Eurasian J Pulmonol, 16, 1-7.
ARZHAVITINA, A. & STECKEL, H. 2010. Surface active drugs significantly
alter the drug output rate from medical nebulizers. Int J Pharm, 384, 128-
136.
ATKINS, P. J. 2005. Dry powder inhalers: an overview. Respir Care, 50, 1304-
1312.
BABU, A., TEMPLETON, A. K., MUNSHI, A. & RAMESH, R. 2013.
Nanoparticle-based drug delivery for therapy of lung cancer: progress and
challenges. J Nanomater, 2013, 14-24.
BAKHTIARY, Z., BARAR, J., AGHANEJAD, A., SAEI, A. A., NEMATI, E.,
EZZATI NAZHAD DOLATABADI, J. & OMIDI, Y. 2017.
Microparticles containing erlotinib-loaded solid lipid nanoparticles for
treatment of non-small cell lung cancer. Drug Dev Ind Pharm, 43, 1244-
1253.
BANERJEE, S. S., AHER, N., PATIL, R. & KHANDARE, J. 2012.
Poly(ethylene glycol)-prodrug conjugates: concept, design, and
applications. J Drug Deliv, 2012, 17-33.
BARGHI, L., ASGARI, D., BARAR, J., NAKHLBAND, A. & VALIZADEH, H.
2014. Synthesis, characterization and in vitro anti-tumoral evaluation of
erlotinib-PCEC nanoparticles. Asian Pac J Cancer Prev, 15, 10281-10287.
BATRAKOVA, E., BRONICH, T., VETRO, J. & KABANOV, A. 2006. Polymer
micelles as drug carriers. Imperial College Press, pp 1-51.
BEASLEY, R., RAFFERTY, P. & HOLGATE, S. T. 1988. Adverse reactions to
the non-drug constituents of nebuliser solutions. Br J Clin Pharmacol, 25,
283-287.
BECK-BROICHSITTER, M. & OESTERHELD, N. 2017. Electrolyte type and
nozzle composition affect the process of vibrating-membrane nebulization.
Eur J Pharm Biopharm, 119, 11-16.
BENI, S., BUDAI, M., NOSZAL, B. & GROF, P. 2006. Molecular interactions in
imatinib-DPPC liposomes. Eur J Pharm Sci, 27, 205-211.
BERG, E., LAMB, P., ALI, A., DENNIS, J., TSERVISTAS, M. & MITCHELL, J.
2008. Assessment of the need to coat particle collection cups of the NGI to
mitigate droplet bounce when evaluating nebuliser-produced droplets.
Pharmeur Sci Notes, 1, 21-25.
BERG, E., MITCHELL, J., DENNIS, J., KREHER, C., JAUERNIG, J., LAMB,
P., KARLSSON, M., NIKANDER, K. & TSERVISTAS, M. 2007a. The
Nebuliser sub-team of the European Pharmaceutical Aerosol Group
(EPAG). DDL 2007, 1, 71-74.
BERG, E., SVENSSON, J. O. & ASKING, L. 2007b. Determination of nebulizer
droplet size distribution: a method based on impactor refrigeration. J
Aerosol Med, 20, 97-104.
BHATTACHARYA, S. & HALDAR, S. 2000. Interactions between cholesterol
and lipids in bilayer membranes. Role of lipid headgroup and hydrocarbon
chain–backbone linkage. Biochim Biophys Acta, 1467, 39-53.
BNF. 2018. British National Formulary 76th ed. London: BMJ Group and
Pharmaceutical Press.
BOAKYE, C. H. A., PATEL, K., DODDAPANENI, R., BAGDE, A.,
MAREPALLY, S. & SINGH, M. 2017. Novel amphiphilic lipid augments

257
the co-delivery of erlotinib and IL36 siRNA into the skin for psoriasis
treatment. J Control Rel, 246, 120-132.
BOHR, A. & BECK-BROICHSITTER, M. 2015. Generation of tailored aerosols
for inhalative drug delivery employing recent vibrating-mesh nebulizer
systems. Ther Deliv, 6, 621-636.
BOLANDNAZAR, S., DIVSALAR, A., VALIZADEH, H., KHODAEI, A. &
ZAKERI-MILANI, P. 2013. Development and application of an HPLC
method for erlotinib protein binding studies. Adv Pharm Bull, 3, 289-293.
BONAM, M., CHRISTOPHER, D., CIPOLLA, D., DONOVAN, B., GOODWIN,
D., HOLMES, S., LYAPUSTINA, S., MITCHELL, J., NICHOLS, S.,
PETTERSSON, G., QUALE, C., RAO, N., SINGH, D., TOUGAS, T.,
OORT, M. V., WALTHER, B. & WYKA, B. 2008. Minimizing variability
of cascade impaction measurements in inhalers and nebulizers. AAPS
PharmSciTech, 9, 404-413.
BOZZUTO, G. & MOLINARI, A. 2015. Liposomes as nanomedical devices. Int J
Nanomedicine, 10, 975-999.
BRIDGES, P. A. & TAYLOR, K. M. G. 2000. An investigation of some of the
factors influencing the jet nebulisation of liposomes. Int J Pharm, 204, 69-
79.
BUDAI, M., SZABÓ, Z., SZŐGYI, M. & GRÓF, P. 2003. Molecular interactions
between DPPC and morphine derivatives: a DSC and EPR study. Int J
Pharm, 250, 239-250.
CAI, L., YU, R., HAO, X. & DING, X. 2017. Folate receptor-targeted
bioflavonoid genistein-loaded chitosan nanoparticles for enhanced
anticancer effect in cervical cancers. Nanoscale Res Lett, 12, 509-517.
CARVALHO, T. C. & MCCONVILLE, J. T. 2016. The function and
performance of aqueous aerosol devices for inhalation therapy. J Pharm
Pharmacol, 68, 556-578.
CARVALHO, T. C., PETERS, J. I. & WILLIAMS, R. O. 2011. Influence of
particle size on regional lung deposition – what evidence is there? Int J
Pharm, 406, 1-10.
CASADO, A., GIUFFRIDA, M. C., SAGRISTA, M. L., CASTELLI, F., PUJOL,
M., ALSINA, M. A. & MORA, M. 2016. Langmuir monolayers and
differential scanning calorimetry for the study of the interactions between
camptothecin drugs and biomembrane models. Biochim Biophys Acta,
1858, 422-433.
CASTILE, J. D. & TAYLOR, K. M. G. 1999. Factors affecting the size
distribution of liposomes produced by freeze-thaw extrusion. Int J Pharm,
188, 87-95.
CASTILLO, P. M., DE LA MATA, M., CASULA, M. F., SÁNCHEZ-
ALCÁZAR, J. A. & ZADERENKO, A. P. 2014. PEGylated versus non-
PEGylated magnetic nanoparticles as camptothecin delivery system.
Beilstein J Nanotechnol, 5, 1312-1319.
CÉSAR, I. C., BRAGA, F. C., SOARES, C. D. V., DE AGUIAR NUNAN, E.,
PIANETTI, G. A., CONDESSA, F. A., BARBOSA, T. A. F. & CAMPOS,
L. M. M. 2006. Development and validation of a RP-HPLC method for
quantification of isoflavone aglycones in hydrolyzed soy dry extracts. J
Chromatogr B, 836, 74-78.

258
CHAN, J. G., KWOK, P. C., YOUNG, P. M., CHAN, H. K. & TRAINI, D. 2011.
Mannitol delivery by vibrating mesh nebulisation for enhancing
mucociliary clearance. J Pharm Sci, 100, 2693-2702.
CHANG, C. H., LEE, C. H., KO, J. C., CHANG, L. Y., LEE, M. C., WANG, J. Y.
& YU, C. J. 2017. Gefitinib or erlotinib in previously treated non-small-
cell lung cancer patients: a cohort study in Taiwan. Cancer Med, 6, 1563-
1572.
CHATBURN, R. L. & MCPECK, M. 2007. A new system for understanding
nebulizer performance. Respir Care, 52, 1037-1050.
CHEN, F., PENG, J., LEI, D., LIU, J. & ZHAO, G. 2013. Optimization of
genistein solubilization by κ-carrageenan hydrogel using response surface
methodology. Food Science and Human Wellness, 2, 124-131.
CHEN, H., CHEN, L., WANG, L., ZHOU, X., CHAN, J. Y., LI, J., CUI, G. &
LEE, S. M. 2016a. Synergistic effect of fenretinide and curcumin for
treatment of non-small cell lung cancer. Cancer Biol Ther, 1-8.
CHEN, J., HE, C. Q., LIN, A. H., XU, F., WANG, F., ZHAO, B., LIU, X., CHEN,
Z. P. & CAI, B. C. 2014. Brucine-loaded liposomes composed of HSPC
and DPPC at different ratios: in vitro and in vivo evaluation. Drug Dev Ind
Pharm, 40, 244-251.
CHEN, P., ZHANG, H., CHENG, S., ZHAI, G. & SHEN, C. 2016b.
Development of curcumin loaded nanostructured lipid carrier based
thermosensitive in situ gel for dermal delivery. Colloids Surf A
Physicochem Eng Asp, 506, 356-362.
CHEN, S. C., WU, G., SHI, J. & WANG, Y. Z. 2011. Novel "star anise"-like
nano aggregate prepared by self-assembling of preformed microcrystals
from branched crystalline-coil alternating multi-block copolymer. Chem
Commun, 47, 4198-4200.
CHEN, S. F., LU, W. F., WEN, Z. Y., LI, Q. & CHEN, J. H. 2012. Preparation,
characterization and anticancer activity of norcantharidin-loaded
poly(ethylene glycol)-poly(caprolactone) amphiphilic block copolymer
micelles. Pharmazie, 67, 781-788.
CHENG, Y. S. 2014. Mechanisms of pharmaceutical aerosol deposition in the
respiratory tract. AAPS PharmSciTech, 15, 630-640.
CHIU, M. H. & PRENNER, E. J. 2011. Differential scanning calorimetry: an
invaluable tool for a detailed thermodynamic characterization of
macromolecules and their interactions. J Pharm Bioallied Sci, 3, 39-59.
CHOI, K. H., MOON, S. H., PARK, S. K., CHO, G., NAM, K. & PARK, B. 2018.
Fabrication and characterization of medical mesh-nebulizer for aerosol
drug delivery. Appl Sci, 8, 604-616.
CHOLKAR, K., TRINH, H. M., VADLAPUDI, A. D. & MITRA, A. K. 2014.
Synthesis and characterization of ganciclovir long chain lipid prodrugs.
Adv Ophthalmol Vis Syst, 1-14.
CHOUNTOULESI, M., NAZIRIS, N., PIPPA, N. & DEMETZOS, C. 2017. The
significance of drug-to-lipid ratio to the development of optimized
liposomal formulation. J Liposome Res, 1-10.
CHOW, A. H., TONG, H. H., CHATTOPADHYAY, P. & SHEKUNOV, B. Y.
2007. Particle engineering for pulmonary drug delivery. Pharm Res, 24,
411-437.
CIPOLLA, D., BLANCHARD, J. & GONDA, I. 2016. Development of liposomal
ciprofloxacin to treat lung infections. Pharmaceutics, 8-39.

259
CIPOLLA, D., GONDA, I. & CHAN, H. K. 2013. Liposomal formulations for
inhalation. Ther Deliv, 4, 1047-1072.
CLARK, A. R. 1995. The use of laser diffraction for the evaluation of the aerosol
clouds generated by medical nebulizers. Int J Pharm, 115, 69-78.
CLAY, M. M., PAVIA, D., NEWMAN, S. P., LENNARD-JONES, T. &
CLARKE, S. W. 1983. Assessment of jet nebulisers for lung aerosol
therapy. Lancet, 2, 592-594.
CLAYTON, K. N., SALAMEH, J. W., WERELEY, S. T. & KINZER-URSEM, T.
L. 2016. Physical characterization of nanoparticle size and surface
modification using particle scattering diffusometry. Biomicrofluidics, 10,
1-14.
COATES, A. L. & HO, S. L. 1998. Drug administration by jet nebulization.
Pediatr Pulmonol, 26, 412-423.
COLOMBO, P., TRAINI, D. & BUTTINI, F. 2013. Aerodynamic assessment for
inhalation products: fundamentals and current pharmacopoeial methods.
IN COLOMBO, P. (Eds.) Inhalation drug delivery: techniques and
products. John Willey & Sons, Ltd.
CORTIJO, M. & CHAPMAN, D. 1981. A comparison of the interactions of
cholesterol and gramicidin a with lipid bilayers using an infrared data
station. FEBS Lett, 131, 245-248.
COUNCIL OF EUROPE. 2017. European Pharmacopoeia. Strasbourg: Council
of Europe.
COPLEY, M. 2014. Using breathing simulators to enhance inhaled product
testing. [online]. [Accessed 5th July 2018]. Available at
http://www.copleyscientific.com/files/ww/news/COP%20JOB%20251_Us
ing%20breathing%20simulators%20to%20enhance%20inhaled%20produc
t%20testing.pdf.
COPLEY, M. 2008. Cascade impactors: theory, design, and practical information
for optimal testing. [Online]. [Accessed 18th June 2018]. Available at
http://www.copleyscientific.com/files/ww/articles/Cascade%20Impactors.
pdf.
CRUPI, V., FICARRA, R., GUARDO, M., MAJOLINO, D., STANCANELLI, R.
& VENUTI, V. 2007. UV–vis and FTIR–ATR spectroscopic techniques to
study the inclusion complexes of genistein with β-cyclodextrins. J Pharm
Biomed Anal, 44, 110-117.
CUI, T., ZHANG, S. & SUN, H. 2017. Co-delivery of doxorubicin and pH-
sensitive curcumin prodrug by transferrin-targeted nanoparticles for breast
cancer treatment. Oncol Rep, 37, 1253-1260.
DAILEY, L. A., SCHMEHL, T., GESSLER, T., WITTMAR, M.,
GRIMMINGER, F., SEEGER, W. & KISSEL, T. 2003. Nebulization of
biodegradable nanoparticles: impact of nebulizer technology and
nanoparticle characteristics on aerosol features. J Control Rel, 86, 131-144.
DALBY, R., SPALLEK, M. & VOSHAAR, T. 2004. A review of the
development of Respimat® Soft Mist™ Inhaler. Int J Pharm, 283, 1-9.
DALBY, R., EICHER, J. & ZIERENBERG, B. 2011. Development of
Respimat(®) Soft Mist™ Inhaler and its clinical utility in respiratory
disorders. Med Devices (Auckl), 4, 145-155.
DANAFAR, H., DAVARAN, S., ROSTAMIZADEH, K., VALIZADEH, H. &
HAMIDI, M. 2014. Biodegradable m-PEG/PCL core-shell micelles:

260
preparation and characterization as a sustained release formulation for
curcumin. Adv Pharm Bull, 4, 501-510.
DANAFAR, H., ROSTAMIZADEH, K., DAVARAN, S. & HAMIDI, M. 2017.
Co-delivery of hydrophilic and hydrophobic drugs by micelles: a new
approach using drug conjugated PEG-PCLNanoparticles. Drug Dev Ind
Pharm, 43, 1908-1918.
DANCIU, C., SOICA, C., CSANYI, E., AMBRUS, R., FEFLEA, S., PEEV, C. &
DEHELEAN, C. 2012. Changes in the anti-inflammatory activity of soy
isoflavonoid genistein versus genistein incorporated in two types of
cyclodextrin derivatives. Chem Cent J, 6, 58-69.
DANDEKAR, P., VENKATARAMAN, C. & MEHRA, A. 2010. Pulmonary
targeting of nanoparticle drug matrices. J Aerosol Med Pulm Drug Deliv,
23, 343-353.
DARWIS, Y. & KELLAWAY, I. W. 2001. Nebulisation of rehydrated freeze-
dried beclomethasone dipropionate liposomes. Int J Pharm, 215, 113-121.
DAVIES, L. A., NUNEZ-ALONSO, G. A., MCLACHLAN, G., HYDE, S. & Gill,
H. 2014. Aerosol delivery of DNA/liposomes to the lung for cystic fibrosis
gene therapy. Hum Gene Ther Clin Dev, 25, 97-107.
DAVIS, B. M., RICHENS, J. L. & O'SHEA, P. 2011. Label-free critical micelle
concentration determination of bacterial quorum sensing molecules.
Biophys J, 101, 245-254.
DE BOER, A. H., GJALTEMA, D., HAGEDOORN, P. & FRIJLINK, H. W.
2002. Characterization of inhalation aerosols: a critical evaluation of
cascade impactor analysis and laser diffraction technique. Int J Pharm,
249, 219-231.
DE PABLO, E., FERNÁNDEZ-GARCÍA, R., BALLESTEROS, M. P.,
TORRADO, J. J. & SERRANO, D. R. 2017. Nebulised antibiotherapy:
conventional versus nanotechnology-based approaches, is targeting at a
nano scale a difficult subject? Ann Transl Med, 5, 448-464.
DEMETZOS, C. 2008. Differential Scanning Calorimetry (DSC): a tool to study
the thermal behavior of lipid bilayers and liposomal stability. J Liposome
Res, 18, 159-173.
DENNIS, J., BERG, E., SANDELL, D., ALI, A., LAMB, P., TSERVISTAS, M.,
KARLSSON, M. & MITCHELL, J. 2008. Cooling the NGI - an approach
to size a nebulised aerosol more accurately. Pharmeur Sci Notes, 2008,
27-30.
DENYER, J. & DYCHE, T. 2010. The Adaptive Aerosol Delivery (AAD)
technology: past, present, and future. J Aerosol Med Pulm Drug Deliv, 23,
1-10.
DESAI, T. R., HANCOCK, R. E. & FINLAY, W. H. 2002. A facile method of
delivery of liposomes by nebulization. J Control Rel, 84, 69-78.
DESHPANDE, D., BLANCHARD, J., SRINIVASAN, S., FAIRBANKS, D.,
FUJIMOTO, J., SAWA, T., WIENER-KRONISH, J., SCHREIER, H. &
GONDA, I. 2002. Aerosolization of lipoplexes using AERx® pulmonary
delivery system. AAPS PharmSci, 4, 12-21.
DHAND, R. 2010. Intelligent nebulizers in the age of the internet: the I-neb
Adaptive Aerosol Delivery (AAD) system. J Aerosol Med Pulm Drug
Deliv, 23, 3-5.
DOLOVICH, M. B. & DHAND, R. 2011. Aerosol drug delivery: developments in
device design and clinical use. Lancet, 377, 1032-1045.

261
DORA, C. P., TROTTA, F., KUSHWAH, V., DEVASARI, N., SINGH, C.,
SURESH, S. & JAIN, S. 2016. Potential of erlotinib cyclodextrin
nanosponge complex to enhance solubility, dissolution rate, in vitro
cytotoxicity and oral bioavailability. Carbohydr Polym, 137, 339-349.
DU, J. Z., LONG, H. Y., YUAN, Y. Y., SONG, M. M., CHEN, L., BI, H. &
WANG, J. 2012. Micelle-to-vesicle morphological transition via light-
induced rapid hydrophilic arm detachment from a star polymer. Chem
Commun, 48, 1257-1259.
DUNBAR, C. & MITCHELL, J. 2005. Analysis of cascade impactor mass
distributions. J Aerosol Med, 18, 439-451.
DUST, J. M., FANG, Z. H. & HARRIS, J. M. 1990. Proton NMR characterization
of poly(ethylene glycols) and derivatives. Macromolecules, 23, 3742-3746.
ECKERT, G. P., CHANG, S., ECKMANN, J., COPANAKI, E., HAGL, S.,
HENER, U., MULLER, W. E. & KOGEL, D. 2011. Liposome-
incorporated DHA increases neuronal survival by enhancing non-
amyloidogenic APP processing. Biochim Biophys Acta, 1808, 236-243.
EDWARDS, D. A., HANES, J., CAPONETTI, G., HRKACH, J., BEN-JEBRIA,
A., ESKEW, M. L., MINTZES, J., DEAVER, D., LOTAN, N. &
LANGER, R. 1997. Large porous particles for pulmonary drug delivery.
Science, 276, 1868-1872.
EL-GENDY, N., SELVAM, P., SONI, P. & BERKLAND, C. 2012. Development
of budesonide nanocluster dry powder aerosols: processing. J Pharm Sci,
101, 3425-3433.
ELHISSI, A. M. A., FAIZI, M., NAJI, W. F., GILL, H. S. & TAYLOR, K. M. G.
2007. Physical stability and aerosol properties of liposomes delivered
using an air-jet nebulizer and a novel micropump device with large mesh
apertures. Int J Pharm, 334, 62-70.
ELHISSI, A. M. A., GIEBULTOWICZ, J., STEC, A. A., WROCZYNSKI, P.,
AHMED, W., ALHNAN, M. A., PHOENIX, D. A. & TAYLOR, K. M. G.
2012. Nebulization of ultradeformable liposomes: the influence of
aerosolization mechanism and formulation excipients. Int J Pharm, 436,
519-526.
ELHISSI, A. M. A., GILL, H. S., AHMED, W. & TAYLOR, K. M. G. 2011a.
Vibrating-mesh nebulization of liposomes generated using an ethanol-
based proliposome technology. J Liposome Res, 21, 173-180.
ELHISSI, A. M. A., HIDAYAT, K., PHOENIX, D. A., MWESIGWA, E.,
CREAN, S., AHMED, W., FAHEEM, A. & TAYLOR, K. M. G. 2013.
Air-jet and vibrating-mesh nebulization of niosomes generated using a
particulate-based proniosome technology. Int J Pharm, 444, 193-199.
ELHISSI, A. M. A., KARNAM, K. K., DANESH-AZARI, M. R., GILL, H. S. &
TAYLOR, K. M. G. 2006a. Formulations generated from ethanol-based
proliposomes for delivery via medical nebulizers. J Pharm Pharmacol, 58,
887-894.
ELHISSI, A. M. A., O' NEILL, M. A., AHMED, W. & TAYLOR, K. M. G.
2011b. High-sensitivity differential scanning calorimetry for measurement
of steroid entrapment in nebulised liposomes generated from proliposomes.
IET Micro & Nano Letters, 6, 694-697.
ELHISSI, A. M. A., O’NEILL, M. A., ROBERTS, S. A. & TAYLOR, K. M. G.
2006b. A calorimetric study of dimyristoylphosphatidylcholine phase
262
transitions and steroid–liposome interactions for liposomes prepared by
thin film and proliposome methods. Int J Pharm, 320, 124-130.
EMA. 2006. Guideline on the pharmaceutical quality of inhalation and nasal
products. Committee for medicinal products for human use (CHMP).
[online]. [accessed 14th July 2017]. Available at
http://www.ema.europa.eu/ema/
FADUS, M. C., LAU, C., BIKHCHANDANI, J. & LYNCH, H. T. 2017.
Curcumin: an age-old anti-inflammatory and anti-neoplastic agent. J
Tradit Complement Med, 7, 339-346.
FAIVRE, L., GOMO, C., MIR, O., TAIEB, F., SCHOEMANN-THOMAS, A.,
ROPERT, S., VIDAL, M., DUSSER, D., DAUPHIN, A., GOLDWASSER,
F. & BLANCHET, B. 2011. A simple HPLC-UV method for the
simultaneous quantification of gefitinib and erlotinib in human plasma. J
Chromatogr B, 879, 2345-2350.
FINLAY, W. H. & STAPLETON, K. W. 1999. Undersizing of droplets from a
vented nebulizer caused by aerosol heating during transit through an
anderson impactor. J Aerosol Sci, 30, 105-109.
FISHLER, R. & SZNITMAN, J. 2017. A novel aerodynamic sizing method for
pharmaceutical aerosols using image-based analysis of settling velocities.
Inhalation, 11, 21-25.
FONSECA-SANTOS, B., GREMIÃO, M. P. D. & CHORILLI, M. 2016. A
simple reversed phase high-performance liquid chromatography (HPLC)
method for determination of in situ gelling curcumin-loaded liquid crystals
in in vitro performance tests. Arab J Chem, 10, 1029-1037.
FU, J., CAI, Z., GONG, Y., O’REILLY, S. E., HAO, X. & ZHAO, D. 2015. A
new technique for determining critical micelle concentrations of
surfactants and oil dispersants via UV absorbance of pyrene. Colloids Surf
A Physicochem Eng Asp, 484, 1-8.
GADGEEL, S. M., ALI, S., PHILIP, P. A., WOZNIAK, A. & SARKAR, F. H.
2009. Genistein enhances the effect of epidermal growth factor receptor
tyrosine kinase inhibitors and inhibits nuclear factor kappa B in nonsmall
cell lung cancer cell lines. Cancer, 115, 2165-2176.
GAO, M., CHEN, C., FAN, A., ZHANG, J., KONG, D., WANG, Z. & ZHAO, Y.
2015. Covalent and non-covalent curcumin loading in acid-responsive
polymeric micellar nanocarriers. Nanotechnology, 26, 1-7.
GAO, P., ZHANG, X., WANG, H., ZHANG, Q., LI, H., LI, Y. & DUAN, Y.
2016. Biocompatible and colloidally stabilized mPEG-PE/calcium
phosphate hybrid nanoparticles loaded with siRNAs targeting tumors.
Oncotarget, 7, 2855-2866.
GAO, X., WANG, B., WEI, X., RAO, W., AI, F., ZHAO, F., MEN, K., YANG,
B., LIU, X., HUANG, M., GOU, M., QIAN, Z., HUANG, N. & WEI, Y.
2013. Preparation, characterization and application of star-shaped
PCL/PEG micelles for the delivery of doxorubicin in the treatment of
colon cancer. Int J Nanomedicine, 8, 971-982.
GARBUZENKO, O. B., MAINELIS, G., TARATULA, O. & MINKO, T. 2014.
Inhalation treatment of lung cancer: the influence of composition, size and
shape of nanocarriers on their lung accumulation and retention. Cancer
Biol Med, 11, 44-55.
GARDIKIS, K., HATZIANTONIOU, S., VIRAS, K., WAGNER, M. &
DEMETZOS, C. 2006. A DSC and Raman spectroscopy study on the

263
effect of PAMAM dendrimer on DPPC model lipid membranes. Int J
Pharm, 318, 118-123.
GAZDAR, A., LINNOILA, L., KURITA, Y., OIE, H., MULSHINE., J., CLARK,
J. & WHITSETT, J. 1990. Peripheral airway cell differentation in human
lung cancer cell lines. Cancer Res, 50, 5481-5487.
GHARSE, S. & FIEGEL, J. 2016. Large porous hollow particles: lightweight
champions of pulmonary drug delivery. Curr Pharm Des, 22, 2463-2469.
GHAZANFARI, T., ELHISSI, A. M. A., DING, Z. & TAYLOR, K. M. G. 2007.
The influence of fluid physicochemical properties on vibrating-mesh
nebulization. Int J Pharm, 339, 103-111.
GILANI, K., MOAZENI, E., RAMEZANLI, T., AMINI, M., FAZELI, M. R. &
JAMALIFAR, H. 2011. Development of respirable nanomicelle carriers
for delivery of amphotericin B by jet nebulization. J Pharm Sci, 100, 252-
259.
GELLER, D. & KESSER, K. 2010. The I-neb adaptive aerosol delivery system
enhances delivery of α 1- antitrypsin with controlled inhalation. J Aerosol
Med Pulm Drug Deliv, 23, 55-59.
GILLES, V., VIEIRA, M. A., LACERDA, J. R., V., CASTRO, E. V. R.,
SANTOS, R. B., ORESTES, E., CARNEIRO, J. W. M. & GRECO, S. J.
2015. A new, simple and efficient method of steglich esterification of
juglone with long-chain fatty acids: synthesis of a new class of non-
polymeric wax deposition inhibitors for crude oil. J Brazil Chem Soc, 26,
74-83.
GOEL, A., BABOOTA, S., SAHNI, J. K. & ALI, J. 2013. Exploring targeted
pulmonary delivery for treatment of lung cancer. Int J Pharm Investig, 3,
8-14.
GONG, F., CHEN, D., TENG, X., GE, J., NING, X., SHEN, Y. L., LI, J. &
WANG, S. 2017. Curcumin-loaded blood-stable polymeric micelles for
enhancing therapeutic effect on erythroleukemia. Mol Pharm, 14, 2585-
2594.
GRAPATSAS, K., LEIVADITIS, V., TSILOGIANNI, Z., HAUSSMANN, E.,
KAPLUNOV, V., DAHM, M., ZAROGOULIDIS, P., HOHENFORST-
SCHMIDT, W., TSAKIRIDIS, K., FOROULIS, C., PALIOURAS, D.,
BARBETAKIS, N. & KOSAN, B. 2017. Epidermology, risk factors,
symptomatology, TNM classification of non small cell lung cnacer. An
overview while waiting the 8th TNM classification. Oncomedicine, 2, 14-
23.
GUO, C., NGO, D., AHADI, S. & DOUB, W. H. 2013. Evaluation of an
abbreviated impactor for Fine Particle Fraction (FPF) determination of
Metered Dose Inhalers (MDI). AAPS PharmSciTech, 14, 1004-1011.
GUPTA, S. C., PATCHVA, S. & AGGARWAL, B. B. 2013. Therapeutic roles of
curcumin: lessons learned from clinical trials. AAPS J, 15, 195-218.
HADIAN, Z., SAHARI, M. A., MOGHIMI, H. R. & BARZEGAR, M. 2014.
Formulation, characterization and optimization of liposomes containing
eicosapentaenoic and docosahexaenoic acids; a methodology approach.
Iran J Pharm Res, 13, 393-404.
HALLWORTH, G. W. & WESTMORELAND, D. G. 1987. The twin impinger: a
simple device for assessing the delivery of drugs from metered dose
pressurized aerosol inhalers. J Pharm Pharmacol, 39, 966-972.
264
HAMMERMAN, P. S., JÄNNE, P. A. & JOHNSON, B. E. 2009. Resistance to
epidermal growth factor receptor tyrosine kinase inhibitors in non–small
cell lung cancer. Clin Cancer Res, 15, 7502-7509.
HANS, M., SHIMONI, K., DANINO, D., SIEGEL, S. J. & LOWMAN, A. 2005.
Synthesis and characterization of mPEG−PLA prodrug micelles.
Biomacromolecules, 6, 2708-2717.
HASSAN, A. & NAFISA, A. 2011. Studies on the chemical constituents of the
leaves of ficus bengalensis and their antimicrobial activity. J Sci Tech, 12,
118-124.
HASSAN, M. S. & LAU, R. W. M. 2009. Effect of particle shape on dry particle
inhalation: study of flowability, aerosolization, and deposition properties.
AAPS PharmSciTech, 10, 1252-1262.
HASSANZADEH, F., FARZAN, M., VARSHOSAZ, J., KHODARAHMI, G. A.,
MAALEKI, S. & ROSTAMI, M. 2017. Poly (ethylene-co-vinyl alcohol)-
based polymeric thermo-responsive nanocarriers for controlled delivery of
epirubicin to hepatocellular carcinoma. Res Pharml Sci, 12, 107-118.
HEATH, F., NEWMAN, A., CLEMENTI, C., PASUT, G., LIN, H., STEPHENS,
G., WHALLEY, B., OSBORN, H. & GRECO, F. 2016. A novel PEG–
haloperidol conjugate with a non-degradable linker shows the feasibility of
using polymer–drug conjugates in a non-prodrug fashion. Polym Chem, 7,
7204-7210.
HERRERA C., URANGA, J. G., NARDI, M., PROCOPIO, A., WUNDERLIN, D.
A. & SANTIAGO, A. N. 2016. Selective and eco-friendly procedures for
the synthesis of benzimidazole derivatives. The role of the Er(OTf)(3)
catalyst in the reaction selectivity. Beilstein J Org Chem, 12, 2410-2419.
HERTEL, S., POHL, T., FRIESS, W. & WINTER, G. 2014. That’s cool! –
nebulization of thermolabile proteins with a cooled vibrating mesh
nebulizer. Eur J Pharm Biopharm, 87, 357-365.
HERTEL, S., WINTER, G. & FRIESS, W. 2015. Protein stability in pulmonary
drug delivery via nebulization. Adv Drug Deliv Rev, 93, 79-94.
HESS, D. 2008. Aerosol delivery devices in the treatment of asthma. Respir Care,
53, 699-723.
HESS, D. 2000. Nebulizers: principles and performance. Respir Care, 45, 609-
622.
HINNA, A., STEINIGER, F., HUPFELD, S., STEIN, P., KUNTSCHE, J. &
BRANDL, M. 2015. Filter-extruded liposomes revisited: a study into size
distributions and morphologies in relation to lipid-composition and
process parameters. J Liposome Res, 26, 11-20.
HIRA, D., KOIDE, H., NAKAMURA, S., OKADA, T., ISHIZEKI, K.,
YAMAGUCHI, M., KOSHIYAMA, S., OGUMA, T., ITO, K.,
FUNAYAMA, S., KOMASE, Y., MORITA, S. Y., NISHIGUCHI, K.,
NAKANO, Y. & TERADA, T. 2018. Assessment of inhalation flow
patterns of soft mist inhaler co-prescribed with dry powder inhaler using
inspiratory flow meter for multi inhalation devices. Plus One, 13, 1-12.
HO, S. L., KWONG, W. T., O'DROWSKY, L. & COATES, A. L. 2001.
Evaluation of four breath-enhanced nebulizers for home use. J Aerosol
Med, 14, 467-475.
HOLMKVIST, A. D., FRIBERG, A., NILSSON, U. J. & SCHOUENBORG, J.
2016. Hydrophobic ion pairing of a minocycline/Ca2+/AOT complex for

265
preparation of drug-loaded PLGA nanoparticles with improved sustained
release. Int J Pharm, 499, 351-357.
HOLZNER, P. M. & MÜLLER, B. W. 1995. Particle size determination of
metered dose inhalers with inertial separation methods: apparatus A and B
(BP), four stage impinger and andersen mark II cascade impactor. Int J
Pharm, 116, 11-18.
HU, L., LIANG, G., YULIANG, W., BINGJING, Z., XIANGDONG, Z. & RUFU,
X. 2013. Assessing the effectiveness and safety of liposomal paclitaxel in
combination with cisplatin as first-line chemotherapy for patients with
advanced NSCLC with regional lymph-node metastasis: study protocol for
a randomized controlled trial (PLC-GC trial). Trials, 14-45.
HU, L., SHI, Y., LI, J. H., GAO, N., JI, J., NIU, F., CHEN, Q., YANG, X. &
WANG, S. 2015. Enhancement of oral bioavailability of curcumin by a
novel solid dispersion system. AAPS PharmSciTech, 16, 1327-1334.
HUNTER, D. G. & FRISKEN, B. J. 1998. Effect of extrusion pressure and lipid
properties on the size and polydispersity of lipid vesicles. Biophys J, 74,
2996-3002.
IBRAHIM, M., VERMA, R. & GARCIA-CONTRERAS, L. 2015. Inhalation
drug delivery devices: technology update. Med Devices (Auckl), 8, 131-
139.
ICH. 2005. Validation of analytical procedures: text and methodology Q2 (R1).
ICH harmonised tripartile guideline. [online]. [Accessed 22nd November
2015]. Available at http://www.ich.org.
INGEBRIGTSEN, S. G., SKALKO-BASNET, N., DE ALBUQUERQUE
CAVALCANTI JACOBSEN, C. & HOLSAETER, A. M. 2017.
Successful co-encapsulation of benzoyl peroxide and chloramphenicol in
liposomes by a novel manufacturing method - dual asymmetric
centrifugation. Eur J Pharm Sci, 97, 192-199.
ISHII, T., YAMADA, M., HIRASE, T. & NAGASAKI, Y. 2005. New synthesis
of heterobifunctional poly(ethylene glycol) possessing a pyridyl disulfide
at one end and a carboxylic acid at the other end. Polym J, 37, 221-228.
ISO-22412. 2008. Particle Size Analysis, Dynamic Light Scattering (DLS).
International Organization for Standardization.
IYER, R., HSIA, C. C. & NGUYEN, K. T. 2015. Nano-therapeutics for the lung:
state-of-the-art and future perspectives. Curr Pharm Des, 21, 5233-5244.
JABBAL, S., POLI, G. & LIPWORTH, B. 2017. Does size really matter?:
relationship of particle size to lung deposition and exhaled fraction. J
Allergy Clin Immunol, 139, 2013-2014.
JEON, O., LEE, S. H., KIM, S. H., LEE, Y. M. & KIM, Y. H. 2003. Synthesis
and characterization of poly(l-lactide)−poly(ε-caprolactone) multiblock
copolymers. Macromolecules, 36, 5585-5592.
JEONG, Y. I., KIM, D. G., JANG, M. K. & NAH, J. W. 2008. Preparation and
spectroscopic characterization of methoxy poly(ethylene glycol)-grafted
water-soluble chitosan. Carbohydr Res, 343, 282-289.
JEVON, P. & EWENS, B. 2001. Assessment of a breathless patient. Nurs Stand,
15, 48-53.
JIANG, S., ZHU, R., HE, X., WANG, J., WANG, M., QIAN, Y. & WANG, S.
2017. Enhanced photocytotoxicity of curcumin delivered by solid lipid
nanoparticles. Int J Nanomedicine, 12, 167-178.

266
JIANG, Y. & KUANG, C. 2009. Novel one-pot synthesis of functionalized (Z)-2-
arylvinyl bromides. Synth Commun, 39, 4298-4308.
JIN, H., QIAO, F., WANG, Y., XU, Y. & SHANG, Y. 2015. Curcumin inhibits
cell proliferation and induces apoptosis of human non-small cell lung
cancer cells through the upregulation of miR-192-5p and suppression of
PI3K/Akt signaling pathway. Oncol Rep, 34, 2782-2789.
JOHAL, B., HOWALD, M., FISCHER, M., MARSHALL, J. & VENTHOYE, G.
2013. Fine particle profile of fluticasone propionate/formoterol fumarate
versus other combination products: the DIFFUSE study. Comb Prod Ther,
3, 39-51.
JOHNSON, K. R., ELLIS, G. & TOOTHILL, C. 1977. The sulfophosphovanillin
reaction for serum lipids: a reappraisal. Clin Chem, 23, 1669-1678.
JOSHI, N., SHIRSATH, N., SINGH, A., JOSHI, K. S. & BANERJEE, R. 2014.
Endogenous lung surfactant inspired pH responsive nanovesicle aerosols:
pulmonary compatible and site-specific drug delivery in lung metastases.
Sci Rep, 4, 1-11.
KAMALI, H., ABBASI, S., AMINI, M. A. & AMANI, A. 2016. Investigation of
factors affecting aerodynamic performance of nebulized nanoemulsion.
Iran J Pharm Res, 15, 687-693.
KANNAN, V., BALABATHULA, P., DIVI, M. K., THOMA, L. A. & WOOD, G.
C. 2015. Optimization of drug loading to improve physical stability of
paclitaxel-loaded long-circulating liposomes. J Liposome Res, 25, 308-315.
KARAMI, Z., SADIGHIAN, S., ROSTAMIZADEH, K., PARSA, M. &
REZAEE, S. 2016. Naproxen conjugated mPEG-PCL micelles for dual
triggered drug delivery. Mater Sci Eng C Mater Biol Appl, 61, 665-673.
KAROLINA, A. W., Stumbe J. F. & Rainer, H. 2016. Polyester-based,
biodegradable core-multishell nanocarriers for the transport of
hydrophobic drugs. Polymers, 8, 1-24.
KAVIRATNA, A. S. & BANERJEE, R. 2012. Nanovesicle aerosols as surfactant
therapy in lung injury. Nanomedicine, 8, 665-672.
KAYSER, C. H., CHARLES, B. & VACHANI, C. 2017. All about non-small cell
lung cancer. OncoLink, [online]. [Accessed 16th January 2019]. Available
at https://www.oncolink.org/cancers/lung/non-small-cell-lung-cancer-
nsclc/all-about-non-small-cell-lung-cancer.
KENDRICK, A. H., SMITH, E. C. & WILSON, R. S. 1997. Selecting and using
nebuliser equipment. Thorax, 52, 92-101.
KĘPCZYŃSKI, M., NAWALANY, K., KUMOREK, M., KOBIERSKA, A.,
JACHIMSKA, B. & NOWAKOWSKA, M. 2008. Which physical and
structural factors of liposome carriers control their drug-loading
efficiency? Chem Phys Lipids, 155, 7-15.
KHALE, A. & Bele, A. A. 2010. An overview onthin layer chromatography. Int J
Pharm Sci Res, 256-257.
KHAN, N. & MUKHTAR, H. 2015. Dietary agents for prevention and treatment
of lung cancer. Cancer Lett, 359, 155-164.
KHANDARE, J. & MINKO, T. 2006. Polymer–drug conjugates: progress in
polymeric prodrugs. Prog Polym Sci, 31, 359-397.
KHUROO, T., VERMA, D., KHUROO, A., ALI, A. & IQBAL, Z. 2018.
Simultaneous delivery of paclitaxel and erlotinib from dual drug loaded
PLGA nanoparticles: formulation development, thorough optimization and
in vitro release. J Mol Liq, 257, 52-68.

267
KIM, J. T., BARUA, S., KIM, H., HONG, S. C., YOO, S. Y., JEON, H., CHO, Y.,
GIL, S., OH, K. & LEE, J. 2017. Absorption study of genistein using solid
lipid microparticles and nanoparticles: control of oral bioavailability by
particle sizes. Biomol Ther, 25, 452-459.
KLEINSTREUER, C. & ZHANG, Z. 2010. Airflow and particle transport in the
human respiratory system. Annu Rev Fluid Mech, 42, 301-334.
KUHLI, M., WEISS, M. & STECKEL, H. 2009. A sampling and dilution system
for droplet aerosols from medical nebulisers developed for use with an
optical particle counter. J Aerosol Sci, 40, 523-533.
KUMAR, A., AHUJA, A., ALI, J. & BABOOTA, S. 2016. Curcumin-loaded lipid
nanocarrier for improving bioavailability, stability and cytotoxicity against
malignant glioma cells. Drug Deliv, 23, 214-229.
KUMI, D. J., MERCHANT, K., HACES, A., HORMANN, V. & JOHNSON, M.
2010. Genistein-selenium combination induces growth arrest in prostate
cancer cells. J Med Food, 13, 842-850.
KWON, S., KIM, S., HA, K., KANG, M., HUH, J., JONG, I., KIM, Y., PARK,
Y., KANG, K., LEE, S., CHANG, J., LEE, J. & CHOI, Y. 2007.
Pharmaceutical evaluation of genistein-loaded pluronic micelles for oral
delivery. Arch Pharmacal Res, 30, 1138-1143.
KWONG, T., TOWN, I., WINDOM, H. & BEASLEY, R. 1990. The use of water
as a diluent for bronchodilator nebuliser solutions. N Z Med J, 103, 290-
291.
LABIRIS, N. R. & DOLOVICH, M. B. 2003. Pulmonary drug delivery. Part I:
physiological factors affecting therapeutic effectiveness of aerosolized
medications. Br J Clin Pharmacol, 56, 588-599.
LARSON, N. & GHANDEHARI, H. 2012. Polymeric conjugates for drug
delivery. Chem Mater, 24, 840-853.
LASS, J. S., SANT, A. & KNOCH, M. 2006. New advances in aerosolised drug
delivery: vibrating membrane nebuliser technology. Expert Opin Drug
Deliv, 3, 693-702.
LATHA, S. T., ANANDA, S., JAMBULINGAM, M., SEREYA, K.,
KAMALAKANNAN, D. & ANILKUMAR, M. 2017. Development and
validation of RP-HPLC method for the estimation of erlotinib in
pharmaceutical formulation. Arab J Chem, 10, 1138-1144
LAVORINI, F. 2013. The challenge of delivering therapeutic aerosols to asthma
patients. ISRN Allergy, 2013, 1-17.
LAVORINI, F., PISTOLESI, M. & USMANI, O. S. 2017. Recent advances in
capsule-based dry powder inhaler technology. Multidiscip Respir Med, 12,
1-7.
LAWACZECK, R., KAINOSHO, M. & CHAN, S. I. 1976. The formation and
annealing of structural defects in lipid bilayer vesicles. Biochim Biophys
Acta, 443, 313-330.
LE BRUN, P. P., DE BOER, A. H., HEIJERMAN, H. G. & FRIJLINK, H. W.
2000. A review of the technical aspects of drug nebulization. Pharm
World Sci, 22, 75-81.
LEE, K. J., OH, Y. C., CHO, W. K. & MA, J. Y. 2015a. Antioxidant and anti-
inflammatory activity determination of one hundred kinds of pure
chemical compounds using offline and online screening HPLC assay. Evid
Based Complement Alternat Med, 2015, 1-13.

268
LEE, W. H., LOO, C. Y., TRAINI, D. & YOUNG, P. M. 2015b. Inhalation of
nanoparticle-based drug for lung cancer treatment: advantages and
challenges. Asian J Pharm Sci, 10, 481-489.
LEHOFER, B., BLODER, F., JAIN, P. P., MARSH, L. M., LEITINGER, G.,
OLSCHEWSKI, H., LEBER, R., OLSCHEWSKI, A. & PRASSL, R. 2014.
Impact of atomization technique on the stability and transport efficiency of
nebulized liposomes harboring different surface characteristics. Eur J
Pharm Biopharm, 88, 1076-1085.
LEUNG, K., LOUCA, E. & COATES, A. L. 2004. Comparison of breath-
enhanced to breath-actuated nebulizers for rate, consistency, and
efficiency. Chest, 126, 1619-1627.
LEWIS, D. A., O'SHEA, H., CHURCH, T. K., BRAMBILLA, G., TRAINI, D. &
YOUNG, P. M. 2016. Exploring the impact of sample flowrate on in vitro
measurements of metered dose inhaler performance. Int J Pharm, 514,
420-427.
LI, C., SHEN, Y., SUN, C., NIHAD, C. & TU, J. 2016. Immunosafety and
chronic toxicity evaluation of monomethoxypoly(ethylene glycol)-b-
poly(lactic acid) polymer micelles for paclitaxel delivery. Drug Deliv, 23,
888-895.
LI, H. Q., LUO, Y. & QIAO, C. H. 2012a. The mechanisms of anticancer agents
by genistein and synthetic derivatives of isoflavone. Mini Rev Med Chem,
12, 350-362.
LI, J., WANG, X., ZHANG, T., WANG, C., HUANG, Z., LUO, X. & DENG, Y.
2015. A review on phospholipids and their main applications in drug
delivery systems. Asian J Pharm Sci, 10, 81-98.
LI, Q., CAI, T., HUANG, Y., XIA, X., COLE, S. P. C. & CAI, Y. 2017. A review
of the structure, preparation, and application of NLCs, PNPs, and PLNs.
Nanomaterials (Basel), 7, 1-25.
LI, Q. S., LI, C. Y., LI, Z. L. & ZHU, H. L. 2012b. Genistein and its synthetic
analogs as anticancer agents. Anticancer Agents Med Chem, 12, 271-281.
LIAO, B. C., LIN, C. C., LEE, J. H. & YANG, C. H. 2017. Optimal management
of EGFR-mutant non-small cell lung cancer with disease progression on
first-line tyrosine kinase inhibitor therapy. Lung Cancer, 110, 7-13.
LIU, C. L., WU, G., CHEN, S. C., YOU, J. & WANG, Y. Z. 2014a.
Crystallization induced micellization of poly(p-dioxanone)-block-
polyethylene glycol diblock copolymer functionalized with pyrene moiety.
Chin Chem Lett, 25, 1311-1317.
LIU, D., YAN, L., WANG, L. A. N., TAI, W., WANG, W. & YANG, C. 2014b.
Genistein enhances the effect of cisplatin on the inhibition of non-small
cell lung cancer A549 cell growth in vitro and in vivo. Oncol Lett, 8,
2806-2810.
LOPEZ-PINTO, J. M., GONZALEZ-RODRIGUEZ, M. L. & RABASCO, A. M.
2005. Effect of cholesterol and ethanol on dermal delivery from DPPC
liposomes. Int J Pharm, 298, 1-12.
LU, X., ZHU, T., CHEN, C. & LIU, Y. 2014. Right or left: the role of
nanoparticles in pulmonary diseases. Int J Mol Sci, 15, 17577-17600.
MAHAJAN, H. S. & MAHAJAN, P. R. 2016. Development of grafted
xyloglucan micelles for pulmonary delivery of curcumin: in vitro and in
vivo studies. Int J Biol Macromol, 82, 621-627.
269
MAJORAL, C., PAPE, A. L., DIOT, P. & VECELLIO, L. 2006. Comparison of
various methods for processing cascade impactor data. Aerosol Sci
Technol, 40, 672-682.
MANCA, M. L., SINICO, C., MACCIONI, A. M., DIEZ, O., FADDA, A. M. &
MANCONI, M. 2012. Composition influence on pulmonary delivery of
rifampicin liposomes. Pharmaceutics, 4, 590-606.
MANDAL, B., MITTAL, N. K., BALABATHULA, P., THOMA, L. A. &
WOOD, G. C. 2016. Development and in vitro evaluation of core–shell
type lipid–polymer hybrid nanoparticles for the delivery of erlotinib in
non-small cell lung cancer. Eur J Pharm Sci, 81, 162-171.
MANSOUR, H. M., RHEE, Y. S. & WU, X. 2009. Nanomedicine in pulmonary
delivery. Int J Nanomedicine, 4, 299-319.
MANUNTA, M. D., MCANULTY, R. J., TAGALAKIS, A. D., BOTTOMS, S.
E., CAMPBELL, F., HAILES, H. C., TABOR, A. B., LAURENT, G. J.,
O'CALLAGHAN, C. & HART, S. L. 2011. Nebulisation of receptor-
targeted nanocomplexes for gene delivery to the airway epithelium. PLoS
One, 6, 1-13.
MARPLE, V. A., ROBERTS, D. L., ROMAY, F. J., MILLER, N. C., TRUMAN,
K. G., VAN OORT, M., OLSSON, B., HOLROYD, M. J., MITCHELL, J.
P. & HOCHRAINER, D. 2003. Next generation pharmaceutical impactor
(a new impactor for pharmaceutical inhaler testing). Part I: design. J
Aerosol Med, 16, 283-299.
MARTIN, G. P., MACRITCHIE, H. B., MARRIOTT, C. & ZENG, X. M. 2006.
Characterisation of a carrier-free dry powder aerosol formulation using
inertial impaction and laser diffraction. Pharm Res, 23, 2210-2219.
MASARUDIN, M. J., CUTTS, S. M., EVISON, B. J., PHILLIPS, D. R. &
PIGRAM, P. J. 2015. Factors determining the stability, size distribution,
and cellular accumulation of small, monodisperse chitosan nanoparticles
as candidate vectors for anticancer drug delivery: application to the
passive encapsulation of [(14)C]-doxorubicin. Nanotechnol Sci Appl, 8,
67-80.
MASHAT, M., CLARK, B. J., ASSI, K. H. & CHRYSTYN, H. 2016. In vitro
aerodynamic characterization of the dose emitted during nebulization of
tobramycin high strength solution by novel and jet nebulizer delivery
systems. Pulm Pharmacol Ther, 37, 37-42.
MAYER, L. D., HOPE, M. J. & CULLIS, P. R. 1986. Vesicles of variable sizes
produced by a rapid extrusion procedure. Biochim Biophys Acta, 858, 161-
168.
MCCALLION, O. N., TAYLOR, K. M. G., THOMAS, M. & TAYLOR, A. J.
1995. Nebulization of fluids of different physicochemical properties with
air-jet and ultrasonic nebulizers. Pharm Res, 12, 1682-1688.
MENON, J. U., RAVIKUMAR, P., PISE, A., GYAWALI, D., HSIA, C. C. W. &
NGUYEN, K. T. 2014. Polymeric nanoparticles for pulmonary protein and
DNA delivery. Acta Biomater, 10, 2643-2652.
MERCHANT, Z. 2017. DELIVERY OF NANOCARRIER-LOADED
HYDROPHOBIC DRUGS VIA THE AIRWAYS. High-performance
liquid chromatography (HPLC) and analytical method validation for
determination of CNB001 and curcumin. University College London.
MEYERS, C. L. F. & MEYERS, D. J. 2001. Thin-Layer Chromatography. Curr
Protoc Nucleic Acid Chem, 34, 1-13.

270
MIHAYLOVA, D. & SCHALOW, S. 2013. Antioxidant and stabilization activity
of a quercetin-containing flavonoid extract obtained from Bulgarian
sophora japonica L. Braz Arch Biol Technol, 56, 431-438.
MILLER, N. C., MARPLE, V. A., SCHULTZ, R. K. & POON, W. S. 1992.
Assessment of the twin impinger for size measurement of metered-dose
inhaler sprays. Pharm Res, 9, 1123-1127.
MITCHELL, J. P., COPLEY, M., SIZER, Y., RUSSELL, T. & SOLOMON, D.
2012a. Adapting the Abbreviated Impactor Measurement (AIM) concept
to make appropriate inhaler aerosol measurements to compare with
clinical data: a scoping study with the "Alberta" idealized throat (AIT)
inlet. J Aerosol Med Pulm Drug Deliv, 25, 188-197.
MITCHELL, J. P., MACKAY, H., AVVAKOUMOVA, V., ALI, R. & NAGEL,
M. 2008. The Abbreviated Impactor Measurement (AIM) concept:
influence of particle bounce and re-entrainment – application to the
Copley Fast Screening Andersen Impactor (C-FSA), DDL 2008, 2, 30-33.
MITCHELL, J. P,, TOUGAS, T. & LYAPUSTINA, S. 2012b. The Abbreviated
Impactor Measurement (AIM) and Effective Data Analysis (EDA)
Concepts: why they are important and how to go about working with them.
[Online]. [Accessed 12nd August 2018]. Available at
https://www.researchgate.net/profile/Jolyon_Mitchell/publication/2740650
63_The_Abbreviated_Impactor_Measurement_AIM_and_Effective_Data_
Analysis_EDA_Concepts_Why_They_are_Important_and_How_to_Go_
About_Working_with_Them/links/551349020cf23203199bb435/The-
Abbreviated-Impactor-Measurement-AIM-and-Effective-Data-Analysis-
EDA-Concepts-Why-They-are-Important-and-How-to-Go-About-
Working-with-Them.pdf.
MITCHELL, J. P,, NAGEL, M. W., AVVAKOUMOVA, V., MACKAY, H. &
ALI, R. 2009a. The abbreviated impactor measurement (AIM) concept:
part 1—influence of particle bounce and re-entrainment—evaluation with
a “Dry” Pressurized Metered Dose Inhaler (pMDI)-based formulation.
AAPS PharmSciTech, 10, 243-251.
MITCHELL, J. P., NAGEL, M. W., AVVAKOUMOVA, V., MACKAY, H. &
ALI, R. 2009b. The abbreviated impactor measurement (AIM) concept:
part 2-influence of evaporation of a volatile component-evaluation with a
"droplet-producing" pressurized metered dose inhaler (pMDI)-based
formulation containing ethanol as cosolvent. AAPS PharmSciTech, 10,
252-257.
MITCHELL, J. P., NAGEL, M. W., DOYLE, C. C., ALI, R., AVVAKOUMOVA,
V., CHRISTOPHER, J. D., QUIROZ, J., STRICKLAND, H., TOUGAS,
T. & LYAPUSTINA, S. 2010. Relative precision of inhaler Aerodynamic
Particle Size Distribution (APSD) metrics by full resolution and
abbreviated Andersen Cascade Impactors (ACIs): part 1. AAPS
PharmSciTech, 11, 843-851.
MITCHELL, J. P. & NICHOLS, S. C. 2011. Summary of abbreviated impactor
measurement workshop organized by the European Pharmaceutical
Aerosol Group. Ther Deliv, 2, 307-310.
MOAZENI, E., GILANI, K., NAJAFABADI, A. R., REZA-ROUINI, M.,
MOHAJEL, N., AMINI, M. & BARGHI, M. A. 2012. Preparation and
evaluation of inhalable itraconazole chitosan based polymeric micelles. J
Pharm Sci, 20, 85-85.

271
MOHAN, M., LEE, S., GUO, C., PERI, S. P. & DOUB, W. H. 2017. Evaluation
of Abbreviated Impactor Measurements (AIM) and Efficient Data
Analysis (EDA) for Dry Powder Inhalers (DPIs) against the full-resolution
Next Generation Impactor (NGI). AAPS PharmSciTech, 18, 1585-1594.
MOLINA, J. R., YANG, P., CASSIVI, S. D., SCHILD, S. E. & ADJEI, A. A.
2008. Non–small cell lung cancer: epidemiology, risk factors, treatment,
and survivorship. Mayo Clin Proc, 83, 584-594.
MOLLAEI, S., TAMHIDI, S., HASHEMPOUR, H. & GHASSEMPOUR, A.
2013. Recycling preparative high performance liquid chromatography for
the separation of curcumin from curcuminoids in Curcuma Longa L. Acta
Chromatogr, 27, 387-398.
MONTEIRO, N., MARTINS, A., REIS, R. L. & NEVES, N. M. 2014. Liposomes
in tissue engineering and regenerative medicine. J R Soc Interface, 11, 1-
24.
MORTON, L. A., SALUDES, J. P. & YIN, H. 2012. Constant pressure-controlled
extrusion method for the preparation of nano-sized lipid vesicles. J Vis
Exp, 64, 1-6.
MORTON, S. W., LEE, M. J., DENG, Z. J., DREADEN, E. C., SIOUVE, E.,
SHOPSOWITZ, K. E., SHAH, N. J., YAFFE, M. B. & HAMMOND, P. T.
2014. A nanoparticle-based combination chemotherapy delivery system
for enhanced tumor killing by dynamic rewiring of signaling pathways. Sci
Signal, 7, 1-27.
MOSSMAN, B. T., LIPPMANN, M., HESTERBERG, T. W., KELSEY, K. T.,
BARCHOWSKY, A. & BONNER, J. C. 2011. Pulmonary endpoints (lung
carcinomas and asbestosis) following inhalation exposure to asbestos. J
Toxicol Environ Health B Crit Rev, 14, 76-121.
MUCHAO, F. P. & FILHO, L. V. 2010. Advances in inhalation therapy in
pediatrics. J Pediatr, 86, 367-376.
MUTCH, E., NAVE, R., MCCRACKEN, N., ZECH, K. & WILLIAMS, F. M.
2007. The role of esterases in the metabolism of ciclesonide to
desisobutyryl-ciclesonide in human tissue. Biochem Pharmacol, 73, 1657-
1664.
NAJLAH, M., VALI, A., TAYLOR, M., ARAFAT, B. T., AHMED, W.,
PHOENIX, D. A., TAYLOR, K. M. G. & ELHISSI, A. M. A. 2013. A
study of the effects of sodium halides on the performance of air-jet and
vibrating-mesh nebulizers. Int J Pharm, 456, 520-527.
NAKAMURA, Y., MOCHIDA, A., CHOYKE, P. L. & KOBAYASHI, H. 2016.
Nanodrug delivery: is the enhanced permeability and retention effect
sufficient for curing cancer? Bioconjug Chem, 27, 2225-2238.
NASERI, N., ZAKERI-MILANI, P., HAMISHEHKAR, H., PILEHVAR-
SOLTANAHMADI, Y. & VALIZADEH, H. 2017. Development, in vitro
characterization, antitumor and aerosol performance evaluation of
respirable prepared by self-nanoemulsification method. Drug Res, 67, 343-
348.
NEWMAN, S. 2014. Improving inhaler technique, adherence to therapy and the
precision of dosing: major challenges for pulmonary drug delivery. Expert
Opin Drug Deliv, 11, 365-378.
NEWMAN, S. 2005. Principles of metered-dose inhaler design. Respir Care, 50,
1177-1190.

272
NG, Z. Y., WONG, J. Y., PANNEERSELVAM, J., MADHESWARAN, T.,
KUMAR, P., PILLAY, V., HSU, A., HANSBRO, N., BEBAWY, M.,
WARK, P., HANSBRO, P., DUA, K. & CHELLAPPAN, D. K. 2018.
Assessing the potential of liposomes loaded with curcumin as a
therapeutic intervention in asthma. Colloids Surf B, 172, 51-59.
NICHOLS, S. C., MITCHELL, J. P., SANDELL, D., ANDERSSON, P. U.,
FISCHER, M., HOWALD, M., PENGILLEY, R. & KRÜGER, P. 2016. A
multi-laboratory in vitro study to compare data from abbreviated and
pharmacopeial impactor measurements for orally inhaled products: a
report of the European Aerosol Group (EPAG). AAPS PharmSciTech, 17,
1383-1392.
NIERO, E. L., ROCHA-SALES, B., LAUAND, C., CORTEZ, B. A., DE SOUZA,
M. M., REZENDE-TEIXEIRA, P., URABAYASHI, M. S., MARTENS,
A. A., NEVES, J. H. & MACHADO-SANTELLI, G. M. 2014. The
multiple facets of drug resistance: one history, different approaches. J Exp
Clin Cancer Res, 33, 1-14.
NIKANDER, K., PRINCE, I., COUGHLIN, S., WARREN, S., & TAYLOR, G.
2010. Mode of breathing- tidal or slow and deep- through the I- neb
adaptive aerosol delivery (AAD) system affects lung deposition of 99mTc-
DTPA. J Aerosol Med Pulm Drug Deliv, 1, 37- 43.
NIVEN, R. W., PRESTRELSKI, S. J., TREUHEIT, M. J., IP, A. Y. &
ARAKAWA, T. 1996. Protein nebulization II. Stabilization of G-CSF to
air-jet nebulization and the role of protectants. Int J Pharm, 127, 191-201.
NOORZIDAH, M. S., ABU, N., MASTOR, A., HISHAM, S. & NOORSAL, K.
2012. Preparation and characterization of conjugated polyamidoamine-
mPEG-methotrexate for potential drug delivery system, AIP Conf Proc ,
1455, 70-82.
NURWIDYA, F., TAKAHASHI, F. & TAKAHASHI, K. 2016. Gefitinib in the
treatment of nonsmall cell lung cancer with activating epidermal growth
factor receptor mutation. J Nat Sc Biol Med, 7, 119-123.
O'CALLAGHAN, C. & BARRY, P. W. 1997. The science of nebulised drug
delivery. Thorax, 52, 31-44.
OGINO, K., KUBOTA, T., UCHIYAMA, H. & ABE, M. 1988. Micelle
formation and micellar size by a light scattering technique. J Oleo Sci, 37,
588-591.
ONG, S. G. M., CHITNENI, M., LEE, K. S., MING, L. C. & YUEN, K. H. 2016.
Evaluation of extrusion technique for nanosizing liposomes.
Pharmaceutics, 8, 1-12.
OWEN, S. C., CHAN, D. P. Y. & SHOICHET, M. S. 2012. Polymeric micelle
stability. Nano Today, 7, 53-65.
PANDEY, R., SHARMA, A., ZAHOOR, A., SHARMA, S., KHULLER, G. K. &
PRASAD, B. 2003. Poly (DL-lactide-co-glycolide) nanoparticle-based
inhalable sustained drug delivery system for experimental tuberculosis. J
Antimicrob Chemother, 52, 981-986.
PANDIT, N. T. & PATRAVALE, V. B. 2011. Design and optimization of a novel
method for extraction of genistein. Indian J Pharm Sci, 73, 184-192.
PARANJPE, M. & MÜLLER-GOYMANN, C. C. 2014. Nanoparticle-mediated
pulmonary drug delivery: a review. Int J Mol Sci, 15, 5852-5873.
PARDEIKE, J., WEBER, S., HABER, T., WAGNER, J., ZARFL, H. P., PLANK,
H. & ZIMMER, A. 2011. Development of an itraconazole-loaded
273
nanostructured lipid carrier (NLC) formulation for pulmonary application.
Int J Pharm, 419, 329-338.
PATIL, J. S. & SARASIJA, S. 2012. Pulmonary drug delivery strategies: a
concise, systematic review. Lung India, 29, 44-49.
PATTNI, B. S., CHUPIN, V. V. & TORCHILIN, V. P. 2015. New developments
in liposomal drug delivery. Chem Rev, 115, 10938-10966.
PAVESE, J. M., FARMER, R. L. & BERGAN, R. C. 2010. Inhibition of cancer
cell invasion and metastasis by genistein. Cancer Metast Rev, 29, 465-482.
PHAN, V., WALTERS, J., BROWNLOW, B. & ELBAYOUMI, T. 2013.
Enhanced cytotoxicity of optimized liposomal genistein via specific
induction of apoptosis in breast, ovarian and prostate carcinomas. J Drug
Target, 21, 1001-1111.
PILCER, G. & AMIGHI, K. 2010. Formulation strategy and use of excipients in
pulmonary drug delivery. Int J Pharm, 392, 1-19.
PILCER, G., VANDERBIST, F. & AMIGHI, K. 2008. Correlations between
cascade impactor analysis and laser diffraction techniques for the
determination of the particle size of aerosolised powder formulations. Int J
Pharm, 358, 75-81.
PITANCE, L., VECELLIO, L., LEAL, T., REYCHLER, G., REYCHLER, H. &
LIISTRO, G. 2010. Delivery efficacy of a vibrating mesh nebulizer and a
jet nebulizer under different configurations. J Aerosol Med Pulm Drug
Deliv, 23, 389-396.
PRITCHARD, J. N., HATLEY, R. H., DENYER, J. & HOLLEN, D. V. 2018.
Mesh nebulizers have become the first choice for new nebulized
pharmaceutical drug developments. Ther Deliv, 9, 121-136.
PYKA, A. 2014. Detection progress of selected drugs in TLC. BioMed Res Int,
2014, 1-19.
QIU, F., FENG, J., WU, D. Q., ZHANG, X. Z. & ZHUO, R. X. 2009. Nanosized
micelles self-assembled from amphiphilic dextran-graft-
methoxypolyethylene glycol/poly(ε-caprolactone) copolymers. Eur Polym
J, 45, 1024-1031.
QIU, N., CAI, L. L., XIE, D., WANG, G., WU, W., ZHANG, Y., SONG, H., YIN,
H. & CHEN, L. 2010. Synthesis, structural and in vitro studies of well-
dispersed monomethoxy-poly(ethylene glycol)-honokiol conjugate
micelles. Biomed Mater, 5, 1-6.
RAO, D. A., NGUYEN, D. X., MISHRA, G. P., DODDAPANENI, B. S. &
ALANI, A. W. 2015. Preparation and characterization of individual and
multi-drug loaded physically entrapped polymeric micelles. J Vis Exp, 102,
1-5.
RAU, J. L., ARI, A. & RESTREPO, R. 2004. Performance comparison of
nebulizer designs: constant-output, breath-enhanced, and dosimetric.
Respir Care, 49, 174-179.
RASTI, B., JINAP, S., MOZAFARI, M. R. & YAZID, A. M. 2012. Comparative
study of the oxidative and physical stability of liposomal and
nanoliposomal polyunsaturated fatty acids prepared with conventional and
Mozafari methods. Food Chem, 135, 2761-2170.
RAVAL, A., PARMAR, A., RAVAL, A. & BAHADUR, P. 2012. Preparation
and optimization of media using Pluronic® micelles for solubilization of
sirolimus and release from the drug eluting stents. Colloids Surf B, 93,
180-187.

274
RECK, M., HEIGENER, D. F., MOK, T., SORIA, J. C. & RABE, K. F. 2013.
Management of non-small-cell lung cancer: recent developments. Lancet,
382, 709-719.
RENATO, D., MONICA, N., MANUELA, O., ROSINA, P. & ANTONIO, P.
2009. Erbium(III) triflate is a highly efficient catalyst for the synthesis of
b-alkoxy alcohols, 1,2-diols and b-hydroxy sulfides by ring opening of
epoxides. Synthesis, 20, 3433-3438.
RESPAUD, R., MARCHAND, D., PARENT, C., PELAT, T., THULLIER, P.,
TOURNAMILLE, J. F., VIAUD-MASSUARD, M. C., DIOT, P., SI-
TAHAR, M., VECELLIO, L. & HEUZÉ-VOURC’H, N. 2014. Effect of
formulation on the stability and aerosol performance of a nebulized
antibody. mAbs, 6, 1347-1355.
RIEBESEEL, K., BIEDERMANN, E., LOSER, R., BREITER, N.,
HANSELMANN, R., MULHAUPT, R., UNGER, C. & KRATZ, F. 2002.
Polyethylene glycol conjugates of methotrexate varying in their molecular
weight from MW 750 to MW 40000: synthesis, characterization, and
structure-activity relationships in vitro and in vivo. Bioconjug Chem, 13,
773-785.
RIELY, G. J. & LADANYI, M. 2008. KRAS mutations: an old oncogene
becomes a new predictive biomarker. J Mol Diagn, 10, 493-495.
ROA, W. H., AZARMI, S., AL-HALLAK, M. H., FINLAY, W. H.,
MAGLIOCCO, A. M. & LOBENBERG, R. 2011. Inhalable nanoparticles,
a non-invasive approach to treat lung cancer in a mouse model. J Control
Rel, 150, 49-55.
ROCKS, N., BEKAERT, S., COIA, I., PAULISSEN, G., GUEDERS, M.,
EVRARD, B., VAN-HEUGEN, J. C., CHIAP, P., FOIDART, J. M.,
NOEL, A. & CATALDO, D. 2012. Curcumin-cyclodextrin complexes
potentiate gemcitabine effects in an orthotopic mouse model of lung
cancer. Br J Cancer, 107, 1083-1092.
RUBIN, B. K. & WILLIAMS, R. W. 2014. Emerging aerosol drug delivery
strategies: from bench to clinic. Adv Drug Deliv Rev, 75, 141-148.
RUDOKAS, M., NAJLAH, M., ALHNAN, M. A. & ELHISSI, A. M. A. 2016.
Liposome delivery systems for Inhalation: a critical review highlighting
formulation issues and anticancer applications. Med Princ Pract, 25, 60-
72.
RUSIN, A., KRAWCZYK, Z., GRYNKIEWICZ, G., GOGLER, A., ZAWISZA-
PUCHALKA, J. & SZEJA, W. 2010. Synthetic derivatives of genistein,
their properties and possible applications. Acta Biochim Pol, 57, 23-34.
RUSSO, M., SPAGNUOLO, C., TEDESCO, I. & RUSSO, G. L. 2010.
Phytochemicals in cancer prevention and therapy: truth or dare? Toxins, 2,
517-551.
SAEED, H., ELBERRY, A., SALAH, A., HAGAG, H. & ABDELRAHIM, M.
2017. Effect of nebulizer designs on aerosol delivery during non-invasive
mechanical ventilation: a modeling study of in vitro data, Pulm Ther, 3,
233-241.
SAHIB, M., DARWIS, Y., KOK-KHIANG, P. & TAN, Y. 2010. Aerodynamic
characterization of marketed inhaler dosage forms: High performance
liquid chromatography assay method for the determination of budesonide,
Afr J Pharm Pharmacol, 4, 878-884.

275
SAHIB, M., DARWIS, Y., PEH, K. K., ABDULAMEER, S. A. & TAN, Y. 2011.
Rehydrated sterically stabilized phospholipid nanomicelles of budesonide
for nebulization: physicochemical characterization and in vitro, in vivo
evaluations. Int J Nanomedicine, 6, 2351-2366.
SANGHA, R., PRICE, J. & BUTTS, C. A. 2010. Adjuvant therapy in non-small
cell lung cancer: current and future directions. The Oncologist, 15, 862-
872.
SANT, V. P. & NAGARSENKER, M. S. 2011. Synthesis of
monomethoxypolyethyleneglycol-cholesteryl ester and effect of its
incorporation in liposomes. AAPS PharmSciTech, 12, 1056-1063.
SAUNDERS, M., TAYLOR, K. M. G., CRAIG, D. Q., PALIN, K. & ROBSON,
H. 2007. High sensitivity differential scanning calorimetry study of DNA-
cationic liposome complexes. Pharm Res, 24, 1954-1961.
SCARANO, W., DE SOUZA, P. & STENZEL, M. 2014. Dual-drug delivery of
curcumin and platinum drugs in polymeric micelles enhances the
synergistic effects: a double act for the treatment of multidrug-resistant
cancer, Biomater Sci, 3, 163-174.
SCHETTINO, C., BARESCHINO, M. A., RICCI, V. & CIARDIELLO, F. 2008.
Erlotinib: an EGF receptor tyrosine kinase inhibitor in non-small-cell lung
cancer treatment. Expert Rev Respir Med, 2, 167-178.
SERCOMBE, L., VEERATI, T., MOHEIMANI, F., WU, S. Y., SOOD, A. K. &
HUA, S. 2015. Advances and challenges of liposome assisted drug
delivery. Front Pharmacol, 6, 1-13.
SHARMA, R. A., GESCHER, A. J. & STEWARD, W. P. 2005. Curcumin: the
story so far. Eur J Cancer, 41, 1955-1968.
SHIN, G. H., LI, J., CHO, J. H., KIM, J. T. & PARK, H. J. 2016. Enhancement of
curcumin solubility by phase change from crystalline to amorphous in cur-
TPGS nanosuspension. J Food Sci, 81, 494-501.
SHINDIKAR, A., SINGH, A., NOBRE, M. & KIROLIKAR, S. 2016. Curcumin
and resveratrol as promising natural remedies with nanomedicine approach
for the effective treatment of triple negative breast cancer. J Oncol, 2016,
1-13.
SHUKLA, V., CHANDRA, V., SANKHWAR, P., POPLI, P., KAUSHAL, J. B.,
SIROHI, V. K. & DWIVEDI, A. 2015. Phytoestrogen genistein inhibits
EGFR/PI3K/NF-kB activation and induces apoptosis in human
endometrial hyperplasial cells. RSC Advances, 5, 56075-56085.
SIEGEL, R., MA, J., ZOU, Z. & JEMAL, A. 2014. Cancer statistics, 2014. CA
Cancer J Clin, 64, 9-29.
SISTLA, R., TATA, V. S., KASHYAP, Y. V., CHANDRASEKAR, D. &
DIWAN, P. V. 2005. Development and validation of a reversed-phase
HPLC method for the determination of ezetimibe in pharmaceutical
dosage forms. J Pharm Biomed Anal, 39, 517-522.
SOJITRA, P., RAVAL, A., KOTHWALA, D., KOTADIA, H. & ADESHARA, S.
2010. Covalently conjugation of genistein with biodegradable poly l-
lactide. Trends Biomater Artif Organs, 23, 144-148.
SONG, Z., ZHU, W., LIU, N., YANG, F. & FENG, R. 2014. Linolenic acid-
modified PEG-PCL micelles for curcumin delivery. Int J Pharm, 471,
312-321.
SOTO-CASTRO, D., CRUZ-MORALES, J. A., RAMIREZ-APAN, M. T. &
GUADARRAMA, P. 2010. Synthesis of non-cytotoxic poly(ester-amine)

276
dendrimers as potential solubility enhancers for drugs: methotrexate as a
case study. Molecules, 15, 8082-8097.
SPAGNUOLO, C., RUSSO, G. L., ORHAN, I. E., HABTEMARIAM, S.,
DAGLIA, M., SUREDA, A., NABAVI, S. F., DEVI, K. P., LOIZZO, M.
R., TUNDIS, R. & NABAVI, S. M. 2015. Genistein and cancer: current
status, challenges, and future directions. Adv Nutr, 6, 408-419.
STAHLHOFEN, W., RUDOLF, G. & JAMES, A. C. 1989. Intercomparison of
experimental regional aerosol deposition data. J Aerosol Med, 2, 285-308.
STEIN, S. W., SHETH, P., HODSON, P. D. & MYRDAL, P. B. 2014. Advances
in metered dose inhaler technology: hardware development. AAPS
PharmSciTech, 15, 326-338.
STOLARCZYK, E. U., STOLARCZYK, K., LASZCZ, M., KUBISZEWSKI, M.,
MARUSZAK, W., OLEJARZ, W. & BRYK, D. 2017. Synthesis and
characterization of genistein conjugated with gold nanoparticles and the
study of their cytotoxic properties. Eur J Pharm Sci, 96, 176-185.
STURTEVANT, J. M. 1987. Biochemical applications of differential scanning
calorimetry. Annu Rev Phys Chem, 38, 463-488.
SUPKO, J. G. & PHILLIPS, L. R. 1995. High-performance liquid
chromatographic assay for genistein in biological fluids. J Chromatogr B
Biomed Appl, 666, 157-167.
TADROS, M. I. 2008. The influence of sodium hyaluronate, L-leucine and
sodium taurocholate on the nebulization of aqueous betamethasone-17-
valerate suspensions. AAPS PharmSciTech, 9, 243-249.
TAKAHASHI, A., OZAKI, Y., KUZUYA, A. & OHYA, Y. 2014. Impact of
core-forming segment structure on drug loading in biodegradable
polymeric micelles using pEG-b-poly(lactide-co-depsipeptide) block
copolymers. BioMed Res Int, 2014, 1-10.
TANG, J., XU, N., JI, H., LIU, H., WANG, Z. & WU, L. 2011. Eudragit
nanoparticles containing genistein: formulation, development, and
bioavailability assessment. Int J Nanomedicine, 6, 2429-2435.
TAYLOR, K. M. G. & MCCALLION, O. N. M. 1997. Ultrasonic nebulisers for
pulmonary drug delivery. Int J Pharm, 153, 93-104.
TAYLOR, K. M. G. & MORRIS, R. M. 1995. Thermal analysis of phase
transition behaviour in liposomes. Thermochim Acta, 248, 289-301.
TAYLOR, K. M. G. 2018. Pulmonary drug delivery. IN AULTON, M.E. &
TAYLOR, K. M. G. (Eds.) Aulton's pharmaceutics: the design and
manufacture of medicines. 5 ed. London, Elsevier Ltd., pp 653-670.
THATCHER, N., NICOLSON, M., GROVES, R. W., STEELE, J., EABY, B.,
DUNLOP, J., MCPHELIM, J., NIJJAR, R. & UKACHUKWU, I. 2009.
Expert consensus on the management of erlotinib-associated cutaneous
toxicity in the u.k. Oncologist, 14, 840-847.
TIMSINA, M. P., MARTIN, G. P., MARRIOTT, C., GANDERTON, D. &
YIANNESKIS, M. 1994. Drug delivery to the respiratory tract using dry
powder inhalers. Int J Pharm, 101, 1-13.
TOPEL, Ö., ÇAKIR, B. A., BUDAMA, L. & HODA, N. 2013. Determination of
critical micelle concentration of polybutadiene-block-poly(ethyleneoxide)
diblock copolymer by fluorescence spectroscopy and dynamic light
scattering. J Mol Liq, 177, 40-43.
TORCHILIN, V. P. 2001. Structure and design of polymeric surfactant-based
drug delivery systems. J Control Rel, 73, 137-172.

277
TÓTH, G., JÁNOSKA, Á., SZABÓ, Z. I., VÖLGYI, G., ORGOVÁN, G.,
SZENTE, L. & NOSZÁL, B. 2016. Physicochemical characterisation and
cyclodextrin complexation of erlotinib. Supramol Chem, 28, 656-664.
TOUGAS, T., CHRISTOPHER, D., MITCHELL, J., LYAPUSTINA, S., VAN
OORT, M., BAUER, R. & GLAAB, V. 2011a. Introduction. IN TOUGAS,
T., CHRISTOPHER, D., MITCHELL, J. (Eds). Good cascade impactor
practices, AIM and EDA for orally inhaled products, Springer US. 1-15.
TOUGAS, T., CHRISTOPHER, D., MITCHELL, J., LYAPUSTINA, S., VAN
OORT, M., BAUER, R. & GLAAB, V. 2011b. Product lifecycle approach
to cascade impaction measurements. AAPS PharmSciTech, 12, 312-322.
TRAN, P. H., HANSEN, P. E., NGUYEN, H. T. & LE, T. N. 2015. Erbium
trifluoromethanesulfonate catalyzed friedel–crafts acylation using
aromatic carboxylic acids as acylating agents under monomode-
microwave irradiation. Tetrahedron Lett, 56, 612-618.
TRUONG, D. H., TRAN, T. H., RAMASAMY, T., CHOI, J. Y., LEE, H. H.,
MOON, C., CHOI, H. G., YONG, C. S. & KIM, J. O. 2016. Development
of solid self-emulsifying formulation for improving the oral bioavailability
of erlotinib. AAPS PharmSciTech, 17, 466-473.
TSAI, J. R., LIU, P. L., CHEN, Y. H., CHOU, S. H., CHENG, Y. J., HWANG, J.
J. & CHONG, I. W. 2015. Curcumin inhibits non-small cell lung cancer
cells metastasis through the adiponectin/NF-kappab/MMPs signaling
pathway. PLoS One, 10, 1-19.
TURECEK, P. L., BOSSARD, M. J., SCHOETENS, F. & IVENS, I. A. 2016.
PEGylation of biopharmaceuticals: a review of chemistry and nonclinical
safety information of approved drugs. J Pharm Sci, 105, 460-475.
UNITED STATES PHARMACOPEIAL CONVENTION. 2005. The United
States Pharmacopeia: USP 29: the National Formulary: NF 24. Rockville,
Md.
USHA, S., JOHNSON, I. M. & MALATHI, R. 2005. Interaction of resveratrol
and genistein with nucleic acids. J Biochem Mol Biol, 38, 198-205.
VAN-DYKE, R. E. & NIKANDER, K. 2007. Delivery of iloprost inhalation
solution with the HaloLite, prodose, and I-neb adaptive aerosol delivery
systems: an in vitro study. Respir Care, 52, 184-190.
VIDEIRA, M. A., BOTELHO, M. F., SANTOS, A. C., GOUVEIA, L. F., DE
LIMA, J. J. & ALMEIDA, A. J. 2002. Lymphatic uptake of pulmonary
delivered radiolabelled solid lipid nanoparticles. J Drug Target, 10, 607-
613.
VRIGNAUD, S., HUREAUX, J., WACK, S., BENOIT, J.-P. & SAULNIER, P.
2012. Design, optimization and in vitro evaluation of reverse micelle-
loaded lipid nanocarriers containing erlotinib hydrochloride. Int J Pharm,
436, 194-200.
WALDREP, J. C. & DHAND, R. 2008. Advanced nebulizer designs employing
vibrating mesh/aperture plate technologies for aerosol generation. Curr
Drug Deliv, 5, 114-119.
WANG, C. H. & HSIUE, G. H. 2005. Polymer-DNA hybrid nanoparticles based
on folate-polyethylenimine-block-poly(L-lactide). Bioconjug Chem, 16,
391-396.
WANG, J., BYRNE, J. D., NAPIER, M. E. & DESIMONE, J. M. 2011. More
effective nanomedicines through particle design. Small, 7, 1919-1931.

278
WANG, L., XU, X., ZHANG, Y., ZHU, Y., SHI, J., SUN, Y. & HUANG, Q.
2013. Encapsulation of curcumin within poly(amidoamine) dendrimers for
delivery to cancer cells. J Mater Sci Mater Med, 24, 2137-2144.
WANG, Y., SCHMID-BINDERT, G. & ZHOU, C. 2012. Erlotinib in the
treatment of advanced non-small cell lung cancer: an update for clinicians.
Ther Adv Med Oncol, 4, 19-29.
WATTS, A. B., MCCONVILLE, J. T. & WILLIAMS, R. O. 2008. Current
therapies and technological advances in aqueous aerosol drug delivery.
Drug Dev Ind Pharm, 34, 913-922.
WU, R. G., WANG, Y. R., WU, F. G., ZHOU, H. W., ZHANG, X. H. & HOU, J.
L. 2012. A DSC study of paeonol-encapsulated liposomes, comparison the
effect of cholesterol and stigmasterol on the thermotropic phase behavior
of liposomes. J Therm Anal Calorim, 109, 311-316.
WU, Y., WANG, W., CHEN, Y., HUANG, K., SHUAI, X., CHEN, Q., LI, X. &
LIAN, G. 2010. The investigation of polymer-siRNA nanoparticle for
gene therapy of gastric cancer in vitro. Int J Nanomedicine, 5, 129-136.
XIANG, L., SHEN, L. J., LONG, F., YANG, K., FAN, J. B., LI, Y. J., XIANG, J.
& ZHU, M. Q. 2011. A convenient method for the synthesis of the
amphiphilic triblock copolymer poly(L-lactic acid)-block-poly(l-lysine)-
block-poly(ethylene glycol) monomethyl ether. Macromol Chem Phys,
212, 563-573.
XIE, Z., LU, T., CHEN, X., ZHENG, Y. & JING, X. 2009. Synthesis, self-
assembly in water, and cytotoxicity of MPEG-block-PLLA/DX conjugates.
J Biomed Mater Res A, 88, 238-245.
XU, H., HE, C., LIU, Y., JIANG, J. & MA, T. 2017. Novel therapeutic modalities
and drug delivery - erlotinib liposomes modified with galactosylated lipid:
in vitro and in vivo investigations. Artif Cells Nanomed Biotechnol, 1-6.
YANG, C. J., TSAI, M. J., HUNG, J. Y., LEE, M. H., TSAI, Y. M., TSAI, Y. C.,
HSU, J. F., LIU, T. C., HUANG, M. S. & CHONG, I. W. 2017a. The
clinical efficacy of afatinib 30 mg daily as starting dose may not be
inferior to afatinib 40 mg daily in patients with stage IV lung
adenocarcinoma harboring exon 19 or exon 21 mutations. BMC
Pharmacol Toxicol, 18, 1-8.
YANG, K. M., SHIN, I. C., PARK, J. W., KIM, K. S., KIM, D. K., PARK, K. &
KIM, K. 2017b. Nanoparticulation improves bioavailability of erlotinib.
Drug Dev Ind Pharm, 43, 1557-1565.
YANG, X., LI, Z., WANG, N., LI, L., SONG, L., HE, T., SUN, L., WANG, Z.,
WU, Q., LUO, N., YI, C. & GONG, C. 2015. Curcumin-encapsulated
polymeric micelles suppress the development of colon cancer in vitro and
in vivo. Sci Rep, 5, 1-15.
YANG, Y., ZANG, A., JIA, Y., SHANG, Y., ZHANG, Z., GE, K., ZHANG, J.,
FAN, W. & WANG, B. 2016. Genistein inhibits A549 human lung cancer
cell proliferation via miR-27a and MET signaling. Oncol Lett, 12, 2189-
2193.
YAO, H., XU, W., SHI, X. & ZHANG, Z. 2011. Dietary flavonoids as cancer
prevention agents. J Environ Sci Health Environ Carcinog Ecotoxicol Rev,
29, 1-31.
YEAP, G. Y., ALSHARGABI, A., ITO, M. M., MAHMOOD, W. A. K. &
TAKEUCHI, D. 2012. Synthesis and anisotropic properties of azo-bridged
benzothiazole-phenyl esters. Mol Cryst Liq Cryst, 557, 126-133.

279
YEO, L. Y., FRIEND, J. R., MCINTOSH, M. P., MEEUSEN, E. N. & MORTON,
D. A. 2010a. Ultrasonic nebulization platforms for pulmonary drug
delivery. Expert Opin Drug Deliv, 7, 663-679.
YEO, W. L., RIELY, G. J., YEAP, B. Y., LAU, M. W., WARNER, J. L., BODIO,
K., HUBERMAN, M. S., KRIS, M. G., TENEN, D. G., PAO, W.,
KOBAYASHI, S. & COSTA, D. B. 2010b. Erlotinib at a dose of 25 mg
daily for non-small cell lung cancers with EGFR mutations. J Thorac
Oncol, 5, 1048-1053.
YIN, H., ZHANG, H. & LIU, B. 2013. Superior anticancer efficacy of curcumin-
loaded nanoparticles against lung cancer. Acta Biochim Biophys Sin, 45,
634-640.
YOON, G. A. & PARK, S. 2014. Antioxidant action of soy isoflavones on
oxidative stress and antioxidant enzyme activities in exercised rats. Nutr
Res Pract, 8, 618-624.
ZAPPA, C. & MOUSA, S. A. 2016. Non-small cell lung cancer: current treatment
and future advances. Transl Lung Cancer Res, 5, 288-300.
ZAROGOULIDIS, K., ZAROGOULIDIS, P., DARWICHE, K., BOUTSIKOU,
E., MACHAIRIOTIS, N., TSAKIRIDIS, K., KATSIKOGIANNIS, N.,
KOUGIOUMTZI, I., KARAPANTZOS, I., HUANG, H. & SPYRATOS,
D. 2013. Treatment of non-small cell lung cancer (NSCLC). J Thorac Dis,
5, 389-396.
ZHANG, C. Y., XIONG, D., SUN, Y., ZHAO, B., LIN, W. J. & ZHANG, L. J.
2014a. Self-assembled micelles based on pH-sensitive PAE-g-MPEG-
cholesterol block copolymer for anticancer drug delivery. Int J
Nanomedicine, 9, 4923-4933.
ZHANG, G., DAVID, A. & WIEDMANN, T. S. 2007a. Performance of the
vibrating membrane aerosol generation device: aeroneb micropump
nebulizer. J Aerosol Med, 20, 408-416.
ZHANG, J., SU, H., LI, Q., LI, J. & ZHAO, Q. 2017. Genistein decreases A549
cell viability via inhibition of the PI3K/AKT/HIF1alpha/VEGF and
NFkappaB/COX2 signaling pathways. Mol Med Rep, 15, 2296-2302.
ZHANG, J., ZHAO, Y. J., SU, Z. G. & MA, G. H. 2007b. Synthesis of
monomethoxy poly(ethylene glycol) without diol poly(ethylene glycol). J
Appl Polym Sci, 105, 3782-3786.
ZHANG, T., CHEN, Y., GE, Y., HU, Y., LI, M. & JIN, Y. 2018. Inhalation
treatment of primary lung cancer using liposomal curcumin dry powder
inhalers. Acta Pharm Sin B, 8, 440-448.
ZHANG, W., LI, X., YE, T., CHEN, F., YU, S., CHEN, J., YANG, X., YANG,
N., ZHANG, J., LIU, J., PAN, W. & KONG, J. 2014b. Nanostructured
lipid carrier surface modified with eudragit RS 100 and its potential
ophthalmic functions. Int J Nanomedicine, 9, 4305-4315.
ZHANG, X., LIU, Q., HU, J., XU, L. & TAN, W. 2014c. An aerosol formulation
of R-salbutamol sulfate for pulmonary inhalation. Acta Pharm Sin B, 4,
79-85.
ZHANG, X., SHEN, Z., FENG, C., YANG, D., LI, Y., HU, J., LU, G. & HUANG,
X. 2009. PMHDO-g-PEG double-bond-based amphiphilic graft
copolymer: synthesis and diverse self-assembled nanostructures.
Macromolecules, 42, 4249-4256.
ZHANG, Y., HUANG, Y. & LI, S. 2014d. Polymeric micelles: nanocarriers for
cancer-targeted drug delivery. AAPS PharmSciTech, 15, 862-781.

280
ZHAO, L., FENG, S. S. & GO, M. L. 2004. Investigation of molecular
interactions between paclitaxel and DPPC by langmuir film balance and
differential scanning calorimetry. J Pharm Sci, 93, 86-98.
ZHAO, L., FENG, S. S., KOCHERGINSKY, N. & KOSTETSKI, I. 2007. DSC
and EPR investigations on effects of cholesterol component on molecular
interactions between paclitaxel and phospholipid within lipid bilayer
membrane. Int J Pharm, 338, 258-266.
ZHOU, X., TAO, H. & SHI, K. H. 2018. Development of a nanoliposomal
formulation of erlotinib for lung cancer and in vitro/in vivo antitumoral
evaluation. Drug Des Devl Ther, 12, 1-8.
ZHOU, Y., AHUJA, A., IRVIN, C. M., KRACKO, D. A., MCDONALD, J. D. &
CHENG, Y. S. 2005. Medical nebulizer performance: effects of cascade
impactor temperature. Respir Care, 50, 1077-1082.
ZHU, W. T., LIU, S. Y., WU, L., XU, H. L., WANG, J., NI, G. X. & ZENG, Q. B.
2017. Delivery of curcumin by directed self-assembled micelles enhances
therapeutic treatment of non-small-cell lung cancer. Int J Nanomedicine,
12, 2621-2634.
ZIEGLER, J. & WACHTEL, H. 2005. Comparison of cascade impaction and
laser diffraction for particle size distribution measurements, J Aerosol Med,
18, 311-324.
281
Publication and presentations
Publication
NIMMANO, N., TAYLOR, K. M. G., SOMAVARAPU, S. 2018. Aerosol
characterisation of nebulised liposomes co-loaded with erlotinib and genistein
using an abbreviated cascade impactor method. Int J Pharm, 542, 8-17.
Poster presentations
NIMMANO, N., TAYLOR, K. M. G., SOMAVARAPU, S. 2016. Novel
curcumin-loaded nanocarrier for pulmonary delivery. Annual Meeting-Controlled
Release Society 2016, Washington (U.S.A), 17- 20 July 2016.
NIMMANO, N., TAYLOR, K. M. G., SOMAVARAPU, S. 2017. Aerosol
characterisation of nebulised liposomes co-loaded with erlotinib and genistein.
Drug Delivery to the Lungs 2017, Edinburgh (UK), 6- 8 December 2017.
Internal UCL Presentations
NIMMANO, N., TAYLOR, K. M. G., SOMAVARAPU, S. 2016. A thermal
analysis investigation of erlotinib and genistein-loaded liposome. UCL School of
Pharmacy PhD Research Day, London (UK), September 2016. Poster presentation.
NIMMANO, N., TAYLOR, K. M. G., SOMAVARAPU, S. 2017. Aerosol
characterisation of nebulised liposomes co-loaded with erlotinib and genistein.
UCL School of Pharmacy PhD Research Day, London (UK), April 2017. Oral
presentation.