developing travelshed taz using arcgis 15 th trb national transportation planning applications...
TRANSCRIPT

Developing Travelshed TAZ Using ArcGIS15th TRB National Transportation Planning Applications ConferenceMay 20, 2015
Erich Rentz, RSGVince Bernardin, PhD, RSGBrian GradyRobert Rock, TDOT

205.20.15RSG
Outline
• Introducing Travelshed Transportation Analysis Zones (TAZ)‒ Traditional 4-Step Travel Demand Model TAZ‒ Traditional vs. Travelshed TAZ‒ Advantages of Travelshed TAZ ‒ Case Study Introduction: Tennessee Statewide Model
• Developing Travelshed TAZ‒ Delineation Process Outline‒ Common Boundary Identification‒ Automated Delineation‒ Manual Review and Revision
• Concluding Thoughts
• Questions?

Introducing Travelshed TAZ

405.20.15RSG
Traditional 4-Step Travel Demand Model TAZ
Traditional Transportation Analysis Zone (TAZ) Definition Limitations:
• Zones defined and delineated by the transportation network
• Opposite sides of the same street are often split into different Zones
• In urban areas, assessment of walkability difficult
• In rural areas / statewide models, assessment of area type difficult

505.20.15RSG
Traditional vs. Travelshed TAZ
What is a travelshed?
• View road facilities and their catchment areas as akin to rivers and their basins in a hydrological system

605.20.15RSG
Advantages of Travelshed TAZ
• Clearer relationship between zones and underlying roadways
– Less ambiguity around placement of loading points (centroid connectors)
• Walkability clearer in urban areas
• Area type much clearer in rural areas
• Naturally takes into account other boundaries and barriers to travel

705.20.15RSG
Case Study Introduction: Tennessee Statewide Model
New Network and Zone System has ~3x as much detail• Roadmiles in TN: 9,421 to 32,546• TAZ in TN: 1,222 to 3,293
Original 2005 Model
New Version 2Model

805.20.15RSG
Case Study Introduction: Delineation Approach
Urban (MPO) areas • Emphasis on consistency with MPO TAZ
− Statewide TAZ developed from aggregated MPO TAZ
• Part travelshed, part traditional delineations
Rural areas• Emphasis on delineating area types /small towns
− Statewide TAZ developed from aggregated census blocks
• Predominantly travelshed delineations

Developing Travelshed TAZ

1005.20.15RSG
Delineation Process Outline
Common Boundary
Identification
Automated Delineation
Manual Review and
Revision

1105.20.15RSG
Common Boundary Identification
Boundaries & Travel Barriers
Boundaries– Counties– Census Designated Places
(CDP)– National & State Parks
Barriers – Roadways – Railroads– Rivers– Ridgelines
1205.20.15RSG
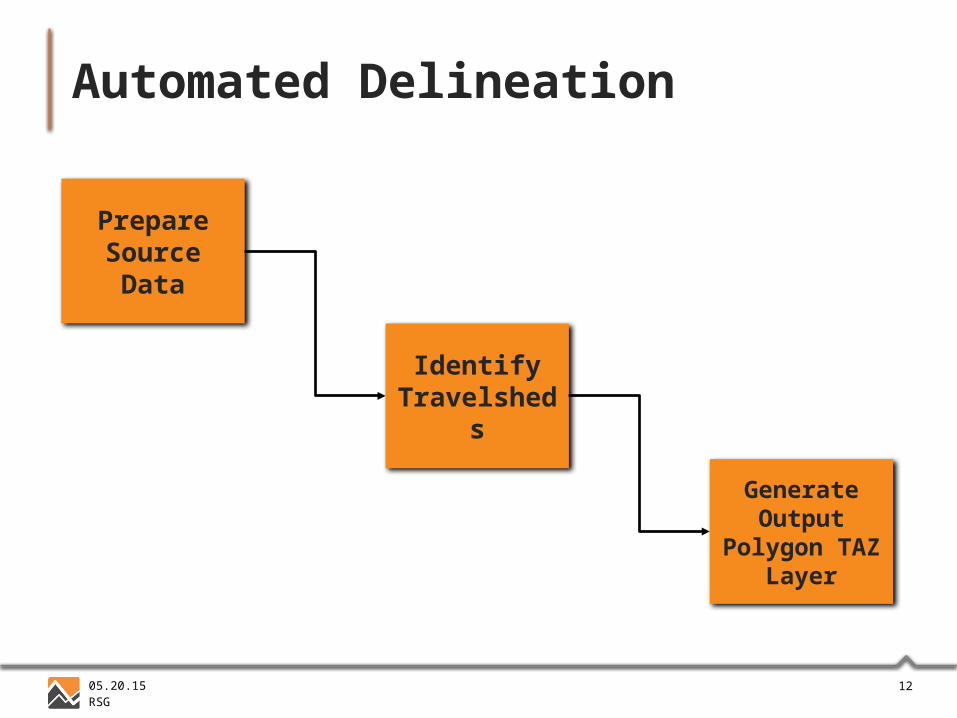
Automated Delineation
Prepare Source Data
Identify Travelsheds
Generate Output
Polygon TAZ Layer
1305.20.15RSG
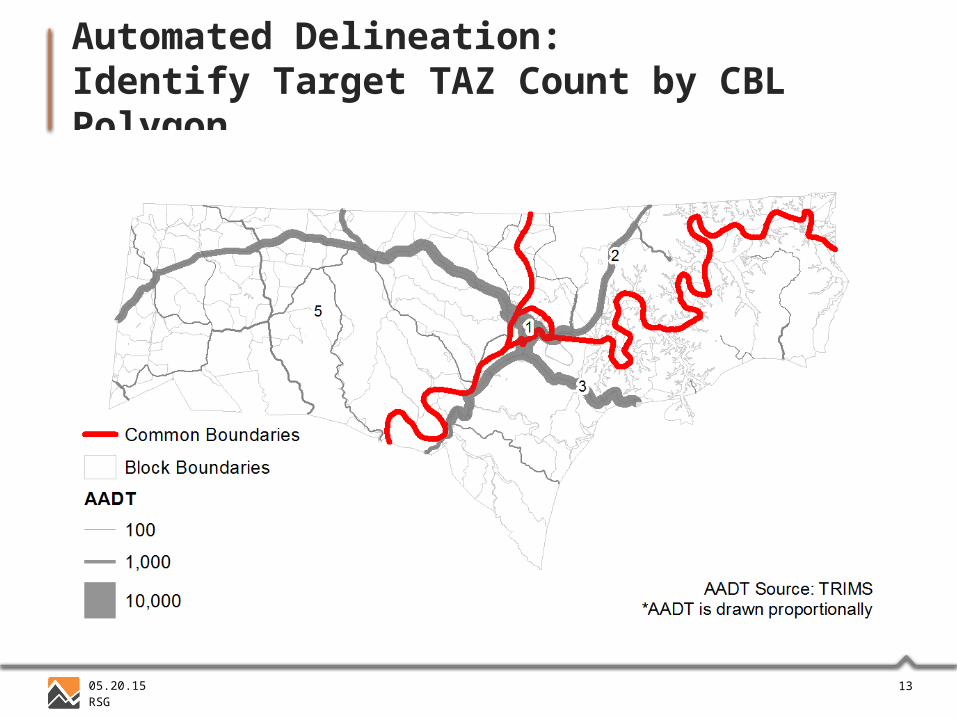
Automated Delineation: Identify Target TAZ Count by CBL Polygon

1405.20.15RSG
Automated Delineation: Identify Corridors

1505.20.15RSG
Automated Delineation: Assign Blocks to Corridors

1605.20.15RSG
Automated Delineation: Block Assignment
Where,
i = range of buffers from 500 feet to maximum distance required to tag all blocks or MPO zones
j = unique travelshed corridors (zones) desired for each common boundary polygon
For i = Buffer distance (500 foot increment to max)For j = Corridor (high AADT to low AADT)
Assign Blocks or MPO zones to Corridor
Next jNext i

1705.20.15RSG
Automated Delineation: Generate Output Polygon TAZ Layer

1805.20.15RSG
Manual Review and Revision

1905.20.15RSG
Manual Review and Revision: What was changed?

2005.20.15RSG
Manual Review and Revision: Environment

Concluding Thoughts

2205.20.15RSG
Concluding Thoughts
• The version 2 Tennessee statewide model is now in use • Using Travelshed TAZ, the model achieved great base
year validation statistics for a statewide model
Volume RangeNumber of
Count Stations
Percent Error
Correlation Coefficient
MAPE
%RMSE
Model Standard
1 5,000 7,288 10.2 0.69 66.8 91.1 101.4
5,000 10,000 1,943 5.5 0.61 31.1 39.6 56.3
10,000 20,000 1,700 0.8 0.79 21.0 27.8 51.4
20,000 30,000 747 -2.1 0.85 15.9 21.5 35.7
30,000 40,000 318 0.6 0.85 12.0 18.1 32.0
40,000 + 661 -0.1 0.94 11.5 15.6 21.6
Total 12,645 2.1 0.97 47.9 37.0 60.0

2305.20.15RSG
…and Sumit Bindra, Christine Sherman, and Kaveh Shabani for supplying the manual review and revision…
Acknowledgments
…Vince Bernardin and Brian Grady of RSG for their vision, insights, and leadership…
I’d like to thank Bob Rock and the GIS staff at TDOT who supplied key data, direction, and patience…

Questions?

www.rsginc.com
Contacts
www.rsginc.com
Contact
ERICH RENTZSENIOR ANALYST
801.456.4902
www.erichgeospatial.com