developing the networked content industry in malaysia ... · sms usage in europe, asia and us in...
TRANSCRIPT

27 June 2003
Developing the Networked Content Industry in MalaysiaDiscussion Paper
Attachments
Z HL

2A.T. Kearney/ZOHL Group/MCMC
Draft 28/06/2003 11:02
ObjectivesFigure 1 : Flow of Funds in Malaysia’s Networked Content Industry
DistributePackagePublishCreate DistributePackagePublishCreate
Private Free-to-Air TV
Subscription TV Operator
Telcos
Private Radio Operators
Advertising Production
Local Television Production
Advertising Agencies
Local Record Labels
Television Talent
Music Talent
ISP / Audio-text Providers
Interactive Developers
Government Television and Radio
Wireless \ Interactive Content Providers
Source: A.T. Kearney / ZOHL Group Analysis;
Satellite
Government
Advertiser
Subscription TV Subscribers
Internet and Audio Text Users
Wireless Data Users

3A.T. Kearney/ZOHL Group/MCMC
Draft 28/06/2003 11:02
ObjectivesFigure 2 : Networked Content Industry Objectives
Malaysia’s National Vision
Networked Content Industry Objectives
Cultural Objectives1. Consolidate racial and national unity through the
projection of national culture2. Encourage the production of content which is high quality,
innovative and creative3. Enrich and enhance the quality of material and spiritual
living in accord with social-economic development
Economic Objectives4. Make Malaysia a major centre for the national, regional
and global content industry5. Develop required capabilities to compete6. Achieve efficiency and financial viability 2
Social Objectives7. Contribute to Malaysia becoming a knowledge society8. Make access and content available everywhere and
affordable to all9. Establish a secure, robust and safe networking
environment 2
Notes: 1) Results of a government and industry survey conducted on 20 May 2003. Participants where asked to provide their personal opinion by allocating 1 through to 10 to the top 20 industry objectives.
2) For clarity sake, the survey objectives “Contribution to GDP” and “Job Creation” have been consolidated in to objective 3. Similarly, “secure and safe environment” and “ robust network environment” are consolidated in 6.
3) Objective 9 was not identified in the survey, but found important based on CMA 1998 and draft national content policySource: CMA 1998; Draft National Content Policy, A.T. Kearney/ZOHL Industry Survey 20 May, 2003
Relative Importance of Objectives 1
Gained from CMA and Draft National Content Policy 3
6.45.7
4.5
6.3
6.3
4.8
4.0
2.5
Most Importance
Least Importance
Proposed

4A.T. Kearney/ZOHL Group/MCMC
Draft 28/06/2003 11:02
Current Performance and Key IssuesFigure 3 : Local Content Popularity
Source: A.T.Kearney Analysis; OECD; Zenith Optimedia; Ovum; International Federation of the Phonographic Industry; ScreenDigest; Internet Software Consortium (ISC)
Television(Local Content in Top Ten Programs)
18
63
51 51
21 18
Malaysia S.Korea France UK Singapore Canada
Audio (Local Content % Share of Total Music revenues)
0.0
1.6
0.1 0.1 0.1 0.0
Malaysia S.Korea UK France Canada Singapore
Internet (Web pages in global Top 500 List per million capita)
0.6
2.9
1.7 1.51.3
Malaysia France Canada UK S.Korea
Moving Pictures (Number of local movies produced per million capita)
7
10 10 10
65
Malaysia France S.Korea UK Singapore Canada

5A.T. Kearney/ZOHL Group/MCMC
Draft 28/06/2003 11:02
Current Performance and Key IssuesFigure 4 : The Networked Content Industry Size relative to GDP
0.63
1.49 1.46
1.27 1.23
0.91
0
0.5
1
1.5
2
Malaysia Singapore S.Korea UK France Canada
US$0.6B US$5.6BUS$1.4B US$19.9B US$16.9B US$6.3BIndustry Value
Source: Local radio authorities;Zenith Optimedia; Ovum; IDC Note: 1) These figures represent networked content related revenue only; excludes box-office revenue, records sales,
SMS revenue and business internet subscription and usage

6A.T. Kearney/ZOHL Group/MCMC
Draft 28/06/2003 11:02
Current Performance and Key IssuesFigure 5 : Access Medium Penetration
1714
10
64
<1
Malaysia UK S.Korea Singapore Canada France
45
27
821
17
Malaysia S.Korea Canada Singapore UK France
12
5446 43
19
70
Malaysia Canada S.Korea UK Singapore France
Internet Penetration (% of households)
Broadband Penetration(% of households)
Wireless Data Penetration(% of users)
21
5743 43
26
10
Malaysia Canada Singapore UK France S.Korea
Subscription TV Penetration(% of households)
Note: 1) TV and radio penetration are not mentioned as they are close to 100% in all countriesSource: A.T.Kearney Analysis; IDC; A.T.Kearney Mobinet Survey 2003; Zenith Optimedia; Ovum

7A.T. Kearney/ZOHL Group/MCMC
Draft 28/06/2003 11:02
Current Performance and Key IssuesFigure 6 : Percentage of Networked Content Share of Total Advertisement Spend
33
49
43
4038
35
Malaysia Canada Singapore S.Korea France UK
Source: Zenith Optimedia

8A.T. Kearney/ZOHL Group/MCMC
Draft 28/06/2003 11:02
Current Performance and Key IssuesFigure 7 : Percentage of Advertising Expenditure on Malaysian Media 1998 – 2002
32 31 30 28 27
58 60 61 61 63
0
10
20
30
40
50
60
70
80
90
100
1998 1999 2000 2001 2002
Television Radio Newspapers Magazines Others
Source: ACNielsen 2002; Zenith Optimedia
9A.T. Kearney/ZOHL Group/MCMC
Draft 28/06/2003 11:02
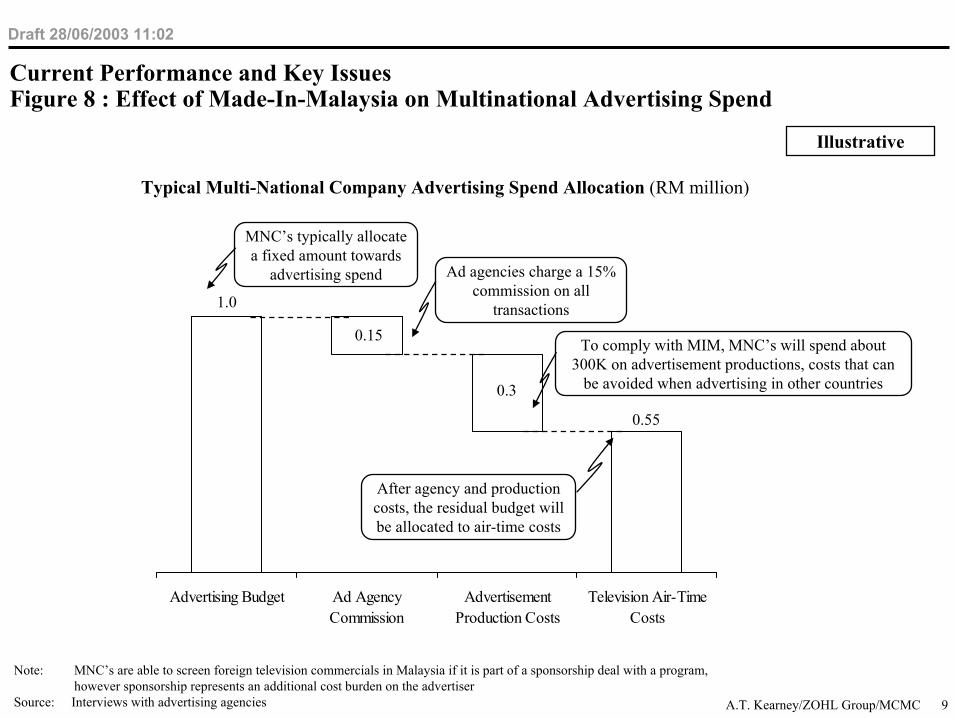
Current Performance and Key IssuesFigure 8 : Effect of Made-In-Malaysia on Multinational Advertising Spend
Typical Multi-National Company Advertising Spend Allocation (RM million)
Advertising Budget Ad AgencyCommission
AdvertisementProduction Costs
Television Air-TimeCosts
1.0
0.15
0.3
0.55
Ad agencies charge a 15% commission on all
transactions
To comply with MIM, MNC’s will spend about 300K on advertisement productions, costs that can
be avoided when advertising in other countries
MNC’s typically allocate a fixed amount towards
advertising spend
After agency and production costs, the residual budget will be allocated to air-time costs
Note: MNC’s are able to screen foreign television commercials in Malaysia if it is part of a sponsorship deal with a program, however sponsorship represents an additional cost burden on the advertiser
Source: Interviews with advertising agencies
Illustrative

10A.T. Kearney/ZOHL Group/MCMC
Draft 28/06/2003 11:02
Current State and Key IssuesFigure 9 : Revenue Redistribution to Local Content in Television
997 million
8%Subscriber TV
RevenueLocal Content
Spend
80 million
Subscriber Television Local Content Investment (RM)
76%
24%
Free-to-Air Television Local Content Investment
Foreign40% Local
60%
Source: Malaysian Broadcasters Television Alliance; Interviews with Astro
CMA Local Content Quota
Programming Costs in 2002
Local
Foreign

11A.T. Kearney/ZOHL Group/MCMC
Draft 28/06/2003 11:02
Current Performance and Key IssuesFigure 10 : Estimated Percentage of Moving Pictures and Music Revenue Lost from Piracy
Source: International Intellectual Property Alliance
1012121820
70
CanadaFrance UKSingaporeS.KoreaMalaysia
12A.T. Kearney/ZOHL Group/MCMC
Draft 28/06/2003 11:02
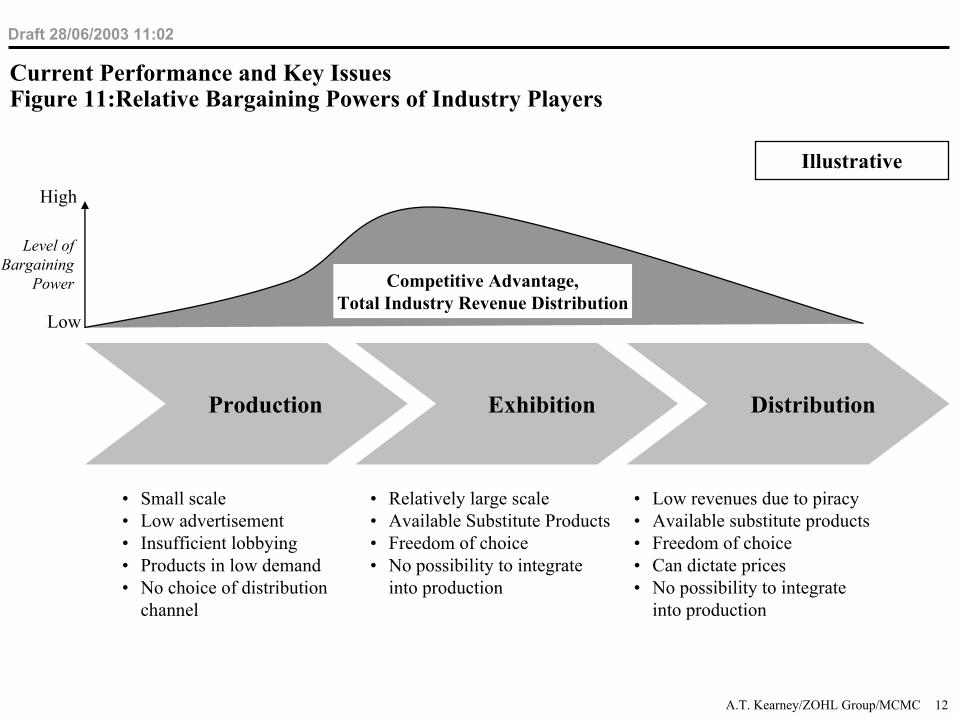
Current Performance and Key IssuesFigure 11:Relative Bargaining Powers of Industry Players
Production Exhibition Distribution
• Small scale• Low advertisement• Insufficient lobbying• Products in low demand• No choice of distribution
channel
• Relatively large scale• Available Substitute Products• Freedom of choice• No possibility to integrate
into production
• Low revenues due to piracy• Available substitute products• Freedom of choice• Can dictate prices• No possibility to integrate
into production
Competitive Advantage,Total Industry Revenue Distribution
Level of Bargaining
Power
High
Low
Illustrative

13A.T. Kearney/ZOHL Group/MCMC
Draft 28/06/2003 11:02
Current Performance and Key IssuesFigure 12 : Overlapping Regulation
Note: 1) List only includes primary regulations, however there are also site specific local permits required by local authorities
Pesticide ActTelemedicine Act 1997
University and University Colleges Act 1971
Medicine ActNational Anthem Act
Sale of Food and Drugs Act
Securities Industry Act 1983
Banking and Financial Institutions Act
Trade Description Act 1972
Communication and Multimedia Act
FINAS Act 1963 Cinema
TV
Radio
Internet
Advertising Guidelines
Broadcasting Guidelines
Emerging DistributeDistributePackagePublishCreate
Penal Code
Internal Security Act
Indecent Advertisement Act
Digital Signatures Act 1997
Sedition Act 1948
Consum
er Protection Act 2000
Defam
ation Act 1952
Trade Marks A
ct 1976C
opyright Act 1987
Geneva C
onvention, Berne C
onvention, other treatise
Made in Malaysia Guideline
Film (Censorship) Act 1952
Wireless
Film &TV
Radio & RM
P&M, B&L, IS
Various C
ontent Specific Acts
Pay TV
Acts governing content during and after “consumption”Input
Industries
Acts governing entire industry
Foreign Direct Investment Guideline
Federal Constitution
Networked Content Value Chain
Output Industries
Com
puter C
rimes A
ct
Printing Presses & Publications Act
Sale of Goods Act

14A.T. Kearney/ZOHL Group/MCMC
Draft 28/06/2003 11:02
Current Performance and Key IssuesFigure 13 : Government Bodies Involved in Regulating and Enforcing Networked Content Industry
Advisory
JAKIM(Advisory)
Domestic Trade
Consumer Affairs
FinanceEducationHealthAgricultureEnergy, Com. and Multim.
InformationHome AffairsMinistry
Intellectual Property & Consumer
Affairs Division
Administration
Division
Private Education Division
Food Quality Control
Division & Pharmac. Division
Pesticide Control Division
MCMCCommercial Department FINAS
LembagaPenapisan
Filem(LPF)
Governing Body
Monitoring of false
advertising
Monitoring of copyright and
piracy
Approving of all gaming adsas defined in
Common Gaming Act,
1953
Approving of all private
education ads
Approving of all poison &
medicine related ads
Approving of all pesticide
ads
Approval for advertising on
RTM (KP# Issuance)
Licensing of all TV adds
(MIM)Censoring of
all addsAdvertising
EnforcementLicensing of
film developers
and producers
Censoring of all audiovisual / promotional
contentContent
Licensing of wireless, ISP, TV and radio
Licensing of film
distributors and exhibitors
Access
Note: Content forum will be the body responsible for administering the content code once it is ratified

15A.T. Kearney/ZOHL Group/MCMC
Draft 28/06/2003 11:02
Current Performance and Key IssuesFigure 14 : Relative Broadband Subscription Fees (2003, US$ income adjusted)
Source: A.T. Kearney; Analysys
$0 $10 $20 $30 $40 $50 $60 $70 $80
Malaysia
South Korea
UK
France
Canada
Singapore

16A.T. Kearney/ZOHL Group/MCMC
Draft 28/06/2003 11:02
SMS Usage in Europe, Asia and US in 2002
29% 38%
81%
81%62%
19%
Europe Asia US
Never used SMS Used SMS
• US telecoms regulations, which permitteddifferent mobile operators to choose different, incompatible technologies has led to complexities in formulating interconnect agreements for data
• In late 2002, the largest US mobile operators agreed to pass text messages between their networks, however the agreement is still only partly implemented.
• Since interconnect agreements were formalised in September 2001, Malaysia has experienced a surge in SMS traffic
• In 2002, Malaysian telcos made preliminary agreements to share ‘shortcodes’ that allow users to access wireless data services from different providers on a single number
• Interconnect agreements are still outstanding in areas such as WiFi, MMS and 3G –which could pose a threat to the uptake of these new services
Mobile Data Service Interconnect ChallengesLow penetration of SMS usage
Current Performance and Key IssuesFigure 15 : Potential Adverse Impact of Ineffective Open Standards and Interconnectivity
Source: A.T.. Kearney Mobinet Survey

17A.T. Kearney/ZOHL Group/MCMC
Draft 28/06/2003 11:02
Current Performance and Key IssuesFigure 16 : Ineffective Government Incentive Schemes
• In early 2000 the “One Family, One Computer” scheme enabledcontributors to the EPF to withdraw part of their savings forpersonal computer purchases, but was cancelled in 2002
Source: IDC
3446
606468
13
FranceUKCanadaSingaporeS.KoreaMalaysia
PC Penetration Rate(% of households)
• Despite an investment of RM 5.1 billion over 5 years in ICT initiatives, Malaysia’s internet subscription rate still lags benchmark countries
12
5446 43
19
70
Malaysia Canada S.Korea UK Singapore France
Internet Subscription (% of households)

18A.T. Kearney/ZOHL Group/MCMC
Draft 28/06/2003 11:02
Create Publish Package Distribute Total
1,967 million
Subscription TV (66%)
Free-to-Air TV (34%)
170 million
1,257 million
398 million
143 million
Satellite (53%)Terrestrial (47%)
Free-to-Air Programming (66%)
Advertising Production (19%)Subscription Programming (15%)
1
TelevisionFigure T.1 : Malaysian Television Industry Size in 2002 (RM)
Note: 1) ‘Create’ represents the talent pool required for television production and is typically 25% of production costsSource: Zenith 2002; ACNielsen; A.T. Kearney / ZOHL Group Analysis

19A.T. Kearney/ZOHL Group/MCMC
Draft 28/06/2003 11:02
TelevisionFigure T.2 : Relative Networked Content Industry Size (Revenue % of Total NCI Revenue)
0%
25%
50%
75%
100%
Malaysia UK France Canada S.Korea Singapore
WirelessInternetRadioTelevision
Source: Zenith 2002; ACNielsen; A.T. Kearney / ZOHL Group Analysis

20A.T. Kearney/ZOHL Group/MCMC
Draft 28/06/2003 11:02
TelevisionFigure T.3 : Estimated Revenue Growth for Total Television Industry in Malaysia 1997 -2002
643 663770
1179
1493
1808
0
200
400
600
800
1,000
1,200
1,400
1,600
1,800
2,000
1997 1998 1999 2000 2001 2002
RTM AdEx RTM Government Funding
TV3 & NTV7 AdEx Astro AdEx & Fees
Rev
enue
(RM
mill
ions
)CAGR (%)
97 - 02
Source: Zenith 2002; ACNielsen; A.T. Kearney / ZOHL Group Analysis
26% - Total
15% TV3 & NTV7
66% - Astro
10% - RTMGrowth due to launch
of NTV7 in 1998 –however 0% CAGR
over 2000-2002
4% - Total FTA

21A.T. Kearney/ZOHL Group/MCMC
Draft 28/06/2003 11:02
TelevisionFigure T.4 : Television Penetration of Households in 2002
Total Households Free-to-Air TV Households
5.3 million(100%)
4.3 million(82%)
Source: MCMC Statistical Bulletins (2002); ITU Note: TV Households Figures assume 2% growth from 2001 ITU estimates
59%
31%
10%
Indian
Chinese
10%
63%
27%
Malay

22A.T. Kearney/ZOHL Group/MCMC
Draft 28/06/2003 11:02
TelevisionFigure T.5 : Subscription Television Penetration (% of households)
21
57
43 43
26
10
Malaysia Canada Singapore UK France S.Korea
Source: Zenith Optimedia

23A.T. Kearney/ZOHL Group/MCMC
Draft 28/06/2003 11:02
TelevisionFigure T.6 : Television Industry Size (Revenue % of GDP)
Source: Zenith Optimedia; IDC Note: 1) These figures represent networked content related revenue only; excludes television content creation
0.52 0.50 0.450.59
0.870.95
UK France S.Korea Singapore Canada Malaysia
An addition 0.05% of GDP is an increase of 11% or RM 175 million
An addition 0.23% of GDP is an increase of 53% or RM 830 millionAverage of benchmark countries
RM
1.575 m
illion

24A.T. Kearney/ZOHL Group/MCMC
Draft 28/06/2003 11:02
TelevisionFigure T.7 : Number of Local Programs in the Top Ten Television Programs
Source: A.T.Kearney Analysis
7
10 10 10
65
Malaysia France S.Korea UK Singapore Canada

25A.T. Kearney/ZOHL Group/MCMC
Draft 28/06/2003 11:02
TelevisionFigure T.8 : Free-to-Air Television Advertising (RM millions)
0
100
200
300
400
500
600
1997 1998 1999 2000 2001 2002
Source: ACNielsen 2002
CAGR (%)
1%
-2%
Nominal
Real
26A.T. Kearney/ZOHL Group/MCMC
Draft 28/06/2003 11:02
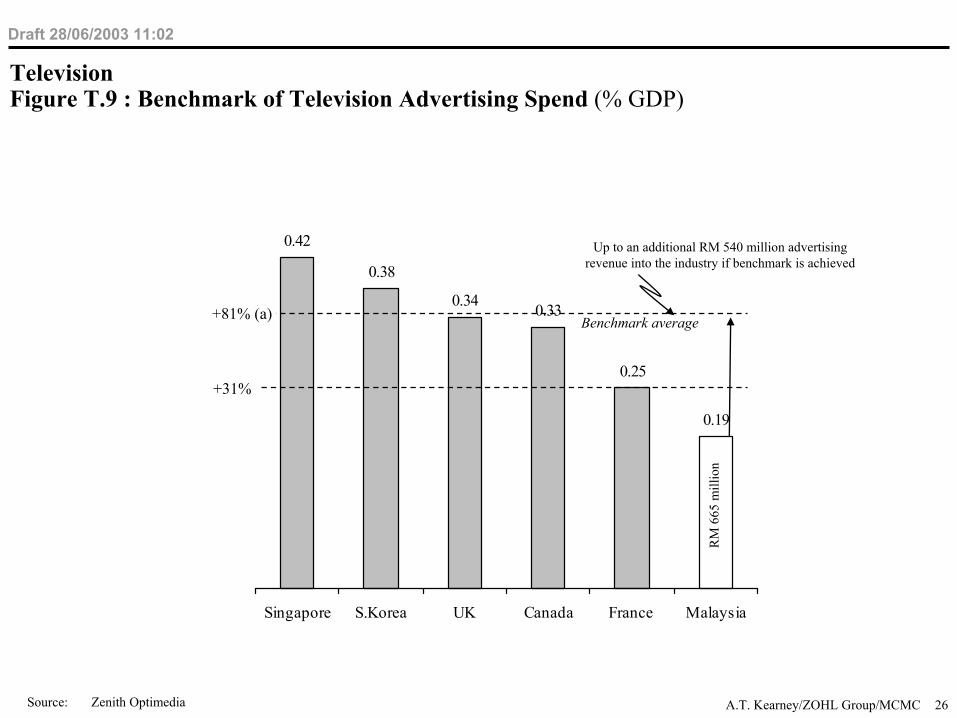
TelevisionFigure T.9 : Benchmark of Television Advertising Spend (% GDP)
0.42
0.38
0.34 0.33
0.25
0.19
Singapore S.Korea UK Canada France Malaysia
+31%
RM
665
mill
ion
Up to an additional RM 540 million advertising revenue into the industry if benchmark is achieved
+81% (a) Benchmark average
Source: Zenith Optimedia
27A.T. Kearney/ZOHL Group/MCMC
Draft 28/06/2003 11:02
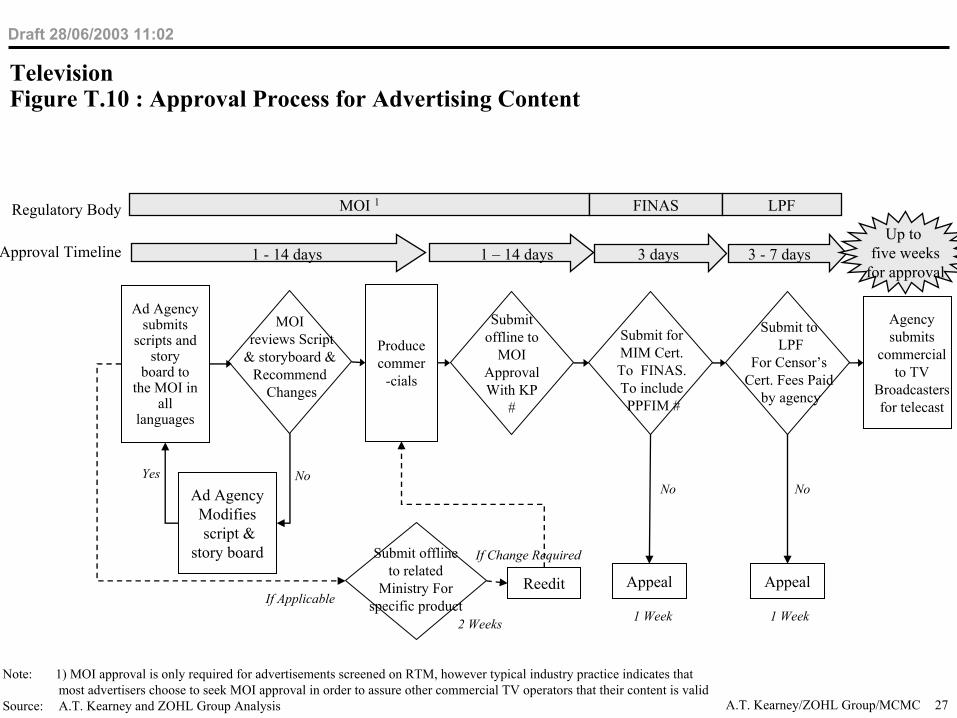
TelevisionFigure T.10 : Approval Process for Advertising Content
1 – 14 days 3 days 3 - 7 days1 - 14 days
Yes
MOIreviews Script
& storyboard & Recommend
Changes
Submit for MIM Cert. To FINAS. To includePPFIM #
Submit toLPF
For Censor’s Cert. Fees Paid
by agency
Produce commer
-cials
Agency submits
commercial to TV
Broadcasters for telecast
Submit offline to
MOI ApprovalWith KP
#
Ad Agency Modifiesscript &
story board
AppealAppealReedit
No
1 Week 1 Week2 Weeks
Submit offline to related
Ministry For specific product
If Change Required
No No
MOI 1 FINAS LPF
Up to five weeks
for approval
Regulatory Body
Ad Agency submits
scripts and story
board to the MOI in
all languages
Approval Timeline
If Applicable
Note: 1) MOI approval is only required for advertisements screened on RTM, however typical industry practice indicates that most advertisers choose to seek MOI approval in order to assure other commercial TV operators that their content is valid
Source: A.T. Kearney and ZOHL Group Analysis
28A.T. Kearney/ZOHL Group/MCMC
Draft 28/06/2003 11:02
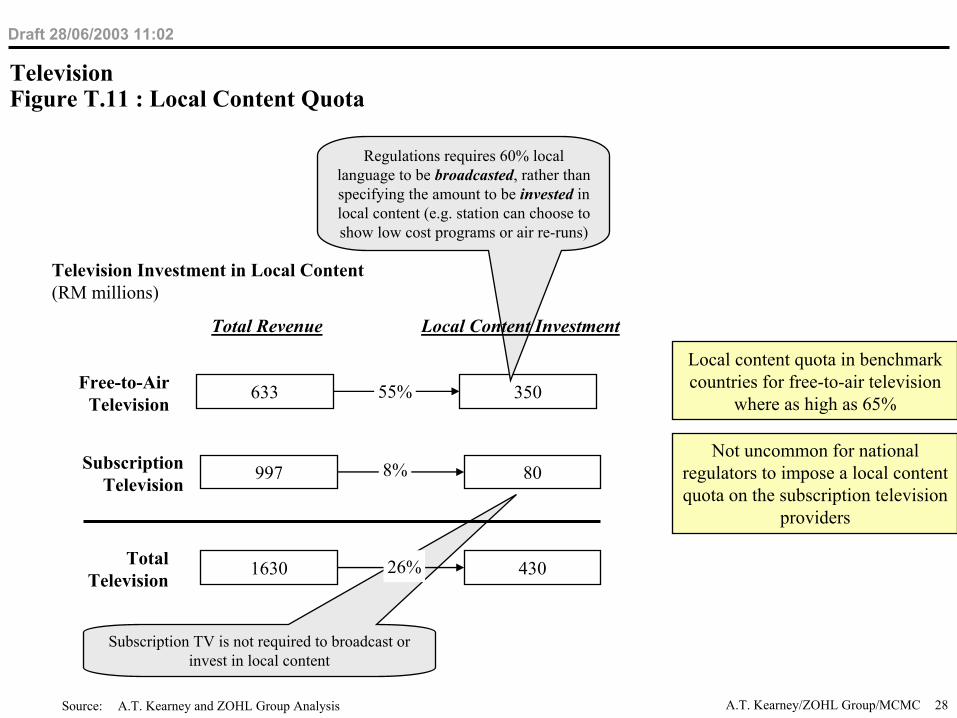
TelevisionFigure T.11 : Local Content Quota
Television Investment in Local Content(RM millions)
Subscription TV is not required to broadcast or invest in local content
Free-to-Air Television
633 350
997 80
1630 430
Subscription Television
Total Television
Total Revenue
55%
8%
26%
Regulations requires 60% local language to be broadcasted, rather than specifying the amount to be invested in local content (e.g. station can choose to show low cost programs or air re-runs)
Local Content Investment
Source: A.T. Kearney and ZOHL Group Analysis
Local content quota in benchmark countries for free-to-air television
where as high as 65%
Not uncommon for national regulators to impose a local content quota on the subscription television
providers

29A.T. Kearney/ZOHL Group/MCMC
Draft 28/06/2003 11:02
TelevisionFigure T.12 : Index of Free-to-Air Television Operators Local Content Spend (estimated)
10054
131
72
181
99
Total Free-to-AirTelevision Revenue
Current Local ContentSpend
Potential Free-to-AirTelevision Revenue
Potential Local ContentSpend
RM 350 million
Annual spend in local content could increase to RM 470 million
Annual spend on local content could increase to RM 700 million
Current Potential
Growth to Average International Benchmark
Growth to Nearest Benchmark
Source: A.T. Kearney / ZOHL Group Estimates

30A.T. Kearney/ZOHL Group/MCMC
Draft 28/06/2003 11:02
Moving PicturesFigure M.1 : Total and Local Content Box Office Revenue (RM million)
88
69
110
140
18.4
6.5
18.38.6
1999 2000 2001 2002
TotalLocal Content
Source: Zenith Optimedia; FINAS

31A.T. Kearney/ZOHL Group/MCMC
Draft 28/06/2003 11:02
Moving PicturesFigure M.2 : Index of International and Malaysian Sources of Revenue for Movie Producers
0
25
50
75
100
International Malaysia
BoxOffice
TV
Video
Pric
e Pr
essu
re o
nV
ideo
Roy
altie
s
26
28
46
82
144
Potential130%
revenueincrease
Source: A.T. Kearney / ZOHL Group Estimates

32A.T. Kearney/ZOHL Group/MCMC
Draft 28/06/2003 11:02
Moving PicturesFigure M.3 : Box Office Revenues and Local Producers Market Share in Malaysia (RM million)
185.0
122
4.3
3.4
5.3
Box Office Revenues Local Production Houses
Others
Metrowealth
Tayangan
Skop
ForeignContent
LocalContent
Source: FINAS; ZOHL Group Analysis

33A.T. Kearney/ZOHL Group/MCMC
Draft 28/06/2003 11:02
Moving PicturesFigure M.4 : Cinema Admission Prices (US$ income adjusted)
4.44.75.5
6.1
9.7
5.2
CanadaSingaporeFranceUKS.KoreaMalaysia
Source: Zenith Optimedia; Cannes.Market; Screen Digest

34A.T. Kearney/ZOHL Group/MCMC
Draft 28/06/2003 11:02
Moving PicturesFigure M.5 : Annual Admissions Per Capita
1.9
2.6
3.143.3
3.93
0.5
S.KoreaUKFranceSingaporeCanadaMalaysia
Source: Cannes Market; Screen Digest

35A.T. Kearney/ZOHL Group/MCMC
Draft 28/06/2003 11:02
Moving PicturesFigure M.6 : Current Industry Size per Capita (US$ income adjusted)
3
14
1617
1819
Malaysia S.Korea Singapore France UK Canada
Needto increase 4-5times to reach
next benchmarklevel
Source: Cannes Market

36A.T. Kearney/ZOHL Group/MCMC
Draft 28/06/2003 11:02
Moving PicturesFigure M.7 : Approval Process for Film Content
Submit to LPF for Censor’s
Certificate
Producers submit for
FC approval toshoot from
FINAS
Producer obtain
productionLicense from
FINAS (onetime only)
Producer start the production
& submit completed
product to LPF
Film producer request for
Compulsory Screening Dates
from FINAS
Film is screened on the
designated dates allocated by
FINAS
Appeal Edit and resubmit
30 days30 days
FINAS LPF FINAS
Up to Two monthsfor approval
Regulatory Body
Approval Timeline
Inconsistent content regulation increases the risk upfront of investing in content that will
not be screened
Content that is approved by LPF can still be censored or banned when the content is
broadcast on television
Content that is approved must comply with a simplistic ratings systems that categorises content
as general viewing or 18+
Source: A.T. Kearney and ZOHL Group Analysis

37A.T. Kearney/ZOHL Group/MCMC
Draft 28/06/2003 11:02
Audio/RadioFigure A.1 : Malaysian Radio Industry Size in 2002 (RM)
Note: Networked content for audio only includes content broadcast on radio networksSource: Zenith 2002; ACNielsen; A.T. Kearney / ZOHL Group Analysis
221 million23 million
197 million
0.8 million0.2 million
Royalties to local artists
Royalties to record labels
Radio advertising / government funding
Terrestrial broadcasting
Create Publish Package Distribute Total

38A.T. Kearney/ZOHL Group/MCMC
Draft 28/06/2003 11:02
Audio/RadioFigure A.2 : Radio Industry Advertising Revenue Growth 1997 - 2002
Source: ACNielsen 2002; Zenith Media
Adv
ertis
ing
Rev
enue
(RM
mill
ions
)
0
20
40
60
80
100
120
140
160
1997 1998 1999 2000 2001 2002
19%
CAGR97-02

39A.T. Kearney/ZOHL Group/MCMC
Draft 28/06/2003 11:02
Audio/RadioFigure A.3 : Radio Industry Market shares and Advertising Premiums 2002
0
50
100
150
200
250
0 5 10 15 20 25 30
Ave
rage
Rat
e pe
r A
dver
tisem
ent
Total Advertising Revenue (RM millions)
Era FMMy FM
redi 988
Mix FMhitz.fm
THR
Light & Easy
RM Saluran Muzik
red 104.9RM Saluran 5
RM Saluran 6
RM Saluran 4
RM Saluran 1
RM Kuala Lumpur
RM Selangor
Era FM18%
hitz.fm12%
Light & Easy6%
Mix FM13%
My FM15%
red 104.92%
redi 99814%
RM Saluran8%
THR9%
Other3%
AMP Rediffusion RM THR
Source: ACNielsen 2002 Note: RM Saluran includes 7 radio station: RM Saluran 1, 4, 5, 6, Selangor, Kuala Lumpur
AMP
Radio Station Market share in 2002 Radio Station Advertising Premiums in 2002

40A.T. Kearney/ZOHL Group/MCMC
Draft 28/06/2003 11:02
Audio/RadioFigure A.4 : Radio Penetration Rates in Malaysia 2002
Population Living in Households /+15 Years Age
Radio Coverage
11.4 million(100%)
10.3 million(90%)
Source: ACNielsen 2002; Malaysian Department of Statistics
Indian Chinese Malay
Total Households Radio Households
5.3 million(100%)
4.2 million(79%)
63%
27%
10%
11%
31%
58%
Radio Penetration of Households in 2002 Radio Coverage of Consumers in 2002

41A.T. Kearney/ZOHL Group/MCMC
Draft 28/06/2003 11:02
Audio/RadioFigure A.5 : Malaysian Local Content as Percentage of Total Music Industry 1998 – 2002
24
1516 16
18
0
5
10
15
20
25
30
1998 1999 2000 2001 2002
Loc
al c
onte
nt m
arke
t sha
re (%
)
Source: International Federation of the Phonetic Industry
42A.T. Kearney/ZOHL Group/MCMC
Draft 28/06/2003 11:02
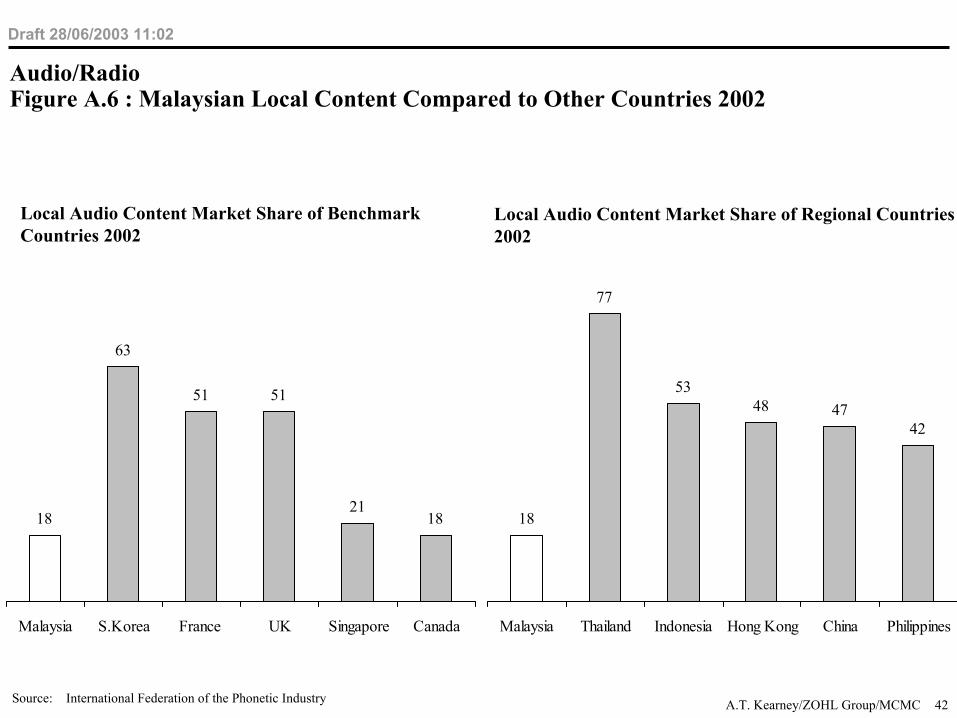
Audio/RadioFigure A.6 : Malaysian Local Content Compared to Other Countries 2002
Source: International Federation of the Phonetic Industry
18
63
51 51
2118
Malaysia S.Korea France UK Singapore Canada
18
77
5348 47
42
Malaysia Thailand Indonesia Hong Kong China Philippines
Local Audio Content Market Share of Benchmark Countries 2002
Local Audio Content Market Share of Regional Countries 2002

43A.T. Kearney/ZOHL Group/MCMC
Draft 28/06/2003 11:02
InteractiveFigure I.1 : Malaysian Interactive Industry Size in 2002 (RM)
Source: Gartner; A.T. Kearney estimates
541 million67 million
450 million
21 million3 million
ISP access revenue
ISP PSTN Charges (90%)
Audio-text (10%)
Audio-text (55%)Internet Content (45%)
Create Publish Package Distribute Total

44A.T. Kearney/ZOHL Group/MCMC
Draft 28/06/2003 11:02
InteractiveFigure I.2 : Internet Penetration (% of households)
12
54
4643
19
70
Malaysia Canada S.Korea UK Singapore France
Source: IDC;

45A.T. Kearney/ZOHL Group/MCMC
Draft 28/06/2003 11:02
InteractiveFigure I.3 : Affordability and Accessibility of Broadband in Malaysia
Malaysia has the highest average ADSL monthly subscription fees (2003, US$, income adjusted)
0
10
20
30
40
50
1999 2000 2001 2002 2003 2004 2005
Malaysia is behind in broadband roll-out(% of homes connected)
S. Korea
Australia
Malaysia
Canada
Source: IDC; A.T. Kearney; Analysys$0 $10 $20 $30 $40 $50 $60 $70 $80
Malaysia
South Korea
UK
France
Canada
Singapore

46A.T. Kearney/ZOHL Group/MCMC
Draft 28/06/2003 11:02
InteractiveFigure I.4 : Cost of a basic PC (US$, PPP adjusted)
1,583
1,452
1,204 1,185
990
694
Malaysia France UK Canada S.Korea Singapore
Note: 1) Based on price comparison for Dell 4600

47A.T. Kearney/ZOHL Group/MCMC
Draft 28/06/2003 11:02
InteractiveFigure I.5 : PC Penetration Rate (% of households)
34
46
6064
68
13
FranceUKCanadaSingaporeS.KoreaMalaysia
Source: ACNielsen

48A.T. Kearney/ZOHL Group/MCMC
Draft 28/06/2003 11:02
InteractiveFigure I.6 : Internet Broadband Subscribers 2002 Q3 – 2003 Q1
1%
1%
3%
0
5,000
10,000
15,000
20,000
25,000
30,000
35,000
40,000
45,000
50,000
2002 Q3 2002 Q4 2003 Q1
Penetration rates of households
Source: MCMC Statistical Bulletins (2002)
Subs
crib
ers

49A.T. Kearney/ZOHL Group/MCMC
Draft 28/06/2003 11:02
InteractiveFigure I.7 : Internet Access Market Shares in 2002
Observations
• 98% of the PSTN usage is billed per minute and provided by Telekom Malaysia
• Celcom Net is now owned by Telekom Malaysia
Malaysian Internet Access Market Shares 2002
TM Net55.2%Jaring
26.3%
Time Net15.6%
Other0.9%
Celcom Net2.0%
Source: MCMC Statistical Bulletins (2002)
50A.T. Kearney/ZOHL Group/MCMC
Draft 28/06/2003 11:02
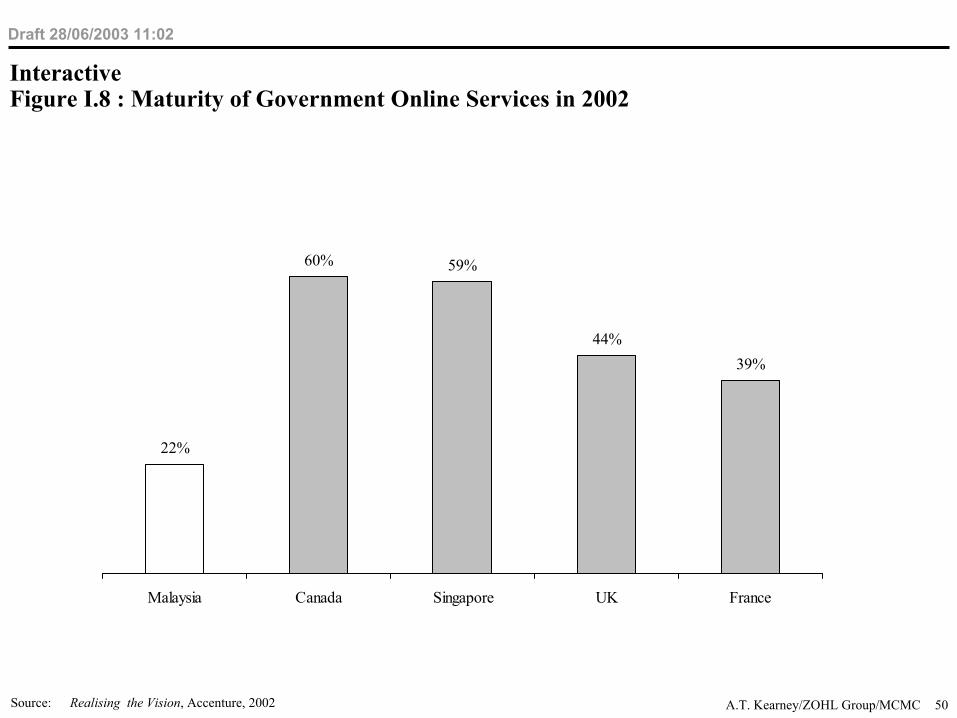
InteractiveFigure I.8 : Maturity of Government Online Services in 2002
22%
60% 59%
44%39%
Malaysia Canada Singapore UK France
Source: Realising the Vision, Accenture, 2002

51A.T. Kearney/ZOHL Group/MCMC
Draft 28/06/2003 11:02
WirelessFigure W.1 : Cellular Subscriber Growth in Malaysia 1997 – 2008
0
2,000
4,000
6,000
8,000
10,000
12,000
14,000
1997 1998 1999 2000 2001 2002 2003 2004 2005 2006 2007 2008
Cel
lula
r Ph
one
Subs
crib
ers (
Tho
usan
ds)
Forecast
Source: MCMC Statistical Bulletins (2002); A.T. Kearney Analysis

52A.T. Kearney/ZOHL Group/MCMC
Draft 28/06/2003 11:02
WirelessFigure W.2 : Revenue of the overall wireless industry (US$ billion)
0
1
2
3
4
2001 2002 2003 2004 2005 2006
Source: Ovum

53A.T. Kearney/ZOHL Group/MCMC
Draft 28/06/2003 11:02
WirelessFigure W.3 : Malaysian Wireless Services Industry Size in 2002 (RM)
Content Access Total
50 million
Wireless content providers such as audio-text providers
40 million
10 million
Mainly premium SMS services
Source: Industry interviews

54A.T. Kearney/ZOHL Group/MCMC
Draft 28/06/2003 11:02
WirelessFigure W.4 : Usage of wireless data services around the world (% of users who have used the service)
11
28
310
77
27
38
53
21
6 4
Malaysia Europe North America Japan
EmailNewsTravelBanking
Still in a testing state
Source: A.T. Kearney Mobinet Survey